
Transient crater growth in granular targets: An ... craters (e.g., Brent, Barringer)(see e.g.,...
23
Instructions for use Title Transient crater growth in granular targets : An experimental study of low velocity impacts into glass sphere targets Author(s) Yamamoto, Satoru; Wada, Koji; Okabe, Norihisa; Matsui, Takafumi Citation Icarus, 183(1): 215-224 Issue Date 2006-07 Doc URL http://hdl.handle.net/2115/14549 Type article (author version) Additional Information There are other files related to this item in HUSCAP. Check the above URL. File Information SYamamotoEtal.pdf Hokkaido University Collection of Scholarly and Academic Papers : HUSCAP
Transcript of Transient crater growth in granular targets: An ... craters (e.g., Brent, Barringer)(see e.g.,...
Instructions for use
Title Transient crater growth in granular targets : An experimental study of low velocity impacts into glass sphere targets
Author(s) Yamamoto, Satoru; Wada, Koji; Okabe, Norihisa; Matsui, Takafumi
Citation Icarus, 183(1): 215-224
Issue Date 2006-07
Doc URL http://hdl.handle.net/2115/14549
Type article (author version)
Additional Information There are other files related to this item in HUSCAP. Check the above URL.
File Information SYamamotoEtal.pdf
Hokkaido University Collection of Scholarly and Academic Papers : HUSCAP
Transient crater growth in granular targets: An experimental study of
low velocity impacts into glass sphere targets
1Satoru Yamamoto, 2Koji Wada, 1Norihisa Okabe, 1Takafumi Matsui1Graduate School of Frontier Sciences, University of Tokyo, Chiba 277-8562, Japan
2Institute of Low Temperature Science, Hokkaido University, Sapporo 060-0819, JapanTel: +81-4-7136-3954 Fax: +81-4-7136-3954 E-mail: [email protected]
Submitted to Icarus, June 2, 2005; Revised, January, 3, 2006
Number of manuscript: 17 pagesNumber of figures: 10Number of Tables: 4
1
proposed running head: Transient crater growth
Send editorial communications to:Satoru YamamotoMailbox 408Graduate School of Frontier SciencesUniversity of TokyoKashiwanoha, KashiwaChiba, 277-8562, JapanE-mail: [email protected]:+81-4-7136-3954
2
Abstract
We experimentally studied the formation and collapse processes of transient craters. Polycar-bonate projectiles with mass of 0.49 g were impacted into the soda–lime glass sphere target (meandiameters of glass spheres are ∼ 36, 72, and 220µm, respectively) using a single–stage light–gasgun. Impact velocity ranged from 11 to 329 m s−1. We found that the transient crater collapseseven at laboratory scales. The shape (diameter and depth) of the transient crater differs from thatof the final crater. The depth–rim diameter ratios of the final and transient craters are 0.11–0.14and 0.26–0.27, respectively. The rim diameter of both the transient and final crater depends ontarget material properties; however, the ratio of final to transient crater diameter does not. Thissuggests that target material properties affect the formation process of transient craters even inthe gravity regime, and must be taken into account when scaling experimental results to planetaryscales. By observing impacts into glass sphere targets, we show that although the early stage ofthe excavation flow does not depend on the target material properties, the radial expansion of thecavity after the end of vertical expansion does. This suggests that the effect of target materialproperties is specifically important in the later part of the crater excavation and collapse.
Key words: (1) CRATERING (2) IMPACT PROCESSES (3) COLLISIONAL PHYSICS
1 Introduction
The growth of impact craters larger than a certain size, or formed in a target with negligiblecohesive strength, is controlled by gravity. This is the case for impact craters on the Earth, andimpacts into regolith layers on planets and satellites. Such craters are said to form in the gravityregime. The impact excavates a bowl–shaped cavity, termed the transient crater (see Fig. 1), whichis subsequently modified by collapse of the transient crater rim and, in very large impact events,uplift of the crater floor. The results of rim collapse are evident at 1–4 km–diameter terrestrialimpact craters (e.g., Brent, Barringer)(see e.g., Grieve et al., 1977; Melosh, 1989; Melosh andIvanov, 1999), where lenses of rock debris, presumably from the transient crater walls, have pooledat the base of the transient crater. In this case, the rim diameter of the final crater (we call thisthe final rim diameter, Dfi, hereafter) may be given by the sum of the rim diameter of the transientcrater (we call this the transient rim diameter, Dtr, hereafter) and the change in diameter ∆Dc
due to collapse (that is, Dfi = Dtr + ∆Dc).Many impact experiments into granular targets have been conducted to study transient cavity
growth (and collapse) in the gravity regime, and how crater size scales with various impact parame-ters, for example velocity, impactor size, or gravity (e.g., Stoffler et al., 1975; Gault and Wedekind,1977; Schmidt, 1980; Schmidt and Holsapple, 1982; Schmidt and Housen, 1987; Mizutani et al.,1983; Hartmann, 1985; Cintala et al., 1999; Walsh et al., 2003; Cintala et al., 2003). However,based on these previous experiments it is unclear whether or not transient crater collapse occurs atlaboratory scales and, consequently, whether or not the crater radii reported in these studies areDtr or Dfi. There are two possibilities on this issue: First, collapse may have occurred in these pre-vious experiments, but the degrees of collapse were not large enough to be noticed (for example, inthe quarter–space experiment by Schmidt and Housen (1987), the shape of the transient crater wasshown to change owing to the collapse, but the change in crater diameter due to the collapse wasnegligible). Second, the cohesion among target particles in granular targets may be large enoughto prevent collapse at laboratory scales. Therefore, the first goal of this study is to assess whetheror not any collapse occurs and how extensive the collapse is.
Another goal of our study is to investigate whether or not target material properties affect thesize of the transient and/or final crater. Pi-group scaling has been used as a scaling relation forimpact crater sizes (e.g., Holsapple, 1993). In this analysis, two dimensionless parameters are used:ΠR[=(ρ/m)1/3Dfi/2] (called the scaled–crater radius) and Π2(= 3.22ga/v2
i ) (called the gravity–scaled size), where ρ is the bulk density of target, m is the projectile’s mass, g is the gravitationalacceleration, a is the projectile’s radius, and vi is the impact velocity. Physically, ΠR is roughlyequal to the ratio of crater to projectile radius and Π2 is essentially the inverse of the Froudenumber. In Fig. 2 experimental data on the final crater diameter Dfi are plotted on a ΠR–Π2
diagram. As shown in Fig. 2, the experimental data do not constitute a single line but constituteseveral discrete linear arrays (see also Fig. 7.3 in Melosh, 1989). This suggests that Dfi valuesdepend on target material properties. Although internal friction and porosity in target materials
3
have been proposed to affect the crater formation (e.g., Schmidt, 1980; Melosh, 1989; Housen andHolsapple, 2003), how the target material properties affect crater formation is unknown. In otherwords, whether Dtr, ∆Dc or both are affected by target material properties. In order to studythe physical plausibility of these possibilities, we observe the formation and collapse processes oftransient craters for various target material properties.
2 Observation of excavation and collapse stages of transientcrater
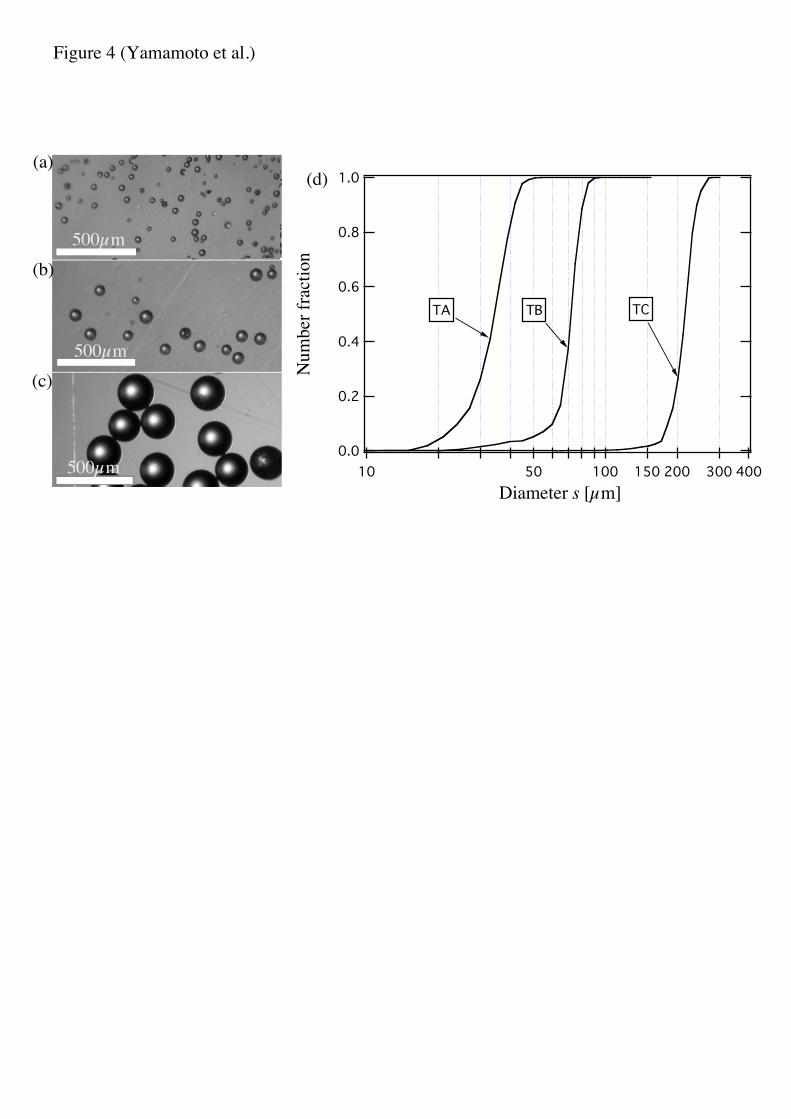
A schematic view of our experimental setup is shown in Fig. 3. We used a polycarbonate cylinderwith a hemispherical front as a projectile (10 mm diameter × 8 mm length, mass of 0.49 g, anddensity of 1.2 g cm−3). The projectile was accelerated by a single–stage light–gas gun. The impactvelocities vi ranged from 11 to 329 m s−1. The impact angle was vertical to the target surface. Weused soda–lime glass spheres as targets (mean diameters sav are 36, 72, and 220µm, respectively;these are referred as TA, TB, and TC targets hereafter). Figs. 4a–c show images of the glassspheres taken using a transmission microscope and Fig. 4d shows the number–fractions of glassspheres with diameters smaller than s. The bulk density, the porosity, the angle of repose, and thebulk sound speed for these targets depend on sav (see Table 1) . The glass spheres, which filled astainless container (28 cm diameter and 11 cm depth), were placed in the experimental chamber.(In order to investigate the effect of the container boundary on the crater growth, we did impactexperiments with a larger stainless container (40 cm diameter and 15 cm depth). There was nosignificant difference between the crater diameters in the two containers for vi < 329 m s−1.) All theexperiments were conducted at pressures lower than 50 Pa. In order to prevent the propellant gas(Helium) from perturbing the cratering process, a deflector plate (with a hole 18 mm in diameterfor the passage of projectiles) was set at a projectile inlet of the experimental chamber as shownin Fig. 3. The experimental condition and results are summarized in Tables 2, 3, and 4.
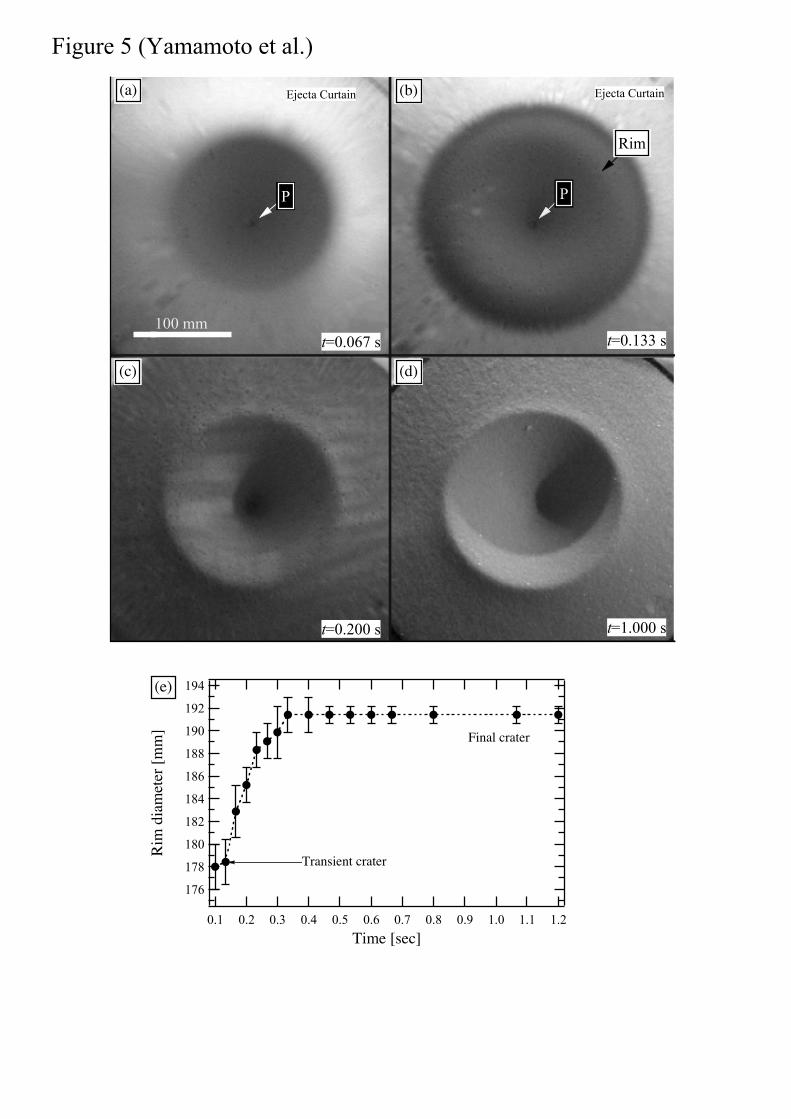
The formation and collapse processes of transient craters were observed by a camcorder set ata view port of the experimental chamber (Fig. 3). We took images at a time interval of 1/30 s(= 0.033 s). Due to the difficulty of recording the exact moment (t = 0) when the projectile touchesthe target surface, we defined the first image of the excavation process as t = 0.033 s. Figs. 5a–dshow example images of the excavation processes taken by the camcorder [vi = 290 m s−1 andTC target (sav=220 µm)]. Fig. 5a shows the early stage of the excavation process at t = 0.067s. The excavation cavity (darker part) and the ejecta curtain (brighter part) are visible in thisimage. In addition, the projectile can be seen at the center of the crater, indicated by the letter‘P’ (no projectile was broken in our experiments; intact projectiles were able to retrieve after theexperiments). In this experiment the transient crater was formed by t = 0.133 s (Fig. 5b). Atthis time, we see that the crater rim forms (indicated by the label ‘Rim’) and the ejecta curtain(brighter part) moves outward. The crater then starts collapsing (Fig. 5c); the material of therim and the inner wall slid onto the crater floor, covering the projectile at the center of the crater.After the final crater formation (Fig. 5d), we were not able to see the projectile at the crater floor.
Fig. 5e shows the temporal change in rim diameter of transient crater with t (for the sameexperiment as Figs. 5a-d). The transient crater forms within 0.1 s after impact (we can notmeasure the rim diameters for t < 0.1 s), and Dtr is about 178 mm in this case. The craterthen starts collapsing, and Dtr increases from 178 mm to about 191 mm. Collapse finally stops att = 0.33 s after impact, and the final crater is formed (the crater shape does not change further).Dfi is about 191 mm in this case. It is therefore concluded that the transient crater collapses evenat the laboratory scale and Dtr increases owing to the collapse of crater wall.
In Fig. 6 the ratio Dfi/Dtr is plotted against Dtr for TA, TB, and TC targets. As shown in thisfigure, Dfi/Dtr values are nearly constant: Dfi/Dtr does not depend on Dtr. The average values ofDfi/Dtr for TA, TB, and TC targets are estimated to be 1.07± 0.02, 1.05± 0.01, and 1.05± 0.01,respectively. In Fig. 6 we can see no clear difference in Dfi/Dtr between TA, TB, and TC targets.This may suggest that Dfi/Dtr value does not depend on target material properties. However, thisdoes not mean that the collapse process is unaffected by target material properties; the collapseprocess could be controlled by internal friction. As will be shown later (Fig. 8a), Dtr values aswell as Dfi values depend on target material properties. Thus, the dependences in Dfi and Dtr on
4
target material properties may cancel out each other. This may suggest that both excavation andcollapse processes depend on target material properties in the same way, implying that the physicsof the late stages of excavation is similar to that involved during collapse.
For a comparison, we also did additional experiments with dry sand (with grain diameter rangingfrom 200 to 500µm, the angle of repose of ∼ 32◦, and the bulk density of 1.44 g cm−3). However,we did not see clear evidence of collapse (e.g., sliding of the material of crater rim and inner wall)for the dry sand. This may suggest that the collapse is very dependent on the type of target, andmay explain why the effects of collapse were not clear in the previous experiments.
3 Relation between depth and diameter of crater
Next we studied the relation between the crater depth and rim diameter (depth–rim diameter ratio)for the transient and final craters. It is difficult to measure the depths of the transient craters fromthe images. Therefore, we estimate the depth htr of the transient crater as follows: As shown inFigs. 5a and 5b, the projectile can be observed at the base of the transient crater. Thus, in thisstudy we defined the distance between the backside of the projectile and the original target surfaceas htr.
In Fig. 7 htr is plotted against Dtr for TA, TB, and TC targets, in which shows that htr
values for TA, TB, and TC targets are nearly proportional to Dtr. Calculating the slopes of thebest fit lines gives approximate depth–rim diameter ratios rtr (= htr/Dtr) for transient cratersformed in TA, TB, and TC targets. They are 0.27, 0.26, and 0.26, respectively, which are allslightly larger than those for the previous experiments: 0.14–0.25 for the quartz sand (Gault andWedekind, 1977; Mizutani et al., 1983) and ∼ 0.23 for the coarse–grained sand (Cintala et al.,1999). However, this does not mean necessarily that the transient craters in this work are deeperthan those in the previous experiments, because the data of the previous works are for the finalcraters (in the quarter–space experiments by Schmidt and Housen (1987) and Schultz (2003), theshapes of the transient craters were deeper than those of the final craters).
For comparison, hfi is also plotted against the final rim diameter Dfi for TA, TB, and TC targetsin Fig. 7, where hfi is the depth of the final crater measured from the original target surface. Fromthis we see that hfi values for TA, TB, and TC targets are nearly proportional to Dfi values, andthe final crater depth–rim diameter ratios (rfi = hfi/Dfi) for TA, TB, and TC targets are 0.14, 0.11,and 0.11, respectively. These rfi values are smaller than those of the previous studies: 0.14–0.25for the quartz sand (Gault and Wedekind, 1977; Mizutani et al., 1983) and ∼ 0.23 for the coarse–grained sand (Cintala et al., 1999). This means that the shapes of final craters in the glass spheretargets are shallower than those in the quartz sand and coarse–grained sand. The reason for thisis hard to explain, but is probably not due to differences in the angles of response, because theangles of repose for the glass spheres used in our experiments, which ranged from 25–33◦, are notsubstantially different from that of coarse–grained sand used by previous workers (e.g., 32◦; Cintalaet al., 1999). The sphericity of the grains may be important; the shape of the glass sphere (Fig.4) is obviously smoother than angular sand, so that the glass spheres might have lower dynamicalcoefficient of friction.
4 Effect of material properties on formation of transientcraters
4.1 Observation
In Fig. 8a Dtr is plotted against vi. As shown clearly in this figure, Dtr increases with increasingvi. The data for TA, TB and TC targets suggest the power–law relations (broken lines in Fig. 8a):Dtr = (21.8 ± 0.7)v0.344±0.007
i , Dtr = (23.8 ± 0.6)v0.354±0.006i , and Dtr = (25.2 ± 1.1)v0.356±0.009
i ,respectively. The power–law exponent increases slightly from TA to TC. It is also evident fromthis figure that Dtr increases from TA to TC. As shown in Table 1, the target material propertiessuch as the porosity or the angle of repose are different between TA, TB, and TC targets. It is thussuggested that the formation of the transient crater depends on the target material properties.
5

In Fig. 8b scaled–crater radius ΠR for Dtr is plotted against the gravity–scaled size Π2. We seethat ΠR increases from TA to TC. Assuming the power–law relation between ΠR and Π2, we candetermine the power–law exponents ε (dashed–lines in Fig. 8b) for TA, TB, and TC targets. Theyare ε = −0.172±0.003, −0.177±0.003, and −0.178±0.005, respectively. The power–law exponent εfor the ΠR–Π2 relation decreases from TA to TC. The value of ε is related to the coupling parameterthat links the early and late stages in impact cratering (Holsapple, 1993). It is therefore proposedthat this coupling parameter also depends on target material properties.
For comparison, ΠR values for Dfi measured by Mizutani et al. (1983) for the quartz sandtarget and Hartmann (1985) for the basalt and pumice powder targets are also plotted in Fig. 8b.It is clear that ΠR for Mizutani et al. (1983) and Hartmann (1985) are smaller than those forour results. If we take into account the difference between Dfi and Dtr (that is, Dfi > Dtr), thisdifference may increase. Therefore, even in the gravity regime the formation of transient cratersmay be affected by target material properties.
One may consider that the differences in ΠR between this work and the previous studies aredue to the low impact velocities (vi = 11 to 329 m s−1) in this work. However, vi for the quartzsand and the basalt and pumice powder targets are also low: vi = 158 m s−1 for basalt and pumicepowder targets plotted in Fig. 8b (Hartmann, 1985) and vi = 35 to 830 m s−1 for Mizutani et al.(1983). Thus, it is unlikely that the differences in ΠR between this work and the previous studiesare due to the difference in vi.
4.2 Interpretation
The above results suggested that even in the gravity regime the formation of transient craters maybe affected by target material properties. In this section we consider which material propertiesmight affect the transient crater growth and explain the differences in the ΠR–Π2 relation amongvarious targets. We study the relation between ΠR and the following four parameters: mean grainsize, porosity, internal friction, and target–projectile density ratio.
Our experimental results suggest that grain size may affect the transient crater growth. ΠR
values for TA, TB, and TC targets were shown to increase with increasing the mean grain size(sav)(Fig. 8b). However, grain size alone can not explain the differences in ΠR in Fig. 8b, becauseΠR values for the quartz sand are smaller than those for the TC target, although sav (∼ 200µm)and the size range (∼100 to 250 µm) for the quartz sand (Mizutani et al., 1983) are similar to thosefor TC target (Fig. 4). Moreover, the internal friction and porosity of the target materials used inour experiment both depend upon the grain size.
The porosity of target material has been proposed to have the most significant effect on cratergrowth in granular targets (e.g., Melosh, 1989; Housen and Holsapple, 2003): larger craters areformed in targets with lower porosity. We can see in Fig. 8b that ΠR values for TA, TB, andTC targets increase with decreasing the porosity (the porosities are 40, 38, and 36%, respectively).Thus the experimental results for TA, TB, and TC targets are consistent with this trend. However,we can also observe the exception against this trend; the data for the Ottawa sand (solid line inFig. 8b) is smaller than those for the glass sphere targets, although the porosity for the Ottawasand (∼ 31–36%; Schmidt and Housen, 1987) is not higher than those for the glass sphere targets.(They showed only the bulk density for the Ottawa sand. Assuming the grain density of 2.6–2.8 gcm−3, we estimated the porosity.) Therefore, porosity alone can not explain the difference in ΠR
amongst target materials.The internal friction (which is related to the angle of repose) has been also thought to be
important for the crater formation (e.g., Schmidt, 1980): larger craters are formed in targets withlower internal friction. The experimental results for TA, TB, and TC targets are consistent withthis trend: we see in Fig. 8b that ΠR values for TA, TB, and TC targets increase with decreasingthe angle of repose (the angles of repose are 33, 27, and 25◦, respectively). Since the angles of reposewere not shown in the previous experiments (Mizutani et al., 1983, Hartmann, 1985, Schmidt andHousen, 1987), we cannot conclude whether or not the angle of repose can explain the differencesin ΠR amongst target materials. In order to investigate this, we did additional experiments withdry sand with an angle of repose of ∼ 32◦. The results for the dry sand are also plotted in Fig. 8b(open squares). It is clearly shown in this figure that ΠR values for the dry sand are smaller thanthose for the glass sphere targets, although the angle of repose for the dry sand (32◦) is similar tothat for TA target. Thus, the angle of repose alone can not explain the difference.
6

The target–projectile density ratio may play important role in the ΠR-Π2 relation (e.g., Hol-sapple, 1993; Housen and Holsapple, 2003): ΠR depends on (ρ/δ)γ as well as Π2, where ρ/δ is theratio of target to projectile density and γ = (2 + µ − 6ν)/(6 + 3µ), where µ and ν are constantsrelating to the coupling parameters. The density ratio for this work (ρ/δ ∼ 1.3) is larger than thosefor the previous experiments: ρ/δ ∼ 0.65 (Schmidt and Housen, 1987), 0.49 (Mizutani et al., 1983),and 0.31 to 0.74 (Hartmann, 1985). However, ν is typically 1/3 and µ is about ∼ 0.4 (Holsapple,1993), that is, the exponent is γ ∼ 0.056. In this case, the differences in (ρ/δ)γ between this workand the previous experiments are ∼ 4% (Schmidt and Housen, 1987), ∼ 6% (Mizutani et al., 1983),and 3–8% (Hartmann, 1985). These values are too small to explain the divergence amongst varioustarget materials in Fig. 8b.
The above facts suggest that the differences in ΠR amongst target materials can not be explainedby the effect of a single parameter. The combination of these parameters may be able to explainthe differences. More detailed study of the effect of target material properties on the transientcrater formation is required.
5 Observation of the excavation process
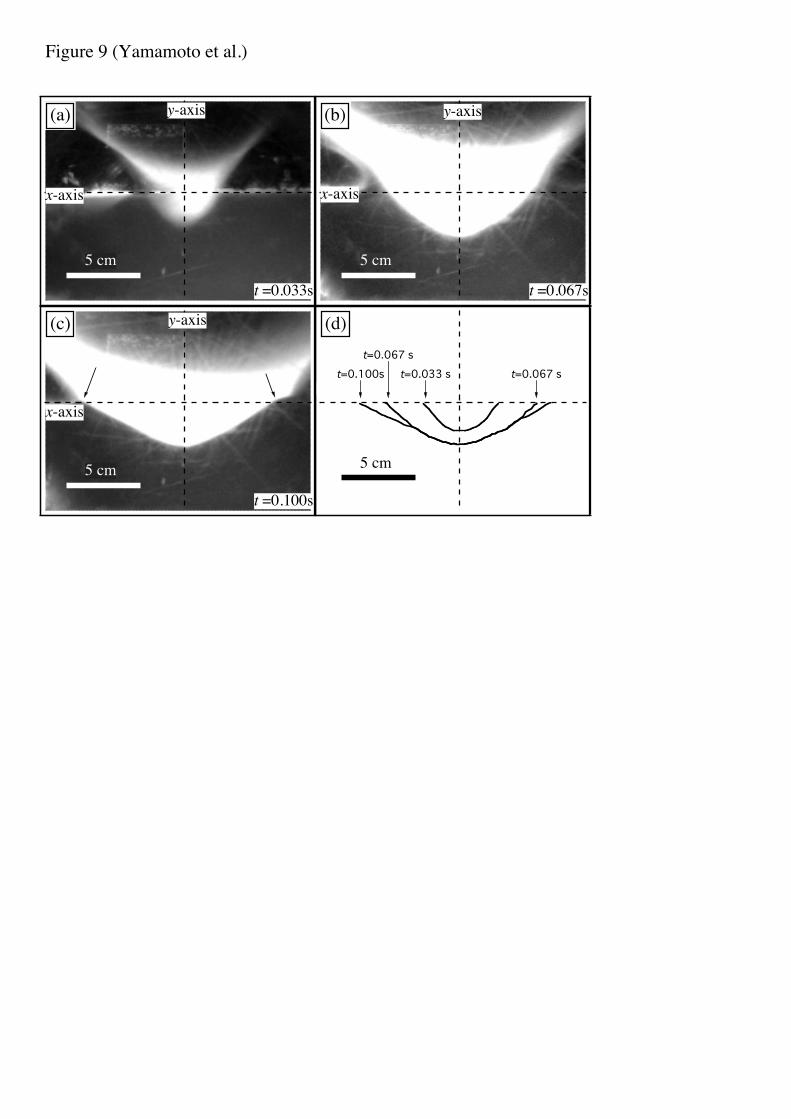
In order to directly observe the excavation process, we conducted further impact experiments byusing the quarter–space technique (e.g., Schmidt and Piekutowski, 1983; Schmidt and Housen,1987; Schultz, 2003) in which the glass sphere target was set in a sample box with a transparentwindow, and projectiles impacted the target vertically along the transparent window. Figs. 9a–cshow images of the excavation process taken at t = 0.033, 0.067, and 0.100 s, respectively (the firstimage of the excavation process was recorded at t = 0.033 s), for impact into TB target with vi =154 m s−1. The x–axis in the figure corresponds to the original target surface (bright region belowthe x–axis represents the crater cavity, and the projectile impacts the target along the y–axis).Based on these images, we can trace the change in shape of the cavity below the x–axis (Fig. 9d).It is clear from Fig. 9d that the vertical expansion of the cavity halts by t = 0.067 s but its radialexpansion along the x–axis continues after vertical expansion stops. We conclude that the transientcrater is formed by t = 0.100 s, because the rim forms (represented by the arrows in Fig. 9c) bythis time step, and the crater shape does not change again until the beginning of collapse of thewall.
We also studied the temporal change in the diameter of the cavity (cavity diameter dc) fordifferent targets. Fig. 10 shows the temporal change in dc for TA, TB, and TC targets (vi =136 ± 3 m s−1). We can see that dc value at t=0.033 s ranges from 6 to 7 cm and increases toabout 9 cm at t=0.067 s. This feature does not differ greatly amongst TA, TB, and TC targets.However, a large difference in dc amongst the targets appears after t = 0.067 s: dc values for TBand TC targets rapidly increase after this time step, while dc value for TA target does not. Weagain consider that the transient crater is formed by t = 0.100 s, because the rim was formed byt = 0.100 s (Fig. 9c). Then, dc increases slightly after 0.133 s (the arrow in Fig. 10). We considerthat the changes in dc after t =0.133 s are due to collapse; dc values for TA and TB targets increaseabout 10% due to the collapse, while the change in dc for TC target is much smaller than this. Asshown in Fig. 6, the change in rim diameter for TC target due to collapse was similar to those forTA and TB targets. However, the change for TA target in this quarter–space experiment is smallerthan those for TB and TC targets. The reason for the difference is uncertain.
These observations suggest that the radial expansion process depends on the target materialproperties. This might be interpreted as follows: During the early stages of excavation (t <∼ 0.067s), the dynamic pressure of the excavation flow is high enough to dominate over the effects oftarget material properties. Therefore, the growth of the cavity does not depend on target materialproperties. On the other hand, the dynamic pressure of the flow decreases at the stage after 0.067s where the radial expansion process dominates. Thus, the excavation flow would be perturbedby material properties such as internal friction. This could be the reason why the transient rimdiameters depend on the target material properties even in the gravity regime.
7
6 Conclusions
We observed the formation and collapse of transient craters formed in glass–sphere targets withdifferent target material properties. We found that the transient crater collapses even at laboratoryscales, and that the shape of the final crater was broader and shallower than the transient crater.The depth–rim diameter ratios of the final and transient craters were 0.11–0.14 and 0.26–0.27,respectively. The increases in crater diameter due to the collapse were about 3 to 12 %, but didnot show any dependency on the target material properties. On the other hand, both the transientand final rim diameters depend on the target material properties. This means that the formationof transient craters is affected by target material properties in the gravity regime. Clearly there isa need to take into account the effect of target material properties on the scaling laws for transientcraters in the gravity regime. Observations of the excavation flow in impact experiments usingthe quarter–space technique, suggest that the early stage of crater growth does not depend on thetarget material properties, whereas the later radial expansion does.
The feature of the collapse processes observed in this study may be analogous to the formationof breccia lenses observed at the base of craters (such as Brent and Barringer) (e.g., Grieve et al.,1977; Melosh, 1989; Melosh and Ivanov, 1999); the breccia lenses are mainly due to debris slidingof the rim and wall of transient craters. The slumping of the crater rim in the case of simple craterswas also shown in numerical calculations (e.g., Ivanov, 1999; Wunnemann and Ivanov, 2003; Wadaet al., 2006). Therefore, combining our data (such as the diameter ratio of final to transient crateror the depth–rim diameter ratio) with numerical calculations and field studies will provide moreinformation about the understanding of the formation of simple craters with breccia lenses.
7 Acknowledgments
The authors thank O.S. Barnouin–Jha, H. Senshu, S. Sugita, and T. Kadono for fruitful discussions,G. Collins and an anonymous reviewer for helpful comments, K. Barnouin–Jha for improving thedraft, and S. Imanishi for technical support. This research was partly supported by T. Yoda andthe Grant in Aid from Japan Society for the Promotion of Science.
References
[1] Cintala, M.J., Berthoud L., Horz F., 1999, Ejection-velocity distributions from impacts intocoarse-grained sand. Meteorit. Planet. Sci. 34, 605-623.
[2] Cintala, M.J., Barnouin–Jha O.S., Horz F., 2003, A method of estimating transient–cavitydiameters for impact craters formed in dry sand. Lunar Planet. Sci. Conf. 36th, abstract 207.
[3] Gault, D.E., Wedekind J.A., 1977, Experimental hypervelocity impact into quartz sand-II,Effects of gravitational acceleration. In: Roddy, D.J., Pepin, R.O., Merrill, R.B. (Eds.), Impactand explosion cratering, Pergamon press, New York, pp. 1231-1244.
[4] Grieve, R.A.F., Dence M.R., Robertson P.B., 1977, Cratering processes: As interpreted fromthe occurrence of impact melts. In: Roddy, D.J., Pepin, R.O., Merrill, R.B. (Eds.), Impact andexplosion cratering, Pergamon press, New York, pp. 791-814.
[5] Hartmann, W.K., 1985, Impact experiments. 1. Ejecta velocity distributions and related resultsfrom regolith targets. Icarus 63, 69-98.
[6] Holsapple, K.A., 1993, The scaling of impact processes in planetary sciences. Annu. Rev. EarthPlanet. Sci. 21, 333-373.
[7] Housen, K.R., Holsapple K.A., 2003. Impact cratering on porous asteroids. Icarus 163, 102-119.
[8] Ivanov, B.A., 1999, Transient crater modification due to gravity slumping. Lunar Planet. Sci.Conf. 30th, abstract 157.
[9] Melosh, H.J., 1989, Impact Cratering. Oxford Univ. Press, New York.
[10] Melosh, H.J., Ivanov B.A., 1999, Impact crater collapse. Annu. Rev. Earth Planet. Sci. 27,385-415.
8
[11] Mizutani, H., Kawakami S., Takagi Y., Kato M., Kumazawa M., 1983, Cratering experimentsin sands and a trial for general scaling law. J. Geophys. Res. 88, Supplement, A835-A845.
[12] Schmidt, R.M., 1980, Meteor Crater: Energy of formation–implications of centrifuge scaling.Proc. Lunar Planet. Sci. Conf. 11th, 2099-2128.
[13] Schmidt, R.M., Holsapple K.A., 1982, Estimates of crater size for large–body impact: Gravity–scaling results. Geol. Soc. of Am. Special Paper 190, 93-102.
[14] Schmidt, R.M., Piekutowski A.J., 1983, Development of the quarter–space technique for cra-tering experiments of a centrifuge. Lunar Planet. Sci. Conf. 14th, abstract 668-669.
[15] Schmidt, R.M., Housen K.R., 1987, Some recent advances in the scaling of impact and explo-sion cratering. Int. J. Impact Engng 5, 543-560.
[16] Schultz, P.H., 2003, Transient crater growth in low density targets. Lunar Planet. Sci. Conf.36th, abstract 206.
[17] Stoffler, D., Gault D.E., Wedekind J., Polkowski G., 1975, Experimental hypervelocity impactinto quartz sand: Distribution and shock metamorphism of ejecta. J. Geophys. Res. 80, 4062-4077.
[18] Teramoto, K., Yano H., 2005, Measurements of sound speed in granular materials simulatedregolith. Lunar Planet. Sci. Conf. 36th, abstract 1856.
[19] Wada, K., Senshu H., Matsui T, 2006, Numerical simulation of impact cratering on granularmaterial. Icarus, 180, 528-545.
[20] Walsh, A.M., Holloway K.E., Habdas P., de Bruyn J.R., 2003, Morphology and scaling ofimpact craters in granular media. Phys. Rev. Lett. 91, 104301.
[21] Wunnemann, K., Ivanov B.A., 2003, Numerical modelling of the impact crater depth–diameterdependence in an acoustically fluidized target. Planet. Space Sci. 51, 831-845.
9
8 Figure Captions
Fig. 1: Schematic diagram of the collapse of a transient crater. (a) The wall and rim of the transientcrater collapse inward owing to gravity, and (b) the collapsed material fills the crater floor (thedashed–line represents the original transient crater shape). In this figure we do not considerthe uplift of a crater floor owing to rebound.
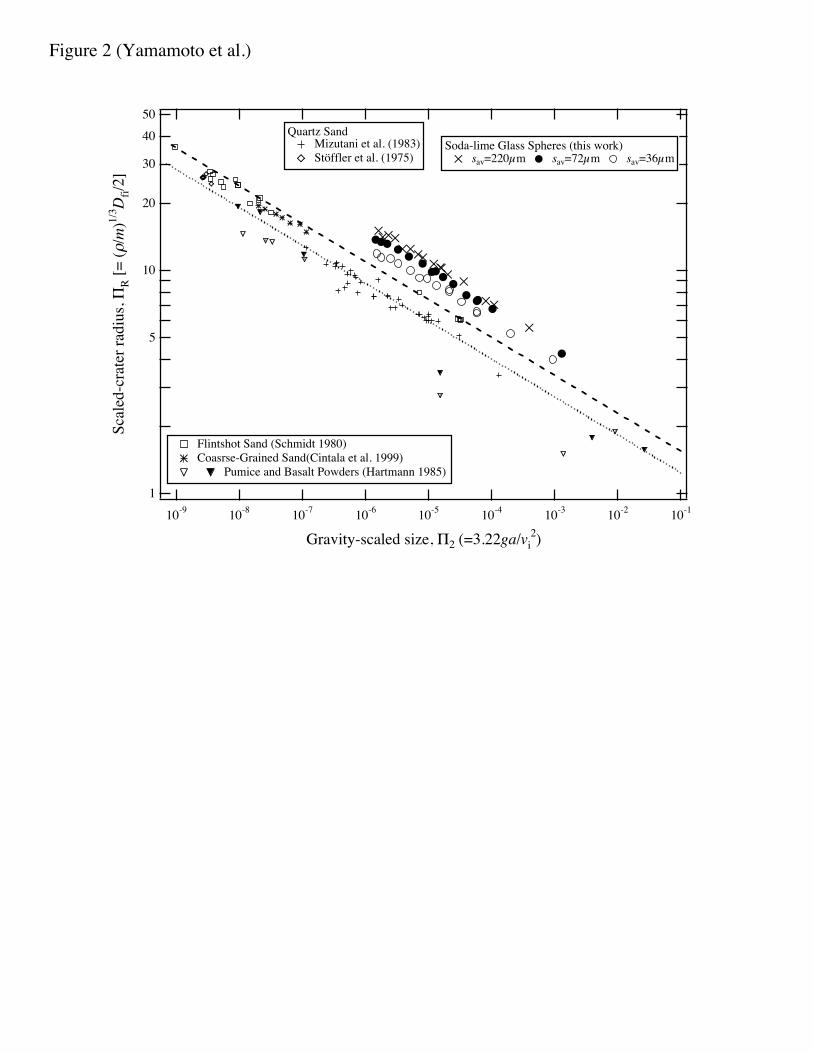
Fig. 2: The scaled–crater radius ΠR [= (ρ/m)1/3Dfi/2] is plotted against the gravity–scaled sizeΠ2(= 3.22ga/v2
i ) for granular target experiments, where Dfi is the rim diameter of final crater,ρ is the bulk density of target, m is the projectile’s mass, g is the gravitational acceleration, ais the projectile’s radius, and vi is the impact velocity. The broken line represents a power–lawrelation between ΠR and Π2 for the data measured by Schmidt and Housen (1987). Schmidt(1980) and Schmidt and Housen (1987) measured the apparent diameters of final craters (dfi),but they did not show the data on Dfi. In this plot, we assumed Dfi = 1.25dfi (Gault andWedekind, 1977) (the original power–law relation between ΠR and Π2 for dfi is also plottedas the dotted–line). The data on Dfi for soda–lime glass spheres are the results of this workfor sav = 220, 72, and 36µm, where sav is the mean diameter of glass spheres.
Fig. 3: Schematic diagram (side view) of our experimental setup. We can observe the formation andcollapse processes of transient craters by a camcorder set at a view port of the experimentalchamber.
Fig. 4: Example images of the glass spheres for (a) TA, (b) TB, and (c) TC targets (see text fordescription of targets). The scale bars are 500µm long. (d) Number–fractions of the glassspheres with diameter smaller than s for TA, TB, and TC targets, respectively.
Fig. 5: Example images of the formation and collapse processes of the transient crater at (a) t = 0.067s, (b) 0.133 s, (c) 0.200 s, and (d) 1.000 s after impact. We can see the projectile at the centerof the crater (indicated by the letter ‘P’). Light sources illuminate the target surface from thetop and the right of this picture. This is the case for impact into TC target (impact velocityof 290 m s−1). (e) The crater rim diameter is plotted against the time t after impact.
Fig. 6: The ratio of final rim diameter (Dfi) to transient rim diameter (Dtr) is plotted against Dtr.
Fig. 7: The relation between the crater depth (htr, hfi) and the rim diameter (Dtr, Dfi) for thetransient and final craters for TA, TB, and TC targets. The broken lines are the best fit onesfor TA, TB, and TC targets (the number indicates the depth–rim diameter ratio: htr/Dtr forthe transient craters and hfi/Dfi for the final craters).
Fig. 8: (a) The transient rim diameter Dtr is plotted against the impact velocity vi. The brokenlines represent the least–squares fit to the data for TA, TB and TC targets, respectively. (b)ΠR–Π2 plot for Dtr observed for TA, TB, and TC targets. The dashed lines represent theleast–squares fit to the data for TA, TB, and TC targets, respectively. In order to see thedifference between Dtr and Dfi in this diagram, ΠR values for Dfi in this work are also plotted(upper error bar for each data). For comparison, ΠR values for Dfi by Mizutani et al. (1983)(quartz sand) and Hartmann (1985) (basalt and pumice powders) are also plotted. The solidline represents a power–law relation between ΠR and Π2 for the data on Dfi by Schmidt andHousen (1987) (they measured the apparent diameters of final craters (dfi), but did not showthe data on Dfi. In this plot, we assume Dfi = 1.25dfi). For a comparison, the data on Dfi fordry sand (with grain diameter ranging from 200 to 500µm, the angle of repose of ∼ 32◦, andthe bulk density of 1.44 g cm−3) measured in this work are also plotted (open squares).
Fig. 9: Images of growth stages of cavities due to excavation flows at (a) t = 0.033 s, (b) 0.067 s, and(c) 0.100 s after impact. The x–axis corresponds to the original target surface. The projectileimpacts the target (TB) along the y–axis (impact velocity of 154 m s−1). (d) Contours of thecavities below the x–axis for three images (a)-(c).
Fig. 10: Temporal change in the diameter (along the x–axis in Fig. 9) of the cavity for TA, TB, andTC targets. The impact velocities are 136± 3 m s−1.
10

Table 1: Material properties of the glass sphere targets
Target Mean diameter Bulk density Porosity aAngle of bSound speedsav [µm] [g cm−3] [%] repose [◦] [m s−1]
TA 36 1.50 40 33 93±13TB 72 1.54 38 27 134±11TC 220 1.59 36 25 171±18
aThe base angle of the cone–shape of the glass spheres above a flat and level plate. bThese values are fromTeramoto and Yano (2005).
9 Table
Table 2: The experimental condition and the result for TA target.Shot No. Impact velocity Transient crater Final crater
[m s−1] rim diameter [mm] depth [mm] rim diameter [mm] depth [mm]411081 129 113 31 127 14411082 86 103 26 111 13411083 52 86 20 90 12411084 69 94 24 100 13411085 52 85 23 89 12411091 147 121 33 128 18411092 28 69 18 72 10411093 174 130 34 138 20411094 219 143 37 149 21411096 250 144 39 156 22411097 298 150 43 158 25411098 321 158 46 164 26411099 13 51 13 55 74110910 85 105 26 113 144110911 109 108 28 118 14
11
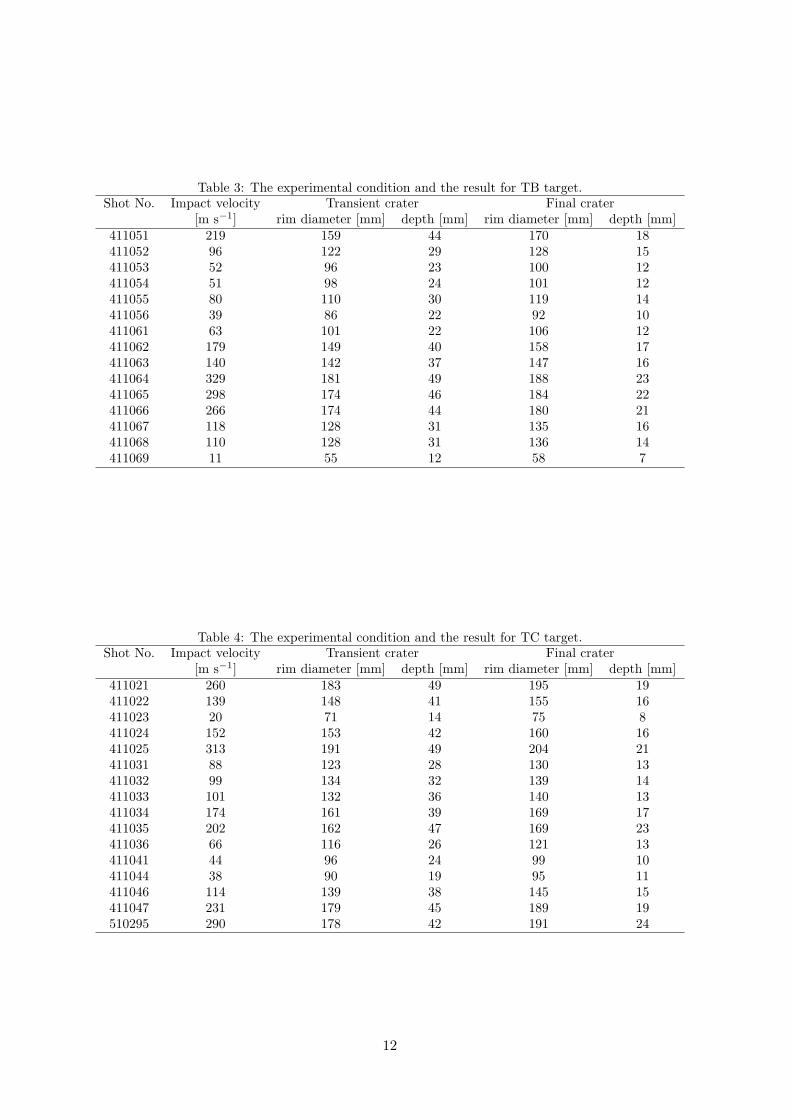
Table 3: The experimental condition and the result for TB target.Shot No. Impact velocity Transient crater Final crater
[m s−1] rim diameter [mm] depth [mm] rim diameter [mm] depth [mm]411051 219 159 44 170 18411052 96 122 29 128 15411053 52 96 23 100 12411054 51 98 24 101 12411055 80 110 30 119 14411056 39 86 22 92 10411061 63 101 22 106 12411062 179 149 40 158 17411063 140 142 37 147 16411064 329 181 49 188 23411065 298 174 46 184 22411066 266 174 44 180 21411067 118 128 31 135 16411068 110 128 31 136 14411069 11 55 12 58 7
Table 4: The experimental condition and the result for TC target.Shot No. Impact velocity Transient crater Final crater
[m s−1] rim diameter [mm] depth [mm] rim diameter [mm] depth [mm]411021 260 183 49 195 19411022 139 148 41 155 16411023 20 71 14 75 8411024 152 153 42 160 16411025 313 191 49 204 21411031 88 123 28 130 13411032 99 134 32 139 14411033 101 132 36 140 13411034 174 161 39 169 17411035 202 162 47 169 23411036 66 116 26 121 13411041 44 96 24 99 10411044 38 90 19 95 11411046 114 139 38 145 15411047 231 179 45 189 19510295 290 178 42 191 24
12
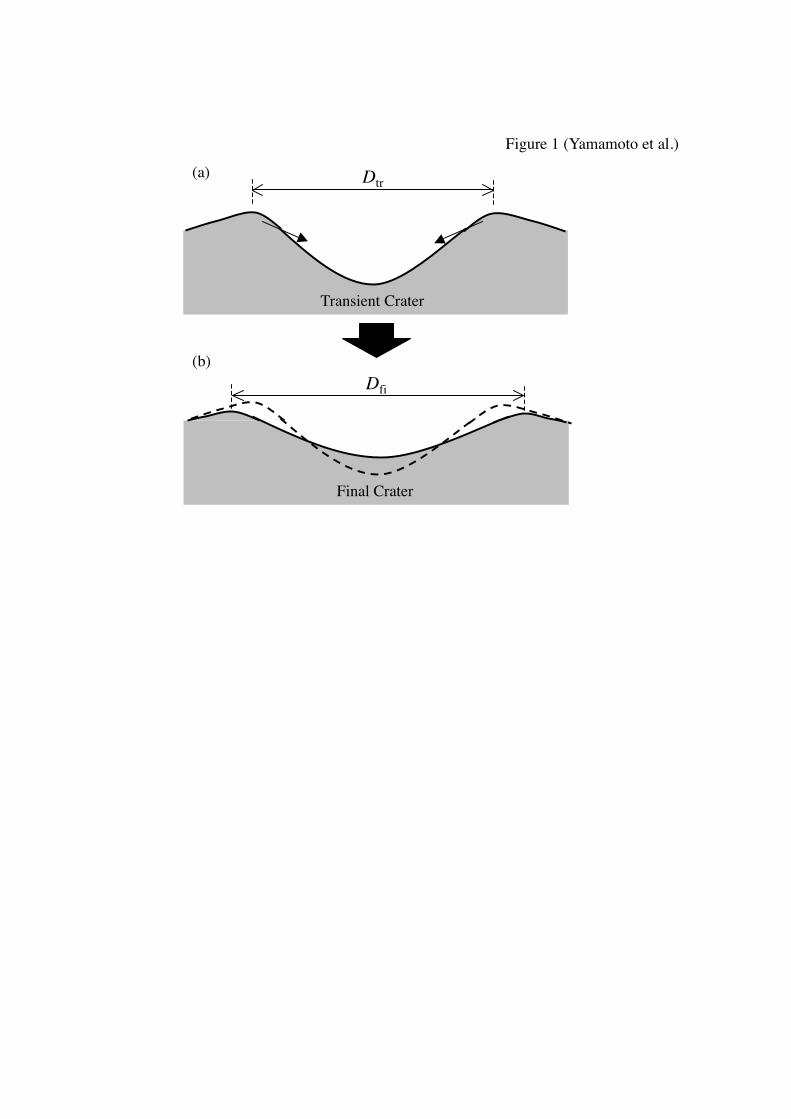
Figure 1 (Yamamoto et al.)
Transient Crater
Final Crater
Dtr
Dfi
(a)
(b)
1
5
10
20
30
4050
Scal
ed-c
rate
r rad
ius, Π
R [=
(ρ/m
)1/3 D
fi/2 ]
10-9 10-8 10-7 10-6 10-5 10-4 10-3 10-2 10-1
Gravity-scaled size, Π2 (=3.22ga/vi2)
Quartz Sand Mizutani et al. (1983)Stöffler et al. (1975)
Soda-lime Glass Spheres (this work)sav=220µm sav=72µm sav=36µm
Flintshot Sand (Schmidt 1980)Coasrse-Grained Sand(Cintala et al. 1999)
Pumice and Basalt Powders (Hartmann 1985)
Figure 2 (Yamamoto et al.)
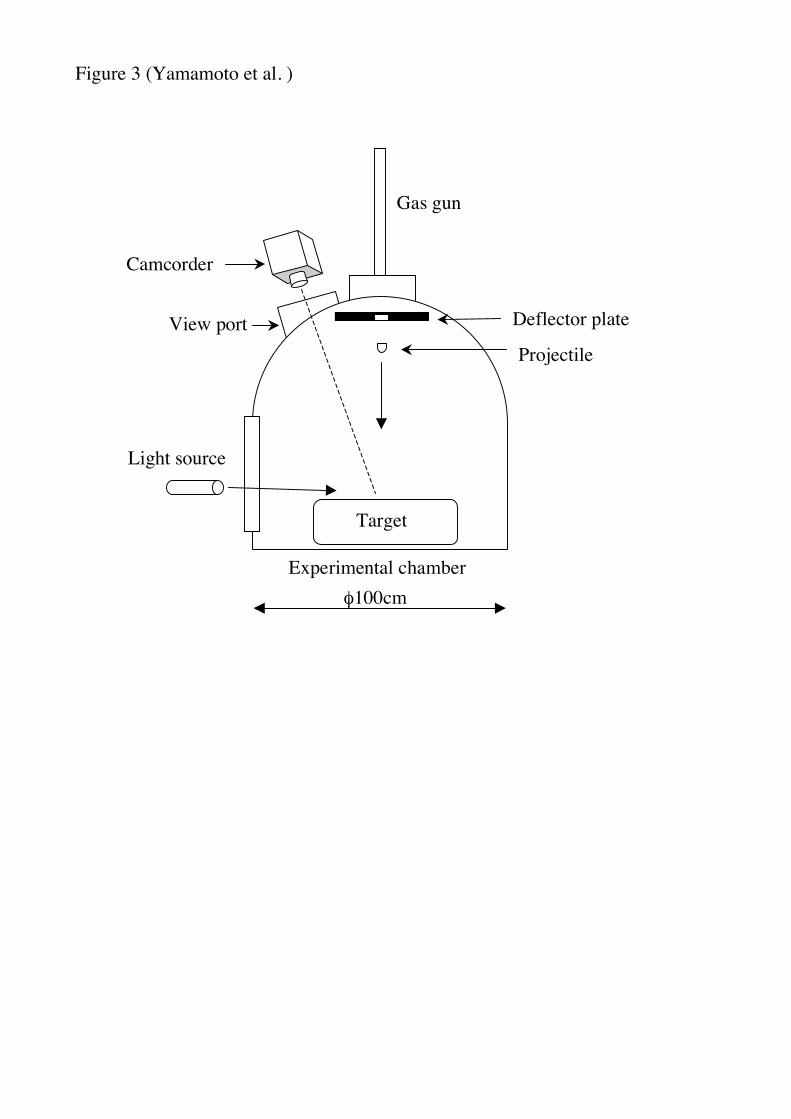
Figure 3 (Yamamoto et al. )
Projectile
Gas gun
Experimental chamber
Camcorder
Target
Deflector plate
Light source
View port
φ100cm
500µm
500µm
500µm
(a)
(b)
(c)
Figure 4 (Yamamoto et al.)
1.0
0.8
0.6
0.4
0.2
0.0
Num
ber f
ract
ion
10 50 100 150 200 300 400
Diameter s [µm]
TA TB TC
(d)
(a) (b)
(c) (d)
t=0.067 s t=0.133 s
t=0.200 s t=1.000 s
P
Ejecta Curtain
100 mm
Ejecta Curtain
P
Rim
194
192
190
188
186
184
182
180
178
176
Rim
dia
met
er [m
m]
1.21.11.00.90.80.70.60.50.40.30.20.1
Time [sec]
Transient crater
Final crater
(e)
Figure 5 (Yamamoto et al.)

1.30
1.25
1.20
1.15
1.10
1.05
1.00
Dfi
/ D tr
200180160140120100806040Transient rim diameter, Dtr [mm]
TA (sav=36µm)TB (sav=72µm)TC (sav=220µm)
Figure 6 (Yamamoto et al.)
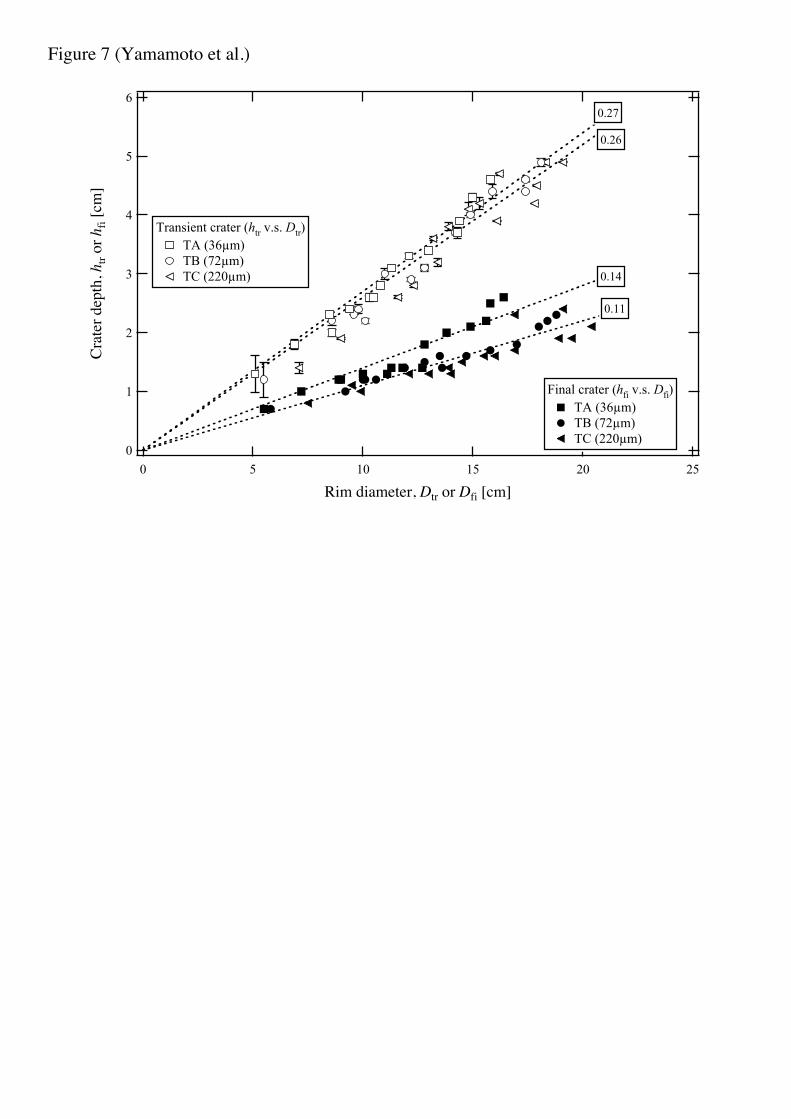
Figure 7 (Yamamoto et al.)
6
5
4
3
2
1
0
Crat
er d
epth
, htr
or h
fi [c
m]
2520151050
Rim diameter, Dtr or Dfi [cm]
Transient crater (htr v.s. Dtr)TA (36µm)TB (72µm)TC (220µm)
0.26
Final crater (hfi v.s. Dfi)TA (36µm)TB (72µm)TC (220µm)
0.14
0.27
0.11
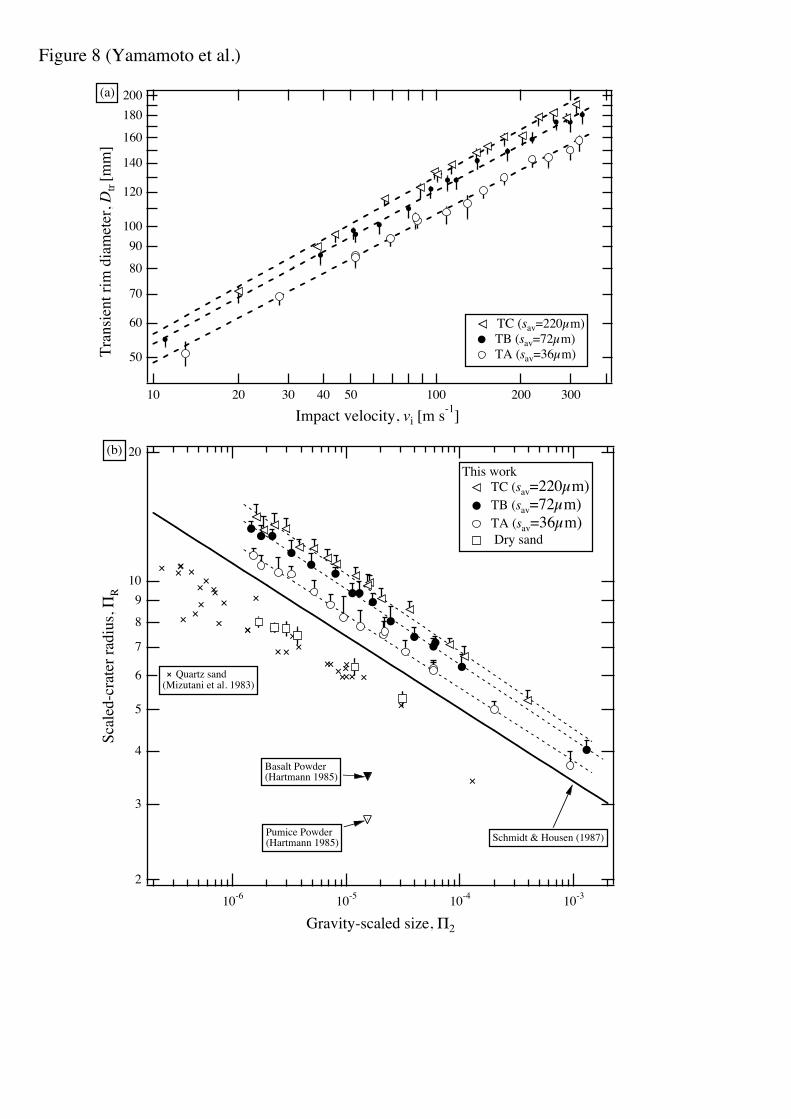
Figure 8 (Yamamoto et al.)
2
3
4
5
6
7
8
910
20
Scal
ed-c
rate
r rad
ius, Π
R
10-6 10-5 10-4 10-3
Gravity-scaled size, Π2
This workTC (sav=220µm)TB (sav=72µm)TA (sav=36µm) Dry sand
Basalt Powder(Hartmann 1985)
Pumice Powder(Hartmann 1985)
Quartz sand(Mizutani et al. 1983)
(b)
Schmidt & Housen (1987)
50
60
70
80
90100
120
140
160
180
200Tr
ansie
nt ri
m d
iam
eter
, Dtr
[mm
]
10 20 30 40 50 100 200 300
Impact velocity, vi [m s-1]
TC (sav=220µm)TB (sav=72µm)TA (sav=36µm)
(a)
t=0.067 s
t=0.067 s
5 cm
(d)
t=0.033 st=0.100s
(c) y-axis
x-axis
t =0.100s
5 cm
(b) y-axis
x-axis
t =0.067s
5 cm
(a) y-axis
x-axis
t =0.033s
5 cm
Figure 9 (Yamamoto et al.)

Figure 10 (Yamamoto et al.)
14
13
12
11
10
9
8
7
6
Cavi
ty d
iam
eter
, d c [c
m]
4 5 6 7 8 90.1
2 3 4 5 6 7 8 91
2
Time, t [sec]
TC (sav=220µm)TB (sav=72µm)TA (sav=36µm)


![PLANETARY DEFENSE · andCharacterization ofMinor Planets with NEOWISE.In Handbook Cosmic Hazards Planetary Defense, pp 583-611 Springer International Publishing. [23] Melosh ,H .Nemchinov](https://static.fdocuments.net/doc/165x107/608dbd685c19065afd3331e7/planetary-defense-andcharacterization-ofminor-planets-with-neowisein-handbook-cosmic.jpg)


