Trading into Sustainable Development: Trade, Market...
86
TRADING INTO SUSTAINABLE DEVELOPMENT: Trade, Market Access, and the Sustainable Development Goals DEVELOPING COUNTRIES IN INTERNA DEVELOPING COUNTRIES IN INTERNA TIONAL TRADE STUDIES TIONAL TRADE STUDIES UNITED NA UNITED NA TIONS CONFERENCE ON TRADE AND DEVELOPMENT TIONS CONFERENCE ON TRADE AND DEVELOPMENT UNCTAD UNITED NATIONS
Transcript of Trading into Sustainable Development: Trade, Market...

TRADING INTO SUSTAINABLE DEVELOPMENT:Trade, Market Access, and the Sustainable Development Goals
DEVELOPING COUNTRIES IN INTERNADEVELOPING COUNTRIES IN INTERNATIONAL TRADE STUDIESTIONAL TRADE STUDIES
unctad.org/tab
U N I T E D N AU N I T E D N AT I O N S C O N F E R E N C E O N T R A D E A N D D E V E L O P M E N TT I O N S C O N F E R E N C E O N T R A D E A N D D E V E L O P M E N T
Phot
o cr
edit:
Fot
olia
© c
, Don
na, K
adm
y, m
.sch
ucka
rt, M
aksy
m Y
emey
anov
, ped
rosa
la, P
hilli
p M
inni
s, p
icca
ya, R
aine
r Ple
ndl,
sole
g, E
lena
thew
ise
TRA
DIN
G IN
TO SU
STAIN
AB
LE DEVELO
PMEN
T: Trade, Market A
ccess, and the Sustainable Developm
ent Goals
UNCTA
DUNITED NATIONS
Printed at United Nations, Geneva – 1604429 (E) – March 2016 – 544 – UNCTAD/DITC/TAB/2015/3

TRADING INTO SUSTAINABLE DEVELOPMENT:Trade, Market Access, and the Sustainable Development Goals
DEVELOPING COUNTRIES IN INTERNATIONAL TRADE STUDIES
U N I T E D N AT I O N S C O N F E R E N C E O N T R A D E A N D D E V E L O P M E N T
New York and Geneva, 2016

iiTRADING INTO SUSTAINABLE DEVELOPMENT:
TRADE, MARKET ACCESS, AND THE SUSTAINABLE DEVELOPMENT GOALS
NOTE
The views expressed in this report are those of the authors and do not necessarily reflect the views of the United Nations Secretariat. The designations employed and the presentation of the material in this publication do not imply the expression of any opinion whatsoever on the part of the United Nations Secretariat concerning the legal status of any country, territory, city or area, or of its authorities, or concerning the delimitation of its frontiers or boundaries. This publication is under the Developing Countries in International Trade Studies.
Symbols of United Nations documents are composed of capital letters with figures. Mention of such a symbol indicates a reference to a United Nations document.
Material in this publication may be freely quoted or reprinted, but full acknowledgement is requested. A copy of the publication containing the quotation or reprint should be sent to the UNCTAD secretariat at: Palais des Nations, CH-1211 Geneva 10, Switzerland.
This document has been edited externally.
UNCTAD/DITC/TAB/2015/3UNITED NATIONS PUBLICATION
ISSN 1817-1214
Copyright © United Nations 2016All rights reserved

iii
ACKNOWLEDGEMENTS
This publication is a product of the Trade Analysis Branch, Division on International Trade in Goods and Services, and Commodities (DITC), United Nations Conference on Trade and Development (UNCTAD). Under the general supervision of Guillermo Valles, the Director of DITC, Miho Shirotori oversaw the publication as Editor-in-Chief. Alessandro Nicita, Julia Seiermann and Miho Shirotori wrote Chapters I and II. Marietta Angeli, Christian Knebel, and Ralf Peters wrote Chapter III. Marco Fugazza wrote Chapter IV. Sheik Ahmed, Sonia Boffa, Santiago Fernandez de Cordoba, Maxim Gubarev, Narmin Khalilova, Alain Mclaren, Samuel Munyaneza, Marina Murina, Chi-le Ngo and Denise Penello-Rial provided comments and inputs during the preparatory stage of the publication. Nadiya Dzyubynska and Susan Graham provided administrative support. Lynne Rees edited the publication. Jenifer Tacardon-Mercado formatted the document and oversaw the administrative processes throughout the preparation of the publication.
The TAB team is grateful for valuable comments received from Michael Cannon, Julie Emond, Simon Evenett, Frédérique Delaprée, Lorena Jaramillo, Jodie Keane, Ewan Lewis, Steve MacFeely, and Carlos Passarelli. The report benefited greatly from the innovative ideas and suggestions received from the panellists and the participants at the UNCTAD Ad-hoc Expert Meeting on Policy Interfaces between Trade and the Sustainable Development Goals (12 October 2015, Geneva). In this respect, special thanks goes to Emma Aisbett, Marc Van Amerigen, Maria Carvalho, David Cheong, Mathieu Couttenier, Julie Emond, Giorgia Giovanetti, Katherine Hagen, Robert Koopman, Elisabeth Losasso, Ahmad Mukhtar, Marcelo Olarreaga, Bonapas Onguglo, Ramond Saner, Ben Shephard, Alice Tipping, Lichia Yiu and Simonetta Zarrilli.


v
CONTENTS
ACKNOWLEDGEMENTS ................................................................................................................................. iiiACRONYMS AND ABBREVIATIONS .................................................................................................................viiINTRODUCTION ............................................................................................................................................. ix
CHAPTER I. TRADE POLICYMAKING AND THE SUSTAINABLE DEVELOPMENT ................................................. 1
1 International trade in the implementation of the 2030 Agenda for sustainable development ..... 11.1 Sustainable development concerns in the multilateral trading system ......................................... 21.2 Sustainable development concerns in trade agreements outside the World Trade Organization.... 5
2 Opportunities and challenges in using trade policy for the achievement of the SDGs ................ 72.1 Trade as a means of implementation ........................................................................................... 72.2 Potential impacts of market access conditions on sustainable development ................................ 92.3 Need for complementary actions to link trade and the SDGs ....................................................... 9
3 Concluding remarks ...................................................................................................................... 10
Endnotes ..................................................................................................................................................... 13References .................................................................................................................................................. 16
CHAPTER II. TARIFFS AND THE SUSTAINABLE DEVELOPMENT GOALS.......................................................... 19
1 Introduction ................................................................................................................................... 192 Tariffs and the sustainable development goals ........................................................................... 23
2.1 Indicator for Target 17.10: Worldwide weighted average tariffs .............................................. 232.2 Indicator for Targets 17.12 and 10.a: Duty-free and the average tariff ................................... 252.3 Indicator for Target 17.7: Tariffs on environmental goods ....................................................... 27 2.3.1 Average applied tariffs on environmental goods........................................................... 28 2.3.2 Trade flows of environmental goods ............................................................................ 30 2.3.3 Non-tariff measures on environmental goods .............................................................. 31
3 Doubling the least developed countries’ share of global exports by 2020 ................................. 324 Concluding summary ..................................................................................................................... 34
Endnotes ..................................................................................................................................................... 38References .................................................................................................................................................. 40
CHAPTER III. NON-TARIFF MEASURES AND THE SUSTAINABLE DEVELOPMENT GOALS ............................... 41
1 Non-tariff measures in international trade ................................................................................... 412 Non-tariff measures as the key determinant of market access conditions and trade costs .............................................................................. 423 Non-tariff measures as policy interfaces between trade and the sustainable development goals .................................................................................................... 45

viTRADING INTO SUSTAINABLE DEVELOPMENT:
TRADE, MARKET ACCESS, AND THE SUSTAINABLE DEVELOPMENT GOALS
3.1 Case 1 - Non-tariff measures and food security..................................................................... 463.2 Case 2 - Environmental regulations as non-tariff measures ................................................... 47
4 Marking non-tariff measures work for sustainable development: Achieving coherence at all levels ................................................................................................. 48
4.1 Coherence at the national level ............................................................................................. 494.2 Coherence at the international level ...................................................................................... 494.3 Reducing “structural regulatory distance” at the regional level .............................................. 50
5 Conclusion ..................................................................................................................................... 51
Endnotes ..................................................................................................................................................... 51References .................................................................................................................................................. 53
CHAPTER IV. PHYSICAL MARKET ACCESS AND TRADE COSTS ..................................................................... 55
1 Introduction ................................................................................................................................... 552 Trade costs in international trade ................................................................................................. 55
2.1 Trade costs across sectors and income groups...................................................................... 562.2 Transport costs and the income gains from trade .................................................................. 582.3 Maritime connectivity as a determinant of trade costs ........................................................... 60
3 Trade costs, maritime connectivity and income ........................................................................... 624 Implications for policy intervention .............................................................................................. 65
4.1 Areas of policy actions to improve maritime connectivity ....................................................... 665 Concluding summary ..................................................................................................................... 68
Endnotes ..................................................................................................................................................... 71References .................................................................................................................................................. 72
vii
ACRONYMS AND ABBREVIATIONS
AIDS acquired immune deficiency syndromeAPEC Asia Pacific Economic CooperationAVE ad-valorem equivalentDFQF duty-free and quota-freeEGA Environmental Goods AgreementEIA economic integration agreementFAO Food and Agriculture OrganizationFTA free trade agreementGATS General Agreement on Trade in ServicesGATT General Agreement on Tariffs and Trade GDP gross domestic productGSP Generalized System (Scheme) of PreferencesHDI Human Development IndexHIV human immunodeficiency virus IAEG-SDG Inter-Agency and Expert Group on Sustainable Development Goal Indicators ILO International Labour OrganizationIMF International Monetary FundIP intellectual propertyITC International Trade CentreLDC least developed countryLSBCI Liner Shipping Bilateral Connectivity Index MAST Multi-Agency Support TeamMDG Millennium Development GoalMEA multilateral environment agreementMFN Most-Favoured NationNAFTA North America Free Trade Agreement NAMA Non-Agricultural Market AccessNTB non-tariff barrierNTM non-tariff measureOECD Organization for Economic Co-operation and DevelopmentRPM relative preferential marginRTA regional trade agreementSADC Southern African Development CommunitySDG Sustainable Development GoalSDT special and differential treatmentSIDS Small Island Developing StatesSPS sanitary and phytosanitaryTBT technical barriers to tradeTFA Trade Facilitation AgreementTNT Transparency in TradeTPP Trans-Pacific PartnershipTRAINS Trade Analysis and Information System

viiiTRADING INTO SUSTAINABLE DEVELOPMENT:
TRADE, MARKET ACCESS, AND THE SUSTAINABLE DEVELOPMENT GOALS
TRIPS Trade-related aspects of intellectual property rightsUN United NationsUNAIDS United Nations AIDSUNCTAD United Nations Conference on Trade and DevelopmentUNDP United Nations Development ProgramUNESCAP United Nations Economic and Social Commission for Asia and the PacificUNFSS United Nations Forum of Sustainability StandardsUNU United Nations UniversityWHO World Health OrganizationWIID World Income Inequality DatabaseWITS World Integrated Trade SolutionWTO World Trade OrganizationWWF World Wildlife Fund

ix
INTRODUCTION
The 2030 Agenda for Sustainable Development and the Sustainable Development Goals (SDGs) suggest that countries achieve sustainable development in all three dimensions, that is, economic, social and environmental, simultaneously. In this context, international trade is expected to play its role as a means of implementation for the achievement of the SDGs.1 “Means of implementation” include factors that facilitate countries’ progress towards the achievement of sustainable development, such as public and private financial resources, capacity‐building, and transfer of environmentally sound technologies.2
Recognizing international trade as a means for achieving socioeconomic development is not a new phenomenon. At the establishment of the United Nations Conference on Trade and Development (UNCTAD) in 1964, the international community acknowledged that:
“Economic and social progress throughout the world depends in large measure on a steady expansion in international trade. The extensive development of equitable and mutually advantageous international trade creates a good basis for the establishment of neighbourly relations between States, helps to strengthen peace and an atmosphere of mutual confidence and understanding among nations, and promotes higher living standards and more rapid economic progress in all countries of the world” (UNCTAD, 1964).
In practice, however, it remains a considerable challenge to trade policymakers to map out interlinkages between trade policy and sustainable development, let alone to ensure that trade policy outcome positively influence sustainable development. In this increasingly globalised world, achieving the SDGs as universal agenda requires policy coherence at all (national, regional and global) levels, where trade policy and its policy and institutional interfaces with all the SDGs is one part of the jigsaw.
This report examines various interactions between trade policy, with a specific focus on market access conditions, and factors that constitute the basis for achieving sustainable development. Market access conditions vis-à-vis imports are determined by a combination of border measures and “behind the border” measures, both of which add costs to the price of an imported product. By generating significant impact upon consumer welfare and the competitiveness of domestic industries, market access conditions in international trade thus are a key determinant of the effectiveness of trade as a means of implementation.
Chapter I provides an overview of the report by examining to what extent sustainable development concerns are integrated into today’s trade policymaking. The chapter first looks into how those concerns are treated in trade agreements at multilateral, regional and bilateral levels. It then discusses opportunities as well as challenges in using market access conditions to meet sustainable development objectives.
Chapter II discusses the use of tariffs for trade and development purposes, and provides comprehensive statistical information on the trade-related “indicators” for the reviewing and monitoring of the implementation of the 2030 Agenda.
Chapter III discusses how NTMs can act as an important “policy interface” within the trade-SDG nexus at home as well as that of trading partners. The majority of NTMs are domestic regulations that cater for social and environmental development objectives. The chapter discusses ways to achieve synergies between policy measures for achieving the SDGs and enhancing trade flows across countries.

xTRADING INTO SUSTAINABLE DEVELOPMENT:
TRADE, MARKET ACCESS, AND THE SUSTAINABLE DEVELOPMENT GOALS
Chapter IV presents recent evidence on the importance of connectivity, especially maritime connectivity, to international markets. Enhancing physical connectivity to markets is one of the most effective policy actions to complement market access improvement for both exports and imports.
__________________1 See Paragraph 68 of the 2030 Agenda for Sustainable Development.2 See the issue brief by the Technical Support Team for the Open Working Group: Means of implementation; Global partnership for achieving sustainable development.

TRADE POLICYMAKING AND THE SUSTAINABLE DEVELOPMENT
I
This chapter greatly benefits from the discussions at the UNCTAD Ad-hoc Expert Meeting on Policy Interfaces between Trade and the SDGs, held on 12 October 2015 in Geneva, Switzerland (annex I).
1. International trade in the implementation of the 2030 Agenda for Sustainable Development
On 25th September 2015, the United Nations member States adopted the 2030 Agenda for Sustainable Development (from now on referred to as the 2030 Agenda). The SDGs, which are the key component of the 2030 Agenda, are to be achieved between 2016 and 2030 (United Nations, 2015a). The 17 goals and 169 targets included in the SDGs are to stimulate action over the next 15 years in five areas of critical importance for humanity that are: people, planet, prosperity, peace and partnership (box 1).
The SDGs build upon the outcomes of the Millennium Development Goals (MDGs), but are not a simple extension of the MDGs. While the MDGs were a set of individual goals, the SDGs aim at achieving sustainable development simultaneously in all three dimensions, that is, economic, social and environmental, paying maximum attention to interlinkages among them. In this respect, the SDGs and their associated targets are “integrated and indivisible” (Paragraph 18, the 2030 Agenda). With a view to consolidating various international efforts that already exist, many of the targets associated with the SDGs are taken directly from the existing multilateral conventions that aim at sustainable development (Tipping and Wolfe, 2015).
Prior to the adoption of the 2030 Agenda, the international community agreed on a set of “concrete policies and actions” for enhancing the effectiveness of trade as a means of implementation at the Third International Conference on Financing for Development, held in Addis Ababa, Ethiopia, in July 2015. The outcome document of the conference - titled the Addis Ababa Action Agenda - states that (United Nations, 2015b):
• “With appropriate supporting policies, infrastructure and an educated work force, trade can also help to promote productive employment and decent work, women’s empowerment and food security, as well as a reduction in inequality, and contribute to achieving the sustainable development goals” (paragraph 79);

TRADING INTO SUSTAINABLE DEVELOPMENT:TRADE, MARKET ACCESS, AND THE SUSTAINABLE DEVELOPMENT GOALS2
The preamble to the 2030 Agenda describes the areas of critical importance for humanity and the planet in the coming 15 years as:
• People – to end poverty and hunger and to ensure that all human beings can fulfil their potential in dignity and equality and in a healthy environment;
• Planet – to protect the planet from degradation, including though sustainable consumption and production, sustainably managing its natural resources and taking urgent action on climate change, so that it can support the needs of the present and future generations;
• Prosperity – to ensure that all human beings can enjoy prosperous and fulfilling lives and that economic, social and technological progress occurs in harmony with nature;
• Peace – to foster peaceful, just and inclusive societies which are free from fear and violence (there can be no sustainable development without peace and no peace without sustainable development);
• Partnership – to mobilize the means required to implement the Agenda through a revitalised Global Partnership for Sustainable Development, based on a spirit of strengthened global solidarity, focused in particular on the needs of the poorest and most vulnerable and with the participation of all countries, all stakeholders and all people.
The preamble concludes with stressing that focusing on the “interlinkages and integrated nature” of the SDGs will be crucial in realizing the purpose of the new Agenda.
Box 1. Five ‘P’s – Key areas of focus of the 2030 Agenda for Sustainable Development and the Sustainable Development Goals
• “We will endeavour to significantly increase world trade in a manner consistent with the sustainable development goals” (paragraph 82);
• “We will integrate sustainable development into trade policy at all levels” (paragraph 82); and
• “Recognizing that international trade and investment offers opportunities but also requires complementary actions at the national level, we will strengthen domestic enabling environments and implement sound domestic policies and reforms conductive to realizing the potential of trade for inclusive growth and sustainable development” (paragraph 88).
Table 1 presents selected key elements that have been included in the Addis Ababa Action Agenda, as a way to integrate sustainability concerns into trade policy. As shown, these elements are integrated into the SDGs as targets and goal-specific means of implementation of Goals 17, 2, 3, 8, 10, 14 and 15.3
1.1 Sustainable development concerns in the multilateral trading systemTarget 17.10 calls to promote “a universal, rules-based, open, transparent, predictable, inclusive, non-discriminatory and equitable” multilateral trading system under the World Trade Organization (WTO).4 The Addis Ababa Action Agenda calls for expeditious implementation of the development-oriented WTO ministerial decisions that the Doha Round of trade negations have so far agreed, such as those included in the 2013 Bali Ministerial Declaration and accompanying ministerial decisions, known informally as the Bali Package.5
These proposed actions reiterate the commitments that have been already agreed at WTO, or those that are expected to be included in the outcome of the Doha Round. They do not constitute new endeavours towards integrating sustainable development into the WTO framework beyond Article XX of the General Agreement on Tariffs and Trade (GATT) or Article XIV

I. Trade Policymaking and the Sustainable Development Goals 3
Goal 17. Strengthen the means of implementation and revitalize the global partnership for sustainable development
17.10
Addis Ababa Action Agenda (AAAA), para. 79
Promote a universal, rules-based, open, non-discriminatory and equitable multilateral trading system under the World Trade Organization (WTO) including through the conclusion of negotiations within its Doha Development AgendaWe will continue to promote a universal, rules-based, open, transparent, predictable, inclusive, non-discriminatory and equitable multilateral trading system under the WTO, as well as meaningful trade liberalization.
17.11
AAAA, para. 82
Significantly increase the exports of developing countries, in particular with a view to doubling the least developed countries (LDCs)’ share of global exports by 2020We will endeavour to significantly increase world trade in a manner consistent with the sustainable development goals, including exports from developing countries, in particular from LDCs with a view towards doubling their share of global exports by 2020 as stated in the Istanbul Programme of Action.
17.12
AAAA, para. 85
Realise timely implementation of duty-free and quota-free (DFQF) market access on a lasting basis for all LDCs consistent with WTO decisions, including by ensuring that preferential rules of origin applicable to imports from LDCs are transparent and simple, and contribute to facilitating market accessWe call on developed country WTO members and developing country WTO members declaring themselves in a position to do so to realize timely implementation of DFQF market access on a lasting basis for all products originating from all LDCs consistent with WTO decisions. We call on them to also take steps to facilitate market access for products of LDCs, including by developing simple and transparent rules of origin applicable to imports from LDCs, in accordance with the guidelines adopted by WTO members at the Bali ministerial conference in 2013.
Goal 2. End hunger, achieve food security and improved nutrition and promote sustainable agriculture
2.b*
AAAA, para. 83
Correct and prevent trade restrictions and distortions in world agricultural markets, including through the parallel elimination of all forms of agricultural export subsidies and all export measures with equivalent effect, in accordance with the mandate of the Doha Development RoundIn accordance with one element of the mandate of the Doha Development Agenda, we call on WTO members to correct and prevent trade restrictions and distortions in world agricultural markets, including through the parallel elimination of all forms of agricultural export subsidies and disciplines on all export measures with equivalent effect.
Goal 3. Ensure healthy lives and promote well-being for all at all ages
3.b*
AAAA, para. 86
(…) provide access to affordable essential medicines and vaccines, in accordance with the Doha Declaration on the TRIPS Agreement and Public Health, which affirms the right of developing countries to use to the full the provisions in the Agreement on Trade-Related Aspects of Intellectual Property Rights regarding flexibilities to protect public health and, in particular, provides access to medicines for allWe reaffirm the right of WTO members to take advantage of the flexibilities in the WTO Agreement on Trade-Related Aspects of Intellectual Property Rights (TRIPS) and reaffirm that the TRIPS Agreement does not and should not prevent members from taking measures to protect public health.
Goal 8. Promote sustained, inclusive and sustainable economic growth, full and productive employment and decent work for all
8.a*
AAAA, para. 90
Increase Aid For Trade support for developing countries, particularly LDCs, including through the Enhanced Integrated Framework for LDCsWe will strive to allocate an increasing proportion of Aid for Trade going to LDCs, provided according to development cooperation effectiveness principles.
Goal 10. Reduce inequality within and among countries
10.a*
AAAA, para.84
Implement the principle of special and differential treatment (SDT) for developing countries, in particular LDCs, in accordance with WTO agreementsMembers of WTO will continue to implement the provision of special and differential treatment for developing countries, in particular LDCs, in accordance with WTO agreements.
Goal 14. Conserve and sustainably use the oceans, seas and marine resources for sustainable development
14.6
AAAA, para.83
By 2020, prohibit certain forms of fisheries subsidies which contribute to overcapacity and overfishing, eliminate subsidies that contribute to illegal, unreported and unregulated fishing and refrain from introducing new such subsidies, recognizing that appropriate and effective special and differential treatment for developing and least developed countries should be an integral part of the World Trade Organization fisheries subsidies negotiationWe call on WTO members to commit to strengthen disciplines on subsidies in the fisheries sector, including through the prohibition of certain forms of subsidies that contribute to overcapacity and overfishing in accordance with the mandate of the Doha Development Agenda and the Hong Kong Ministerial Declaration.
Goal 15. Protect, restore and promote the sustainable use of terrestrial ecosystems […] and halt biodiversity loss
15.c*
AAAA, para.92
Enhance global support for efforts to combat the poaching and trafficking of protected species, including by increasing the capacity of local communities to pursue sustainable livelihood opportunities We resolve to enhance global support for efforts to combat poaching of and trafficking in protected species, trafficking in hazardous waste, and trafficking in minerals, including by strengthening both national regulation and international cooperation and increasing the capacity of local communities to pursue sustainable livelihood opportunities.
* In the SDGs other than Goal 17, goal-specific means of implementation are listed along with the targets, but are distinguished from the targets by being ordered alphabetically.
Table 1. Selected trade-related means of implementation in the SDGs and the Addis Ababa Action Agenda (AAAA)

TRADING INTO SUSTAINABLE DEVELOPMENT:TRADE, MARKET ACCESS, AND THE SUSTAINABLE DEVELOPMENT GOALS4
of the General Agreement on Trade in Services (GATS) and the existing special and differential treatments for developing countries in various WTO Agreements.6
In practice, there have been other, albeit fragmentary, attempts towards addressing social and environmental sustainability concerns within the GATT/WTO framework, as the following.
Under the Doha Development Agenda: The mandate of the ongoing Doha Round of trade negotiations proposes that WTO members negotiate, among others: the relationship between existing WTO rules and specific trade obligations set out in multilateral environmental agreements (MEAs); the relationship between the WTO Agreement on Trade-Related Aspects of Intellectual Property Rights (TRIPS Agreement) and the Convention on Biological Diversity; the TRIPS Agreement and public health; and the reduction or elimination of tariff and non-tariff barriers to environmental goods and services, including fishery subsidies (see paragraphs 31–33 of the Doha Ministerial Declaration).7 While the negotiations on the entire Doha Agenda continue, there have been a number of Ministerial agreements that address sustainability concerns, such as the 2003 Decision of the General Council (related to the TRIPS Agreement and public health) on the waiver given to LDCs (that removes limitation on exports under compulsory licence to countries that cannot manufacture the pharmaceuticals themselves), and the 2013 Ministerial Decisions on pubic stockholding and food security purposes.8
WTO and public health: The TRIPS Agreement governs the international protection of intellectual property rights. With the emergence of major public health threats like the HIV epidemic, and the continued high prevalence of tuberculosis and malaria in developing countries, there was a recognition that the flexibilities of the current intellectual property regimen should be further implemented in order to emphasize the primacy of public health over trade. At the Doha Ministerial Conference in 2001, the WTO members adopted the Doha Declaration on the TRIPS Agreement and Public Health, which acknowledged, among others, the importance of extending TRIPS waiver
on pharmaceuticals for LDCs and the right for WTO members to make full use of the flexibilities provided in the TRIPS agreement, including compulsory licences.9 Following the adoption of the SDGs in September 2015, the WTO’s Council for TRIPS in November 2015 decided to extend the period during which key provisions of the TRIPS Agreement do not apply to pharmaceutical products, e.g. concerning whether or not to protect pharmaceutical patents and clinical trial data, at least until 2033.10 In 2003, the General Council agreed on a waiver to enable exporting countries to grant compulsory licences for products destined for eligible importing countries. The content of the 2003 waiver was transformed into an Amendment of the TRIPS Agreement, adopted by the General Council on 6 December 2005, which was reaffirmed in Article 40 of the Hong Kong Ministerial Declaration on 18 December 2005. However, the amendment will not take effect until two thirds of the WTO member States ratifies it, which is not yet the case. The deadline for acceptation has been extended several times and is currently 31 December 2017.11 In the meantime, the 2003 waiver continues to apply for all member States, though the amendment has been rarely applied in practice.12
WTO and environmental concerns: Various WTO Agreements recognise the need for trade-related policies to reflect environmental concerns.13 Then in July 2014, with a specific focus on goods that are supposed to contribute to environmental protection and climate change mitigation, 14 WTO members launched plurilateral negotiations on the Environmental Goods Agreement.14 The plurilateral negotiations aim at the reduction or elimination of barriers facing trade in environmental goods. The adoption of the Paris Agreement at the twenty-first Conference of the Parties to the United Nations Framework Convention on Climate Change (COP 21) on 11th December 2015 may provide added impetus to the participating WTO members to conclude the negotiations, possibly during 2016. Chapter II discusses market access in environmental goods in more detail. In addition, there have been a number of so-called environmental disputes under GATT and under the WTO Dispute Settlement Body, such as the “tuna-dolphin cases” (rulings adopted in 1991 and 1994) and the “shrimp-

I. Trade Policymaking and the Sustainable Development Goals 5
turtle case” (ruling adopted in 1998), which examined the GATT/WTO compatibility of environment-related measures under GATT Article XX.
WTO and labour standards: The 1996 Singapore Ministerial Declaration confirms that all the WTO members are committed to “the observance of internationally recognized core labour standards” and reject “the use of labour standards for protectionist purposes”. However, the same declaration put the matters concerning the interlinkages between trade, trade liberalization and labour issues outside the WTO negotiating framework: it designates the International Labour Organization (ILO) as the competent body to set and deal with these standards.15
Will the multilateral trading system further integrate sustainability concerns in its agreements during the implementation of the SDGs? The successful adoption of the Paris Agreement at COP 21 in December 2015 supported a growing recognition of the need to create “a virtuous circle of trade and environmental policies which promote sustainable production and consumption while being pro-growth and development”.16 Subsequently, the WTO 10th Ministerial Conference, held in Nairobi, Kenya, on 15–19 December 2015, recognized the role that “the WTO can play in contributing towards achievement of the 2030 Sustainable Development Goals, in so far as they relate to the WTO mandate, and bearing in mind the authority of the WTO Ministerial Conference”.17
At the time of writing this chapter, it remains uncertain what actions the WTO members would take to enhance contribution of the WTO rules towards the achievement of the SDGs. The question hangs first on the prospect of the conclusion of the Doha Round of trade negotiations. The continuation of the Doha Round effectively prevents the members to start negotiating on the issues other than those mandated under the Doha Development Agenda. At the Nairobi Ministerial Conference, a group of countries apparently supported the view that “we need to write a new chapter for WTO that reflects today’s economic realities” by “freeing ourselves from the strictures of Doha” that would “allow us to explore emerging trade issues”.18 Contrary to this view is that the development dimension of the
Doha Development Agenda is essential to stimulate trade growth in a more sustainable manner, thus any new issues should be addressed after the conclusion of the Doha Round of negotiations. The Nairobi Declaration acknowledges the disagreement among the WTO members,19 but does not suggest when and how they should agree on the future of the Doha
Round.20
1.2 Sustainable development concerns in trade agreements outside the World Trade Organization
Outside the multilateral trading system, a growing number of bilateral, regional or interregional trade agreements incorporate provisions that address social and developmental concerns.21
The most common sustainability provision in recent regional trade agreements (RTAs) may be the one concerning labour standards. According to the International Labour Organization (ILO), the number of trade agreements containing labour provisions increased significantly from only 4 in 1995 to 21 in 2005, and 47 in 2011 (Agustí-Panareda et al., 2014). Labour provisions are included either in the trade agreement itself or in a parallel agreement.22 Such provisions typically require the signatories to an RTA to comply with certain internationally agreed labour standards, such as the 1998 ILO Declaration on Fundamental Principles and Rights at Work and its Follow-up, or to enforce and maintain domestic labour laws. The scope of “enforceability” differs across the different RTAs that include labour provisions. It may focus solely on promotional activities such as technical cooperation and dialogue on social development and environmental protection. In other cases, it may apply a dispute settlement mechanism that may provide for, as a last resort, a form of sanctions also known as conditional elements (ILO, 2013).23
Another common “sustainability provision” in RTAs is the one on environmental protection. The first major RTA to include the environmental provision was the North American Free Trade Agreement (NAFTA),

TRADING INTO SUSTAINABLE DEVELOPMENT:TRADE, MARKET ACCESS, AND THE SUSTAINABLE DEVELOPMENT GOALS6
which was concluded in 1994. NAFTA contains “legally-binding” environmental provisions in the body of the agreement, accompanied by a side agreement, the North American Agreement on Environmental Cooperation. It has been observed, however, that “no Party has ever brought a formal case based on the environmental provisions of any U.S. FTA”.24
More recently, the Trans-Pacific Partnership (TPP) agreement includes a chapter on the environment, the provisions of which can be enforced through the dispute settlement procedure of the TPP. Chapter 20 of the TPP is the provision concerning the environment; it addresses, in 23 articles, a wide range of issues related to the trade-environment nexus, including trade in wildlife, fishery subsidies, trade in environmental goods and services, biodiversity, and the transition to a low-emission economy. The commitments under the environment chapter are subject to the TPP dispute settlement arrangements outlined in chapter 28, including the availability of trade sanctions.
According to the Organisation for Economic Co-operation and Development (OECD) Joint Working Party on Trade and Environment (JWPTE), basic environmental provisions, such as exceptions based on GATT Article XX or GATS Article XIV or a reference in the preamble, were already common in RTAs in the early 2000s (OECD, 2015). Since 2010, there has been an upward trend in the inclusion of more “substantive” environmental provisions in RTAs, such as those that refer to environmental cooperation, public participation, dispute settlement, coverage of specific environmental issues, specific provisions on MEAs and implementation mechanisms (OECD, 2014). There are currently over 250 MEAs in force dealing with various environmental issues; about 20 of these include provisions that can affect trade.25
The main driver for an environmental provision being included in an RTA may be different across RTAs, as well as across the member countries within an RTA. The OECD JWPTE has identified four main policy drivers for the inclusion of environmental provisions in RTAs: (i) promoting sustainable development; (ii) ensuring a level playing field between members; (iii) enhancing cooperation; and (iv) pursuing environmental objectives
more efficiently (Tébar Less and Gigli, 2008). In a North–South RTA, the order of priority of these drivers can be very different between developing- and developed-country members. Moreover, they may differ in their interpretation of the drivers. As regards “ensuring a level playing field”, for example, this may signify to developed country members a means to protect the existing comparative advantage on “sustainable production” that they already follow according to their domestic environmental regulations. Developing country members, on the other hand, may consider this as a way to effectuate dissemination and diffusion of environmental technologies in such a way as to improve the competitiveness of their own producers in the markets of the RTA members. Using an RTA for acquiring environmental knowledge and technology is of particular interest to developing countries whose cost of implementing the environmental provisions would be disproportionally higher.26
In general, environmental provisions in trade agreements stand as a pertinent example of how sustainable development can be integrated into trade policy at the international level. But have they achieved the “win-win-win” situation where: (i) trade and environmental policies have promoted trade in environmental goods and services; (ii) enhanced sustainable patterns of production and consumption in all countries; thereby (iii) increasing the future prospect of sustainable development?27 If so, at what and whose cost has it been achieved?
Two case studies illustrate the difficulties in identifying the causal impact of NAFTA’s environmental provisions on economic and environmental outcomes. One study examines whether Mexico has suffered economically from the environmental provisions in NAFTA (Miller, 2002). While the overall economic impact of NAFTA on Mexico seems clearly positive, it is not possible to determine whether the overall economic effect would have been better or worse without the inclusion of environmental provisions. This study does not conclude on the ceteris paribus effects of the inclusion of environmental provisions, which would, however, be of considerable interest, especially when a developing country’s expected economic benefits from an RTA are less important than those of NAFTA for Mexico.

I. Trade Policymaking and the Sustainable Development Goals 7
Another study observes that, from the environmental point of view, air pollution in Mexico has been reduced after the adoption of NAFTA, thanks to new investment and technologies to improve the energy efficiency of the production technology (Gallagher, 2002). It was not possible, however, to attribute this positive environmental effect to the presence of the NAFTA’s environmental provisions. In industries (in which pollution is mainly determined by by-product waste), pollution was still relatively high 8 years after the agreement had entered into force. Both examples illustrate the difficulty of assessing the causal impact of a particular RTA on both economic and environmental outcomes, and the even greater difficulty of separating the impact of its environmental provisions from the rest.
Finally, it is important to look into possible impact of FTAs on public health. A joint issue brief of UNDP and UNAIDS (2012) suggests that a growing number of bilateral and regional trade agreements contain clauses on intellectual property that are “TRIPS-plus”, i.e. stricter than the standards set out under the WTO TRIPS Agreement. The issue brief states that TRIPS-plus provisions of a RTA can limit the flexibilities agreed under the TRIPS by, among others: broadening patentability which may create the risk of “evergreening” of pharmaceutical patents; restricting patent oppositions; extending patent duration; and IP enforcement requirement.28 Such TRIPS-plus provisions may result in a significant increase in the prices of medicines and reduction in access to treatment.29
2. Opportunities and challenges in using trade policy for the achievement of the SDGs
We now turn to opportunities and challenges at the national level with respect to influencing market access conditions to meet sustainable development objectives.
2.1 Trade as a means of implementation
Let us first examine how trade may function as a means of implementation for attaining the SDGs. As a financial means, international trade can be an important source of finance to both the private sector and the public sector in developing countries. In many low-income countries, exports of goods and services account for 50 per cent or more of their gross domestic product (GDP) (UNCTAD, 2015). In 2013, for instance, the total merchandise export earning of least developed countries (LDCs) (at US$ 213 billion) was twice as great as the combined amount of foreign direct investment (FDI) inflow (US$ 28 billion), remittances (US$ 31 billion) and official development assistance, (US$ 43 billion) received by LDCs in the same year (UNCTAD, 2014).30
As regards the public sector, trade policy could be used to raise the public revenue. A government can raise revenues, for instance, via: (i) imposing tax on imported goods and services (i.e. tariff revenues); (ii) imposing tax on exported goods and services (e.g. export tax); and (iii) claiming certain proceeds from commodity exports.31 Such trade-related taxes can carry a significant weight in the public revenue of low-income countries that face limited capacity of public revenue collection (Alouis and Gideon, 2013).32 The revenue raised by trade-related measures can constitute around 10–25 per cent of the total public revenue of low-income countries (Cagé and Gadenne, 2014). Using trade policy for raising public revenue however comes with the risk of causing trade distortion to the domestic market, which reduces welfare of different segments of people in the society.
Trade policy can also act as a non-financial means in the implementation of the SDGs by interacting with various factors that influence social and environmental sustainability. Box 2 presents the views of three development practitioners on how trade policy can exert impact upon (i) ensuring adequate nutrition, (ii) facilitating access to essential treatments, and (iii) protecting the ecosystem. These cases suggest that trade policymaking will need to pay greater attention to the impact of trade growth upon social and environmental development. That is, in addition to

TRADING INTO SUSTAINABLE DEVELOPMENT:TRADE, MARKET ACCESS, AND THE SUSTAINABLE DEVELOPMENT GOALS8
At the UNCTAD Ad-hoc Expert Meeting on Policy Interfaces between Trade and the SDGs (12 October 2015, Geneva), development practitioners elaborated various cases of interactions between trade, trade policy and factors that influence sustainable development in the social and the environmental dimensions. Some of the examples presented at the meeting are summarises below.
Trade policy impact on nutrition (by Marc Van Ameringen, Executive Director of the Global Alliance for Improved Nutrition): By directly influencing relative prices of food products, trade policies determine what food to produce, where to produce, to whom to sell and at what price. From a food and nutrition point of view, the global food system today may be slightly off-balance. On one side of the scale were the 800 million people who went hungry every day; on the other side were the 1.9 billion people struggling with obesity and overweight, while about one third of all food production was thrown away. The current global trading system may have exacerbated this situation. We would need to examine how to reform agricultural trade policy less through the lens of trade liberalization and more through the lens of access to food and quality nutrition, in a way that would see adequate regulations supporting farmers to grow and sell nutritious foods and help consumers opt out from cheap but unhealthy diets, such as those high in calories but low in micronutrients;
Trade policy impact on health (by Carlos Passarelli, Senior Expert, Joint United Nations Programme on HIV/AIDS): Trade policy and emergence of the human immunodeficiency virus (HIV) epidemic, particularly in developing countries, have interacted in various ways. First, trade policy and the protection of trade-related intellectual property rights influence the availability and affordability of HIV treatment for people. Second, it was the recognition of the damaging impact of the HIV epidemic on development, particular in Africa, that motivated the WTO members to agree on the 2001 WTO Doha Declaration on the TRIPS Agreement and Public Health33 and the subsequent amendment of the TRIPS Agreement. Competition within the pharmaceutical industry had a tremendous impact in scaling-up access to medicines, by resulting in a significant fall in the cost of HIV treatment. The cost per patient per year fell from around US$ 10,000 in 2001 to US$ 100 in 2012. Looking towards the future, however, the proliferation of bilateral and regional free trade agreements (FTAs) may reduce the policy option for the use of the TRIPS flexibilities. There have been indications that certain FTAs contained the provisions on intellectual property rights that are more demanding than those under the TRIPS agreement, which could prevent developing countries members from using the TRIPS flexibilities (like compulsory licenses);
Trade policy impact on the ecosystem (by Elisabeth Losasso, Special Project Coordinator, WWF International): Trade policy interacts with a country’s environmental conditions through leaving ecological footprints, as well as through influencing the production and consumption patterns that could generate serious externalities. Increased trade flows could exacerbate the ecosystem loss, for example, though air and water pollution, industrial waste and biodiversity loss, unless effective environmental policies were put in place and the value of natural and environmental capital recognized. One specific interaction between trade and the environment would be rampant illegal trade in wildlife, including the endangered species. Effective trade policy could complement the Convention on International Trade in Endangered Species of Wild Fauna and Flora by ensuring that highly traded commodities (e.g. seafood, timber, soy, beef and palm oil) were at minimum legally and sustainably produced and traded.
Box 2. Interactions between trade policy and sustainable development in social and environmental dimensions

I. Trade Policymaking and the Sustainable Development Goals 9
traditional policy questions addressing “how much to trade what with whom”, trade policymakers may need to examine if the country trades in a manner consistent with the SDGs.
2.2 Potential impacts of market access conditions on sustainable development
In the sphere of political economy, the government may use trade policy on domestic market conditions as a strategic tool to address social and environmental outcomes. Nicita, Olarreaga and Porto (2014), for instance, suggest that a government may change trade policy in a way that will make it “pro-poor”, by ensuring that the intended trade policy change increases the income of the poorer households more than that of the richer households.34
A pro-poor trade policy may be a valid option for influencing the availability, accessibility, affordability and quality of goods and services that are essential for the social development of the poor. For instance, a high tariff rate imposed on a mosquito net in countries where malaria is rampant could result in a high rate of child mortality from the disease. According to Cernat (2011), removing such a “killer tariff” in six selected African countries would significantly reduce the price of mosquito nets, which in turn could allow some 100,000 more children in these countries to have access to a life-saving product. Shephard (2015) suggests that trade policy, including the improvement of trade logistics and trade facilitation, can help to increase the impact of trade upon health in ways other than through income and productivity channels e.g. via increasing the rate of children vaccinated against certain diseases.
Note that assessing causal linkages between market access and a wide spectrum of determinants of sustainable development, for example, food security, health, economic productive capacity and environmental soundness, remains technically challenging due to unclear causal effects between them. Influences between trade and these determinants flow both ways. New researches on interlinkages between trade and social and environmental sustainability
are being made, such as a thought-provoking study on a possible linkage between trade policy and the likelihood of conflict within a country (Berman and Couttenier, 2015).35
Also important to note is that market access has different impact upon different people, depending on whether they are of poorer households or richer ones, male or female, rural residents or urban residents, etc. Different social groups have their own patterns of production and consumption, and the sign and the magnitude of the income effect from trade liberalization depends on whether the trade-induced changes in relative prices favour the consumption bundle of a person or which employment sector he/she belongs to and in what function, and so on. For example, certain agricultural producers may be in favour of higher tariffs that maintain relatively high domestic price for their products, but that can reduce the welfare of urban low-income consumers as well as certain farmers who are net-consumers of agricultural products. UNCTAD’s analytical work on the impact of trade liberalization on gender equality shows that trade liberalization has mixed impacts upon female workers (UNCTAD, 2014). Women may get stable wage employment, but they may receive low salaries and limited opportunities for skill development. In order to ensure that trade policy change will not reproduce or exacerbate existing inequalities, the government needs to design and implement measures that are complementary to a shift in trade policy. In the absence of “clear empirical regularities” between trade policy changes and the determinants of sustainable development, the assessment of the effectiveness of pro-poor or pro-sustainability trade policy should necessarily be country specific (Winters, 2000).
2.3 Need for complementary actions to link trade and the SDGs
In reality, whether trade growth generates positive or negative impact upon the achievement of sustainable development is very much context specific. The United Nations Development Programme (UNDP) Human Development Report 2013 elaborates this point using

TRADING INTO SUSTAINABLE DEVELOPMENT:TRADE, MARKET ACCESS, AND THE SUSTAINABLE DEVELOPMENT GOALS10
the Human Development Index (HDI) (UNDP, 2013).36 The report finds that almost all the countries that experienced a significant increase in the trade-to-GDP ratio in 1990–2010 improved their HDI scores on the social dimensions (i.e. health and education).37 However, the reverse was not true. A significant portion of countries (about 15 out of 105 studied) exhibited negative change in the HDI scores despite an increase in the trade-to-GDP ratio.
The Addis Ababa Action Agenda elaborates the need for “complementary actions” to accompany trade policy changes with a view to preparing a “domestic enabling environment”. Complementary actions help households and businesses to capture economic opportunities arising from trade (Winters, 2000). Complementary actions are desired particularly in economic sectors where market failure exists, such as the areas related to connectivity to markets (e.g. transport and distribution services), access to trade finance (financial services) and entrepreneurship development. Measures that guarantee social protection, as an important complementary action, can ensure that the gains from trade are distributed widely across the economy (Francois et al., 2011). Competition policy is another example of complementary actions. By preventing or reducing anti-competitive practices, such as cartels and monopolies, competition policy enhances the participation of micro, small and medium-sized enterprises in trade-related businesses, and for them to defend their income-generating capacity vis-à-vis enterprises exercising their market power.38
3. Concluding remarks
As an overview of the report, this chapter examined if and to what extent trade policymaking today incorporates sustainable development concerns at different levels.
In the multilateral trading system under WTO, there have been various attempts towards addressing social and environmental concerns, but in a fragmentary manner. The 10th WTO Ministerial Conference at Nairobi in December 2015 recognised that WTO could play a role in contributing towards the achievement of the SDGs. It remains uncertain, however, whether the WTO members would start taking tangible actions for this purpose.
An increasing number of trade agreements outside the multilateral trading system incorporates provisions on issues such as labour standards and environmental protection. The extent of the coverage of such provisions as well as their enforceability varies widely across different RTAs. Analysis on the impact of such provisions upon trade flows and social and environmental sustainability in countries within and outside the RTA has been limited. Future in-depth studies on this question, across different existing RTAs, may shed light on how such provisions may contribute to making trade work for sustainable development.
At the national level, the sign and the magnitude of the impact of market access conditions upon sustainable development varies across countries, and among different segments of society within a country. It depends on various exogenous and endogenous factors facing a country, including country size, geographical location, composition of exports and imports, connectivity to major markets, availability of natural resources, level of development and institutional strength. For this reason, analysis on the best “use” of trade policy for making trade contribute to the promotion of sustainable development should be country-specific.

I. Trade Policymaking and the Sustainable Development Goals 11
ANNEX: Program of the Ad-Hoc Expert Meeting on Policy Interfaces between Trade and the SDGs, 12 October 2015, United Nations, Geneva
The objective of the Ad-hoc Expert Meeting on Policy Interfaces between Trade and the SDGs was to illuminate policy interfaces between trade and the SDGs, with particular attention paid to how practitioners outside the trade community view the benefit, or the detriment, of trade to sustainable development in their own areas. Interactive debate focused on: (i) What are the key areas for policy coordination to make trade work for the SDGs; (ii) How can such policy coordination be accomplished; and (iii) How can we “measure” the effectiveness of such policy coordination for future reviewing and monitoring of the trade-SDG linkages.
Program
09.40-10.00 Registration
10.00-10.10 Welcoming and introductory remarks
10.10-11.30 Session I: Does trade really matter to the SDGs? Views from development practitioners
This session: (i) heard from development practitioners on how international trade interacted with their daily work in promoting sustainable development in different countries; and (ii) discussed what might be “policy interfaces”, or areas for policy coordination needed to make trade work for improving a country’s capacity to achieve the SDGs.
Speakers (in alphabetical order)
• David Cheong, Trade and Employment Specialist, ILO• Elisabeth Losasso, Project Manager, WWF International• Carlos Passarelli, Senior Expert, UNAIDS • Marc Van Ameringen, Executive Director, Gain - Global Alliance for Improved Nutrition
11.40-12.50 Session II: How do we make trade contribute to the SDGs? Can we “measure” it?
Building upon the discussions at the 1st session, this session: (i) drew upon findings from success-ful policy coordination to use trade for social and/or environmental objectives; and (ii) discussed approaches to measure or assess effectiveness of such policy coordination for future reviewing and monitoring of the trade-SDG linkages. UNCTAD experiences • Trade and Gender Program - Simonetta Zarrilli, UNCTAD • Bio-Trade Initiative - Bonapas Onguglo, UNCTAD
Discussants (in alphabetical order)
• Giorgia Giovanetti, Professor of Economics, University of Florence• Katherine Hagen, Executive Director, Global Social Observatory • Jordie Keane, Economic Advisor, Commonwealth Secretariat• Lichia Saner Yiu, President, Centre for Socio-economic Development -CSEND
12.50-13.00 Wrapping up and the way forward

TRADING INTO SUSTAINABLE DEVELOPMENT:TRADE, MARKET ACCESS, AND THE SUSTAINABLE DEVELOPMENT GOALS12
Program
14.30-14.45 Introduction
14.45-16.00 Session III: Can trade policy affect the SDGs?
Questions: Can we think of trade policy instruments that can be designed (or regulated) and implemented (removed) to address the SDG targets?
16.10-17.25 Session IV: Can we use NTMs to achieve some SDGs?
Questions: Can we use non-tariff measures (NTMs) to achieve the SDG targets?
Discussants for Both Sessions:
• Emma Aisbet, Professor, University of Hamburg• Maria Carvalho, Researcher, London School of Economics • Mathieu Couttenier, Professor, University of Lausanne• Giorgia Giovanetti, Professor, University of Florence• Jodie Keane, Trade Analyst, Common Wealth Secretariat• Robert Koopman, Chief Economist, World Trade Organization• Marcelo Olarreaga, Professor, University of Geneva• Ben Shephard, Economic Analyst, Developing Trade Consultants• Lichia Yiu, Founder, Centre for Socio-Economic Development (CSEND)
17.25-17.30 Wrap-up and the way forward

I. Trade Policymaking and the Sustainable Development Goals 13
solution, the negotiations on this subject shall be held in the Committee on Agriculture in Special Session (“CoA SS”), in dedicated sessions and in an accelerated time-frame, distinct from the agriculture negotiations under the Doha Development Agenda (WT/MIN(15)/44 and WT/L/979). See WTO website on the outcome of the 2015 Nairobi Ministerial Conference (https://www.wto.org/english/thewto_e/minist_e/mc10_e/nairobipackage_e.htm).
9 Compulsory licensing implies that the government gives the right to produce a patented product to someone other than the patent holder without the patent holder’s consent (though patent holders are remunerated in those circumstances). According to TRIPS Article 31(f), products made under compulsory licensing must be “predominantly for the supply of the domestic market” which is at times considered controversial.
10 See WTO News Item 6 November 2015, WTO members agree to extend drug patent exemption for poorest members, (https://www.wto.org/english/news_e/news15_e/trip_06nov15_e.htm).
11 There are other developments on the interconnections between IP, trade and public health outside the WTO framework. The WHO Commission on Intellectual Property (IP), Innovation and Public Health in 2006 paved the way for WHO members to adopt the Global Strategy and Plan of Action on IP, Innovation and Public Health (2008) and the subsequent Consultative Expert Working Group on Research and Development: Financing and Coordination. Another important forum, the Global Commission on HIV and the Law. Its report launched in 2012 has a chapter on the impact of IP rights on access to medicines. As a result of the recommendations of this commission, the Secretary-General of the UN has convened in November, 2015, a High-Level Panel on access to medicines to discuss and promote policy coherence to ensure access to innovation.
12 The amendment poses many difficulties in its practicality to both importers and exporters of pharmaceutical products. The Global Commission on HIV and the Law has suggested that WTO General Council Decision on this mechanism has not proved
Endnotes3 Beyond the multilateral trading framework, the Addis Ababa Action Agenda also calls for concrete policy actions aiming at enhancing regional economic integration and interconnectivity, trade-related technical assistance (e.g. Aid for Trade) and developmental concerns in trade and investment agreements, among others.
4 See Paragraph 79 of the Addis Ababa Action Agenda.
5 The Bali Package presents a number of agreements that would influence the effectiveness of trade as a means of achieving sustainable development, such as those on: trade facilitation (WT/MIN(13)/36 or WT/L/911); public stockholding for food security purposes (WT/MIN(13)/38 or WT/L/913); and preferential rules of origin for least developed countries (WT/MIN(13)/42 or WT/L/917).
6 Article XX of GATT and Article XIV of GATS provide general exception from the agreements, i.e. countries may undertake measures that may violate the contents of the agreements if these are necessary to protect, e.g., human, animal or plant life or health or relating to the conservation of exhaustible natural resources as long as they do not constitute protectionism in disguise.
7 These are excerpts from the WTO Doha Ministerial Declaration (WT/MIN(01)/DEC/1), except on TRIPS and public health, which was adopted in the separate Doha Declaration on the TRIPS Agreement and Public Health (WT/MIN(01)/DEC/2).
8 The WTO Agreement on Agriculture considers that the government’s purchase of food at the administered price (which is often higher than the market price) is subject to the reduction commitment, even for it is for the pubic stockholding for food security. The 2013 Bali Ministerial Conference agreed that the existing programme should be shielded from any legal challenge under the Agreement on Agriculture until a permanent solution is found (WT/MIN(13)/38 and WT/L/913). The 2015 Nairobi Ministerial Conference agreed that, in order to achieve such permanent

TRADING INTO SUSTAINABLE DEVELOPMENT:TRADE, MARKET ACCESS, AND THE SUSTAINABLE DEVELOPMENT GOALS14
(i.e. other than the continuation of the Doha Agenda) to achieve meaningful outcomes in multilateral negotiations.
20 See WTO News Item 19 December 2015, DG Azevêdo’s address to the MC10 closing ceremony (ht tps://www.wto.org/english/news_e/spra_e/spra108_e.htm). The WTO Director-General stated at the closing of the Nairobi Ministerial that “The Ministerial Declaration acknowledges the differing opinions. And it instructs us to find ways to advance negotiations in Geneva. Members must decide — the world must decide — about the future of this organization. (…) Inaction would itself be a decision. And I believe the price of inaction is too high.”
21 As regards autonomous preferential trade arrangements, one of the first attempts to include environmental provisions was the Generalised Scheme of Preferences (GSP) of the European Union. The GSP grants preferential tariff rates to developing country trade partners on a non-reciprocal basis. In 2005, the European Union started a special incentive scheme “for sustainable development and good governance”, or GSP+ (plus), which grants zero duties for essentially the same GSP tariff lines to countries which ratify and effectively implement core international human rights, labour rights, environment and good governance conventions. The current beneficiaries of the GSP+ are: Armenia, Bolivia (Plurinational State of), Cabo Verde, Costa Rica, El Salvador, Georgia, Guatemala, Mongolia, Panama, Paraguay, Peru and the Philippines. See the European Commission website (http://ec.europa.eu/trade/policy/countries-and-regions/development/generalised-scheme-of-preferences/) for more detail on the GSP and the GSP+ schemes.
22 As in the case of the North American Agreement on Labor Cooperation (NAALC), a side agreement of the North American Free Trade Agreement (NAFTA) for dealing with labour trade-related issues with NAFTA.
23 For example, the United States and Canada usually include a dispute settlement mechanism within their trade agreements and the possibility of enforcing sanctions in the case that labour provisions are not respected. The European Union and New Zealand, on the other hand, focus on dialogue and cooperation
to be a viable solution for countries with insufficient pharmaceutical manufacturing capacity”. It is therefore recommended a revision of the mechanism established by the TRIPS amendment, “to allow the easier import of pharmaceutical products produced under compulsory licence.
13 The WTO Agreement on Agriculture (Annex 2, Paragraph 13), for example, exempts government payments to agricultural producers under environmental or conservation programs from the commitments to reduce agricultural production subsidies.
14 The 14 WTO members are: Australia; Canada; China; Chinese Taipei; Costa Rica; the European Union; Hong Kong, China; Japan; New Zealand; Norway; Singapore; the Republic of Korea; Switzerland; and the United States of America. See WTO News Item
8 July 2014, Azevêdo welcomes launch of plurilateral environmental goods negotiations (https://www.wto.org/english/news_e/news14_e/envir_08jul14_e.htm).
15 See Labour standards: consensus, coherence and controversy (https://www.wto.org/english/thewto_e/whatis_e/tif_e/bey5_e.htm).
16 See WTO News Item 9 December 2015, DDG Brauner urges trade community to build on COP21 momentum and support climate action (https://www.wto.org/english/news_e/news15_e/ddgra_09dec15_e.htm).
17 Paragraph 8 of the WTO Nairobi Ministerial Declaration (WT/MIN(15)/DEC), adopted 19 December 2015.
18 Financial Times, We are at the end of the line on the Doha Round of Trade Talks by Michael Froman (http://www.ft.com/intl/cms/s/0/4ccf5356-9eaa-11e5-8ce1-f6219b685d74.html#axzz3xrfULupj), the United States trade representative (13 December 2015).
19 In paragraph 30, the WTO Nairobi Ministerial Declaration (https://www.wto.org/english/thewto_e/minist_e/mc10_e/mindecision_e.htm) states that, while “many Members reaffirm the Doha Development Agenda (…) and reaffirm their full commitment to conclude the DDA”, others called for “new approaches”

I. Trade Policymaking and the Sustainable Development Goals 15
rather than on elements of conditionality. South–South trade agreements, especially those concluded by Chile, also focus on dialogue and cooperation.
24 See Trans-Pacific Partnership and the Environment: An Assessment of Commitments and Trade Agreement Enforcement (http://www.ciel.org/wp-content/uploads/2015/11/TPP-Enforcement-Analysis-Nov2015.pdf), Center for International Environmental Law (2015).
25 A list of the 20 MEAs which include trade-related measures is available at https://www.wto.org/english/tratop_e/envir_e/envir_matrix_e.htm (https://www.wto.org/english/tratop_e/envir_e/envir_matrix_e.htm).
26 This is partly because the requirements included in environmental provisions in North–South RTAs are in general based on the domestic regulations employed in developed country members.
27 See the WTO website (https://www.wto.org/english/tratop_e/envir_e/envir_neg_serv_e.htm) which discusses win-win-win situations that can arise from eliminating trade barriers facing environmental goods and services.
28 According to the UNDP/UNAIDS issue brief (2010), “Evergreening (…) in the case of new uses of known substances, demand patent protection for discovery of new uses, rather than actual invention. The TRIPS Agreement does not require patent protection of new use”.
29 UNAIDS press statement (28 July 2015), “UNAIDS calls on trade negotiations to uphold governments’ commitments to public health and access to medicines“ (http://www.unaids.org/sites/default/files/20150728_trips_plus.pdf).
30 Statistics on trade are based on the UNCTADStat database.
31 Taxes on services involve various regulatory channels, such as licensing fees, and they are also indirectly taxed when they are integrated in goods.
32 Enhanced participation in trade may also increase the government tax revenue via corporate tax (from businesses involved in international trade) and income
tax (from those who are engaged in trade-related production or services activities).
33 See footnote 5 above.
34 Nicita, Olarreaga and Porto (2014) present a model that could ascertain whether a country’s current trade policy structure as it stands is essentially pro-poor or pro-rich. If the current trade policy structure is pro-rich, then trade liberalization could be pro-poor in that it can increase the income of poorer households more than that of richer ones, or reduce the price of the consumption bundle of the poor more than that of the rich.
35 Berman and Couttenier (2015) assess possible linkages between trade policy and the likelihood of conflict within a country. The study suggests that external income shocks (e.g. price rise in imported/exported commodities) are important in understanding the geography and intensity of ongoing conflicts in sub-Saharan African countries, and might affect the outbreak of new country-wide conflicts if they are large and persistent.
36 The measurement of the HDI is based on the combination of changes in the indicators of healthy life, education and income.
37 Box 2.1 of the Human Development Report 2013 (UNDP, 2013, page 44) shows that, out of a sample of 105 developing countries, about 87 per cent can be considered globally integrated: they increased their trade to output ratio, have many substantial trading partnerships (bilateral trade exceeding US$ 2 million in 2010–2011) and maintain a high trade to output ratio relative to countries at comparable income levels.
38 Another important policy interface is on environmental sustainability. Trade policy changes interact with a country’s environmental conditions again through changes in the productive landscape and the externalities created by the changes, e.g. air pollution, industrial waste, water use and biodiversity loss, that could result from increased production in profitable sectors while keeping the same technology. Trade can have positive or negative effects on the environment depending on whether production reallocation is resulting in lower total environmental damage or vice versa.

TRADING INTO SUSTAINABLE DEVELOPMENT:TRADE, MARKET ACCESS, AND THE SUSTAINABLE DEVELOPMENT GOALS16
References
Agustí-Panareda, J., Ebert, F., & LeClercq, D. (2014). Labour Provisions in Free Trade Agreements:Fostering their Consistency with the ILO Standards System. ILO.
Alouis, M., & Gideon, Z. (2013, February). Systems, processes and challenges of public revenue collection in Zimbabwe. American International Journal of Contemporary Research, 3(2).
Berman , N., & Couttenier, M. (2015, October). External Shocks, Internal Shots: The Geography of Civil Conflicts. Review of Economics and Statistics, 97(4), 758-776 .
Cadot, O., Malouche, M., & Sáez, S. (2012). Streamlining non-tariff measures: A toolkit for policy makers. The World Bank.
Cadot, O., Malouche, M., & Sáez, S. (2012). Streamlining non-tariff measures: A toolkit for policy makers. The World Bank.
Cagé, J., & Gadenne, L. (2014, August). Tax revenues, develoment, and teh fiscal costs of trade liberalization, 1792-2006. Les Notes du G-Mond.
Cernat, L. (2011). Slashing “killer tariffs”: An easy step towards greater trade and development policy coherence in Africa. CEPR.
Francois et al. (2011). Trade adjustment costs and assistance: The labour market dynamics. In R. Peters, Salazar, & M. Jansen, Trade and Employment: From myths to facts (p. Chapter 6).
Gallagher, K. (2002). Industrial pollution in Mexico: Did the NAFTA matter? In C. Deere, & D. Esty, Greening teh Americas: NAFTA’s lessons for hemispheric trade. The MIT Press.
Hermann, & Peters, R. (2010). Impact of the food crisis on developing countries and implication for agricultural trade policy. In Karapinar, & Härberli.
Hoekman, B. a. (2015). Services Productivity, Trade Policy, and Mnufacturing Exports. European University Institute.
ILO. (2013). Studies on growth with equity: Social Dimensions of Free Trade Agreements.
Miller, E. (2002). Did Mexico suffer economically from the NAFTA’s Environmental Provisions? In C. Deere, & D. Esty, Greening the Americas: NAFTA’s lessons for hemispheric trade. The MIT Press.
Nicita, A., & Olarreaga, M. (2014). Pro-poor trade policy in Sub-Saharan Africa. Journal of International Economics, 92(2), 252-265.
Nicita, A., & Olarreaga, M. (2014). Pro-poor trade policy in Sub-Saharan Africa. Journal of International Economics, 92(2), 252-265.
OECD. (2014). Environment and Regional Trade Agreements: Emerging Trends and Policy Drivers . OECD Trade and Environment Working Papers, Paris.
OECD. (2015). Report on the Regional Workshop on “Regional Traed Agreements and the Environment”. OECD.
Shephard, B. (2015). Trade and the Sustanaible Development Goals: Can tariffs and NTMs be bad for your health? Policy Brief.
Tébar Less, C., & Gigli, S. (2008). UPDATE ON ENVIRONMENT AND REGIONAL TRADE AGREEMENTS:. OECD Trade and Environment Working Paper.
Tipping, A., & Wolfe, R. (2015). Trade and Sustainable Development: Options for follow-up and review of the trade-related elements of the POst-2015 Agenda and Financing for Development. IISD, ICTSD.
UN. (2015a). Transforming our world: the 2030 Agenda for Sustainable Development. Resolution adopted by the General Assembly on 25 September 2015.
UN. (2015b). Addis Ababa Action Agenda of the Third International Conference on Financing for Development. Draft resolution submitted by the President of the General Assembly .
UNCTAD. (1964). UNCTAD I Final Act and Report. Proceeding of teh United Nations Conference on

I. Trade Policymaking and the Sustainable Development Goals 17
Trade and Development (23 March - 16 June 1964).
UNCTAD. (2014). Looking at trade policy through a “gender lens”: Summary of seven country case studies conducted by UNCTAD.
UNCTAD. (2014). World Investment Report 2014. UNCTAD.
UNCTAD. (2015). Non-tariff measures and sustainable development goals: Direct and indirect linkages. UNCTAD Policy Brief.
UNCTAD. (2015c). Key statistics and trends in international trade 2015.
UNDP. (2013). Human Development Report 2013.
Winters, L. (2000). Trade and Poverty: Is there a connection? In H. N. Dan Ben-David, Trade, income disparity and poverty (pp. 43-69). World Trade Organization.
Winters, L. A. (2000). Trade and Poverty: Is There a Connection? In D. N. Ben, Trade, Income Disparity and Poverty (pp. pp. 43-69). World Trade Organisation.


1. Introduction
International trade is designated as one of the means of implementation for the achievement of the United Nations Sustainable Development Goals (SDGs), through realizing “sustained, inclusive and sustainable” economic growth. As discussed in chapter I, trade growth enhances a country’s income generating capacity, which is one of the essential prerequisites for achieving sustainable development. An increase in imports at competitive prices can improve consumer surplus and the prospective competitiveness of domestic producers that use imported intermediates. An increase in exports enhances the country’s income growth at least at the aggregate level. Market access conditions, both foreign market access for a country’s exports and domestic market access for imports, are thus an important determinant of the effectiveness of trade as a means of implementation.
Market access conditions in international trade have been determined largely by the height of tariffs. Tariffs, or customs duties on imports, are a tax levied on imported goods at the border.
A tariff rate is generally defined ad valorem, that is, as a percentage of the unit c.i.f. (cost, insurance and freight) price of an imported good at the border. In other cases, a tariff rate may be determined by the volume of an imported good (i.e. a specific rate) or by a combination of the two. As discussed in chapter I, revenues accrued from tariffs could constitute a significant portion of the government’s public revenue, particularly in low-income countries.
The government determines the height of tariff rates on different products according to product-specific or sector-specific policy objectives, or depending on the need for tariff revenues. Products that exhibit low demand elasticity, for instance, may be selected for higher tariff rates with a view to ensuring steady tariff revenue. Tariff rates of certain goods may be reduced or eliminated to increase consumer surplus. Tariff rates for sensitive sectors - sectors whose economic viability is considered important for socioeconomic conditions of the country - may be set high so as to protect the producers in the sectors from foreign competition. Tariff rates on intermediate goods may be set high or low, depending on the country’s industrial development policy. A government with significant market power may also look for gains in the commodity terms of trade (i.e the quantity of imports that can be bought by a unit of exports) so as to achieve the optimal tariff level at which a country’s welfare is maximized.39 In most cases, the tariff rates are set with a view to maximizing a weighted average of all the above-mentioned domestic interests and concerns (Amador and Bagwell, 2012).
TARIFFS AND THE SUSTAINABLEDEVELOPMENT GOALS
II

TRADING INTO SUSTAINABLE DEVELOPMENT:TRADE, MARKET ACCESS, AND THE SUSTAINABLE DEVELOPMENT GOALS20
Each country setting optimal tariffs carries an inherent risk of “trade wars”, where countries retaliate against tariff barriers in their trading partners by raising their own tariffs. In 1947, 23 countries which were then major economies in international trade signed the General Agreement on Tariffs and Trade (GATT). With GATT, the countries entered into “reciprocal and mutually advantageous arrangements” aiming at “the substantial reduction of tariffs and other barriers to trade and to the elimination of discriminatory treatment in international commerce”.40 Article I of GATT94, which incorporates the provisions of GATT47, stipulates that the members set their tariffs on the most-favoured-nation (MFN) basis in a way that “any advantage, favour, privilege or immunity” granted to any product originated in and destined for other countries becomes “immediately and unconditionally” applicable to all contracting parties. The conclusion of the Uruguay Round (1986–1994) of multilateral trade negotiations created the World Trade Organization (WTO) with a clear purpose to “develop an integrated, more viable and durable multilateral trading system” encompassing GATT, other Uruguay Round agreements and the past trade liberalization
efforts.41 Under the Uruguay Round agreements, the GATT/WTO members bound, that is, set the maximum limit to, tariffs levied on all agricultural goods and the majority of non-agricultural goods.42
Since the establishment of GATT, the average applied tariffs in international trade, particularly on manufacturing goods, have been reduced via trade liberalization in the multilateral framework, as well as in a regional setting, or unilaterally.43 According to UNCTAD (2015a), the simple average of the world MFN-applied tariff in 2014 was around 6 per cent for manufacturing goods and just below 3 per cent for natural resources (figure 1). For agricultural products, the average tariff remained relatively high at around 15 per cent, although the rate had declined by 2 percentage points since 2008.44
In practice, a significant portion of world imports receives preferential tariff rates that are lower than the MFN tariffs. The simple average agricultural tariff in preferential trade arrangements is at around 8 per cent which is almost half of the MFN counterpart. The trade-weighted average tariffs are generally lower than the corresponding simple average tariffs. In
Figure 1. Worldwide average tariff: (a) MFN-applied and (b) preferential, by major sectors
Source: UNCTAD Key Statistics and Trends in Trade Policy 2015 (UNCTAD, 2015a)

II. Tariffs and the Sustainable Development Goals 21
at the global level, hence are likely to use aggregated data. The reviewing process at the national level may require a set of country-specific indicators that will help each country assess the SDG progress, taking into account its own conditions and circumstances and using national data.
The objective of this chapter is to discuss how tariffs, a major determinant of market access conditions, may interact with development policies that contribute to the achievement of the SDGs in the coming 15 years of the implementation of the 2030 Agenda. The following sections present some of the currently-negotiated global indicators for trade-related SDG targets (table 1), with a view to clarifying the starting point, or where the world stands now as regards using trade and trade policy for achieving sustainable development. The global indicators discussed in this chapter are calculated using UNCTAD statistics, UN Comtrade (United Nations Commodity Trade Statistics), and UNCTAD TRAINS (Trade Analysis Information System) data), and statistical findings that are presented in UNCTAD Key Statistics and Trends in Trade Policy 2015 (UNCTAD, 2015a).
both cases, the average tariffs declined since 2008 under both multilateral and preferential liberalization.45 Only the weighted average preferential tariff on manufacturing imports increased, albeit slightly. This resulted from a shift in the composition of traded goods under preferential schemes from products facing low tariffs to those facing higher tariffs. Over 60 per cent of agricultural trade in 2014 was duty-free, with 20 per cent of this accounting for duty-free on the MFN basis and the rest under preferential tariffs (figure 2).
The 2030 Agenda for Sustainable Development (hereafter referred to as the 2030 Agenda) stipulates that the reviewing and monitoring of the progress made towards the SDGs at the global level will benefit from global indicators. Since March 2015, the Inter-agency Expert Group on Sustainable Development Goal Indicators (IAEG-SDG) has been working towards identifying a set of global indicators. The IAEG-SDG is expected to present the agreed set of indicators to the United Nations Member States by March 2016.46 Some global indicators that have been discussed so far use tariffs as a key metric component as shown in table 1 below.47 Those global indicators are for reviewing and monitoring the progress towards achieving the SDGs
Figure 2. Share of products traded duty-free
Source: UNCTAD Key Statistics and Trends in Trade Policy 2015 (UNCTAD, 2015a)

TRADING INTO SUSTAINABLE DEVELOPMENT:TRADE, MARKET ACCESS, AND THE SUSTAINABLE DEVELOPMENT GOALS22
Goal 17. Strengthen the means of implementation and revitalize the global partnership for sustainable development
Target 17.7
Possible indicator
Promote the development, transfer, dissemination and diffusion of environmentally sound technologies to developing countries on favourable terms, including on concessional and preferential terms, as mutually agreed
Average applied tariffs imposed on environmental goods 48
Target 17.10
Possible indicator
Promote a universal, rules-based, open, non-discriminatory and equitable multilateral trading system under the World Trade Organization (WTO), including through the conclusion of negotiations within its Doha Development Agenda
Worldwide weighted tariff-average: this indicator can be disaggregated and analysed by type of tariff (MFN applied rates and preferential rates), by product sector, by region and by level of development. The unit of measurement will be in percentage terms. Ad valorem equivalents will be calculated for those tariffs that are not expressed in percentage. This methodology also allows for cross-country comparisons. Calculations can be performed on a yearly basis. The indicator will be almost identical to one indicator used for the reviewing of the Millennium Development Goal 8, focusing on market access.
Target 17.12
Possible indicator
Realize timely implementation of duty-free, quota-free market access on a lasting basis for all least developed countries (LDCs), consistent with WTO decisions, including by ensuring that preferential rules of origin applicable to imports from LDCs are transparent and simple, and contribute to facilitating market access
Average tariffs faced by developing countries and LDCs (and small island developing States) by key sectors
Goal 10. Reduce inequality within and among countries
Target10.a
Possible indicator
Implement the principle of special and differential treatment for developing countries, in particular LDCs, in accordance with WTO agreements
Share of tariff lines applied to imports from LDCs/developing countries with zero-tariff
Goal 2. End hunger, achieve food security and improved nutrition and promote sustainable agriculture
Target 2.b
Possible indicator
Correct and prevent trade restrictions and distortions in world agricultural markets, including through the parallel elimination of all forms of agricultural export subsidies and all export measures with equivalent effect, in accordance with the mandate of the Doha Development Round
Percent change in import and export tariffs on agricultural products
Source: United Nations (2015), “Results of the list of indicators reviewed at the second IAEG-SDG meeting”
Table 1. Selected possible global Sustainable Development Goal indicators (as at November 2015) based on tariffs

II. Tariffs and the Sustainable Development Goals 23
Asia, Latin America, sub-Saharan Africa, and West Asia and North Africa). The weighted average is of applied tariffs and takes into account preferential tariff rates whenever they are applicable.
Average tariffs on agricultural goods vary widely across country groups. Average agricultural tariffs in developing Asia for instance are the highest in the world, at around 15 per cent for East Asia and 23 per cent for South Asia. In South Asia, the weighted average agricultural tariff in 2014 was higher than that in 2008. This resulted from an increase in imports of higher-tariff products in the composition of agricultural imports to South Asia. The 2014 average manufacturing tariffs were below 5 per cent in five out of seven country groups. Tariffs on natural resources in 2014 were significantly lower than other major sectors in all country groups.
As a reference, table 3 presents matrices of interregional and intra-regional market access conditions for two sectors of export interest to developing countries: agriculture and textile/apparel. The 2014 average tariff rates were calculated based on both the MFN rates and preferential rates. Numbers in blue show the
2. Tariffs and the Sustainable Development Goals
This section looks into where the world stands as regards the global indicators that are currently negotiated for the SDG Target 17.10, 17.12 and 17.7.
2.1 Indicator for Target 17.10: Worldwide weighted average tariffs
The SDG target 17.10 aims at promoting a “universal, rules-based, open, non-discriminatory and equitable” multilateral trading system under the WTO. The indicator that the IAEG-SDGs suggests for this target is worldwide weighted average tariffs.
Figure 3 provides the trade-weighted average applied tariffs of seven country groups in 2008 and 2014 in three major sectors; agriculture, manufacturing and natural resources. The country groups are; developed countries, transition economies and developing countries in five different regions (East Asia, South
Figure 3. Trade-weighted average tariffs
Source: UNCTAD Key Statistics and Trends in Trade Policy 2015 (UNCTAD, 2015a)

TRADING INTO SUSTAINABLE DEVELOPMENT:TRADE, MARKET ACCESS, AND THE SUSTAINABLE DEVELOPMENT GOALS24
change in the average tariff from the level in 2008. Take the agricultural exports of sub-Saharan Africa in table 2 as an example. The region’s agricultural exports to developed countries and to transition economies on average face the lowest tariff, between 1.4 and 1.8 per cent. Their exports to other developing regions are subject to higher tariffs. However, when compared with their export competitors in different importing regions, the agricultural exports of sub-Saharan Africa face relatively lower tariffs than their
competitor exporting regions. Table also shows that the average tariff rate applied to agricultural exports of Latin America to East Asia fell by 0.7 per cent between 2008 and 2014.
Across all the importing regions, the average tariff for intra-regional exports (shaded with green) tends to be the lowest, except in the case of developed countries (at 10.3 per cent). Between 2008 and 2014, agricultural tariffs have been falling in general, except those linked
AGRICULTURE Exporting region
Importing regionDeveloped countries
East Asia Latin America South AsiaSub-Saharan
AfricaTransition economies
W.Asia & N.Africa
Developed countries10.3 8.4 4.5 3.8 1.4 5.1 4.0
-0.5 1.3 0.8 -0.2 -1.0 -1.4 -1.3
East Asia12.7 9.1 13.0 13.3 9.1 19.2 8.8
-5.0 -3.5 -0.7 -2.3 0.7 -4.4 -1.5
Latin America5.3 11.1 2.2 11.3 12.9 13.0 11.7
-0.1 -0.9 -1.7 0.7 0.4 8.7 -0.2
South Asia37.9 34.0 32.1 6.9 17.6 7.9 20.5
8.3 10.8 0.5 -0.1 1.5 0.1 -5.2
Sub-Saharan Africa12.0 13.3 11.0 16.3 7.7 6.4 18.5
-0.9 0.2 -0.1 3.9 -1.5 -11.3 0.6
Transition economies10.1 6.1 10.3 5.6 1.8 1.3 6.7
-0.9 -0.6 -2.8 -0.6 -0.9 1.1 -1.2
W.Asia & N.Africa13.7 9.7 6.6 4.3 7.3 22.0 2.4
0.1 -1.4 -2.3 0.4 -1.7 14.3 -1.6
TEXTILE & APPAREL Exporting region
Importing RegionDeveloped countries
East Asia Latin America South AsiaSub-Saharan
AfricaTransition economies
W.Asia & N.Africa
Developed countries4.1 9.3 0.7 5.9 0.5 2.9 1.0
-0.6 0.1 -0.8 -0.7 -5.0 -0.8 -0.2
East Asia8.3 5.7 11.2 5.3 9.5 8.9 13.2
-1.6 -1.9 -4.8 -1.3 -0.1 -4.8 -0.6
Latin America4.5 21.7 1.4 23.2 25.3 26.0 25.5
0.1 1.3 -0.8 0.1 -1.6 2.2 -1.5
South Asia20.9 26.1 13.6 15.0 15.2 18.1 47.3
0.6 1.0 -2.5 0.3 -0.1 0.7 -10.2
Sub-Saharan Africa12.0 22.5 15.6 22.0 7.3 29.6 23.3
-0.8 0.6 0.6 0.5 -1.3 -2.5 0.6
Transition economies8.7 10.9 9.6 9.5 9.7 1.2 8.6
-5.7 -5.6 -4.6 -5.8 -7.8 0.7 -3.2
W.Asia & N.Africa2.4 8.9 8.4 5.2 4.7 2.7 4.9
-2.2 -0.3 -2.8 0.3 -0.5 -0.1 -1.5
Table 2. Tariff barriers to agricultural and manufacturing exports (2014)
Source: UNCTAD Key Statistics and Trends in Trade Policy 2015 (UNCTAD, 2015a)

II. Tariffs and the Sustainable Development Goals 25
to the imports and exports of South Asia. Together with the relatively high tariffs against imports in South Asia, this may suggest that the region is the one least exposed to bilateral or interregional trade agreements with the rest of the world. The same tendency is found in the imports and exports of sub-Saharan Africa among other developing country regions, and the exports of transition economies. As regards textile and apparel products, we see that the average tariffs were higher than 20 per cent in 12 region pairs, mostly involving developing countries. The average tariffs in these cases far exceed that on agricultural products in the same importing-exporting pair.
Being the weighted average, the average tariff for a given pair of importing-exporting regions is specific to the composition of products imported/exported between the regions. For this reason, the average tariffs given in the tables below should be used for a cross-regional comparison of the import restrictiveness. One exporting region such as East Asia may export totally different composites of products to different importing regions.
Summary: The figures and tables above indicate that tariff barriers in international markets in general have been falling to quite a low level, although there is a
significant variation across regions as well as product sectors. The existence of the multilateral trading system that Target 17.10 calls to promote must have been one of the key drivers for the lowering of tariffs. However, as Figure 2 above demonstrates, the reduction in the applied tariff rates in recent years has been driven also by the proliferation of preferential trade agreements. In this respect, an additional indicator(s) that measure the qualitative nature of the multilateral trading system that we want to promote - i.e. being universal, rules-based, open, non-discriminatory and equitable - may also be considered in the reviewing and monitoring of the SDGs at the global level.
2.2 Indicators for Targets 17.12 and 10.a: Duty-free and the average tariff
Target 17.12 calls for the timely implementation of duty-free, quota-free (DFQF) market access on a lasting basis for all least developed countries (LDCs) in such a way that it contributes to facilitating market access for LDCs’ exports. The indicator that the IAEG-SDG suggest for this target is average tariffs faced by developing countries and LDCs (and small island developing States) by key sectors.
(i) Duty-free tariff lines, as % of total tariff lines
(ii) Average applied tariff rate, weighted, in %
Selected developed countries and regions
Australia 100.0 0.0
Switzerland 100.0 0.0
Japan 97.9 0.0
European Union 99.0 0.0
United States of America 82.6 6.7
Selected developing countries
Singapore - 0.0
China 61.5 0.9
South Africa - 3.8
Pakistan - 3.5
Brazil - 8.3
India 81.9 3.7
Source: World Trade Organization (WTO) (2015). Market Access for Products and Services of Export Interest to Least Developed Countries.
Table 3. Duty-free treatment of least developed country exports in different markets, 2013

TRADING INTO SUSTAINABLE DEVELOPMENT:TRADE, MARKET ACCESS, AND THE SUSTAINABLE DEVELOPMENT GOALS26
Target 10.a calls for the implementation of the principle of special and differential treatment for developing countries, in particular LDCs, in accordance with WTO agreements. The indicator that the IAEG-SDGs suggests for this target is a share of duty-free tariff lines facing imports from developing countries and LDCs.
The objective of the above SDG Targets is to improve market access conditions to LDCs’ exports (Target 17.12) as an integral element of special and differential treatment for LDCs in accordance with the WTO Agreements.
Table 3 below presents (i) the percentage of duty-free tariff lines and (ii) the trade-weighted average tariff rates applicable to LDCs’ exports in selected countries. In terms of duty-free tariff lines, almost all the tariff lines of major developed country markets on LDCs’ exports are duty-free. Only in the United States of America did over 10 per cent of tariff lines have non-zero rates vis-à-vis LDCs’ exports. As regards the average applied tariff rates for LDCs’ exports, they are largely duty-free in the majority of developed country markets. LDCs’ exports to developing countries, especially in major importing markets such as China, receive preferential tariff rates that are close to duty-free.
Table 4 presents the average tariffs applied to LDCs as well as the relative preferential margins (RPMs) enjoyed by LDC exports. In general, a preferential margin is the difference between the preferential
tariff rate applicable to exports from LDC and the corresponding MFN rate. The RPM is the difference between the preferential rate for LDCs and the applied tariff rates applicable to LDCs’ competitor countries in the same market taking into account the preferential tariff rates that are applicable to them. The first two columns in table 4 compare the average tariff rates applicable to LDC exports in 2008 and 2013. Even after the financial crisis in 2008–2009, tariffs facing LDC exports showed a substantial reduction. The last two columns provide the RPM enjoyed by LDCs. In the past couple of decades, a proliferation of bilateral and regional trade agreements may have reduced the RPM facing LDCs, particularly in developed country markets. In the five years between 2008 and 2013, however, the RPM has improved in most cases. Only in Latin America was the average tariff facing LDCs’ exports 0.5 per cent higher than those facing LDCs’ competitors. The fall in RPMs in low-income countries and South Asia may have resulted from a compositional shift of LDC exports from low-tariff products (e.g. fuels) to higher-tariff ones (e.g. foodstuffs).
Summary: Tariffs facing LDCs’ exports are close to zero in the majority of developed countries and a number of developing countries that are major markets to LDCs’ exports. The average tariff facing LDCs’ exports is a useful indicator to check the implementation of DFQF market access. To complement, a simple average of the RPM may be practical for measuring the effective market access facing LDCs under Target 10.a.
Average applied tariff(%)
Relative preferential margin (%)
2008 2013 2008 2013
Developed countries 1.1 0.7 0.8 1.7
East Asia 0.8 0.4 0.1 0.2
Latin America 3.1 1.8 -1.8 -0.5
South Asia 5.7 3.5 1.9 1.1
Sub-Saharan Africa 1.9 1.5 1.3 2.4
Transition economies 7.2 4.8 1.3 2.6
West Asia and North Africa 2.6 3.0 1.0 2.6
High-income economies 1.9 1.5 0.7 1.7
Middle-income economies 0.9 0.5 0.0 0.3
Low-income economies 5.2 3.3 2.0 1.8
Sources: Nicita and Rollo (2013); UNCTAD Key Statistics and Trends in International Trade 2014.
Table 4. Average tariffs and relative preferential margins faced by least developed country exports

II. Tariffs and the Sustainable Development Goals 27
2.3 Indicator for Target 17.7: Tariffs on environmental goods
Target 17.7 calls for the development, transfer, dissemination and diffusion of environmentally sound technologies to developing countries on favourable terms. The initial indicator for this target submitted for discussion at the second meeting of the IAEG-SDGs was average applied tariffs imposed on environmental goods.49
The suggested indicator above has been replaced at the second meeting of the IAEG-SDG to “Total amount of approved funding for developing countries to promote the development, transfer, dissemination and diffusion of environmentally sound technologies”. Nevertheless, this section presents statistical information on the previous indicator, given the importance of market access conditions to environmental goods in the discussion of trade and sustainable development.
Trade liberalization on environmental goods has been discussed in the multilateral and regional setting, particularly:
In 2001, WTO members agreed at the Doha Ministerial Conference that they would negotiate on the reduction or elimination of tariff and non-tariff barriers on environmental goods and services. Despite the increasing awareness of the WTO members of the potential “win-win-win” situation of trade, the trade liberalization on environmental goods at the multilateral front seemed to have stumbled upon identifying which products would constitute the “environmental goods” which would contribute to environmental protection and climate change mitigation;50
In 2012, a ground-breaking move on trade in environmental goods was made outside the WTO. The Asia-Pacific Economic Cooperation (APEC) member countries came up with a list of 54 products as “environmental goods” whose tariffs were to be reduced or eliminated among them. The Leaders’ Declaration, adopted at the 24th annual gathering of APEC leaders stated
that that the APEC members “will reduce applied tariff rates to 5 per cent or less by the end of 2015” of the 54 products listed as APEC’s environmental goods, which would “directly and positively contribute to green growth and sustainable development objectives”;51
In July 2014, 14 WTO members launched plurilateral negotiations for an Environmental Goods Agreement (EGA).52
The plurilateral negotiations are driven by the conviction that eliminating tariffs for environmental goods would be concrete and immediate contributions that could be made by the WTO to environmental sustainability.53
The list of environmental goods under the EGA is to be “built upon” the 2012 APEC list of 54 environmental goods. The products under consideration include those “… that contribute to generating clean and renewable energy, improving energy efficiency, controlling air pollution, managing waste, and treating waste water”.54
The negotiations are open to any WTO member, and the results of the plurilateral EGA will be applied in accordance with the MFN principle.
The rest of this section reports on the market access conditions on environmental goods as it stands in world trade today. The environmental goods studied here are 44 products selected from the APEC list (appendix table 1).55
These 44 products are grouped according to the World Customs Organization’s Harmonized Commodity Description and Coding System, or Harmonized System (HS) at 2-digit level. There are 20 products in the HS-84 group (boilers, machinery and mechanical appliances, etc.), 9 products in the HS-85 group (electrical machinery and equipment and parts thereof); and 15 products in the HS-90 group (measuring, checking, precision instruments and apparatus and parts and accessories thereof. Note that the 44 products studied here do not take into account so-called “ex outs” of different APEC members (i.e. exclusion of certain products out of the products covered under the HS 6-digit level of classification according to their national tariff lines) that are specified in the APEC List.56

TRADING INTO SUSTAINABLE DEVELOPMENT:TRADE, MARKET ACCESS, AND THE SUSTAINABLE DEVELOPMENT GOALS28
2.3.1 Average applied tariffs on environmental goods
Figure 4 below provides weighted average tariffs applied to the imports (the top two charts) and the exports (the bottom two charts) of 44 environmental goods in markets of different income groups. The box 1 provides the same information for the APEC countries and the WTO members that are participating in the plurilateral negotiations on the EGA.
In 2014, the average tariffs on the imports of environmental goods were below 4 per cent across all income groups. Between 2002 and 2014, the average tariffs on imports of environmental goods in low-
Statistical information on tariff measures and non-tariff measures (NTMs) are drawn from the UN Comtrade, the World Integrated Trade Solution (WITS) and Trade Analysis and Information System (TRAINS) database and the data on non-tariff measures (NTMs) collected by UNCTAD.
Although this chapter focuses on trade in environmental goods, the EGA is expected also to address trade in environmental services. Environmental services, which include infrastructural services (e.g. mechanism for wastewater and air pollution management) and non-infrastructural services (e.g. engineering designing) are said to account for 65 per cent of the market value of environmental businesses (UNEP, 2012).
Figure 4. Weighted average tariffs on environmental goods, 2002 and 2014
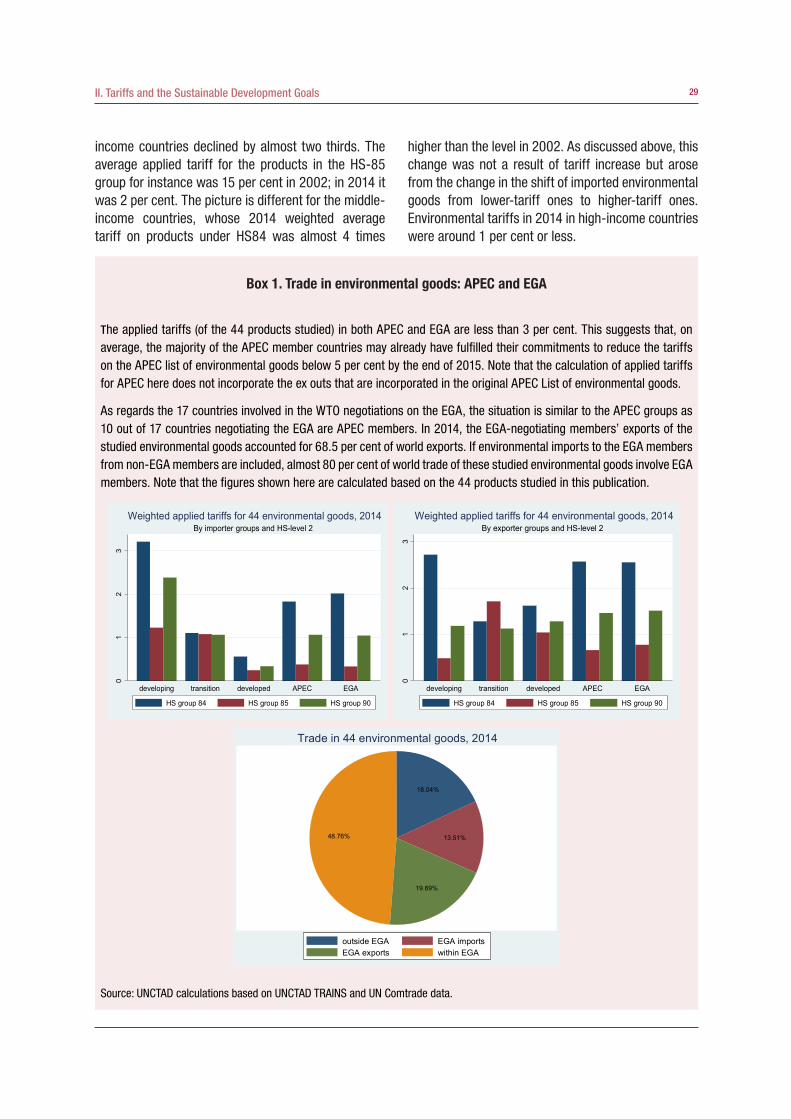
II. Tariffs and the Sustainable Development Goals 29
income countries declined by almost two thirds. The average applied tariff for the products in the HS-85 group for instance was 15 per cent in 2002; in 2014 it was 2 per cent. The picture is different for the middle-income countries, whose 2014 weighted average tariff on products under HS84 was almost 4 times
higher than the level in 2002. As discussed above, this change was not a result of tariff increase but arose from the change in the shift of imported environmental goods from lower-tariff ones to higher-tariff ones. Environmental tariffs in 2014 in high-income countries were around 1 per cent or less.
Box 1. Trade in environmental goods: APEC and EGA
The applied tariffs (of the 44 products studied) in both APEC and EGA are less than 3 per cent. This suggests that, on average, the majority of the APEC member countries may already have fulfilled their commitments to reduce the tariffs on the APEC list of environmental goods below 5 per cent by the end of 2015. Note that the calculation of applied tariffs for APEC here does not incorporate the ex outs that are incorporated in the original APEC List of environmental goods.
As regards the 17 countries involved in the WTO negotiations on the EGA, the situation is similar to the APEC groups as 10 out of 17 countries negotiating the EGA are APEC members. In 2014, the EGA-negotiating members’ exports of the studied environmental goods accounted for 68.5 per cent of world exports. If environmental imports to the EGA members from non-EGA members are included, almost 80 per cent of world trade of these studied environmental goods involve EGA members. Note that the figures shown here are calculated based on the 44 products studied in this publication.
01
23
developing transition developed APEC EGA
By importer groups and HS-level 2Weighted applied tariffs for 44 environmental goods, 2014
HS group 84 HS group 85 HS group 90
01
23
developing transition developed APEC EGA
By exporter groups and HS-level 2Weighted applied tariffs for 44 environmental goods, 2014
HS group 84 HS group 85 HS group 90
18.04%
13.51%
19.69%
48.76%
outside EGA EGA importsEGA exports within EGA
Trade in 44 environmental goods, 2014
Source: UNCTAD calculations based on UNCTAD TRAINS and UN Comtrade data.

TRADING INTO SUSTAINABLE DEVELOPMENT:TRADE, MARKET ACCESS, AND THE SUSTAINABLE DEVELOPMENT GOALS30
As regards the average tariffs facing the exports of environmental goods of these income groups, the highest tariff barrier is the one facing low-income group’s exports of the products in the HS-84 group. The average tariff facing their HS-84 exports is 1 percentage point higher than the average tariff imposed by low-income group on the imports of the same product group. Developed country exports face higher tariffs than the imported equivalents, while the exports of the middle-income countries face lower tariffs than their imports.
Comparing the tariff levels between 2002 and 2014, we see the weighted average tariffs on exports of environmental goods in 2014 were much higher than the level in 2002. This arose from changes not only in the export composition (e.g. shift from lower-tariff goods to higher-tariff goods) but also in the destinations of exports which we discuss in more detail below.
2.3.2 Trade flows of environmental goods
Figure 5 presents the magnitude of trade in environmental goods. In 2014, the value of total imports of the selected environmental goods amounted to US$ 371 billion, which was more than double the value in 2002 (US$ 118 billion). High-income countries, or “North”, dominate world trade in environmental goods: their imports from other high-income countries, that is, North–North trade, stood at US$ 145.8 billion, or 45 per cent of the total trade. North’s imports from low- or middle-income countries (i.e. South) also increased substantially from the 2002 level to claim US$ 58.2 billion in 2014. But in terms of the growth rate, South–South trade in environmental goods exhibited the highest growth, at around 1,600 per cent.
As in the figure 6, between 2002 and 2014, South–South trade increased the share in trade in environmental goods by 6.5 percentage point. In 2002,
145.8
58.2
95.8
25.7
0.0
20.0
40.0
60.0
80.0
100.0
120.0
140.0
160.0
North South North South
North South
2002 2014
Figure 5. Value of imports of environmental goods (US$ billion) in 2002 and 2014*
*The total figure of the import values for 2014 in this chart does not sum up to the US$371 billion, as countries with economies in tran-sition not separated from the North and South categories.
Source: WITS/TRAINS database.

II. Tariffs and the Sustainable Development Goals 31
exports from developing countries (i.e. the combination of South-North and South-South) accounted for 25 per cent of the world exports of the 44 products studied here. The share increased to 37 per cent in 2014. Developing countries’ imports of environmental goods also increased from 10 per cent of world total in 2002 to 26 per cent in 2014.
2.3.3 Non-tariff measures on environmental goods
As seen above, tariffs on environmental goods are on average low across different income groups. Let us now examine another key determinant of market access that applies to the selected environmental goods, namely, NTMs. Statistics in this section are based on the NTM information collected by UNCTAD
and its partner agencies under the Transparency in Trade (TNT) initiative.57 Figure 7 presents the average number of NTMs per product, classified at the HS 6-digit level, grouped according to their HS chapters. Across product groups, the most common NTM is technical measures, in particular technical barriers to trade (TBT). For instance, the products in the HS-84 groups are on average subject to 3 different TBT measures in their importing markets.
Summary: Tariffs facing the environmental goods (as defined by the APEC group) are generally in the range of 3 per cent or less across all income groups. The majority of environmental goods are traded among developed countries. However, since 2002, developing countries have steadily increased their share in world imports and exports of environmental goods. To
South North, 29.4%
South South, 7.9%North North, 44.8%
North South, 17.9%
2014
North North, 66.4%
North South, 8.9%
South North, 23.2%
South South, 1.4%
2002
Figure 6. Trade flows in environmental goods
Source: WITS/TRAINS database.

TRADING INTO SUSTAINABLE DEVELOPMENT:TRADE, MARKET ACCESS, AND THE SUSTAINABLE DEVELOPMENT GOALS32
further improve the market access conditions facing environmental goods, the attention needs to move beyond tariffs and placed upon NTMs.
3. Doubling the least developed countries’ share of global exports by 2020
In addition to the targets discussed above, Target 17.11 under Goal 17 (Strengthen the means of implementation and revitalize the global partnership for sustainable development) addresses the need to enhance market access conditions for LDCs.
Target 17.11 calls for the share of global exports of the least developed countries (LDCs) to be doubled by 2020. The indicator that the IAEG-SDGs suggests for this target is the exports of developing countries and LDCs (by partner group and key sectors), including services.
Figure 8 presents the changes in the share of LDC exports and imports in goods and services since 1994
for goods and since 2005 for services. The statistics for the services exports used in the graph are based on the definitions of the services given in the sixth edition of the International Monetary Fund Balance of Payments and International Investment Position Manual (2009), the data of which are available only from 2005.
In 2014, the value of LDC merchandise exports was US$ 217 billion. The share of LDCs in world exports almost doubled in 15 years, from 0.6 per cent in 2000 to 1.1 per cent in 2014. The share of LDCs in world merchandise imports also increased, from 0.7 per cent in 2000 to 1.4 per cent in 2014, reaching US$ 246 billion. The key driver of export growth in this period was a massive rise in the prices of fuels, ores and metals, reflecting the high demand in developing countries, notably China.
In services trade, the share of LDCs in 2014 of world services exports (US$ 5 trillion) was at 0.9 per cent (US$ 40 billion), showing a significant increase from 0.5 per cent (US$ 12 billion) in 2005. As for services imports, the share in 2014 was 1.8 per cent (US$ 84 billion), increased from 1.1 per cent (US$ 28 billion) in 2005.
0
1
2
3
4
SPS TBT Quantity control Price-control &add. charges
Finance Export-related Other
Average no. of NTMs per product of 44 environmental goodsBy NTM type and HS-level 2
HS group 84 HS group 85 HS group 90
Figure 7. Average number of NTMs measures facing environmental products

II. Tariffs and the Sustainable Development Goals 33
Would an improvement in market access conditions in terms of tariff preferences be enough for doubling the export shares of LDCs? As we have seen above, applied tariffs have been reduced, if not eliminated, in various settings, including via bilateral or regional free trade agreements (FTAs). In April 2015, the number of regional trade agreements (RTA) notified to WTO was 612, 406 of which are currently in force. The number of RTAs in force in 1994 was around 100. Few such RTAs involve LDCs as members. In this context, even if LDCs receive DFQF market access treatment, the value of the relative preferential margin also falls. An UNCTAD study estimated that a one unit fall in the preferential margin (in relative preferential margins) reduced the exports of preference-receiving countries on average by 0.3 percentage points, and that the proliferation of RTAs outside sub-Saharan Africa
could limit new export opportunities via a reduction in relative preferential margins (Nicita and Rollo, 2013). As tariff rates have fallen globally in the past decades, market access conditions for LDCs have been increasingly determined by NTMs such as sanitary and phytosanitary (SPS) measures and TBT measures. UNCTAD estimates that more than 50 per cent of the exported products of developing countries face some type of NTM, the majority of which are SPS and TBT measures (UNCTAD, 2013). NTMs on the key exports of LDCs, such as textiles and clothing, footwear and agrifood products, are substantial, ranging at around 10–27 per cent of the tariff equivalent. Trade costs arising from NTMs on exports are disproportionately larger to LDCs than to high-income countries (Nicita and Murina, 2014).
0.0%
0.2%
0.4%
0.6%
0.8%
1.0%
1.2%
1.4%
1.6%
1994 1995 1996 1997 1998 1999 2000 2001 2002 2003 2004 2005 2006 2007 2008 2009 2010 2011 2012 2013 2014
The least developed countries: Share of global merchandise exports (percentage)
Export share Import share
0.0%
0.5%
1.0%
1.5%
2.0%
2005 2006 2007 2008 2009 2010 2011 2012 2013 2014
The least developed countries: Share of global services trade (percentage)
Export share Import share
Figure 8. Changes in the share of LDCs’ exports in global trade
Source: UNCTADstat.

TRADING INTO SUSTAINABLE DEVELOPMENT:TRADE, MARKET ACCESS, AND THE SUSTAINABLE DEVELOPMENT GOALS34
4. Concluding summary
In 2016, multilateral discussion will focus on the implementation of the agreed SDGs. With a view to supporting the review of the SDG progress at the global level, IAEG-SDG under the United Nations will present a set of global indicators. Some of the indicators use tariffs, which is a major determinant of market access conditions, as a metric. This chapter presents these indicators based on data and statistics that are available today.
Tariffs on average have been falling both in developed and developing country markets. The key driving factor of falling tariffs, particularly in the past decade, has been a proliferation of bilateral, regional and interregional FTAs. This may not necessarily be good news with regard to market access conditions facing LDCs, as it can reduce the real value of the preferential market access that they are receiving in world markets. Also, the proliferation of non-multilateral FTAs may reduce the trading opportunities of those developing countries that are not members of any major FTAs. Indeed, trade flows between developing regions and the major economies outside FTAs, for example, South Asia and Europe, Latin America and Europe or sub-Saharan Africa and the United States, have fallen since 2011 (UNCTAD, 2015b).59 While indicators on tariffs are useful, they do not capture other more problematic issues related to market access.
Tariffs on environmental goods are on average less than 4 per cent across countries. The adoption of the Paris Agreement at COP 21 is likely to further motivate countries to reduce tariffs on environmental goods, particularly those that remain high at the national tariff-line level in each country.60 However, NTMs applicable to environmental goods and the liberalization of environmental services remain as major challenges. The outcome of the WTO negotiations on EGA is expected to address market access improvement for both environmental goods and environmental services.
The final question relating to the market access of LDC exports concerns their physical connectivity to international markets. Reducing tariffs or NTMs faced by LDC exports will do little to increase their price competitiveness if LDCs cannot bring their goods to market at a reasonable cost. As discussed in chapter IV, many LDCs are at the bottom of rankings of direct maritime connectivity measured by the average number of trans-shipments58 (the UNCTAD Liner Shipping Connectivity Matrix. The absence of a direct connection may be associated with an export loss of 42–55 per cent (Fugazza, 2015).
Summary: DFQF market access in both developed- and developing-country markets remains crucial to LDCs, particularly in the face of the proliferation of RTAs to which many LDCs are not participating. Achieving Target 17.11 would be further facilitated if DFQF market access is accompanied by technical and financial assistance to improving LDCs’ supply capacity including physical connectivity to the international market. Note that doubling LDCs’ share in world exports is not only an end but also a means to achieve inclusive growth and poverty reduction. Additional indicators that help us assess effective transmission of the impact of export growth to poverty reduction will be useful.
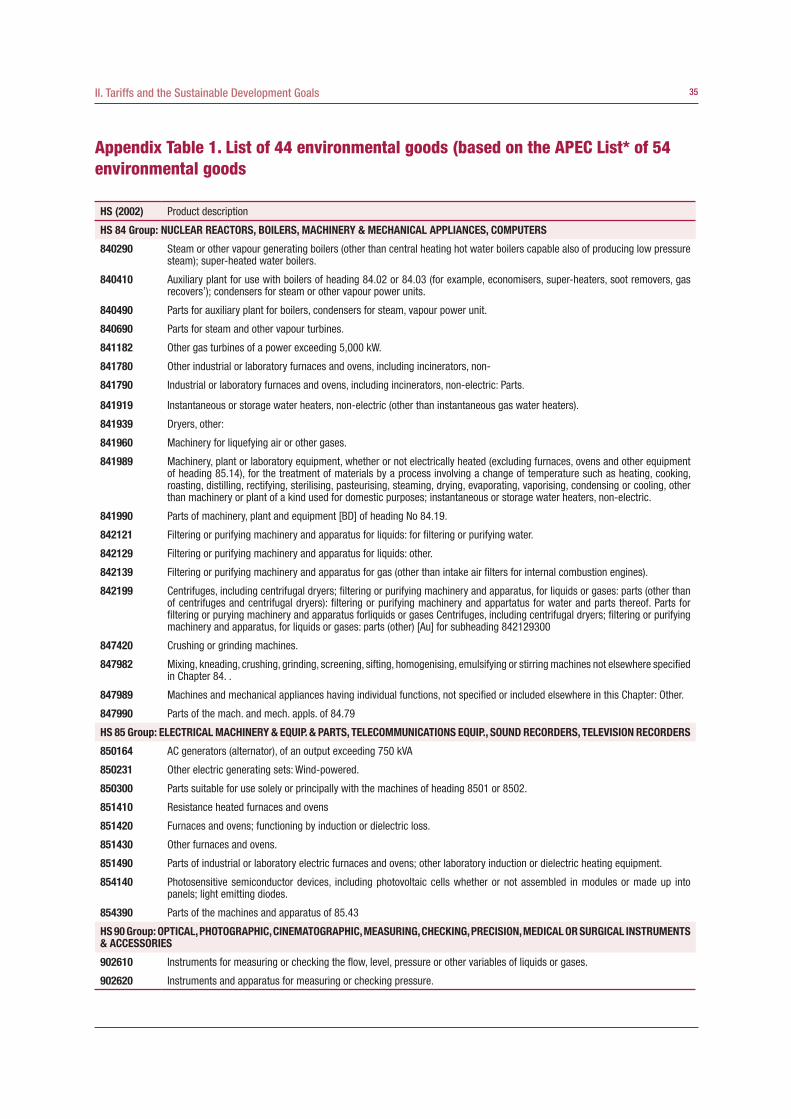
II. Tariffs and the Sustainable Development Goals 35
Appendix Table 1. List of 44 environmental goods (based on the APEC List* of 54 environmental goods
HS (2002) Product description
HS 84 Group: NUCLEAR REACTORS, BOILERS, MACHINERY & MECHANICAL APPLIANCES, COMPUTERS
840290 Steam or other vapour generating boilers (other than central heating hot water boilers capable also of producing low pressure steam); super-heated water boilers.
840410 Auxiliary plant for use with boilers of heading 84.02 or 84.03 (for example, economisers, super-heaters, soot removers, gas recovers’); condensers for steam or other vapour power units.
840490 Parts for auxiliary plant for boilers, condensers for steam, vapour power unit.
840690 Parts for steam and other vapour turbines.
841182 Other gas turbines of a power exceeding 5,000 kW.
841780 Other industrial or laboratory furnaces and ovens, including incinerators, non-
841790 Industrial or laboratory furnaces and ovens, including incinerators, non-electric: Parts.
841919 Instantaneous or storage water heaters, non-electric (other than instantaneous gas water heaters).
841939 Dryers, other:
841960 Machinery for liquefying air or other gases.
841989 Machinery, plant or laboratory equipment, whether or not electrically heated (excluding furnaces, ovens and other equipment of heading 85.14), for the treatment of materials by a process involving a change of temperature such as heating, cooking, roasting, distilling, rectifying, sterilising, pasteurising, steaming, drying, evaporating, vaporising, condensing or cooling, other than machinery or plant of a kind used for domestic purposes; instantaneous or storage water heaters, non-electric.
841990 Parts of machinery, plant and equipment [BD] of heading No 84.19.
842121 Filtering or purifying machinery and apparatus for liquids: for filtering or purifying water.
842129 Filtering or purifying machinery and apparatus for liquids: other.
842139 Filtering or purifying machinery and apparatus for gas (other than intake air filters for internal combustion engines).
842199 Centrifuges, including centrifugal dryers; filtering or purifying machinery and apparatus, for liquids or gases: parts (other than of centrifuges and centrifugal dryers): filtering or purifying machinery and appartatus for water and parts thereof. Parts for filtering or purying machinery and apparatus forliquids or gases Centrifuges, including centrifugal dryers; filtering or purifying machinery and apparatus, for liquids or gases: parts (other) [Au] for subheading 842129300
847420 Crushing or grinding machines.
847982 Mixing, kneading, crushing, grinding, screening, sifting, homogenising, emulsifying or stirring machines not elsewhere specified in Chapter 84. .
847989 Machines and mechanical appliances having individual functions, not specified or included elsewhere in this Chapter: Other.
847990 Parts of the mach. and mech. appls. of 84.79
HS 85 Group: ELECTRICAL MACHINERY & EQUIP. & PARTS, TELECOMMUNICATIONS EQUIP., SOUND RECORDERS, TELEVISION RECORDERS
850164 AC generators (alternator), of an output exceeding 750 kVA
850231 Other electric generating sets: Wind-powered.
850300 Parts suitable for use solely or principally with the machines of heading 8501 or 8502.
851410 Resistance heated furnaces and ovens
851420 Furnaces and ovens; functioning by induction or dielectric loss.
851430 Other furnaces and ovens.
851490 Parts of industrial or laboratory electric furnaces and ovens; other laboratory induction or dielectric heating equipment.
854140 Photosensitive semiconductor devices, including photovoltaic cells whether or not assembled in modules or made up into panels; light emitting diodes.
854390 Parts of the machines and apparatus of 85.43
HS 90 Group: OPTICAL, PHOTOGRAPHIC, CINEMATOGRAPHIC, MEASURING, CHECKING, PRECISION, MEDICAL OR SURGICAL INSTRUMENTS & ACCESSORIES
902610 Instruments for measuring or checking the flow, level, pressure or other variables of liquids or gases.
902620 Instruments and apparatus for measuring or checking pressure.

TRADING INTO SUSTAINABLE DEVELOPMENT:TRADE, MARKET ACCESS, AND THE SUSTAINABLE DEVELOPMENT GOALS36
HS (2002) Product description
902680 Other instruments and apparatus
902690 Parts and accessories for articles of subheading 9026.
902710 Gas or smoke analysis apparatus
902720 Chromatographs and electrophoresis instruments
902730 Spectrometers, spectrophotometers and spectrographs using optical radiations (ultraviolet, visible, infrared)
902750 Other instruments and apparatus using optical radiations (UV, visible, IR)
902780 Instruments and apparatus for physical or chemical analysis not elsewhere specified in 90.27.
902790 Microtomes; parts and accessories of instruments and appliances of 9027.
903180 Other instruments, appliances and machines.
903190 Parts and accessories [M] of the instruments and appliances and machines of 9031.
903289 Automatic regulating or controlling instruments, other.
903290 Parts and accessories [M] for nominated articles of subheading 9032.
903300 Parts and accessories (not specified or included elsewhere in this Chapter) for machines, appliances, instruments or apparatus of Chapter 90. For subheading 902140 and 902150 and other
*The above 44 products are extracted from APEC List of Environmental Goods. The APEC List consists of 54 products. For this study, we extracted only those products whose product code under the Harmonized Commodity Description and Coding System (HS) defined in 2002 are available, for keeping data consistency between the product description and trade flow data. The full range of the APEC List of Environmental Goods are available here: http://www.apec.org/Meeting-Papers/Leaders-Declarations/2012/2012_aelm/2012_aelm_annexC.aspx.
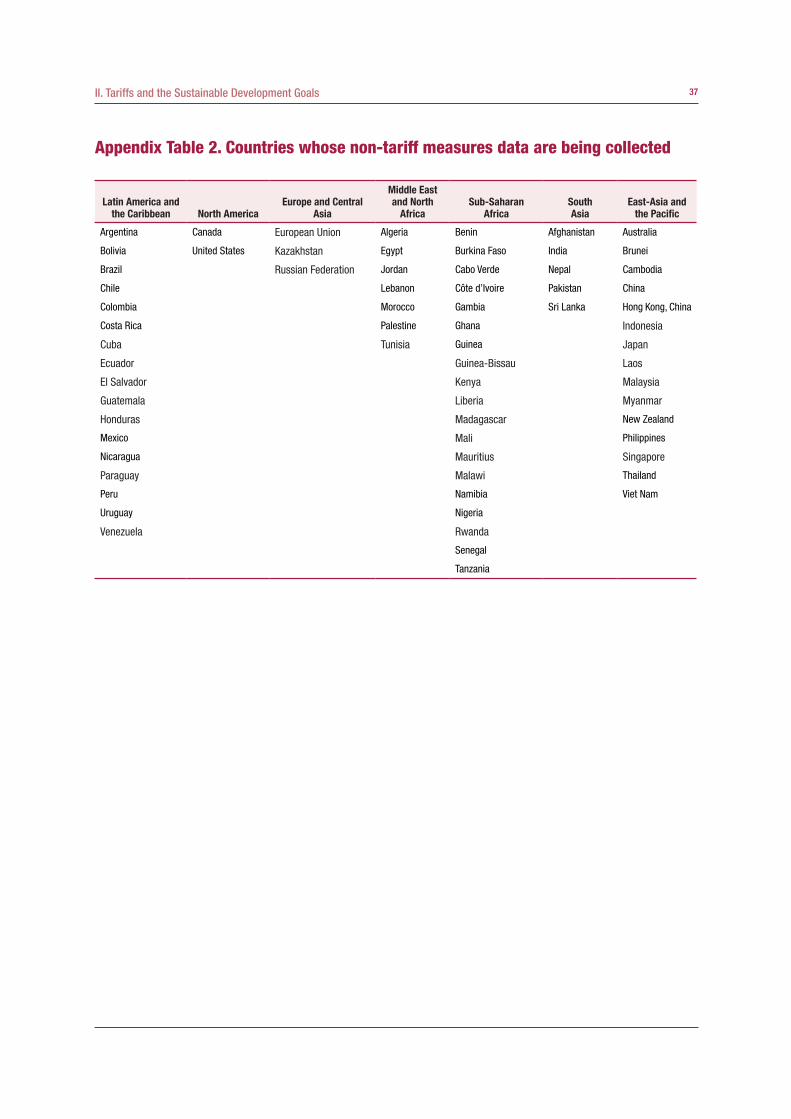
II. Tariffs and the Sustainable Development Goals 37
Appendix Table 2. Countries whose non-tariff measures data are being collected
Latin America and the Caribbean North America
Europe and Central Asia
Middle East and North
AfricaSub-Saharan
AfricaSouth Asia
East-Asia and the Pacific
Argentina Canada European Union Algeria Benin Afghanistan Australia
Bolivia United States Kazakhstan Egypt Burkina Faso India Brunei
Brazil Russian Federation Jordan Cabo Verde Nepal Cambodia
Chile Lebanon Côte d’Ivoire Pakistan China
Colombia Morocco Gambia Sri Lanka Hong Kong, China
Costa Rica Palestine Ghana Indonesia
Cuba Tunisia Guinea Japan
Ecuador Guinea-Bissau Laos
El Salvador Kenya Malaysia
Guatemala Liberia Myanmar
Honduras Madagascar New Zealand
Mexico Mali Philippines
Nicaragua Mauritius Singapore
Paraguay Malawi Thailand
Peru Namibia Viet Nam
Uruguay Nigeria
Venezuela Rwanda
Senegal
Tanzania

TRADING INTO SUSTAINABLE DEVELOPMENT:TRADE, MARKET ACCESS, AND THE SUSTAINABLE DEVELOPMENT GOALS38
the observer bodies, including regional and interna-tional agencies, regional commissions, academia, civil society and the private sector. The meetings so far have enabled the participants to discuss technicality (e.g. measurability, existence of data sources, etc.) on the tentative indicators so far listed. For more informa-tion, see the IAEG-SDG website (http://unstats.un.org/sdgs/iaeg-sdgs/open-consultation-3).
47 See “Results of the list of indicators reviewed at the second IAEG-SDG meeting” on the website of the Statistics Division of the United Nations Department of Economic and Social Affairs.
48 This was the initial indicator submitted to the sec-ond meeting of the IAEG-SDG held in Bangkok from 26-28 October 2015. Discussions at the second meet-ing resulted in a new indicator for Target 17.7: “Total amount of approved funding for developing countries to promote the development, transfer, dissemination and diffusion of environmentally sound technologies”. See United Nations (2015).
49 See footnote 48.
50 See the WTO website on the negotiations on trade and environment elaborates on what constitutes the win-win-win situation.
51 The APEC countries themselves have, in their 2012 Vladivostok Declaration, committed to reduce tariffs on these 54 goods to 5 per cent or less by 2015. See ANNEX C – APEC List of Environmental Goods.
52 See footnote 50 above.
53 See Joint Statement Regarding Trade in Environ-mental Goods by the aforementioned 14 WTO mem-bers released at the World Economic Forum, 24 Janu-ary 2014, at Davos, Switzerland.
54 WTO News Item 2015, DG Azevêdo welcomes progress in Environmental Goods Agreement, 14 De-cember 2015.
55 Out of the 54 products in the APEC list, we select-ed those products: (i) which were identified in the HS Nomenclature 2002 Edition; and (ii) those which had a corresponding code in the HS Nomenclature 2012 Edition. This selection was to enable us to measure changes in tariff rates and trade flows between 2002
Endnotes
39 See Humphrey (1987) for a detailed explanation of the terms of trade and optimal tariff theory.
40 The preamble to the General Agreement on Tariffs and Trade, 1947.
41 The preamble to the Marrakesh Agreement Estab-lishing the World Trade Organization, 1994.
42 According to WTO, on non-agricultural products, the product coverage of tariff binding by developed country members was 100 per cent, while that of de-veloping country members was around 73 per cent. See the WTO website WTO Market access negotiations Simple Guide: Non-agricultural market access (NAMA) negotiations (https://www.wto.org/english/tratop_e/markacc_e/nama_negotiations_e.htm).
43 In contrast to MFN “bound” tariffs, MFN-applied tariffs are those that are in effect at the customs bor-der. At times an applied tariff rate can be significantly lower than its corresponding MFN-bound tariff rate.
44 A recent study estimates that, at the time of the establishment of GATT in 1947, the simple (non-trade-weighted) average tariff rate of the then GATT mem-bers was at around 22 per cent, which then fell to around 15 per cent by the time of the second Geneva Round in 1956 (Brown and Irwin, 2015).
45 The weighted average being lower than the sim-ple average can suggest that products with high tariffs are not much traded.
46 The IAEG-SDGs is composed of 28 United Nations Member States representing 11 regional groups, with regional and international agencies participating as observers. The main responsibility mandated to the IAEG-SDGs is to develop a list of indicators, as well as an indicator framework that will help countries to review and monitor the progress made towards achieving the SDGs and their associated targets at the global level. The indicators are to be developed by taking into account existing efforts by different groups of countries and organizations. Between June and December 2015, the IAEG-SDGs has conducted two meetings, and a series of open consultation involving
II. Tariffs and the Sustainable Development Goals 39
and 2014. Out of 44 products, 20 are under HS84, 9 under HS85 and 15 under HS90.
56 The national tariff lines are more detailed than the HS 6-digit, generally with a couple of more digits add-ed after the HS 6-digit. Once the ex outs are taken into account, the actual coverage of products for tariff re-duction can be quite restricted. See Biores Volume 6(4) APEC’s environmental goods initiative: How climate friendly is it? (http://www.ictsd.org/bridges-news/biores/news/apecs-environmental-goods-initia-tive-how-climate-friendly-is-it). 57 The TNT initiative was formed under the partnership between UNCTAD, the African Development Bank, the International Trade Centre and the World Bank. The TNT initiative aims to facilitate the collection of tariffs, NTMs and other trade data, and provide free and open access to the data collected.
58 See the UNCTAD Review of Maritime Transport Series (http://unctad.org/en/Pages/Publications/Re-view-of-Maritime-Transport-(Series).aspx) for more detail.
59 See figures 3 and 5 in UNCTAD (2015b).
60 The Paris Agreement of aims at controlling the increase in global temperature to below 2 ˚C above pre-industrial levels, and to pursue efforts to limit it to 1.5 ˚C. For that purpose, countries agreed to aim to reach peaking of greenhouse gas emissions and to achieve carbon neutrality (i.e. limiting emissions to the level that can be naturally absorbed by forests, oceans and soil) between 2050 and 2100 (KPMG, 2015).

TRADING INTO SUSTAINABLE DEVELOPMENT:TRADE, MARKET ACCESS, AND THE SUSTAINABLE DEVELOPMENT GOALS40
Nicita A and Rollo V (2013). Tariff Preferences as a Determinant for Exports from Sub-Saharan Africa. Policy Issues in International Trade and Commodities. Study Series No. 68. UNCTAD.
United Natios (2015). Results of the list of indicators reviewed at the second IAEG-SDG meeting. Available at UN Department of Economic and Social Affairs website: http://unstats.un.org/sdgs/iaeg-sdgs/.
UNCTAD (2013). Non-tariff Measures To Trade: Economic and Policy Issues for Developing Countries. United Nations publication.
UNCTAD (2015a). Key Statistics and Trends in Trade Policy 2015. United Nations publication.
UNCTAD (2015b). Key Statistics and Trends in International Trade 2015. United Nations publication.
UNEP (United Nations Environment Programme) (2012). Trade and Environment Briefings: Environmental Services. UNEP/International Trade Centre/International Centre for Trade and Sustainable Development.
References
Amador M and Bagwell K (2012). Tariff revenue and tariff caps. The American Economic Review. 102(3): 459–465.
Brown C and Irwin D (2015). The urban legend: Pre-GATT tariffs of 40%. VOX CEPR’s Policy Portal (http://www.voxeu.org/article/myth-40-pre-gatt-tariffs).
Fugazza M (2015). Maritime Connectivity and Trade. Policy Issues in International Trade and Commodities. Research Study Series No. 70. UNCTAD (United Nations Conference on Trade and Development).
Humphrey T (1987). Classical and neoclassical roots of the theory of optimum tariffs. Richmond Federal Reserve Economic Review: 17-28. (https://www.richmondfed.org/~/media/richmondfedorg/publications/research/economic_review/1987/pdf/er730402.pdf)
KPMG. (2015). The COP21 Paris Agreement: A Clear Signal to Business. KPMG International.
McLaren A (2016). Policy space in agricultural markets, Policy Issues in International Trade and Commodities. Study Series No. (XX). UNCTAD.
Nicita A and Murina M (2014). Trading with Conditions: The Effects of Sanitary and Phytosanitary Measures on Lower Income Countries’ Agricultural Exports. Policy Issues in International Trade and Commodities. Research Study Series No. 68. UNCTAD.

In today’s international trade, non-tariff measures (NTMs) are an important determinant of market access conditions and trade costs, particularly of exports of developing countries. This chapter discusses how a country’s policy actions aiming at the United Nations Sustainable Development Goals (SDGs) could act as NTMs that affect the trade flows with its trading partners, thereby affecting the country’s own, and the partners’, potential to use trade as an effective means of implementation. This chapter proposes instruments that countries can use when aiming to ensure no or minimal trade-off between social and environmental development on the one hand and trade growth and economic development on the other hand.
1. Non-tariff measures in international trade
First of all, let us clarify what non-tariff measures really are.
The term NTMs refers to a large scope of policy measures. There are over 170 distinct NTMs under 15 broad categories according to the international taxonomy for NTMs, which has been developed by a Multi-Agency Support Team (MAST) group initiated and coordinated by the United Nations Conference on Trade and Development (UNCTAD) (table 1).61
As can be seen in table 1, technical NTMs are essentially domestic regulatory measures that aim at achieving a country’s legitimate objectives, such as protecting health or the environmental. These domestic measures may be seen as trade-related because they can de facto have an impact on a country’s imports by changing quantities imported or prices, or both. However, these NTMs de jure are not used for trade protectionist purposes (UNCTAD, 2010).
By contrast, non-technical NTMs, often referred to as non-tariff barriers (NTBs) refer to trade policy measures other than tariffs, which directly aim at influencing the quantities or prices of traded goods. Category F in table 1, for example, clearly falls within the definition of NTBs. That is, NTBs form a subset of NTMs.62
NON-TARIFF MEASURES AND THE SUSTAINABLE DEVELOPMENT GOALS
III

TRADING INTO SUSTAINABLE DEVELOPMENT:TRADE, MARKET ACCESS, AND THE SUSTAINABLE DEVELOPMENT GOALS42
UNCTAD has made significant progress in enhancing transparency of NTMs and collected NTM data for many countries. Some preliminary statistics are derived from existing data (UNCTAD, 2016).63 Figure 1 illustrates the frequency of major NTMs in world trade across different product sectors. The frequency index is the percentage of the World Customs Organization’s Harmonized System (HS) 6-digit lines that are affected by NTMs, and the coverage ratio is the percentage of trade affected by the NTMs in total trade.
The most frequently observed NTMs today are two types of “technical measures”, namely sanitary and phytosanitary (SPS) measures and technical barriers to trade (TBT) (UNCTAD, 2010). According to the World Trade Organization (WTO) Agreement on the Application of Sanitary and Phytosanitary Measures, SPS measures are those that are applied, among others, to protect human, animal or plant life or health from pests or diseases within the territory of a country (i.e. a WTO member State) or protect human or animal life or health from harmful substances in food or drink. By nature, SPS measures are applicable largely to
agrifood products. SPS measures affect almost 80 per cent of world trade on agricultural products, or about 10 per cent of world trade as a whole.
TBT measures are standards or mandatory re-quirements on product characteristics or their related processes or production methods, including technical regulations, testing and certification procedures.64
TBT measures are most prevalent in international trade, with more than 30 per cent of product lines and almost 70 per cent of world trade affected (UNCTAD, 2016).
2. Non-tariff measures as the key determinant of market access conditions and trade costs
Historically, market access conditions in international markets were determined by the level of customs duties (tariffs) on imported products. In recent years,
Technical measures Non-technical measures
A. Sanitary and phytosanitary measures
B. Technical barriers to trade
C. Pre-shipment inspections and other formalities
D. Contingent trade-protective measures
E. Non-automatic licensing, quotas, prohibitions and quantity-control
measures
F. Price-control measures, including additional taxes and charges
G. Finance measures
H. Measures affecting competition
I. Trade-related investment measures
J. Distribution restrictions
K. Restriction on post-sales services
L. Subsidies (excluding export subsidies)
M. Government procurement restrictions
N. Intellectual property rights
O. Rules of origin
* Each broad category contains disaggregated policy measures and regulations. Although not listed here, the classification also provides for export-related non-tariff measures such as export prohibition, licences, etc.
Table 1. International classification of import-related non-tariff measures*

III. Non-Tariff Measures and the Sustainable Development Goals 43
the AVE of NTMs at around 21 per cent, compared with the average tariff of 7 per cent on the same product group (UNCTAD 2013).66 Figure 3 compares the magnitude of the trade-restrictiveness of different types of NTMs across sectors. It is clear that TBT and SPS measures account for the bulk of AVEs in almost all product groups. The trade restrictiveness of SPS measures in the fruits and vegetables sector can be as high as an 18 per cent AVE, while that of TBT measures in the machinery and electronics sector could be around a 12 per cent AVE (Cadot et al., 2015).
As a result, the existence of NTMs is often associ-ated with a rise in domestic consumer prices. Andria-mananjara et al. (2004), using prices in the apparel sector in the United States of America, Canada and the European Union, show that these prices would have been 15 per cent, 66 per cent and 25 per cent, respec-tively, lower without NTMs. In the agricultural sector, prices were higher by 30 per cent in Mexico and 90 per cent in South Africa because of NTMs.
however, tariffs have become less restrictive as a result of tariff liberalization taking place multilaterally, via bilateral and regional trade agreements, or unilaterally. In 2014, between 60 and 70 per cent of agricultural and manufacturing goods in world trade were imported duty-free (UNCTAD, 2016).65
Against the trends of falling tariffs, the use of NTMs is on the rise. The overall restrictiveness of NTMs is commonly expressed as the ad valorem equivalents (AVEs) that exporters face in foreign markets. For instance, the AVE of 10 per cent means that the trade-restrictive impact of a given NTM is equivalent to that of a tariff rate at 10 per cent.
Figure 2 presents the AVEs of NTMs across different sectors in different income groups. In all cases, NTMs pose a significantly higher barrier to exporters than tariffs. The AVE is the highest for the agricultural exports of low-income countries: the AVE at 22 per cent is three times higher than the average tariff of 5 per cent facing the same product group. Also, for middle income countries, the agricultural exports face
Figure 1(a) and (b). Non-tariff measures in world trade, by type and broad category (2014)
*SPS = sanitary and phytosanitary measures; TBT = technical barriers to trade.
Source: UNCTAD Key Statistics and Trends in Trade Policy 2015.

TRADING INTO SUSTAINABLE DEVELOPMENT:TRADE, MARKET ACCESS, AND THE SUSTAINABLE DEVELOPMENT GOALS44
0
5
10
15
20
25
30
35
Total Ag. Mfg. Total Ag. Mfg. Total Ag. Mfg.
High income Middle income Low income
NonTariff Tariff
Figure 2. Trade restrictiveness of non-tariff measures relative to tariffs (Ag: agriculture, Mfg: manufacturing)
Source: UNCTAD 2013.
0 5 10 15 20 25 30
Animals and meatFruits, vegetables and grains
Fats & oilsProcessed food, beverages & tobacco
MineralsChemicals
PlasticsLeather
Wood productsPaper
Textile and clothingFootwear
Stone & glass manufacturesPrecious metals, pearls
Metals and metal manufacturesMachinery and electronics
VehiclesOptical & medical instruments
ArmsMiscellaneous
Average
NTM ad-valorem equivalents in %
SPS
TBT
Other NTMs
Figure 3. Ad-valorem equivalents of sanitary and phytosanitary measures, technical barriers to trade and other non-tariff measures: World average by sector
Source: Cadot et al., 2015.

III. Non-Tariff Measures and the Sustainable Development Goals 45
3. Non-tariff measures as policy interfaces between trade and the sustainable development goals
As discussed above, NTMs have become the key determinant of market access conditions in world trade as well as a major source of trade costs. However, eliminating NTMs from the international trading scene is not an option. This is because many NTMs are first and foremost domestic regulations that aim at achieving developmental (e.g. social or environmental) objectives that are largely non-trade related. In fact, the vast majority of NTMs are SPS measures and TBT which are commonly used to protect consumer health, animal or plant life and the environment. They directly target issues related to sustainable development, such as the quality of food, health and safety standards or requirements for sustainable production methods. A list of examples is presented in table 2.
It should be noted that SPS or TBT measures applied by an importing country do not always result in trade reduction. An SPS or a TBT measure on a particular product can increase the competitiveness of a certain exporter vis-à-vis others if the former can comply with the technical requirements with little costs. In the same vein, SPS/TBT measures can impose proportionally higher trade costs on exporters of low-income developing countries than on those of developed countries. This is because exporters in the former are generally constrained in terms of their ability to adopt new and possibly more advanced production methods and processes and key export services, including the facilities needed for product conformity assessment (Penello Rial, 2014; Murina and Nicita 2014; Anders and Caswell, 2009).
Sustainable Development Goals Examples of SPS measures and TBT that could contribute to meet the objectives
Goal 2: End hunger, achieve food security and improved nutrition; promote sustainable agriculture
- Measures to protect health of humans, animals and plants, including protection of agricultural production from pests and diseases (SPS)
Goal 3: Ensure healthy lives; promote well-being for all
- Measures to protect human health from risks arising from additives, con-taminants, toxins or disease-causing organisms in food/drink (SPS), based e.g. on the recommendations of Codex Alimentarius
- Measures to protect consumers by informing them about production methods, e.g. labelling of sugar content, GMO labelling, etc. (SPS/TBT)
- Measures to regulate safety of imported pharmaceutical products and hazardous substances that may have adverse effect on human health (SPS/TBT)
Goal 12: Ensure sustainable consumption and production patterns
- Measures to regulate production and prohibit/control imports of products that cause environmental damage (TBT)
Goal 13: Take urgent action to combat climate change and its impacts
- Measures to regulate production and trade with respect to carbon foot-prints, following the United Nations Framework Convention on Climate Change and its Kyoto Protocol (TBT)
Goal 14: Conserve and sustainably use oceans, seas and marine resources
- Measures to protect ecosystems and biodiversity from pests and invasive species (SPS)
Goal 15: Protect, restore and promote sustainable use of terrestrial ecosystems, sustainably manage forests, combat desertification; halt and reverse land degradation; halt biodiversity loss
- Measures to regulate trade of products with hazardous substances or pollutants harming aquatic or terrestrial ecosystems (TBT)
- Measures to prohibit trade of endangered flora/fauna following the Con-vention on International Trade in Endangered Species of Wild Fauna and Flora (TBT)
Source: Based on UNCTAD Policy Brief No.37 “Non-tariff measures and sustainable development goals: Direct and indirect linkages
(UNCTAD, 2015).
Table 2. Direct linkages between Sustainable Development Goals and non-tariff measures

TRADING INTO SUSTAINABLE DEVELOPMENT:TRADE, MARKET ACCESS, AND THE SUSTAINABLE DEVELOPMENT GOALS46
Thus, domestic policy measures that countries all over the world may apply during the SDG implementation phase (2016-2030) can be classified as SPS measures or TBT. This suggests the possibility that world trade will be facing an increasing number of NTMs in the next 15 years.
The possible increase in NTMs is likely to be most pronounced in South–South trade, given that the use of domestic regulations aiming at social and environmental sustainability is currently less common in developing countries than in developed countries. This may cause challenges for many developing countries whose export diversification (in goods and destinations) and trade growth in the past two decades stemmed from the massive increase in South–South trade.
It is important to note that a domestic regulatory measure aiming at a specific policy objective such as food safety or environmental protection may generate, albeit non-intended, an impact on other SDGs. By affecting trade, NTMs can support or weaken economic development and the advancement of certain SDGs. The effect can either occur domestically or in countries exporting goods to the NTM-imposing
country, thereby influencing the trading partners’ potential to use trade for meeting the SDGs. In this way, the domestic regulation that can act as a NTM is a policy interface between trade and the SDGs (see figure 4). Given that the 2030 Agenda for Sustainable Development and the SDGs are “universal” and “integrated” agenda, collaboration and national, regional and global partnerships are essential.
Before discussing potential instruments that facilitate the use of regulatory measures to achieve certain SDGs without negative external effects we look at two examples that illustrate the strong linkage between the SDGs and NTMs.
3.1 Case 1 - Non-tariff measures and food security
Very often, the interactions between sustainable development in the social dimension and trade are multidimensional. Take the case of food security as an example. Food security exists “when all people, at all times, have physical and economic access to sufficient, safe and nutritious food to meet their
Figure 4. Non-tariff measures as policy interfaces between the Sustainable Development Goals and trade

III. Non-Tariff Measures and the Sustainable Development Goals 47
dietary needs and food preferences for an active and healthy life” (FAO, 1996). According to the Food and Agriculture Organization of the United Nations, food security rests on four pillars: access, availability, stability and utilization. Food access refers to the adequate resources, purchasing power and access to markets to obtain food.67
There is a direct linkage between food security and the market access conditions of a country. “Border measures” such as non-automatic licences and quotas directly influence the availability and affordability of food for people in the country. It is important also to note that the removal of trade restrictions may not be unambiguously beneficial for food security.68
“Behind the border” measures such as technical NTMs can also have a significant impact upon a country’s imports, and thus can have a short-term impact upon the country’s food security. Consider the case of SPS measures and TBT measures.
A large number of SPS measures and TBT aim at ensuring food safety for consumers, for example, by setting quality standards and labelling requirements. Other strains of SPS measures and TBT include inspection, quarantine or temporary import prohibitions with a view to protecting the life and health of plants and animals from imported pests and diseases (Farrell, 2013). By doing so, these measures can have an immediate impact on food security in terms of the utilization and availability of healthy and nutritional food.
At the same time, however, complying with SPS measures and/or TBT can incur significant costs to domestic producers as well as to the foreign producers/exporters, which can increase the consumer prices of food in the domestic market. This can reduce the affordability of food to low-income groups in the economy, at least in the short term. In addition, compliance requirements related to SPS measures/TBT may delay or complicate the process to import food. Hence measures aiming at food safety could have a second-order impact on food security in terms of access, availability and stability. Van Tongeren et al. (2009), using their cost–benefit analysis framework, conclude that the cost of further tightening certain European Union regulations on consumers could
surpass potential gains to the initial beneficiaries of such measures.
Also important to note is that SPS and TBT measures on a given agrifood product applied by a significant importer in world food trade can have a significant, at times damaging, impact upon developing-country exporters. Otsuki et al. (2001) show that the European Union ‘s standards on aflatoxin levels that go beyond Codex guidelines may prevent up to 2.3 cancer deaths in the European Union per year, but cost African exporters an annual US$ 670 million. Murina and Nicita (2014) show that the trade-reducing impact of SPS measures in the European Union can be significantly larger, by around US$ 3 billion, on exporters of low-income countries than on their competitors in other countries.
3.2 Case 2 – Environmental regulations as non-tariff measures
About 10 per cent of all measures notified under the WTO SPS Agreement and the TBT Agreement cite environmental protection as one of their objectives, including controls on hazardous substances, air pollution or waste management.69 (WTO, 2015) Many countries have introduced policy measures to prevent the deterioration of the ozone layer by phasing out the production of ozone-depleting substances, based on the provisions of the Montreal Protocol on Substances that Deplete the Ozone Layer, which became effective in 1989 and universally ratified since then.70
Recent studies find that strict environmental regulations adopted by developed country markets can have an asymmetric trade impact upon different exporters, depending on their level of development in general and technological progress in particular. In many cases, strict environmental regulations adopted by developed country markets harm exports from developing countries more than those from developed countries, which may have already adopted similar environmental provisions (Ederington et al., 2003; Fontagné et al., 2005). This is why some argue that developed countries may be using environmental regulations as a tool for “green protectionism” against imports from developing countries (Roberts, 2011).

TRADING INTO SUSTAINABLE DEVELOPMENT:TRADE, MARKET ACCESS, AND THE SUSTAINABLE DEVELOPMENT GOALS48
This relates to another highly topical issue: non-governmental or “private” standards or requirements. Among the most widespread of such regulations are environmental labels, applied by supermarkets (or by external certification bodies) to inform consumers about how sustainably the product was produced, transferred, distributed, its input factor purchased, and so forth. These non-governmental voluntary requirements can determine the “market entry condition” of a product, that is, whether it gets on the shelf of a supermarket chain which imposes a voluntary environmental standard upon the products sold in its shops (UNCTAD, 2003). These voluntary private standards are not official NTMs in a strict sense, but the impact upon international trade, especially of agrifood exports from developing countries, has been increasing and should not be overlooked.71
A concern is that domestic businesses with pollution-intensive production methods may choose to relocate to another country with less strict regulations and continue to export to other countries, instead of transforming their production methods to less polluting ones. This “pollution haven” hypothesis has been supported by considerable empirical evidence, such as Copeland and Taylor (1994) or McGuire (1982). It suggests the need for a global partnership and joint regulatory action to globally eliminate environmentally harmful production practices.
As in the case of NTMs and food security, it is important to pay attention to multifaceted interactions among environmental regulations, the ultimate environmental objectives and trade flows. On the one hand, without an environmental regulation, the drive to achieve rapid economic growth (e.g. via exports) can result in environmental degradation. On the other hand, a domestic environmental measure can impose higher trade costs. And through it, it can generate substantive impact upon exports of the country’s trading partners, and their potential to use trade as an effective means of implementation for the SDGs.
In the longer run, however, the short-run costs of adapting to NTMs may be outweighed by environmental benefits. For example, a costly one-time investment in a new energy-saving production technology may turn out to be financially beneficial and increase competitiveness in the long run. In this context, the
key challenge to the government is to strike a balance between maximizing the impact of domestic policy reforms aiming at the SDGs, while reducing their potentially negative impact upon trade.
4. Making non-tariff measures work for sustainable development: Achieving coherence at all levels
As outlined above, the complexity of the direct and indirect effects of domestic measures on sustainable development creates a challenge. The recent introduction of the SDGs may further encourage countries to adopt, and expand the use of, domestic policy measures because of their direct impact on sustainability. This incentive may be particularly pronounced for developing countries whose markets are currently less regulated in terms of consumer and environmental protection than those of developed countries.
Policymakers face the need to assess whether and to what extent sustainability policies might conflict with their own economic growth and that of their trading partners. Advancing sustainable development at the cost of economic growth is a trade-off that needs to be qualitatively and quantitatively assessed when implementing domestic policy measures for sustainable development. In this section, we present several instruments for ensuring there is no or minimal trade-off between social and environmental development on the one hand and trade-led growth on the other hand.
Advancing the discourse on interfaces between trade and sustainable development is particularly relevant for developing countries. Identifying and analysing such interlinkages would require solid analysis with a country-specific focus. However, one thing is clear: as discussed in this chapter, the various policy measures developed by countries, each aiming at certain social and environmental SDGs, can impose significant trade costs in the form of new NTMs. This burden is disproportionately larger for developing country exporters.

III. Non-Tariff Measures and the Sustainable Development Goals 49
To fight off potential negative interlinkages via trade between the SDGs of one country and another, achieving policy coherency at all levels is a solution. At the national level, for instance, it may require informing the ministries responsible for achieving different (social and environmental) SDGs about the potential implications of their policy measures for trade and economic sustainability. It may require certain harmonization of social or environmental standards across countries, which may increase the efficacy of such standards at the global level, and reduce trade costs.
The following section discusses the coherency question at each level of policymaking – the national, the international and the regional.
4.1 Coherence at the national level
Policy coherence refers to a coordinated and synergetic approach towards a certain policy question within a country, for example, across ministries or other policymaking bodies. SPS measures and TBT are in general designed and implemented by non-trade ministries, such as the ministries of health, of energy, of agriculture and fisheries, of infrastructure and transport. When designing an environmental regulation, for example, it should be borne in mind that its impact upon trade is likely to be outside the scope of a ministry of environment. Inter-ministerial coordination would be crucial if NTMs are to be employed effectively as sustainable development policies (CSEND, 2011; Cadot, Malouche and Sáez, 2012).
The Trade Facilitation Committees provided for in the WTO Trade Facilitation Agreement (TFA) aims to bring together all stakeholders to ensure a coherent implementation of the provisions in the TFA. Though mainly focusing on procedural obstacles, such committees should be extended or complemented by national NTM committees (Cadot, Malouche and Sáez, 2012). Effective and coherent design and implementation at the national level is important and a pre-requisite for an effective global partnership.
The TFA also provides for the publication of all procedures for importation and exportation of goods. Many governments need support to map systematically the corresponding information on NTMs. This requires technical assistance. The data should be globally comparable and easily accessible for importers, exporters as well as policy makers and trade negotiators.72
4.2 Coherence at the international level
The divergence of SPS and TBT policy measures across countries can become extremely costly, particularly to exporters of low-income countries. First, trade costs would arise from the need to modify production methods in order to meet the requirements in importing countries. If countries A and B set different requirements upon the same product, even to achieve the same objective, that may force an exporter of the product with a quantitative capacity to supply both to A and B to concentrate on just one market, as modifying production lines according to two different requirements may be too costly.
Second, trade costs arise not only from the need for technical modification or fine-tuning, but also from the administrative cost of compliance, such as laboratory testing, the fee to be paid to certification bodies, etc. A number of surveys of developing country exporters reveal that the costs and the time required for conformity assessment can form the most inhibitive part of the NTMs-induced trade costs they face. This is very often due to high costs involved in testing and certification or a lack of proper certifying facilities (ITC, 2013).73
International regulatory convergence can reduce trade costs by increasing the size of the market. One way to achieve such convergence is through internationally harmonizing the definition and the requirements associated with measures to achieve a common objective. Harmonization of such measures at the international level is expected to have a strong trade-enhancing effect because it reduces home bias, the general preference for domestic products, particularly

TRADING INTO SUSTAINABLE DEVELOPMENT:TRADE, MARKET ACCESS, AND THE SUSTAINABLE DEVELOPMENT GOALS50
partial, not only in a geographical sense, but also in terms of the need to achieve sustainable development in all social, environmental and economic dimensions universally.74
4.3 Reducing “structural regulatory distance” at the regional level
As regards coherence at the regional level, chapter II discussed the increasing prevalence of environmental and social provisions in regional trade agreements (RTAs) that are aiming at “deep integration”, and these provisions can help the member countries to achieve social, environmental and economic sustainability in an integrated way. Chapter II also notes that the actual level of enforceability of these provisions in many RTAs is weak, and the effectiveness of such provisions in achieving social, environmental or interregional trade outcomes is ambiguous.
UNCTAD recently conducted an empirical analysis on the impact of regulatory convergence on trade flows among 10 Latin American countries (UNCTAD, forthcoming in 2016). Regulatory convergence among countries is measured by the similarity of regulatory patterns of NTM types applied to a specific product classified at the HS 6-digit level.75 For example, one may suspect a high trade restrictiveness if two countries each apply ten different product requirements to lemons. However, if both countries apply the same types of measures, regulatory convergence would be considered high and the expected impact on trade is low. Conversely, if the two countries apply very different regulatory measures, the trade impact is high. UNCTAD’s initial estimations confirmed this intuition, which suggests that regulatory convergence can substantially reduce the trade impact of NTMs.
The overall economic gains from addressing NTMs are substantial. For example, UNCTAD has assessed the potential impact of reducing costs related to NTMs in the 15 member countries of the Southern African Development Community (SADC) (Knebel, Peters and Vanzetti, forthcoming in 2016). The gains amount to US$ 6 billion through a 25 per cent reduction of NTM-related trade costs. No member country is worse off from the reforms. The largest gains stem
in developed countries (WTO, 2012). As products are produced according to the same standards or technical regulations, consumers become more confident about the quality of the import and information costs are reduced (Dissanayaka et al., 2001; Baller, 2007).
The question is: how to harmonize? Harmonization on the basis of international standard guidelines, such as those set under Codex Alimentarius is commonly cited as being beneficial for developing countries. Facilitating market access through harmonization could have strong positive effects for developing country exporters. As Gebrehiwet, Ngqangweni and Kirsten (2007) show, South Africa could have gained US$ 69 million per year from food exports from 1995 to 1999 if five Organisation for Economic Co-operation and Development countries had adopted the levels for aflatoxin in food products recommended by Codex instead of their individual higher maximum levels. Shepherd (2007) argues that harmonization towards international standards enhances export diversification into new markets more than harmonization achieved on a bilateral basis.
Disdier et al. (2012) look into 43 North–South economic integration agreements (EIAs) and assess how the harmonization of TBT provisions impacts the trade integration of the Southern countries. If the EIA promotes the adoption of an international standard by the developing country, they find an overall trade-enhancing effect. On the other hand, if developing countries set a new TBT standard by adapting the requirements used by Northern (i.e. developed-country) partners on EIAs, the resulting rise in their producer prices make them less competitive in South–South trade. The authors conclude that an increase in exports to the Northern partner via harmonization of standards within EIAs would be cancelled out by a reduction in South–South trade.
Despite the significant advantages of international collaboration in harmonizing standards, particular attention must be paid to developing countries and the least developed countries in the drafting of international treaties and standards. Priorities differ between developing countries and developed ones, and also among developing countries themselves. Setting the policy priorities of developed countries as the global ones risks the achievement becoming only

III. Non-Tariff Measures and the Sustainable Development Goals 51
from reducing the restrictiveness of SPS measures and TBT for partners from the whole world through alignment with international standards. In the case where barriers to trade from NTMs are reduced only to SADC exporters, the gains are much lower, with a total of about US$1.3 billion.
5. Conclusion
In this chapter, we have discussed that a domestic regulatory measure which can be categorized as an NTM can act as a policy interface between the SDGs and trade. While designed to meet important social and/or environmental objectives, such as regulating maximum levels for toxic residues in food, the sustainable sourcing of natural resources, or trade in polluting substances, these regulatory measures can directly affect trade flows and economic development.
NTMs, such as SPS measures and TBT employed by a country, can raise the trade costs facing its trading partners and can hinder the latter countries’, as well as its own, potential to use trade as a means of implementation for achieving the SDGs. NTMs are more trade-restrictive than tariffs in many product sectors, particularly in those that are major exports of low-income countries, such as agriculture. Hence the impact of NTMs upon increasing trade costs is particularly pronounced for low-income countries that are constrained by limited capacities to comply with NTMs.
It is crucial that a country’s policymakers in respective ministries pay greater attention, through improved coordination, to whether the interaction between different policy measures aiming at sustainable development in different fields (i.e. social, environmental or economic) would create synergies among the measures or undermine the effectiveness of each other. Balancing the sustainability-enhancing effects with the trade-restricting effects of NTMs is a core challenge for policymakers in the light of the SDGs.
Policy coherence at all levels would be crucial to avoid overlapping or contradictory policies and minimize the burden of having to comply with diverging domestic
requirements for importers. Convergence of regulatory standards at the international level has the potential to reduce the trade-reducing impacts of many domestic regulations while maintaining, if not improving, their efficacy in meeting the initial (social/environmental) policy objectives.
Endnotes
61 The MAST team is composed of the Food and Agriculture Organization of the United Nations (FAO), the International Monetary Fund (IMF), the International Trade Centre (ITC), the Organisation for Economic Co-operation and Development (OECD), UNCTAD, the United Nations Industrial Development Organization (UNIDO), the World Bank and the World Trade Organization (WTO). See the UNCTAD website (http://unctad.org/en/Pages/DITC/Trade-Analysis/Non-Tariff-Measures/MAST-Group-on-NTMs.aspx) for more details on the MAST team.
62 Technical NTMs can become NTBs if the stringency is beyond what is needed to achieve the non-trade objective.
63 There is a certain transparency gap as regards what type of SPS and TBT measures are used in which country. The WTO members are obliged to notify to WTO only when they introduce new SPS and TBT measures. Furthermore, measures following an international standard do not have to be notified. To bridge this transparency gap, the Transparency in Trade (TNT) Initiative of UNCTAD and its partner organizations – the World Bank, the International Trade Centre and the African Development Bank – collects data on all the mandatory regulations irrespective of whether or not they have been notified to WTO. The data collected so far is freely disseminated via the UNCTAD TRAINS (Trade Analysis Information System) database. Much of the following analysis is based on this database.

TRADING INTO SUSTAINABLE DEVELOPMENT:TRADE, MARKET ACCESS, AND THE SUSTAINABLE DEVELOPMENT GOALS52
64 See the WTO Agreement on the Application of SPS Measures and the WTO Agreement on TBT for the definition of these measures within the WTO framework.
65 As discussed in chapter II, however, the remaining tariffs tend to be quite trade-restrictive, particularly in the agricultural sector, with significant frequency of tariff peaks and tariff escalation.
66 Hoekman and Nicita (2011) estimate that world trade would increase by around 2 to 3 per cent if AVEs of NTMs were halved from 10 per cent to 5 per cent.
67 Food availability means that sufficient quantities of food of appropriate quality are supplied through domestic production or imports. Food stability means that access to food or its availability should not be affected by sudden shocks or cyclical events. Food utilization refers to the appropriate use of food that leads to a state of nutritional well-being where all physiological needs are met. This dimension takes into account the importance of non-food inputs (such as clean water, sanitation and health care) as well as food safety and quality (FAO, 2006; 2008).
68 There have been a large number of studies looking into the benefits of agricultural trade liberalization for food security. One argument is that trade liberalization reduces the level of self-sufficiency in food, which threatens food security in the economy. Another argument is that a higher degree of liberalization improves food security by reducing consumer prices of food. See for example Anderson et al. (2011) and Kerr (2011), who argue that agricultural trade liberalization would boost the wages of unskilled workers. FAO (2011) calls for a combination of increased agricultural productivity and general trade openness. Martin and Ivanic (2010) show that the adverse effect of higher food prices for some people would be greater than the beneficial effect on the net gainers (e.g. agricultural producers). A likely explanation for this observation is that many households, even in rural areas, are net food buyers, and raising import barriers against food products reduces food security at home.
69 See WTO website on “Environmental requirements and market access: Preventing ‘green protectionism’” (https://www.wto.org/english/tratop_e/envir_e/envir_req_e.htm).
70 For example, Canada’s proposed Ozone-Depleting Substances and Halocarbon Alternatives Regulations has the declared objective of ensuring that Canada’s international obligations under the Montreal Protocol are met and stipulates the support [of] provincial and territorial controls by introducing a prohibition on the manufacture and import of [certain ozone-depleting substances] (European Commission, 2015).
71 The United Nations Forum on Sustainable Standards (UNFSS) provides national and international fora to address the effects of private standards and aims at maximizing their impact upon sustainable development. UNFSS is formed by five international organizations, namely FAO, ITC, UNCTAD, UNEP and UNIDO. See the UNFSS website (www.unfss.org) for more detail.
72 Several international organizations provide technical assistance upon request. For example, Aid for Trade assistance can be used. UNCTAD leads the global effort to collect and classify NTMs according to the International Classification of NTMs. See www.unctad.org/ntm
73 The NTM Business Survey of the International Trade Centre reports that it is quite customary that compliance assessments weigh heavier than modifying technical requirements when trying to meet a regulatory standard in importer countries.
74 If necessary, appropriate assistance (financial, capacity-building and other) should be extended to developing countries to enable them to comply with internationally set standards.
75 This structural analysis is only feasible thanks to the international efforts, led by UNCTAD, that systematically collect NTM data according to the common UNCTAD-MAST NTM classification, which groups various NTMs into the 177 distinct measure types. Using the NTM database, the regulatory distance among countries can be measured by checking if they have the same measure type implemented for each of the roughly 5,200 distinct products classified in the Harmonized System (HS 6-digit).

III. Non-Tariff Measures and the Sustainable Development Goals 53
References
Anderson K, Cockburn J and Martin W (2011). Would freeing up world trade reduce poverty and in-equality? The vexed role of agricultural distor-tions. Working Paper Series No. 5603. World Bank.
Anders SP and Caswell JA (2009). Standards as bar-riers versus standards as catalysts: Assessing the impact of HACCP implementation on U.S. seafood imports. American Journal of Agricul-tural Economics. 41(1): 80–97.
Andriamananjara S, Dean JM, Ferrantino MJ, Fein-berg RM, Ludema RD and Tsigas ME (2004). The effects of non-tariff measures on prices, trade, and welfare: CGE implementation of pol-icy-based price comparisons. Scholarly Paper ID 539705. Social Science Research Network.
Baller S (2007). Trade effects of regional standards. A heterogeneous firms approach. Policy Re-search Working Paper Series No. 4124. World Bank.
Boza S (2013). “Assessing the Impact of Sanitary, Phytosanitary and Technical Requirements on Food and Agricultural Trade: What Does Current Research Tell Us?” SECO/WTI Academic Coop-eration Project, Working Paper Series 2.
Cadot O, Asprilla A, Gourdon J, Knebel C and Peters R (2015). Deep Regional Integration and Non-Tar-iff Measures: A Methodology for Data Analysis. Issues in International Trade and Commodities. Research Study Series No. 69. UNCTAD (Unit-ed Nations Conference on Trade and Develop-ment).
Cadot O, Malouche M, Sáez S (2012). Streamlining Non-Tariff Measures: A Toolkit for Policy Mak-ers. Washington, DC: World Bank.
CSEND. (2011). Inter-Ministerial Coordination in Trade Policy Making: Coherence and Complementar-ity in a changing environment. Geneva: Centre for Socio-Economic Development.
Copeland B and Taylor S (1994). North-South trade and the environment. The Quarterly Journal of Economics. 109(3): 755–787.
Disdier AC, Fontagné L and Cadot O (2012). North-South Standards Harmonization and Interna-tional Trade. Discussion Paper 8767. Centre for Economic Policy Research.
Dissanayaka SM, Kumaraswamy MM, Karim K and Marosszeky M (2001). Evaluating outcomes from ISO 9000-certified quality systems of Hong Kong constructors. Total Quality Management. 12(1): 29–40.
Ederington J, Levinson A and Minier J (2003). Foot-loose and pollution-free. Working Paper 9718. National Bureau of Economic Research.
European Commission. 2015. TBT Measures database. http://ec.europa.eu/growth/tools-databases/tbt/en/search/?tbtaction=search.detail&Coun-try_ID=CAN&num=442&dspLang=en&bas-datedeb=&basdatefin=&baspays=&basnotif-num=&basnotifnum2=&bastypepays=ANY&-baskeywords=.
FAO (Food and Agriculture Organization of the United Nations) (1996). Rome Declaration on World Food Security. World Food Summit. FAO.
FAO (2006). Food Security. Policy Brief Issue 2. FAO.
FAO (2008). Climate Change and Food Security: A Framework Document. FAO.
FAO (2011). The State of Food Insecurity in the World. FAO.
Farrell D (2013). The role of poultry in human nutrition. Poultry Development Review. FAO.
Fontagné L, Von Kirchbach F and Mimouni M (2005). An assessment of environmentally- relat-ed non-tariff measures. The World Economy. 28(10): 1417–1439.
Gebrehiwet Y, Ngqangweni S and Kirsten J (2007). Quantifying the trade effect of sanitary and phytosanitary regulations of OECD countries on South African food exports. Agrekon. 46(1): 23–39

TRADING INTO SUSTAINABLE DEVELOPMENT:TRADE, MARKET ACCESS, AND THE SUSTAINABLE DEVELOPMENT GOALS54
Hoekman B and Nicita A (2011). Trade policy, trade costs, and developing country trade. World De-velopment. 39(12): 2069–79.
ITC (2013). KENYA: Company Perspective. An ITC Se-riese on Non-Tariff Measures, Geneva.
Kerr W (2011). The role of international trade in achieving food security. Estey Centre Journal of International Law and Trade Policy. 12(2).
Knebel C, Peters R, and Vanzetti D (forthcoming, 2016). Sand in the Wheels Non-Tariff Measures and Regional Integration in SADC, Policy Issues in International Trade and Commodities UNCTAD/ITCD/TAB/73. Geneva: UNCTAD.
Martin W and Ivanic M (2010). The food price crisis, poverty and agricultural trade policy. In: Kara-pinar B and Häberli C, eds. Food Crises and the WTO. Cambridge University Press.
McGuire M (1982). Regulation, factor rewards, and in-ternational trade. Journal of Public Economics 17(3): 335–354.
Murina M and Nicita A (2014). Trading with Conditions: The Effect of Sanitary and Phytosanitary Mea-sures on Lower Income Countries’ Agricultur-al Exports. Policy Issues in International Trade and Commodities. Research Study Series No. 68. UNCTAD.
Nicita A (2014). Pro-poor trade policy in Sub-Saharan Africa. Journal of International Economics, 92(2), 252-265.
Otsuki T, Wilson JS and Sewadeh M (2001). Saving two in a billion: Quantifying the trade effect of European food safety standards on African ex-ports.” Food Policy. 26(5): 495–514.
Penello Rial D (2014). Study of Average Effects of Non-Tariff Measures on Trade Imports. Policy Issues in International Trade and Commodities. Research Study Series No. 66. UNCTAD.
Shepherd B (2007). Product standards, harmonization, and trade: Evidence from the extensive mar-gin. Policy Research Working Paper Series No. 4390. World Bank.
UNCTAD (2003). Report to UNCTAD Trade and Devel-opment Board. “Market entry conditions affect-ing competitiveness and exports of goods and services of developing countries: large distri-bution networks, taking into account the spe-cial needs of LDCs”.
______ (2010). Non-Tariff Measures: Evidence from Selected Developing Countries and Future Re-search Agenda: Developing Countries in Inter-national Trade Studies. United Nations publica-tion.
______ (2012). “Non-Tariff Measures to Trade: Economic and Policy Issues for Developing Countries.” UNCTAD/DITC/TAB/2012/1.
______ (2015). Non-Tariff Measures and Regional Integration in the Southern African Development Community. Geneva: UNCTAD.
______ (2015). Key Statistics and Trends in Trade Policy 2015. United Nations publication.
United Nations (2015). “Transforming our world: The 2030 Agenda for Sustainable Development.” United Nations General Assembly resolution A/RES/70/1.
Van Tongeren F, Beghin JC and Marette S (2009). A cost-benefit framework for the assessment of non-tariff measures in agro-food trade. OECD Food, Agriculture and Fisheries Working Paper No. 21. OECD Publishing.
WTO (World Trade Organization) (2012). World Trade Report 2012. Trade and Public Policies: A Clos-er Look at Non-Tariff Measures in the 21st Century. WTO.

1. Introduction
As discussed in chapter I, the Addis Ababa Action Agenda, the outcome of the Third International Conference on Financing for Development, proposes that national governments take “complementary actions” so as to realize “the potential of trade for inclusive growth and sustainable development”. This chapter discusses the importance of improving physical market access to international markets, via reduction in trade costs, as one key area for complementary action to help developing countries to effectively use trade as a means of reaching the United Nations Sustainable Development Goals (SDGs).
Among various components of trade costs, this chapter focuses on maritime connectivity, which constitutes a major component of costs associated with trade in goods. Section 2 reviews the latest evidence on trade costs and their major components. Section 3 discusses the possible relationship between trade costs, and in particular maritime connectivity, and potential gains from trade based on recent analytical contributions. Section 4 discusses the possible implications for policymaking in the context of the 2030 Agenda for Sustainable Development.
2. Trade Costs in International Trade
There is a large number of empirical works that document the importance of trade costs as a factor determining the competitiveness of enterprises and national trade performance, including participation on international production networks and diversification into new products and new markets.76
In addition to the costs associated with traditional trade policies such as tariffs, non-tariff measures (NTMs) and domestic trade costs are also found to be of great importance. Hoekman and Nicita (2011) further suggest that reducing domestic trade costs associated with bringing goods to the border (including administrative costs) can have a greater pay-off for the export competitiveness of a country than reductions in border and “behind the border” barriers in foreign markets, such as tariffs and NTMs. Arvis et al. (2013) results indicate that maritime connectivity and logistics performance are highly significant determinants of trade costs.
PHYSICAL MARKET ACCESSAND TRADE COSTS
IV

TRADING INTO SUSTAINABLE DEVELOPMENT:TRADE, MARKET ACCESS, AND THE SUSTAINABLE DEVELOPMENT GOALS56
Two categories of trade costs components exist. The first encompasses essentially costs dependent on exogenous factors, such as physical geographical distance rather than on particular policy choices. Initial work on the determinants of international transport costs, for example by Radelet and Sachs (1998), uses explanatory variables that are related to distance and geographical characteristics, such as whether countries are land locked or whether trading partners are neighbours, and to country characteristics, such as gross domestic product (GDP) per capita. Hummels (1999, 2000 and 2001) assesses whether international transport costs have declined, and introduces exporting time as a trade barrier.
The second category includes endogenous trade costs that are a direct consequence of policy choices. Martinez-Zarzoso et al. (2003) suggest that greater distance and poor trade partner infrastructure increase maritime transport costs considerably. The inclusion of infrastructure measures improves the fit of the regression, corroborating the importance of infrastructure in determining transport costs. Anderson and Wincoop (2004) provide an extensive review of trade costs that include all transport, border-related
and local distribution costs from the foreign producer to the domestic user, and produce an estimate of trade costs amounting to 170 per cent ad valorem tax-equivalent.
2.1 Trade costs across sectors and income groups
The database of trade costs that has been developed by the United Nations Economic and Social Commission for Asia and the Pacific (ESCAP) and the World Bank (UNESCAP-World Bank Trade Cost Database) provides information on bilateral trade costs inferred from the observed pattern of production and trade using a theoretically grounded approach.77 Among all the components of trade costs, maritime connectivity and logistics performance are found to be important or even predominant determinants of bilateral trade costs. The combined effect of these two factors on trade costs can be comparable to that of geographical distance.
Figures 1 and 2 show the pattern of trade costs as a percentage of the final product price for each
0
50
100
150
200
250
300
High income Upper middle income Lower middle income Low income
Per cent
1996 2010
Figure 1. Trade costs in manufacturing, 1996 and 2010, by income group
Source: UNESCAP-World Bank Trade Costs Database.

IV. Physical Market Access and Trade Costs 57
0
50
100
150
200
250
300
350
High income Upper middle income Lower middle income Low income
Per cent
1996 2010
Figure 2. Trade costs in agriculture, 1996 and 2010, by income group
Source: UNESCAP-World Bank Trade Costs Database.
020406080
100120140160180
East Asia & Pacific Europe & CentralAsia
Latin America &Caribbean
Middle East &North Africa
South Asia Sub-SaharanAfrica
Per cent
1996 2010
Figure 3. Trade costs in manufacturing, 1996 and 2010, by region
Source: UNESCAP-World Bank Trade Costs Database.

TRADING INTO SUSTAINABLE DEVELOPMENT:TRADE, MARKET ACCESS, AND THE SUSTAINABLE DEVELOPMENT GOALS58
developing countries decreased in all geographical regions between 1996 and 2010. However, the sub-Saharan Africa region faced the highest level of trade costs in 2010, which is estimated at 140 per cent of trade value, while trade costs facing the East Asia and Pacific region, which exhibited the largest fall in trade costs, was around 90 per cent.
2.2 Transport costs and the income gains from trade
Trade costs have been found to be an important determinant of export competitiveness. Trade costs mean that firms in peripheral locations suffer a market access penalty on their sales and face additional costs on imported inputs. As a consequence, firms in such countries can afford to pay only relatively low incomes to immobile factors – even if, for instance, their technologies and the institutional framework within which they operate are as good as those elsewhere.
Income gains from trade, or the domestic value added of an export, fall with the share of inputs in total costs
World Bank income group in 1996 and 2010. Two facts are immediately apparent. First, trade costs in agriculture (figure 2) are substantially higher than in manufacturing for all income groups (figure 1). This finding is consistent with the fact that global markets for agricultural production remain highly distorted and characterized by relatively high policy-related trade costs – a binding constraint for many developing countries with large agricultural sectors.
Second, trade costs are decreasing as per capita income increases: estimated trade costs are the lowest in high-income countries and the highest in low-income countries. For some middle-income countries (i.e. those that have successfully expanded their trade in the 2000s), their trade costs have rapidly declined in the studied period. By contrast, low-income countries in 2010 still faced trade costs that were roughly twice as high as the level facing middle-income countries, both in manufacturing and in agriculture.
A different magnitude of trade costs (in manufacturing) among developing countries is well manifested in figure 3, which presents the changes in trade costs across all developing regions. The trade costs facing
0.000.100.200.300.400.500.600.700.800.901.00
0.05 0.1 0.15 0.2 0.25 0.3 0.35 0.4 0.45 0.5 0.55 0.6
Costs share of inputs
0.05
0.1
0.2
0.3
0.4
0.5
0.6
0.7
0.8
0.9
Figure 4. Domestic value, costs share of inputs and trade costs
Note: Lines represent the relationship between domestic value added (vertical axis) and costs share of inputs for different levels of trade
costs (legend).
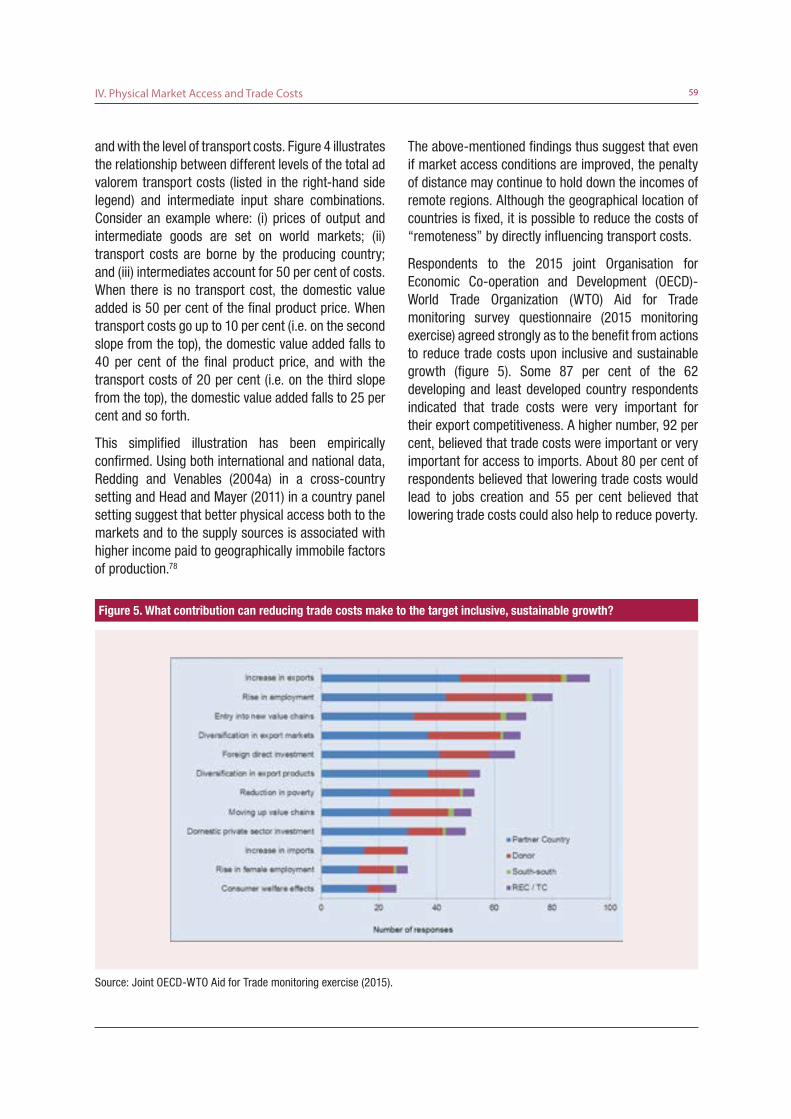
IV. Physical Market Access and Trade Costs 59
The above-mentioned findings thus suggest that even if market access conditions are improved, the penalty of distance may continue to hold down the incomes of remote regions. Although the geographical location of countries is fixed, it is possible to reduce the costs of “remoteness” by directly influencing transport costs.
Respondents to the 2015 joint Organisation for Economic Co-operation and Development (OECD)-World Trade Organization (WTO) Aid for Trade monitoring survey questionnaire (2015 monitoring exercise) agreed strongly as to the benefit from actions to reduce trade costs upon inclusive and sustainable growth (figure 5). Some 87 per cent of the 62 developing and least developed country respondents indicated that trade costs were very important for their export competitiveness. A higher number, 92 per cent, believed that trade costs were important or very important for access to imports. About 80 per cent of respondents believed that lowering trade costs would lead to jobs creation and 55 per cent believed that lowering trade costs could also help to reduce poverty.
and with the level of transport costs. Figure 4 illustrates the relationship between different levels of the total ad valorem transport costs (listed in the right-hand side legend) and intermediate input share combinations. Consider an example where: (i) prices of output and intermediate goods are set on world markets; (ii) transport costs are borne by the producing country; and (iii) intermediates account for 50 per cent of costs. When there is no transport cost, the domestic value added is 50 per cent of the final product price. When transport costs go up to 10 per cent (i.e. on the second slope from the top), the domestic value added falls to 40 per cent of the final product price, and with the transport costs of 20 per cent (i.e. on the third slope from the top), the domestic value added falls to 25 per cent and so forth.
This simplified illustration has been empirically confirmed. Using both international and national data, Redding and Venables (2004a) in a cross-country setting and Head and Mayer (2011) in a country panel setting suggest that better physical access both to the markets and to the supply sources is associated with higher income paid to geographically immobile factors of production.78
Figure 5. What contribution can reducing trade costs make to the target inclusive, sustainable growth?
Source: Joint OECD-WTO Aid for Trade monitoring exercise (2015).

TRADING INTO SUSTAINABLE DEVELOPMENT:TRADE, MARKET ACCESS, AND THE SUSTAINABLE DEVELOPMENT GOALS60
2.3 Maritime connectivity as a determinant of trade costs
Maritime connectivity and logistics performance are found to be highly significant determinants of trade costs. Most trade in manufactured and intermediate goods is nowadays transported in containerized transport services, which accounts for more than 90 per cent of all general cargo. Recent research shows that the introduction of containerization has had a stronger impact on trade than trade liberalization.79
Arvis and al. (2013) suggest that a one standard deviation improvement in liner shipping connectivity is associated with a 0.4 standard deviation reduction in trade costs. This is an effect greater than the one standard deviation improvement in the World Bank’s Logistics Performance Index (LPI), which is associated with a trade cost reduction of 0.2 standard deviations. The result is not surprising considering that around 80 per cent of the volume of goods exchanged in the world is transported by sea, and this share is even higher for most developing countries.
Given the importance of liner shipping connectivity as a determinant of a country’s trade costs and trade performance, the United Nations Conference on Trade and Development (UNCTAD) developed the Liner Shipping Bilateral Connectivity Index (LSBCI). Based on a set of 155 coastal countries observed for nine years between 2006 and 2014 (Fugazza and Hoffmann, 2015a), the LSBCI provides the degree of connectivity via liner shipping between pairs of countries.
For any pair of countries A and B represented in the reference sample, the LSBCI is based on: (i) the number of trans-shipments required to get from A to B; (ii) the number of direct connections common to both A and B; (iii) the geometric mean of the number of direct connections enjoyed by A and by B; (iv) the level of competition on services that connect A to B; and (v) the size of the largest ships on the weakest route connecting A to B. In order to establish a unit free index all components are normalized.80 The LSBCI is then computed by taking the arithmetic average of the five normalized components such that the values of the LSBCI fall between 0 and 1.
Figure 6. Liner Shipping Bilateral Connectivity Index variation between 2006 and 2014
Source: UNCTAD calculations based on the UNCTAD Liner Shipping Connectivity Matrix, based on data provided by Lloyds List Intelligence.

IV. Physical Market Access and Trade Costs 61
The ranking of countries according to the LSBCI show that Eastern Asian developing countries are among the top 20 country pairs of the highest bilateral connectivity after 2010 (appendix table 1). Both in 2010 and in 2014, the top 20 pairs had China, Hong Kong or Singapore as a partner.81 A deeper analysis shows that only 15 countries constitute the top 50 pairs in the LSBCI ranking, and only 40 countries constitute the top 250 pairs.
At the bottom of the LSBCI ranking are the country pairs composed essentially of low-income countries and small island developing States (SIDS) (appendix table 2).82
The scatter graph of figure 6 compares the LSBCI of the 11,935 country pairs in 2014 against their LSBCI values in 2006. Points above the 45 degree line represent country pairs whose LSBCI has increased between 2006 and 2014. A majority of country pairs, namely 67 per cent, moved up in terms of LSBCI performance.
We may expect improvements in maritime connectivity to have strongly contributed to the downward trend
in total trade costs highlighted above. This is confirmed by figure 7, which shows the relationship between trade costs and the LSBCI in 2012 for both manufactured goods and agricultural goods. The sign of the relationship is similar for both goods categories although the causation cannot be discussed at this stage.
There is an unambiguous linkage between maritime connectivity within countries and trade flows among them. Fugazza and Hoffman (2015b) present an empirical assessment of the relationship between bilateral maritime liner shipping connectivity and containerized goods exports during the period 2006–2013. Making use of “gravity” type trade models, the paper incorporates new data on different measurements of maritime distance, as well as a unique new data set and the new bilateral connectivity indices mentioned above.
Results indicate a strong positive relationship between the quality of maritime connectivity reflected by the LSBCI and the value of bilateral exports.83 Lacking a direct maritime connection with a trade partner is associated with lower values of exports: any additional
2012: Manufacturing 2012: Agriculture
Figure 7. Trade costs and Liner Shipping Bilateral Connectivity Index bilateral
Source: UNCTAD’s calculations.

TRADING INTO SUSTAINABLE DEVELOPMENT:TRADE, MARKET ACCESS, AND THE SUSTAINABLE DEVELOPMENT GOALS62
trans-shipment is associated with a 40 per cent lower value of bilateral exports. Results also indicate that the quality of bilateral connectivity is a crucial determinant of bilateral exports. In general, empirical results suggest that the impact of geographical remoteness can be alleviated by improvements in maritime connectivity. Improvements can be “quantitative” (e.g. increasing the number of direct connections) or “qualitative” (e.g. increase the degree of competition on existing connections).
3. Trade Costs, Maritime Connectivity and Income
Trade costs consist of the costs associated with all factors that drive a wedge between the producer price in an exporting country and the consumer price in an importing country. Hence the distance of a country from major markets affects the competitive advantage of its export, along other physical and institutional conditions that the country’s exporters face in selling their products in international markets.
The idea that physical access to markets is important for factor incomes dates back at least to Harris (1954), who argued that the potential demand for goods and services produced in any one location depends upon the distance-weighted GDP of all locations. Gallup et al. (1998) and Radelet and Sachs (1998) find that measures of physical geography (e.g. fraction of land area in the geographical tropics) and transport costs (e.g. percentage of land area within 100 km of the coast or navigable rivers) are important for cross-country income gaps.
Insights from the new economic geography literature reveal that the level of factor income of a country is indeed related to the trade costs it faces to reach large markets. The close relationship between trade costs and export performance, on the one hand, and trade costs and earnings, on the other hand, is elaborated theoretically and tested empirically in Redding and Venables (2004a) and Head and Mayer (2011).
Redding and Venables (2004a) show that countries which enjoy high market access in their export markets and to their own imports tend to pay relatively high wages. Their analysis, which incorporates trade
2012 2010 2006
Figure 8. Trade costs and maritime connectivity
Source: UNCTAD’s calculations.

IV. Physical Market Access and Trade Costs 63
costs into the measure of domestic and foreign market access, suggest that the effects of individual economic and geographical characteristics appear to have quantitatively important impacts upon wages.
Head and Mayer (2011) provide further evidence on the long-term impact of a country’s proximity to large markets – which they term as market potential – on economic development and average earnings. Their empirical analysis evaluates market potential for all countries in the world with available trade data over the period 1965–2003 and relates it to income per capita. Overall results show that market potential is a powerful driver of increases in income per capita. The authors estimate that if the market potential of the Democratic Republic of the Congo increased to the level enjoyed by Thailand, it wold increase the former’s GDP per capita by a factor of around 24.
The empirical results reviewed above suggest that trade costs, which directly influence export performance, influence the average level of earnings in any economy. Let us examine preliminarily the relationship between trade costs and the average income using a rough indication of possible relationship between these
factors. The findings may indicate specific areas for future empirical investigations on the causation.
Trade costs, maritime connectivity and GDP per capita: figure 8 shows an unambiguously negative relationship between trade costs and the country average LSBCI, which is in line with Arvis et al. (2013) estimates. Figure 9 then presents the relationship between GDP per capita, on the one hand, and trade costs and maritime connectivity, on the other hand. There appears to be a significant positive relationship between maritime connectivity and GDP per capita and a negative relationship between trade costs and GDP per capita.84 Although nothing can be said about the existence of any causal relation at this stage, we can safely maintain that lower trade costs and better maritime connectivity are associated with higher real GDP per capita.
Trade costs, maritime connectivity and inequality: would changes in trade costs influence inclusive growth through trade within a country? Figure 10 represents the unconditional relationship between trade costs and within-country income inequality represented by the standard Gini index.85 The relationship between trade
2012 2010 2006
Figure 9. Trade costs, maritime connectivity and gross domestic product per capita
Source: UNCTAD’s calculations.

TRADING INTO SUSTAINABLE DEVELOPMENT:TRADE, MARKET ACCESS, AND THE SUSTAINABLE DEVELOPMENT GOALS64
2010 2006
ARG
AUS
BEL BGR
BRB
CHN
COL
CRI
DEU
DNK
DOM
ECU
EGY
ESPEST
FIN
FRA
GBR
GEO
GTM HND
HRV
IDN
IND
IRLISL
ISR
ITAJOR
KHM
KOR
LTULVA
MDV
MEX
MLT
NAM
NGA
NOR
PAN
PER
POL
PRT
RUS
SGP
SLV
SVN
SWE
TUR
URYUSA
VENVNM
ZAF
150 200 250 300 350 400trade costs
ARG
BELBGR
BRA
CAN
CHL
CHN
COL
CRI
CYPDEU DNK
DOMECU
ESPEST
FINFRA
GBRGEO
GTM
GUY
HKG
HND
HRV
IDN
IRL
ISLITA
JORJPN
KEN
KOR
LTU
LVA
MEX
MLTMNE
NLD NORPAK
PAN
PER
PHL
POL
PRT
PRY
RUSSLV
SVN
SWE
TGO
THATURUKR
URY
USAVEN
VNM
ZAF
150 200 250 300 350trade costs
Figure 10. Trade costs and income inequality
Source: UNCTAD’s calculations.
2010 2006
ARG
AUS
BEL
BGD
BGR
BRB
CAN
CHN
COL
CRI
CYP
DEU
DNK
DOM
ECU
EGY
ESPEST
FIN
FRA
GBR
GEO
GTMHND
HRV
IDN
IND
IRLISL
ISR
ITAJOR
KHM
KOR
LTULVA
MDG
MDV
MEX
MLT
NAM
NGA
NLDNOR
NZL
PAN
PER
POL
PRT
RUS
SGP
SLV
SVN
SWE
TUR
TWN
URYUSA
VENVNM
ZAF
ARG
BELBGR
BRA
CAN
CHL
CHN
COL
CRI
CYPDEUDNK
DOMECU
ESPEST
FINFRA
GBRGEO
GTM
GUY
HKG
HND
HRV
IDN
IRL
ISLITA
JORJPN
KEN
KOR
LTU
LVA
MEX
MLTMNE
NLDNORPAK
PAN
PER
PHL
POL
PRT
PRY
RUSSLV
SVN
SWE
TGO
THATUR
TWN
UKR
URY
USAVEN
VNM
ZAF
Figure 11. Maritime connectivity and income inequality
Source: UNCTAD’s calculations.

IV. Physical Market Access and Trade Costs 65
costs and inequality appears to be clearly positive, suggesting that countries facing high trade costs tend to exhibit high income inequality within the economy. The relationship appears to be best fitted by a linear approximation (red line) than a quadratic one (green line) in both 2006 and 2010.86
Figure 11 relates the Gini index to maritime connectivity measured by LSBCIs. The simple linear relationship appears to be weakly negative. The quadratic (non-linear) fit of the possible relationship between the Gini index and the LSBCI is clearly an inverted-U relationship. This may be interpreted as implying that a rise in maritime connectivity first increases income inequality and then decreases once a certain threshold is reached. However, the slope of the quadratic fit curve in 2010 is visibly weaker than that in 2006.
Once again, these are only preliminary investigations with virtually absent theoretical grounds and insights. Nevertheless, we believe that these simple relationships may be the reflection of some deeper mechanisms which, if unveiled, may contribute significantly to a refined understanding of the relationship between trade, trade reform and income inequality.
4. Implications for policy intervention
We have seen above that many low-income countries and SIDS face high trade costs, a large part of which arises from transport costs.87 This may significantly limit their income gains from trade, and reduce their potential to capture new trading opportunities arising from market access improvement in their importing markets.
Physical access to markets is clearly a challenge for firms in peripheral locations and countries. Their remoteness negatively affects their export competitiveness not only because of higher transport costs to their markets, but also because they would have to pay relatively higher prices to imports of inputs. In this context, reducing trade costs in general, and improving maritime connectivity in particular, constitutes a valid complementary policy action for realizing “the potential of trade for inclusive growth
and sustainable development” as stated in paragraph 88 of the Addis Ababa Action Agenda United Nations, 2015).
Rather surprisingly, there is a gap between the recognition by governments (and donors) that trade costs are important and their plan of action (their allocation of funds) aiming at the reduction of trade costs. The aforementioned OECD-WTO Aid-for-Trade survey of 2015 (OECD-WTO, 2015) shows that while 87 per cent of the 62 developing countries (including least developed countries) respondents recognized the importance of trade costs, only 62 per cent of respondents indicated that trade costs were addressed in their national development strategies, 60 per cent that they were addressed in their national trade strategies, and 53 per cent that they were addressed in sector-specific strategies. The percentage is even lower for infrastructure strategy (35 per cent), although this sector is one that has considerable potential to influence trade costs and performance.
What type of policy actions can be used to reduce trade costs? As mentioned previously, trade costs consist of various components. Figure 12 presents a trade costs diagnostics template proposed by Moïsé and Le Bris (2013). There are different types of trade costs, which are grouped in terms of whether they are the costs arising at the border, getting to the border or behind the border. The “getting to the border” trade costs are those associated with the export-related activities, while the “behind the border” trade costs are those incurred by the import-related activities. At the border, there are direct costs, indirect costs and hidden costs accruing to imports and exports, separately.
The multilateral trade negotiations have essentially concentrated on elements belonging to the “at the border” costs, essentially tariffs and certain procedural aspects of trade (e.g. import licensing), and to some extent on elements belonging to the “behind the border” costs category. The WTO Agreement on Trade Facilitation signed during the Bali Ministerial Conference in December 2013 contains provisions for expediting the movement, release and clearance of goods, including goods in transit. It also sets out measures for effective cooperation between customs and other appropriate authorities on trade facilitation and customs compliance issues. It is an important

TRADING INTO SUSTAINABLE DEVELOPMENT:TRADE, MARKET ACCESS, AND THE SUSTAINABLE DEVELOPMENT GOALS66
step towards lowering trade costs with a potentially significant impact on trade flows.
At the national level, a government may first target the most significant source of trade costs. Trade costs components and their articulation around the border is universally applicable to all countries. However, the relative significance of each component in the total trade costs can vary considerably from one country to another. We have seen in the previous section that the weight of transport costs outside (as well as inside) the border in total trade costs can be disproportionately large to low-income countries and developing countries with lower maritime connectivity.
4.1 Areas of policy actions to improve maritime connectivity
One effective option to limit the effects of remoteness is to develop the hard and soft infrastructure needed for connecting the economy to international trade. Empirical results discussed above point to maritime connectivity as a crucial determinant of trade costs and thus trade flows. But the empirical findings are based on the indicators of trade costs, which capture the effect in aggregate of a number of specific policy actions. It may thus be essential to “unpack” these findings with a view to identifying the areas most in need of specific policy interventions for improving maritime connectivity.
The recent work by UNCTAD on maritime connectivity has attempted to disentangle the impact of each of the components of the LSBCI. Table 1 sheds some light
Figure 12. Trade costs diagnostics
Source: Moïsé and Le Bris (2013).

IV. Physical Market Access and Trade Costs 67
on the contribution of each component to the average absolute change in the LSBCI observed during the period 2006–2014. Positive and negative variations of the LSBCI have been considered separately in order to assess more precisely the contribution of each component.
The number of trans-shipments is found to be the key reason for a reduction in the LSBCI between 2006 and 2014. The other two components, which reflect the centrality of the country pair in the liner shipping network (the number of direct connections common to both countries in the pair and the average of the number of direct connections of country of the pair), also play a major role in cases where the LSBCI variation is negative. However, the contribution of both the carriers and the ship size components is close to zero.
In cases where the LSBCI increases, while all components do participate in increasing the connectivity, the strongest influence is from the number of trans-shipments and the ship size component. In brief, keeping the centrality of the country pair in the liner network is clearly the most important factor in the preservation of the LSBCI level. The relaxation of the carriers and ship size constraints can only have a second order effect.
The prevalence of the number of trans-shipments component is not surprising considering that any trans-shipment implies additional costs, time and risks of delays and damage. Empirical estimations in Fugazza and Hoffman (2015a) indicate that the number of trans-shipments affects bilateral exports negatively, and that any additional trans-shipment would reduce the value of exports by 40 per cent.
In reality, data on connectivity show that only a small part of all possible country pairs are directly connected with each other. Table 2 shows that, in 2014, about 18 per cent of country pairs were directly connected, 63 per cent of them required one trans-shipment to transport a container from one country to the other, and 16 per cent two trans-shipments. In 2006 the corresponding figures were 20 per cent, 67 per cent and 12 per cent, respectively, suggesting a gradual increase in the number of country pairs that require two trans-shipments. In both years, only a few country pairs required three trans-shipments. No country pairs require more than three trans-shipments – at least in theory.
Studies on maritime connectivity reveal the potentially important impact of the centrality, or the connectedness of a country to the international market on the country’s trade. Figure 13 compares the
Number oftransshipments Common direct Geo. direct Carriers
constraintShip size constraint LSBCI
Negative -0.101 -0.029 -0.0295 0.0068 -0.0045 -0.157
Positive 0.093 0.0176 0.042 0.0193 0.068 0.2403
Source: UNCTAD calculations.
Table 1. Decomposition of changes in the Liner Shipping Bilateral Connectivity Index: positive versus negative variation 2006–2014
Number of Trans-shipments 2006 2008 2009 2010 2011 2012 2013 2014
0 20.05 21.08 20.29 20.82 20.26 20.05 19.6 17.69
1 66.98 67.25 64.2 64.43 63.65 64.49 64.23 63.2
2 12.81 11.66 14.93 14.68 16.02 15.4 16.09 18.98
3 0.16 0.01 0.58 0.06 0.07 0.06 0.07 0.13
Note: Statistics are obtained for a sample of 155 coastal countries, that is, 11,935 country pairs.Source: UNCTAD calculations.
Table 2. Number of trans-shipments necessary to connect country pairs (shares in %)

TRADING INTO SUSTAINABLE DEVELOPMENT:TRADE, MARKET ACCESS, AND THE SUSTAINABLE DEVELOPMENT GOALS68
centrality indicator computed for each country in 2006 (horizontal axis) and 2014 (vertical axis). The indicator is given by the ratio between the observed number of direct connections and the maximum observable number, that is, 154. The diagonal corresponds to the 45 degree line. An observation lying above that line represents a country whose number of direct connections has increased between 2006 and 2014. The best performer appears to be Morocco, closely followed by the Russian Federation. Major economies such as Germany, France, the United Kingdom of Great Britain and Northern Ireland, Spain, Japan and Brazil are below the 45 degree line. This may reflect a long-lasting effect of the 2008 financial crisis and possibly a rationalization of the network of direct connections.
Centrality is a non-exclusive indicator, that is, the centrality of all countries can be improved without necessarily worsening the centrality of any country in particular. In order to improve the centrality of a country, policy intervention would include investment in hard infrastructure. In most countries characterized by poor centrality scores such policy would necessarily rely on international aid.
Another complementary policy intervention could consist of trying to create connections to major markets or connecting hubs wherever these connections do not exist. Geographical remoteness in the strict sense cannot be changed. As a consequence the definition of incentives to attract liner shipping companies to a remote location with limited market size may call for some international and multilateral action and cooperation. Public–private partnerships could be at the core of such multilateral action and cooperation. The definition and monitoring of pro-centrality measures and action plans would be relatively simple to set up.
5. Concluding summary
Improving physical access to international markets, largely by reducing trade costs, is a prerequisite for using trade (in goods) as a means of implementation to reach the SDGs. Low-income countries face on average proportionally higher trade costs than other
Figure 13. Centrality in 2006 versus centrality in 2014
Source: Fugazza and Hoffmann (2015a).

IV. Physical Market Access and Trade Costs 69
countries; improving physical access to international markets at reasonable costs is sine qua non for them to benefit from any reduction in trade barriers facing their exports as well as imports. Moreover, trade costs, including those domestic “getting to the border” costs, may be more trade restrictive than market access conditions at home as well as in foreign markets.
Among all trade costs, reduction in transport costs is an important complementary policy, particularly to low-income countries, given that prohibitively high transport costs facing many low-income countries reduce not only their potential to trade more, but also
Appendix table 1. Top 20 country pairs according to LSBCI scores in 2006, 2010 and 2014
Source: Author’s calculations.
their potential income gains from the existing trade. Improving maritime connectivity of these countries should receive special attention.
Recent UNCTAD studies suggest that policy actions by the international community to improve the maritime connectivity of developing countries, particularly low-income countries and SIDS, can primarily focus on reducing the number of trans-shipments via, among others, investment in hard infrastructure and public–private partnerships to attract liner shipping companies to remote locations.

TRADING INTO SUSTAINABLE DEVELOPMENT:TRADE, MARKET ACCESS, AND THE SUSTAINABLE DEVELOPMENT GOALS70
Appendix table 2. Bottom 20 country pairs according to LSBCI scores in 2006, 2010 and 2014
Source: Fugazza and Hoffman (2015a).
year exporter importer LSBCI year exporter importer LSBCI year exporter importer LSBCI
2014
NRU MMR 0.07
2010
MDV COK 0.08
2006
MSR MHL 0.02
NRU MNE 0.07 MDV BMU 0.08 YEM MSR 0.02
MNE BMU 0.07 COK BMU 0.08 COK COD 0.01
NRU BMU 0.07 NRU MMR 0.07 SYC MSR 0.01
GEO COD 0.03 NRU COK 0.07 SVN MSR 0.01
COD BGR 0.03 NRU ALB 0.07 SOM MSR 0.01
COM COK 0.02 NRU BMU 0.07 MSR COD 0.01
MNE COD 0.02 SYC COK 0.01 SDN MSR 0.01
SLE COK 0.02 COK BGR 0.01 MSR KHM 0.01
COK BGR 0.02 SYC NRU 0.01 PLW MSR 0.01
GEO COK 0.02 COK COD 0.01 MSR BGD 0.01
LVA COK 0.02 NRU COD 0.01 MSR MDV 0.01
IRN COK 0.02 GEO COK 0.01 MSR BRN 0.01
COK COD 0.02 COK BHR 0.01 MSR KWT 0.01
IRQ COK 0.02 IRQ COK 0.01 MSR IRQ 0.01
COK ALB 0.01 SOM COK 0.01 MSR BHR 0.01
SOM COK 0.01 ERI COK 0.01 MSR COK 0.01
NRU COD 0.01 QAT COK 0.01 MSR MMR 0.01
ERI COK 0.01 NRU IRQ 0.01 NRU COD 0.01
MNE COK 0.01 COK ALB 0.01 NRU MSR 0.01
Source: Fugazza and Hoffman (2015a).

IV. Physical Market Access and Trade Costs 71
83 An increase of one standard deviation in the LSBCI computed over the whole period is associated with an increase in the value of bilateral exports of 30 per cent for the coastal countries sample.
84 Time series data on wages exist but their time length and country coverage remain relatively limited, so average real income has been chosen as our reference series. As discussed in several papers referred to above, real GDP per capita can be seen as a good proxy for average real income at the country level as discussed above.
85 A Gini index measures the degree of deviation of income distribution within an economy from a perfectly equal distribution. A Gini index of zero represents perfect equality, and 100 represents perfect inequality. Data on Gini index estimates are retrieved from WIID (World Income Inequality Database), produced by UNU-WIDER of the United Nations University. WIID collects and stores information on income inequality for developed and developing countries and countries with economies in transition up to 2012.
86 Although some data are available for 2012, they are still too scarce to draw a dense enough scatter plot.
87 The United Nations has not officially established the criteria for determining whether a country is classified as a SIDS. UNCTAD provides an unofficial list of SIDS, which is available at: http://unctad.org/en/pages/aldc/Small%20Island%20Developing%20States/UNCTAD%C2%B4s-unofficial-list-of-SIDS.aspx.
Endnotes
76 See for instance Limao and Venables (2001), Wilson et al. (2003), Anderson and Marcouiller (2002) and Francois and Manchin (2013).
77 See Novy (2013).
78 These findings are robust across a variety of specifications, to instrumental variables estimation, and to a variety of further robustness tests. Results from natural experiments exploiting exogenous variation in economic integration provided further support to this body of econometric evidence. See for instance Hanson (1998) and Hanson and Feenstra (2000).
79 Bernhofen et al. (2013).
80 All components are normalized using the standard formula Normalized_Value=(Raw-Min(Raw))/(Max(Raw)-Min(Raw)).
81 A decomposition of the variation observed between 2006 and 2014 suggests that most of the improvement has occurred since 2010. A more precise analysis indicates that the LSBCI has stagnated for a large majority of country pairs in the immediate aftermath of the 2008 economic crisis, and has improved only after 2010.
82 The presence of Latvia and Albania in this list may reflect the fact that their centrality in the network is also weak but not because of their remote geographical situation. Their poor performance in terms of centrality comes from their close link to an important hub such as Italy for Albania or Germany for Latvia.

TRADING INTO SUSTAINABLE DEVELOPMENT:TRADE, MARKET ACCESS, AND THE SUSTAINABLE DEVELOPMENT GOALS72
Hanson G (1998). Regional adjustment to trade liberalization. Regional Science and Urban Economics. 28: 419–444.
Hanson G and Feenstra R (2000). Aggregation bias in the factor content of trade: Evidence from U.S. manufacturing. American Economic Review Papers and Proceedings. 90: 150–160.
Harris C (1954). The market as a factor in the localization of industry in the United States. Annals of the Association of American Geographers. 64: 315–348.
Head K and Mayer T (2011). Gravity, market potential and economic development. Journal of Economic Geography. 11: 281–294.
Helpman E, Itskhoki O, Muendler M-A and Redding S (2012). Trade and inequality: From theory to estimation. Working Paper No. 17991. NBER (National Bureau of Economic Research).
Hoekman B and Nicita A, (2011). Trade policy, trade costs and developing country trade. World Development. 39(12):2069-2079.
Hummels D (1995). Global income patterns: Does geography play a role? Chapter 2 of PhD Thesis, University of Michigan.
Hummels D (1999). Toward a geography of trade costs. University of Chicago.
Hummels D (2000). Time as a trade barrier. Purdue University.
Hummels D (2001). Have international transport costs declined? Journal of International Economics. 54(1): 75–96.
Leamer E (1997). Access to Western markets and Eastern effort. In: Zecchini S, ed. Lessons from the Economic Transition: Central and Eastern Europe in the 1990s. Dordrecht: Kluwer Academic Publishing: 503–526.
Limao N and Venables AJ (2001). Infrastructure, geographical disadvantage, transport costs, and trade. World Bank Economic Review. 15: 451–479.
References
Anderson JE and Marcouiller D (2002). Insecurity and the pattern of trade: An empirical investigation. The Review of Economics and Statistics. 84(2): 342–352.
Anderson J and Van Wincoop E (2004). Trade costs. Journal of Economic Literature. 42(3): 691–751.
Arvis JF, Duval Y, Shepherd B and Utoktham C (2013). Trade costs in the developing world: 1995–2010. Policy Research Working Paper Series No. 6309. World Bank.
Bernhofen DM, El-Sahli Z and Kneller R (2013). Estimating the effects of the container revolution on world trade. Working Paper No. 4136. CESifo Group.
Francois J and Manchin M (2013). Institutions, infrastructure, and trade. World Development. 46(c): 165–175.
Frankel J and Romer D (1999). Does trade cause growth? American Economic Review. 89(3): 379–399.
Fugazza M (2004). Export performance and its determinants: supply and demand constraints. Blue Series Paper No. 26. UNCTAD (United Nations Conference on Trade and Development).
Fugazza M and Hoffmann J (2015a). Bilateral liner shipping connectivity since 2006. Policy Issues in International Trade and Commodities. UNCTAD.
Fugazza M and Hoffmann J (2015b). Liner shipping connectivity as determinant of the geography of trade. Policy Issues in International Trade and Commodities. UNCTAD.
Gallup J, Sachs J and Mellinger A (1998). Geography and economic development. Proceedings of World Bank Annual Conference on Development Economics. World Bank.

IV. Physical Market Access and Trade Costs 73
Martinez-Zarzoso I, Garcia Menendez L and Suarez-Burguet C (2003). The impact of transport costs on international trade: The case of Spanish ceramic exports. Maritime Economics and Logistics. 5: 179–198.
Moïsé E and Le Bris F (2013). Trade costs: What have we learned? A synthesis report. Trade Policy Paper No. 150. OECD (Organisation for Economic Co-operation and Development).
Moïsé E, Sorescu S, Hummels D and Minor P (2013). Trade facilitation indicators: The potential impact of trade facilitation on developing countries’ trade. Trade Policy Paper no 144. OECD.
Novy D (2013). Gravity redux: measuring international trade costs with panel data. Economic Inquiry. 51(1): 101–121.
OECD-WTO (Organisation for Economic Co-operation and Development-World Trade Organization) (2015). Aid for Trade at a Glance 2015: Reducing trade costs for inclusive, sustainable growth.
Radelet S and Sachs J (1998). Shipping costs, manufactured exports, and economic growth. Paper presented at the Annual Meeting of the American Economic Association, Harvard University.
Redding S and Venables A (2004a). Economic geography and international inequality. Journal of International Economics. 62: 53–82.
Redding S and Venables A (2004b). Geography and Eexport performance: External market access and internal supply capacity. In: Challenges to Globalization: Analyzing the Economics: 95–130.
United Nations (2015). Addis Ababa Action Agenda of the Third International Conference on Financing for Development. United Nations General Assembly resolution A/RES/69/313.
Wilson JS, Mann CL and Otsuki T (2003). Trade facilitation and economic development: A new approach to quantifying the impact. World Bank Economic Review. 17(3): 367–389.
Winters LA (2000). Trade and poverty: Is there a connection? In: Trade, Income Disparity and Poverty. World Trade Organization: 43–69.

TRADING INTO SUSTAINABLE DEVELOPMENT:Trade, Market Access, and the Sustainable Development Goals
DEVELOPING COUNTRIES IN INTERNADEVELOPING COUNTRIES IN INTERNATIONAL TRADE STUDIESTIONAL TRADE STUDIES
unctad.org/tab
U N I T E D N AU N I T E D N AT I O N S C O N F E R E N C E O N T R A D E A N D D E V E L O P M E N TT I O N S C O N F E R E N C E O N T R A D E A N D D E V E L O P M E N T
Phot
o cr
edit:
Fot
olia
© c
, Don
na, K
adm
y, m
.sch
ucka
rt, M
aksy
m Y
emey
anov
, ped
rosa
la, P
hilli
p M
inni
s, p
icca
ya, R
aine
r Ple
ndl,
sole
g, E
lena
thew
ise
TRA
DIN
G IN
TO SU
STAIN
AB
LE DEVELO
PMEN
T: Trade, Market A
ccess, and the Sustainable Developm
ent Goals
UNCTA
DUNITED NATIONS
Printed at United Nations, Geneva – 1604429 (E) – March 2016 – 544 – UNCTAD/DITC/TAB/2015/3