Algorithmic Trading Session 8 Trade Implementation II ... · Algorithmic Trading Session 8 Trade...
21
Algorithmic Trading Session 8 Trade Implementation II Algorithmic Execution Oliver Steinki, CFA, FRM
Transcript of Algorithmic Trading Session 8 Trade Implementation II ... · Algorithmic Trading Session 8 Trade...
Algorithmic Trading
Session 8
Trade Implementation II
Algorithmic Execution
Oliver Steinki, CFA, FRM
Outline
Introduction
Algorithmic Execution
Market Impact Driven Algorithms
Cost Driven Algorithms
Opportunistic Algorithms
Summary and Questions
Sources
2Contact Details: [email protected] or +41 76 228 2794
3
IntroductionWhere Do We Stand in the Algo Prop Trading Framework?
DECIDE WHEN AND
HOW TO TRADE
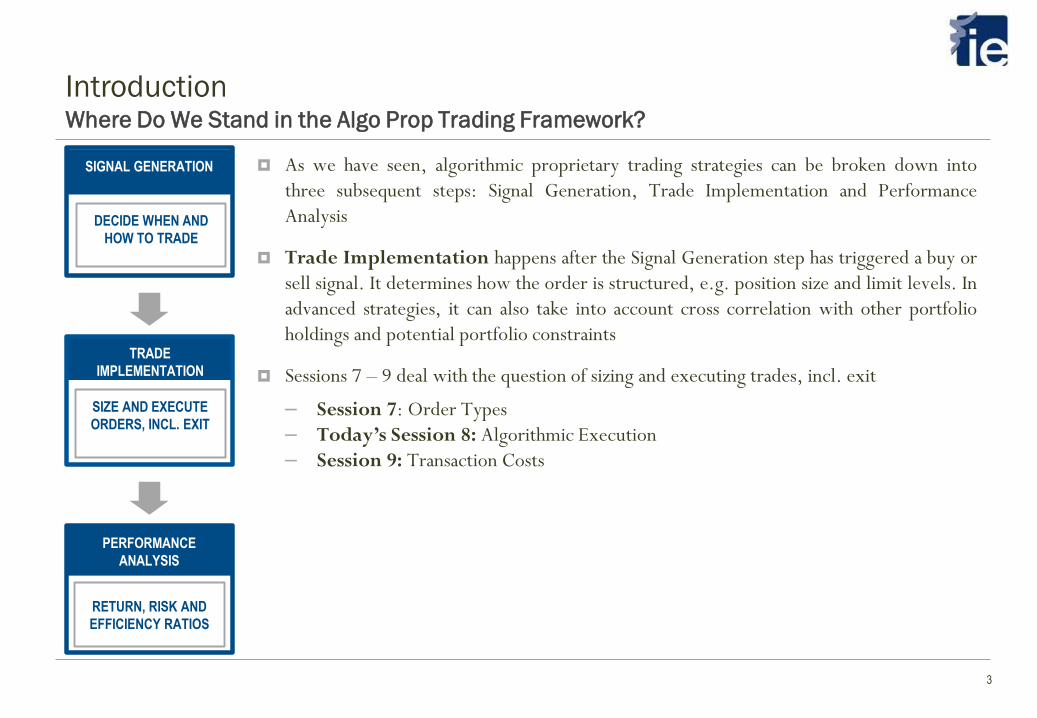
SIGNAL GENERATION As we have seen, algorithmic proprietary trading strategies can be broken down into
three subsequent steps: Signal Generation, Trade Implementation and Performance
Analysis
Trade Implementation happens after the Signal Generation step has triggered a buy or
sell signal. It determines how the order is structured, e.g. position size and limit levels. In
advanced strategies, it can also take into account cross correlation with other portfolio
holdings and potential portfolio constraints
Sessions 7 – 9 deal with the question of sizing and executing trades, incl. exit
– Session 7: Order Types
– Today’s Session 8: Algorithmic Execution
– Session 9: Transaction Costs
PERFORMANCE
ANALYSIS
RETURN, RISK AND
EFFICIENCY RATIOS
TRADE
IMPLEMENTATION
SIZE AND EXECUTE
ORDERS, INCL. EXIT
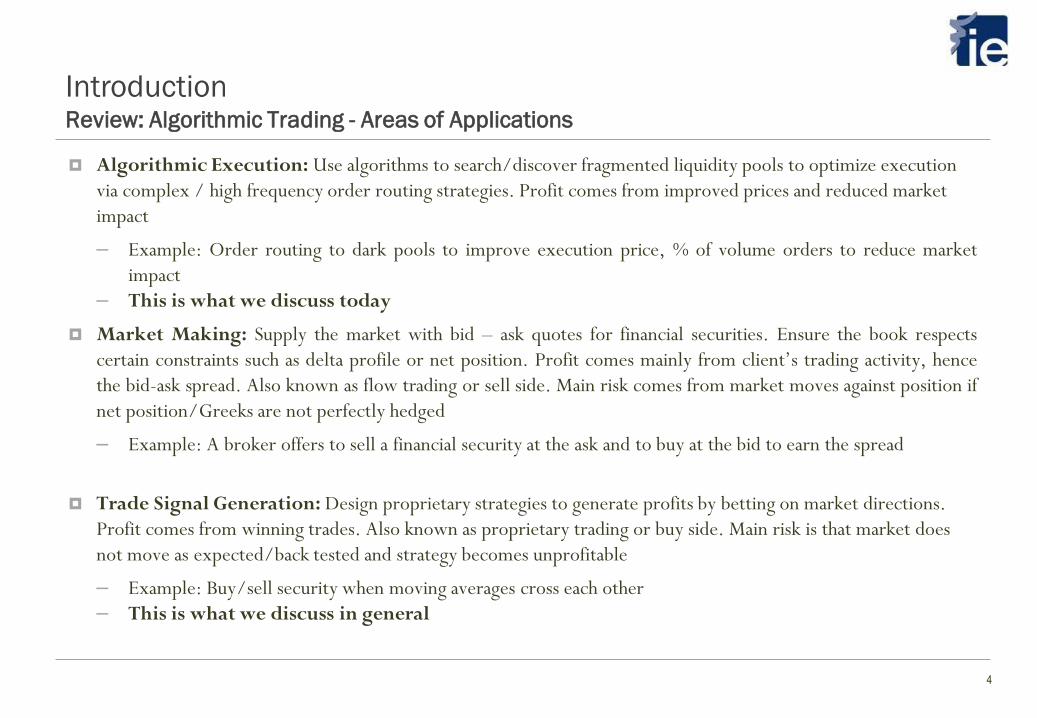
Algorithmic Execution: Use algorithms to search/discover fragmented liquidity pools to optimize execution
via complex / high frequency order routing strategies. Profit comes from improved prices and reduced market
impact
– Example: Order routing to dark pools to improve execution price, % of volume orders to reduce market
impact
– This is what we discuss today
Market Making: Supply the market with bid – ask quotes for financial securities. Ensure the book respects
certain constraints such as delta profile or net position. Profit comes mainly from client’s trading activity, hence
the bid-ask spread. Also known as flow trading or sell side. Main risk comes from market moves against position if
net position/Greeks are not perfectly hedged
– Example: A broker offers to sell a financial security at the ask and to buy at the bid to earn the spread
Trade Signal Generation: Design proprietary strategies to generate profits by betting on market directions.
Profit comes from winning trades. Also known as proprietary trading or buy side. Main risk is that market does
not move as expected/back tested and strategy becomes unprofitable
– Example: Buy/sell security when moving averages cross each other
– This is what we discuss in general
4
Introduction Review: Algorithmic Trading - Areas of Applications
5
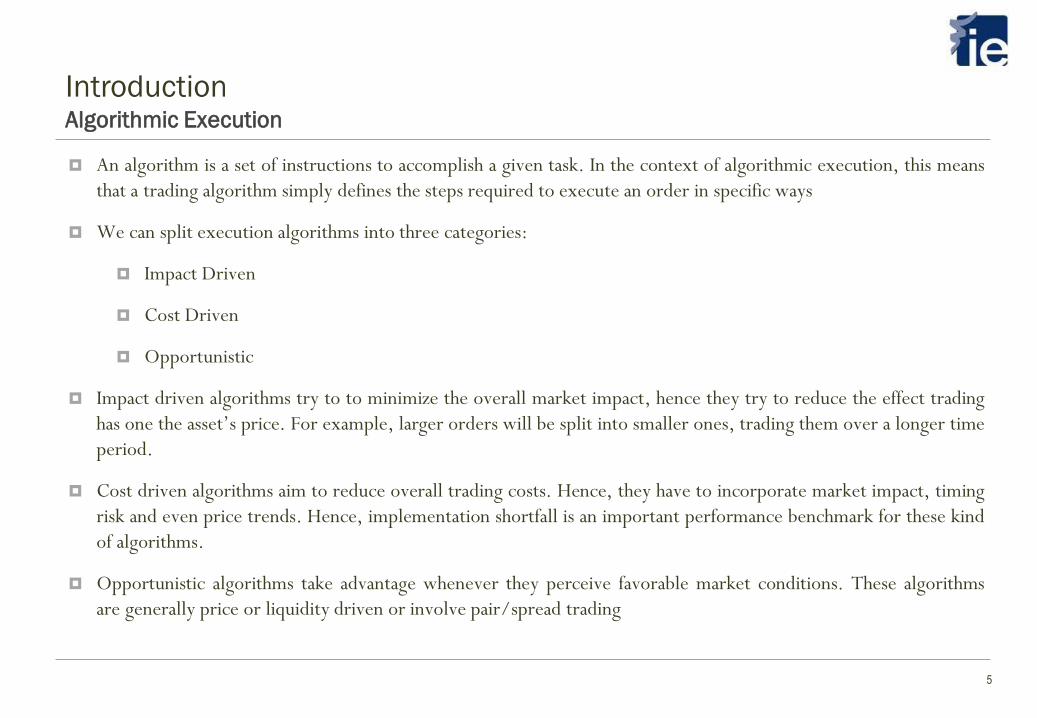
An algorithm is a set of instructions to accomplish a given task. In the context of algorithmic execution, this means
that a trading algorithm simply defines the steps required to execute an order in specific ways
We can split execution algorithms into three categories:
Impact Driven
Cost Driven
Opportunistic
Impact driven algorithms try to to minimize the overall market impact, hence they try to reduce the effect trading
has one the asset’s price. For example, larger orders will be split into smaller ones, trading them over a longer time
period.
Cost driven algorithms aim to reduce overall trading costs. Hence, they have to incorporate market impact, timing
risk and even price trends. Hence, implementation shortfall is an important performance benchmark for these kind
of algorithms.
Opportunistic algorithms take advantage whenever they perceive favorable market conditions. These algorithms
are generally price or liquidity driven or involve pair/spread trading
IntroductionAlgorithmic Execution
6
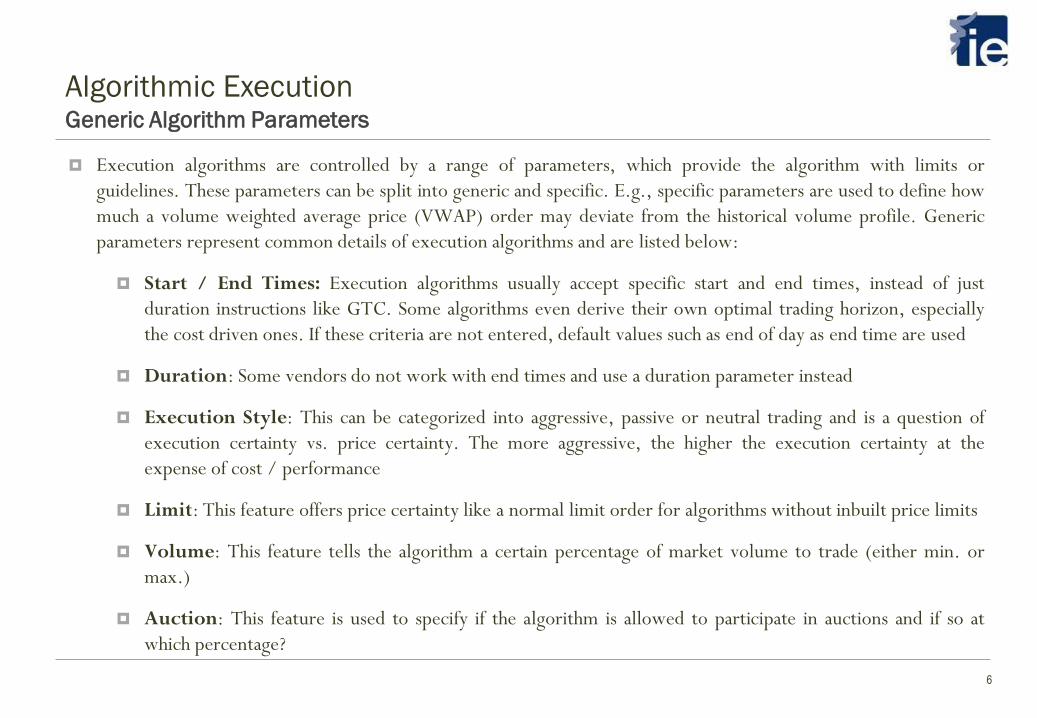
Execution algorithms are controlled by a range of parameters, which provide the algorithm with limits or
guidelines. These parameters can be split into generic and specific. E.g., specific parameters are used to define how
much a volume weighted average price (VWAP) order may deviate from the historical volume profile. Generic
parameters represent common details of execution algorithms and are listed below:
Start / End Times: Execution algorithms usually accept specific start and end times, instead of just
duration instructions like GTC. Some algorithms even derive their own optimal trading horizon, especially
the cost driven ones. If these criteria are not entered, default values such as end of day as end time are used
Duration: Some vendors do not work with end times and use a duration parameter instead
Execution Style: This can be categorized into aggressive, passive or neutral trading and is a question of
execution certainty vs. price certainty. The more aggressive, the higher the execution certainty at the
expense of cost / performance
Limit: This feature offers price certainty like a normal limit order for algorithms without inbuilt price limits
Volume: This feature tells the algorithm a certain percentage of market volume to trade (either min. or
max.)
Auction: This feature is used to specify if the algorithm is allowed to participate in auctions and if so at
which percentage?
Algorithmic ExecutionGeneric Algorithm Parameters
7
Impact Driven AlgorithmsOverview
Impact driven algorithms evolved from simple order slicing strategies. By splitting larger orders into smaller child
orders, they try to reduce the impact the trading has on the asset’s price, and so to minimize overall market
impact costs
The average prices based algorithms, namely time weighted average price (TWAP) and volume weighted average
price (VWAP), represent the first generation of impact driven algorithms. Although intended to minimize impact
costs, their main focus is their respective benchmarks. These are predominantly schedule based algorithms and so
they track statistically created trajectories with little or no sensitivity to conditions such as price or volume. Their
aim is to completely execute the order within the given timeframe, irrespective of market conditions
The natural progression from these static first generation algorithms has been the creation of more dynamic
methods, which resulted in a gradual shift to more opportunistic methods
8
Impact Driven AlgorithmsTime Weighted Average Price
A time weighted average price (TWAP) order is benchmarked to the average price, which reflects how the asset’s
market price has evolved over time. Therefore, execution algorithms that attempt to match this benchmark are
usually based on a uniform time-based schedule
The basic mechanism behind a TWAP order is based on time slicing. For example, an order to buy 1000 shares
could be split into 10 child orders of 100 shares each every 5 minutes. Hence, the trading patterns are very
uniform and independent of price and volume
TWAP orders can suffer poor execution due to their rigid adherence to the time schedule, especially if the price
becomes unfavorable or the available liquidity suddenly drops
Alternatively, we can use the linear nature of the target completion profile to adopt a more flexible trading
approach. At any given time, we can determine the target quantity the order should have achieved, e.g. 25% of
the order should be completed after 25min. in the above mentioned example. So instead of following a very
deterministic approach, we could adopt a slightly more random approach by comparing the actual progress to the
planned schedule. This allows us to vary trade frequency and size and makes the TWAP schedule less predictable
for other market participants to spot
9
Impact Driven AlgorithmsVolume Weighted Average Price
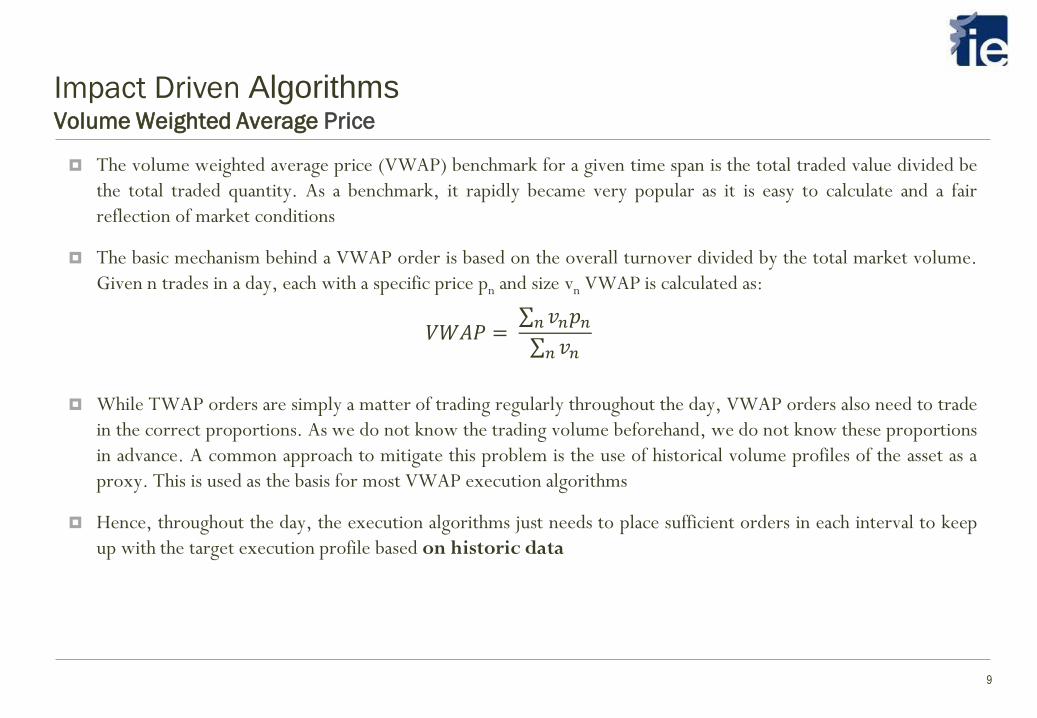
The volume weighted average price (VWAP) benchmark for a given time span is the total traded value divided be
the total traded quantity. As a benchmark, it rapidly became very popular as it is easy to calculate and a fair
reflection of market conditions
The basic mechanism behind a VWAP order is based on the overall turnover divided by the total market volume.
Given n trades in a day, each with a specific price pn and size vn VWAP is calculated as:
𝑉𝑊𝐴𝑃 = 𝑛 𝑣𝑛𝑝𝑛 𝑛 𝑣𝑛
While TWAP orders are simply a matter of trading regularly throughout the day, VWAP orders also need to trade
in the correct proportions. As we do not know the trading volume beforehand, we do not know these proportions
in advance. A common approach to mitigate this problem is the use of historical volume profiles of the asset as a
proxy. This is used as the basis for most VWAP execution algorithms
Hence, throughout the day, the execution algorithms just needs to place sufficient orders in each interval to keep
up with the target execution profile based on historic data
10
Impact Driven AlgorithmsPercentage of Volume
Percentage of volume (POV) algorithms are “go along” orders with the market volume. They are also known as
volume inline, participation, target volume or follow algorithms. For example a POV order of 10% for a stock
with 1m. shares daily turnover should result in an execution of 100k shares
The basic mechanism behind POV is a dynamic adjustment based on market volume and hence different to TWAP
and VWAP orders, which follow predetermined trading schedules. The algorithm tries to participate in the
market in proportion to the market volume. Note that there is no relationship between the trading pattern and the
market price, the target trade size is solely driven by market volume
The POV order is similar to the VWAP if historical and actual trading patterns are similar. Although POV orders
are more dynamic than VWAP orders, they still cannot predict market volume
A common risk factor of POV orders is the potential to drive up or down prices if many traders have POV orders
on. One way to protect against such situations are firm price limits applied to POV orders, as they usually come
without inbuilt price sensitivity
11
Impact Driven AlgorithmsMinimal Impact
Minimal impact algorithms represent the next logical progression from VWAP and POV execution algorithms.
Rather than seeking to track a market driven benchmark, they focus solely on minimizing market impact. Signaling
risk is an importing consideration for the algorithms we have seen so far. It describes the risk of potential losses
due to information that our trading pattern relays to the other market participants and depends on our trading size
and the asset’s liquidity
The basic mechanism behind minimal impact algorithms is therefore to route orders to dark pools, broker’s
internal crossing networks as well as using hidden order types. As actual hit ratios on some dark pools can be low,
often a proportion of the order is left as VWAP or POV order on the main venue to ensure a minimum level of
execution
Specific parameters of minimal impact orders therefore include the visibility and the must be filled criteria.
While the visibility criteria determines how much of the order is actually displayed on the main venue, the must
be filled criteria determines which percentage of the order has to be filled. As the minimal impact algorithm is
focused on reducing cost at the risk of failing to fully execute, it might be more appropriate to use a cost based
algorithm if one wants to guarantee full execution
12
Cost Driven AlgorithmsOverview
Cost driven algorithms seek to reduce the overall transaction costs. As we have seen in session 3, these are more
than commissions and the bid-ask spread, they also include implicit costs such as market impact and slippage
We have learned that market impact might be reduced by time slicing (TWAP orders). However, this exposes
orders to a much greater timing risk, especially for volatile assets. Therefore, cost driven algorithms also target to
reduce timing risk
In order to minimize overall transaction costs, we need to strike a balance between market impact and timing risk.
Trading too aggressively may result in considerable market impact, while trading too passively incurs timing risk.
Furthermore, we must know the investor’s level of urgency or risk aversion to strike the right balance
Implementation shortfall represents a purely cost driven algorithm. It seeks to minimize the shortfall between the
average trade price and the assigned benchmark, which should reflect the investor’s decision price
Adaptive Shortfall algorithms are just more opportunistic derivatives of implementation shortfall. They are
generally more price sensitive, although liquidity driven variants also start to appear
Market on close (MOC) algorithm aim to beat an undetermined benchmark, the future closing price. Unlike
TWAP or VWAP where the average evolves through the day, it is harder to predict where the closing price will
actually be. It is the reverse of implementation shortfall: instead of determining an optimal end time, we need to
calculate an optimal starting time
13
Cost Driven AlgorithmsImplementation Shortfall
Implementation shortfall (IS) represent the difference between the price at which the investor decides to trade and
the average execution price that is actually achieved. The decision price is used as the benchmark, although often it
is not specified and instead the mid price when the order reaches the broker is used as default
The goal of IS algorithms is to minimize the difference between average execution price and decision price. To
strike the right balance between market impact and timing risk, it usually means that the algorithm tends to take
only as long as necessary to prevent significant market impact
To determine the optimal trade horizon the algorithm needs to account for factors such as order size and time
available for trading. It must also incorporate asset specific information such as liquidity and volatility.
Additionally, it must also take into account the investor’s urgency or risk aversion. Quantitative models are then
used to derive the optimal trade horizon based on the factors mentioned. Generally, a shorter trade horizon is due
to:
– Assets with high volatility, also those with lower bid ask spreads
– High risk aversion
– Smaller order size, so less potential market impact
Having calculated the optimal trade horizon, a static algorithm will then determine the trading schedule, whilst
the dynamic one will determine the most appropriate participation rate. Since both versions have a pre
determined benchmark, they will both favor to trade more at the beginning of an order when the price is still
close to the benchmark
14
Cost Driven AlgorithmsAdaptive Shortfall
Adaptive shortfall (AS) represents a relatively recent subclass of algorithms derived from implementation shortfall.
The adaptive moniker refers to the addition of adaptive behavior, mostly in reaction to the market price. Hence,
AS algorithms behave more opportunistic than IS algorithms. An aggressive adaptive algorithm trades more
aggressively with favorable prices and less when they become adverse. The opposite applies for passive AS orders.
AS algorithms are built upon IS algorithms, so there basic behavior is the same. However, the AS algorithm
dynamically adjusts in real time based on current market conditions. Initially, a baseline target for volume
participation may be determined based on the estimated optimal trade horizon. During trading, the adaptive
portion is then used to modify this rate. For an aggressive AS algorithm, the participation rate would be increased
if market prices are favorable compared to the benchmark, for passive AS algorithms the participation rate would
be decreased.
As the only parameter not needed for IS algorithms, the user has to specify one additional parameter for AS
algorithms, the adaption type: either passive or aggressive
15
Cost Driven AlgorithmsMarket on Close
The close price is often used for marking to market, calculating net asset values and daily PnLs. Hence, many
market participants are interested in the closing price as the benchmark although trading at the close can be costly.
Researchers found that prices are more sensitive to order flow at the close. They also noted price reversals after
days with significant auction imbalances. While call auctions have helped to reduce end of day volatility, the
liquidity premium can still be considerable around the close
The main issue for MOC algorithms is the fact that the benchmark is unknown until the end of the trading day.
We cannot simply slice the order to try to match or beat the benchmark. We should also not start trading too
early, in order to avoid exposure to timing risk due to the variability in the closing price. However, trading too
late may result in significant market impact
Most MOC algorithms determine an optimal trading horizon using quantitative models, incorporating similar
factors as IS algorithms. As IS algorithms determine an optimal end time, MOC algorithms calculate an optimal
start time
In general, MOC algorithms have the same parameters as IS algorithms. However, they also allow specific
parameters for different risk aversion profiles, end time and auction participation. The auction
participation instruction specifies the minimum or maximum order size allowed to participate in the close auction
16
Opportunistic AlgorithmsOverview
Opportunistic algorithms have evolved from a range of trading strategies. They all take advantage of favorable
market conditions, whether this is based on price, liquidity or another factor such as spread/ratio
Price inline algorithms are essentially based on an underlying impact driven strategy such as VWAP or POV. What
they add is price sensitivity, which enables them to modify their trading style based on whether the current market
price is favorable or not. So a focus on market impact has given way to a more opportunistic approach
Liquidity driven algorithms are an evolution of simpler rule based order routing strategies. The trading is driven
by the available liquidity, although cost is also a factor
As pair trading is effectively a market neutral strategy, market risk is less of a concern. Instead, the key driver is
when the spread or ratio between the assets is favorable
17
Opportunistic AlgorithmsPrice Inline
A price inline (PI) algorithm adapts to the market price in a similar way to how POV algorithms adjust to market
volume. A benchmark price is defined and trading is then altered based on how the market price compares to it.
Default value for the benchmark is the mid price at the time of order arrival. Similar to AS algorithms, the term
“moneyness” is sometimes used for favorable market conditions
A PI algorithm consists of a basic trading mechanism combined with the price adaptive functionality. Hence, it
could be based on a static VWAP or a more dynamic POV. The actual price adaption might track the difference
between benchmark and market price and tilt an aggressive PI algorithm to trade proportionally more shares when
market conditions are favorable. Using the example of a participation rate of a POV algorithm, the PI algorithm
would increase the participation rate for a buy order when the market price is below the benchmark price
Special parameters include adaption type (like in AS), participation rate (for algorithms based on POV) and
participation adjustment. This specifies how much to alter the participation rate for a given price move, for
example 5% for every 10 cents. Asymmetrical participation levels are also possible
18
Opportunistic AlgorithmsLiquidity
Liquidity represents the ease of trading a specific asset, hence it has a considerable effect on overall transaction
costs. Originally, liquidity based trading simply meant making decisions based on the available order book depth,
rather than just the best bid and offer. In today’s fragmented markets with many potential execution venues,
liquidity seeking has become more complicated
Liquidity is closely related to market depth and price. Therefore, a liquidity seeking algorithm will react strongest
when there is plenty of market depth combined with a favorable price. Instead of making the algorithm react to
market volume, one can create a market depth measure that reflects the volume available at a favorable price
point. Therefore, when market depth and price are favorable, the algorithm trades aggressively to consume
liquidity
Liquidity driven algorithms are often used in fragmented markets. Often, clients may want their orders to only
participate at specific venues and might or might not want to use the internal crossing network of the broker
Special parameters include a visibility and benchmark price instruction. While visibility determines how
much of the order is actually displayed at execution venues (similar to iceberg orders), the benchmark price is
used to decide when the market price is favorable enough to warrant participation
19
Opportunistic AlgorithmsRatio/Spread
Pair trading involves buying one asset while simultaneously selling another one. As a market neutral strategy, the
risks from each asset should hedge or offset each other and hence the strategy less affected by market wide moves.
Pair trading can be broken down into statistical arbitrage and merger (risk) arbitrage. Statistical arbitrage is based
on relative valuations and based on the assumption that the spread will revert to its mean. Risk arbitrage is more
equity specific and evolves around the probability of a merger happening
Statistical arbitrage spread trading algorithms focus on trading for a pre-determined benchmark, which is either
the spread between two assets or the ratio of their prices. A simple example is based solely on the spread between
two asset prices. When the difference exceeds a certain threshold, trading is activated. An alternative example
would use the price ratio as the trigger to trade
Risk arbitrage pairs can generally use the same approach as the statistical arbitrage ones. The trading strategy
would usually include selling the bidding company and buying the target company
Specific parameters include the spread (watch out if defined A-B or A/B), a legging indicator (if the orders have to
be executed in parallel) and a volume limit if one wants to limit the participation rate
Summary and Questions
20Contact Details: [email protected] or +41 76 228 2794
A execution algorithm is simply a set of instructions used to execute an order. They can be broadly categorized into
three groups based on the target objectives.These are impact driven, cost driven or opportunistic
Impact driven algorithms seek to minimize the overall market impact costs, usually by splitting larger orders into
smaller child orders
Cost driven algorithms aim to reduce the overall trading costs
Opportunistic algorithms strive to take best advantage of favorable market conditions
Questions?
Sources
21
Algorithmic Trading and Direct Market Access by Barry Johnson
Contact Details: [email protected] or +41 76 228 2794