Trade Liberalisation and Poverty: What have we learned in fifteen years?

LIU-IEI-FIL-G--09/00383--SE
Trade Liberalisation and Poverty A Case Study on Ukraine
Aleksander Mojsiejuk Gustaf Ortsäter
Spring 2009
Tutor: Peter Andersson
Bachelor Thesis in Economics Institution for Industrial and Economic Development

2
Abstract The Washington consensus reform package for developing countries initiated in the early 90’s, came to be a leading paradigm in the international community. One of the principle ideas, that trade liberalisation would alleviate people from poverty, has been pursued by many policy makers dealing with developing countries. This thesis estimates the effects on poverty induced by trade via three channels – economic growth, prices and employment & wages. As trade liberalisation implies distributional effects on the economy and general validity on how this effects poor has not been possible to establish -we have conducted a qualitative case study in order to accumulate to the available research and reach understanding of the phenomena. Ukraine has been selected as case due to its recent trade liberalisations and proximity to attractive trade partners. With poverty as a focal point, the trade liberalisation and the international trade in Ukraine is examined together with a wide range of macro variables in order to trace down the effects trade has had on poverty. The result show that a factual trade liberalisation has occurred, both in terms of policy change and trade output, and that large productivity gains has been achieved. Although difficult to determine, increased competition and new technology plays a significant part in the increased productivity which most probably has been due partly to the increased trade. These productivity gains have expressed themselves as increased dynamics in the labour market - boosting real wages, and with it reducing a great share of poverty in Ukraine.

3
Table of Contents 1. INTRODUCTION ............................................................................................................................................. 6
1.1BACKGROUND & PRESENTATION OF THE PROBLEM ....................................................................................... 6 1.2 PURPOSE........................................................................................................................................................ 7 1.3 METHOD ........................................................................................................................................................ 7 1.4 MATERIAL ..................................................................................................................................................... 8 1.5 DELIMITATION .............................................................................................................................................. 8
2. THEORY ......................................................................................................................................................... 10
2.1 INTERNATIONAL TRADE THEORY ................................................................................................................ 10 2.2 POVERTY IMPLICATIONS OF INTERNATIONAL TRADE ................................................................................... 12
2.2.1 Economic growth and productivity ..................................................................................................... 14 2.2.2 Prices .................................................................................................................................................. 15 2.2.3 Wages and Employment ...................................................................................................................... 15
3 EMPIRICS ........................................................................................................................................................ 17
3.1 THE RESEARCH SO FAR................................................................................................................................ 17 3.2 UKRAINE – A BRIEF PRELUDE ...................................................................................................................... 18 3.3 POVERTY MEASURES & POVERTY IN UKRAINE............................................................................................ 19
3.3.1 Definitions .......................................................................................................................................... 19 3.3.2 Poverty in Ukraine .............................................................................................................................. 19 3.3.3 Dynamics ............................................................................................................................................ 22
3.4 UKRAINE & THE TRADE .............................................................................................................................. 24 3.4.1 Trade liberalisation ............................................................................................................................ 24 3.4.2 Measuring the Openness..................................................................................................................... 26 3.4.3 Trade Flows ........................................................................................................................................ 28
3.5 ECONOMIC GROWTH ................................................................................................................................... 32 3.6 PRICES ......................................................................................................................................................... 35 3.7 EMPLOYMENT AND WAGES ......................................................................................................................... 36
3.7.1 Employment ........................................................................................................................................ 36 3.7.2 Dynamics in the labour market ........................................................................................................... 39 3.7.3 Wages ................................................................................................................................................. 40
4. ANALYSIS ...................................................................................................................................................... 42
4.1 LINKING TRADE POLICY WITH TRADE .......................................................................................................... 42 4.2 THE THREE CHANNELS OF TRADE ............................................................................................................... 42
4.2.1 Trade and economic growth ............................................................................................................... 42 4.2.2 Trade and prices ................................................................................................................................. 44 4.2.3 Trade and the labour market .............................................................................................................. 45
4.3 THE OUTCOME ON POVERTY RATES IN UKRAINE ......................................................................................... 46
5. CONCLUSIONS ............................................................................................................................................. 47
LIST OF REFERENCES ................................................................................................................................... 48
APPENDIX 1 ....................................................................................................................................................... 53
APPENDIX 2 ....................................................................................................................................................... 55
APPENDIX 3 ....................................................................................................................................................... 56
APPENDIX 4 ....................................................................................................................................................... 57

4
List of Acronyms and Abbreviations AWITR Average Weighted Imported Tariff Rate CIS Commonwealth of Independent States CPI Consumer Price Index EU European Union FTA Free Trade Agreement FDI Foreign Direct Investment GDP Gross Domestic Product HSB Household Budget Survey IMF International Monetary Fund MFN Most Favoured Nation NTB Non Tariff Barriers OECD Organisation for Economic Cooperation and Development PCA Partnership and Cooperation Agreement PPP Purchase Power Parity RCA Revealed Comparative Advantages TFP Total Factor Productivity UAH Ukrainian Hryvnia WTO World Trade Organsation SSC State Statistics Committee of Ukraine ILO International Labour Organisation

5
List of Figures and Tables Figures 1.1 Framework 2.1 Production possibility frontier and relative prices 2.2 Enhancement of International Trade 2.3 Analytical Framework 3.1 Inflation rate 3.2 Headcount Index – Poverty Line UAH 4.97/day 3.3 Labour status of Poor 3.4 Poor Household Income Structure 3.5 Figure 3.5 Headcount Index – Poverty Line $ 2.15/day 3.6 Headcount Index - Poverty Line $ 4.3/day 3.7 Headcount Index – Official Ukrainian subsistence minimum 3.8 Exports of goods and services – Percentage change 3.9 Imports of goods and services – Percentage Change 3.10 Trade Balance 3.11 Commodity structure of exports 3.12 Commodity structure of imports 3.13 Share of high and medium technology in manufacturing exports to OECD-countries 3.14 Yearly Real GDP-growth 3.15 GDP-growth by factor 3.16 Composition of Industrial Productivity Growth – Annual Percentage Change 3.17 Consumer Price Index 3.18 Employment, Participation and Unemployment rates 3.19 Growth of employment 3.20 Employment as a share of Total Employment 3.21 Real Wages, Labour Productivity and Real wage growth 3.22 Wages as a Percentage of Average Wages – by Sector Tables 3.1 Yearly and Average Growth of Income by Source 3.2 Ukraine Openness to trade indices

6
1. Introduction
1.1Background & Presentation of the Problem Poverty is a problem that has puzzled many economists since the birth of the discipline. Despite the extensive development of economics as science with methods and models becoming more and more sophisticated, extreme poverty in the world has not yet been eradicated. The amount of people living below the extreme poverty line of 1.25$ a day is today 1.4 billion people.1 This is the case despite the rapid economic growth that large parts of the world have seen, especially during the last century. The Washington Consensus initiated in the early 90’s implied a “standard” reform package for developing countries in which trade liberalisation played a major part.2 The idea stemming from neoliberals that free trade and economic growth leads to poverty reduction has more or less been the leading paradigm in the international community during the last decades. This has been a guiding principle of the IMF, the World Bank, but also the European Union. On the other hand, a cleavage is observable in the global debate, especially from the anti-globalisation movement which argues that free trade affects poor people negatively and increases the inequality. There does not either seem to be a consensus within the academic world of the consequences of trade liberalisation and poverty. After the fall of the Soviet Union, countries who where governed by or was a part of the Soviet Union began a long journey on changing their economic system to that of the free market. Nevertheless, these nations in transit have developed at different paces. The Central European countries such as Poland and the Czech Republic that entered into the EU in 2004 have seen a steep fall in poverty since the dissolution of Soviet. The former Soviet Republics have however not developed to the same extent. 3 Trade liberalisation took significant steps forward when Ukraine and the European Union entered into the Partnership and Cooperation Agreement (PCA) in 1998. Substantial liberalisations were made, and the clause of the Most Favoured Nation (MFN)4 was also concluded between the two countries. The proximity of Ukraine to the EU makes it the most important trade market, even surpassing the trade flow to and from the Russian Federation. Ukraine applied for WTO membership in 1993, and was finally granted access in May 2008. 5 The total value of the export of goods in Ukraine was 49 248 million USD in 2006 and 31.5% of these goods where exported to the EU. The EU is thus by far the most important trading partner of Ukraine. This is also the case when it comes to Ukrainian import of EU goods which constitute up to 36% of the country’s total import.6 Ukraine has seen an average growth of 3.7 % since 1996, and has significantly lowered its poverty rates. When briefly overlooking the statistics, one can observe a dramatic decline in poverty. Between 2001 and 2006 the poverty rate fell from 32% to 8%.7 To what extent is it possible to relate this decrease in poverty to trade liberalisation in Ukraine? Has the trade
1 World Bank:2009 2 Williamson:2004, p.1-3 3 Gilbert:2004, p.138-139 4 See Appendix 2 for explanation 5 WTO Press Release:2008 6 WTO Statistics database 7 World Bank:2007, p.4
liberalisation, and the increased trade that this fight poverty in Ukraine?
1.2 Purpose The purpose of this thesis is to examine the impact of Ukraine’s trade liberalisation and international trade on poverty in the country. It wishes to investigate the ctrade liberalisation and international trade trickles down to poor in the country and evaluate these effects. How has Ukraine’s trade liberalisation and international trade affected poverty in the country?
1.3 Method This thesis is a case study with a qualitative approach. Ukraine’s international trade is the main factor of research within this study. The analysis unit in this case is Ukraine and the variable being examined is poverty. Poverty is decided by a person or household’s incoa large number of different independent variables. Some of them are affected by trade, but these variables are also domestically driven. International trade gives way to changes in to three important variables – productivity, employment and prices. income. On the other hand, these variables neither solely explain poverty nor income, and thus a distinguishing of these is of importance. The figure below illustrates a simplified model of the mode of procedure which will be furt
An examination of the trade facilitation will be done in order to better understand the different aspects of its consequences. A wide range of macroreach a general comprehension of the development over time and the current situation regarding trade, growth and poverty. The next step will be a focalisation on productivity, prices and employment to examine the domestic markets ability to benefit from change The reason for using a qualitative approach to the study of trade liberalisation effects on poverty is that it gives the opportunity to get an incomplexity. Many studies on the connection between growth and tbeen performed with the help of cross country data. Srinivasan and emphasise the importance of taking account of various causes and channels of growth with the help of detailed case studies.opportunity to evaluate the process in a given context and to reach an unde 8 Winters et al:2004, p.78
7
liberalisation, and the increased trade that this liberalisation is supposed to incur, also helped
The purpose of this thesis is to examine the impact of Ukraine’s trade liberalisation and international trade on poverty in the country. It wishes to investigate the ctrade liberalisation and international trade trickles down to poor in the country and evaluate
How has Ukraine’s trade liberalisation and international trade affected poverty in the
case study with a qualitative approach. Ukraine’s international trade is the main factor of research within this study. The analysis unit in this case is Ukraine and the variable being examined is poverty. Poverty is decided by a person or household’s incoa large number of different independent variables. Some of them are affected by trade, but these variables are also domestically driven. International trade gives way to changes in to
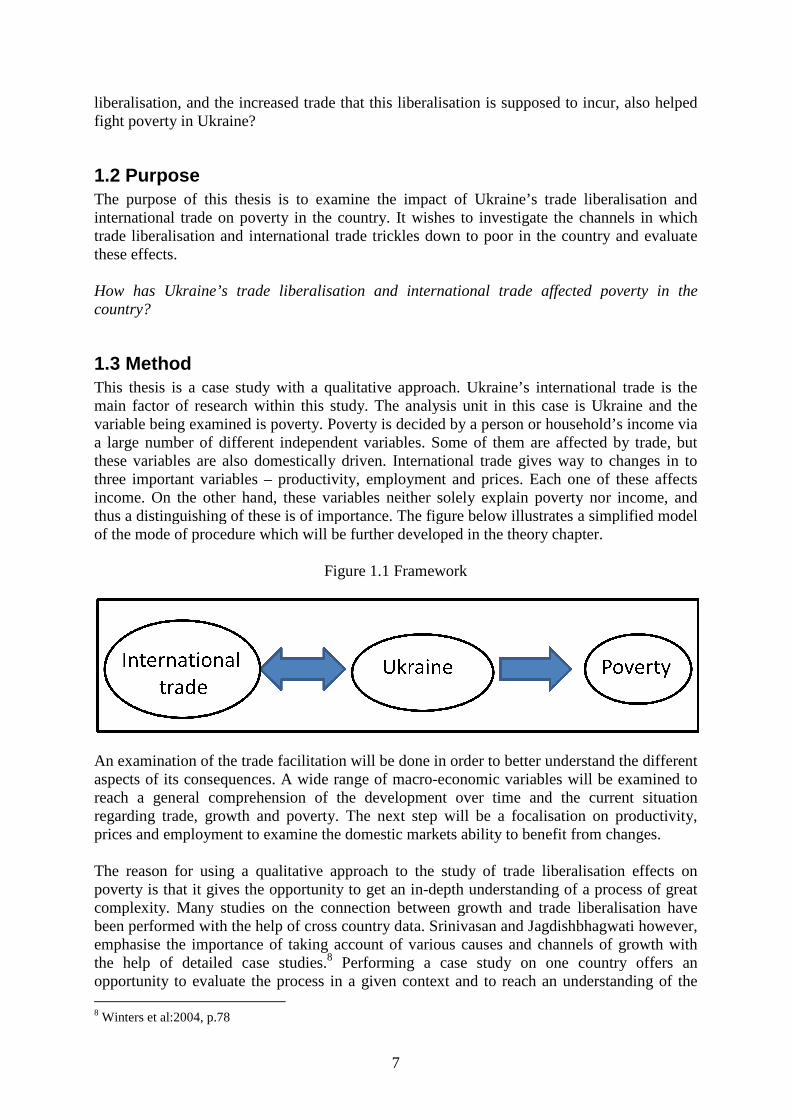
productivity, employment and prices. Each one of these affects income. On the other hand, these variables neither solely explain poverty nor income, and thus a distinguishing of these is of importance. The figure below illustrates a simplified model of the mode of procedure which will be further developed in the theory chapter.
Figure 1.1 Framework
An examination of the trade facilitation will be done in order to better understand the different aspects of its consequences. A wide range of macro-economic variables will be examined to
h a general comprehension of the development over time and the current situation regarding trade, growth and poverty. The next step will be a focalisation on productivity, prices and employment to examine the domestic markets ability to benefit from change
The reason for using a qualitative approach to the study of trade liberalisation effects on poverty is that it gives the opportunity to get an in-depth understanding of a procomplexity. Many studies on the connection between growth and trade liberalisation have been performed with the help of cross country data. Srinivasan and Jagdishbemphasise the importance of taking account of various causes and channels of growth with the help of detailed case studies.8 Performing a case study on one country offers an opportunity to evaluate the process in a given context and to reach an unde
liberalisation is supposed to incur, also helped
The purpose of this thesis is to examine the impact of Ukraine’s trade liberalisation and international trade on poverty in the country. It wishes to investigate the channels in which trade liberalisation and international trade trickles down to poor in the country and evaluate
How has Ukraine’s trade liberalisation and international trade affected poverty in the
case study with a qualitative approach. Ukraine’s international trade is the main factor of research within this study. The analysis unit in this case is Ukraine and the variable being examined is poverty. Poverty is decided by a person or household’s income via a large number of different independent variables. Some of them are affected by trade, but these variables are also domestically driven. International trade gives way to changes in to
Each one of these affects income. On the other hand, these variables neither solely explain poverty nor income, and thus a distinguishing of these is of importance. The figure below illustrates a simplified model
her developed in the theory chapter.
An examination of the trade facilitation will be done in order to better understand the different economic variables will be examined to
h a general comprehension of the development over time and the current situation regarding trade, growth and poverty. The next step will be a focalisation on productivity, prices and employment to examine the domestic markets ability to benefit from changes.
The reason for using a qualitative approach to the study of trade liberalisation effects on depth understanding of a process of great
rade liberalisation have Jagdishbhagwati however,
emphasise the importance of taking account of various causes and channels of growth with ase study on one country offers an
opportunity to evaluate the process in a given context and to reach an understanding of the

8
contextual influences. Moreover, contextual studies are important in the sense that it helps the scientific community to accumulate case specific knowledge of larger problems, facilitating the possibility of drawing general conclusions.9 Case studies are often subjected to difficulties in identifying the case itself. In other words, to specify “what the case is a case of”.10 Here, the case is Ukraine and what is being studied in Ukraine is the case of trade impacts on poverty. Why choose Ukraine then? During the Soviet-era, the country was more or less isolated from international trade outside the Soviet Union. After independence, a gradual opening has changed the conditions for the economic system – making it an interesting subject of study. Naturally, the ideal case would be a country that experienced a transition from two extremes – total isolation into full openness to trade. However, cases or countries like this do not exist and these types of binary functions are witnessed only in theory.
1.4 Material In order to get an overview of the economic and political development in Ukraine regarding institutional factors, we have mostly used scientific articles from different institutes and reports from organisations such as the World Bank and the OECD. Statistics have been collected mostly from the webpage of the State Statistics Committee of Ukraine – SSC -and international organisations such as the World Bank, WTO, ILO, IMF and OECD. For some of the poverty headcount calculations, the World Banks internet resource databank PovcalNet has been used with the 2005 PPP-rate. Furthermore, when calculating the indices for openness to trade, the World Banks internet resource databank “World trade indicators” has been used. The theoretical framework linking traditional economic theory with poverty has largely been based on the work of Winters, McCulloch and McKay.
1.5 Delimitation Although the grand theoretical question is how trade liberalisation and trade will affect poverty, a general answer is not plausible within the scope of this study. Consequently, a limitation has been done into a case study of a single country. This study does not claim to make an overall assessment of how trade liberalisation affects poverty; instead this will be examined in the selected country including further delimitations. Moreover, the amount of independent variables affecting poverty is extensive and sometimes not possible to quantify. The focus in this thesis will be on economic factors, namely employment, wages, prices and economic growth. The intention has been to cover the time period between 1996 and 2007. In many instances, data has not been available for the whole time period and consequently some years have been left out, resulting in a narrowing in the scope of time. The original motivation behind the chosen time period is that it was during these years that Ukraine began its trade liberalisation: Ukraine entered the PCA with the EU in 1998. Furthermore, Ukraine had begun its preparation work and negotiations with the WTO which implied adapting its regulations and economic system. Finally, it was not until 1996 that the hyperinflation Ukraine experienced after the transition began to reach manageable levels and thus the selected time period facilitates the examination of macro-variables without such major distortions. We believe
9 Flyvbjerg:2006, p.223 10 Flyvbjerg:2006, p.238

9
however, that despite the fact that some statistical indicators could not be covered by the whole span of time, the data is sufficient enough for our purpose.

10
2. Theory
2.1 International Trade Theory International trade has for long engaged economists and the idea of international trade as welfare enhancing dates back as long as the writings of Adam Smith and David Ricardo.11 David Ricardo, recognised as the founder of trade theory, formed his theory on the concept of comparative advantages from which trade patterns are determined. Allowing for trade between two economies leads each economy to specialise the production of the good in which it has a comparative advantage towards the other economy. Advantages stems from differences in productivity and as Ricardo considered labour the only factor of production, productivity differences could only be derived from differences in labour productivity. 12 As Ricardo focused only on labour as a factor of production, the utility of the model in explaining world trade patterns is reduced. Nevertheless, it helps to understand the basic ideas of why and how countries can be better off from trade. To allow for more than one factor of production seems then to be the next natural step, and this is what is done in the model developed by Eli Heckscher and Bertil Ohlin.13 Before outlining this theory, it is worth clarifying the assumptions made by the model. The model describes the relationship between two countries; let us depict them as “Ukraine” and “Abroad”. We then assume that these countries produce two kinds of goods, X and Y using only two factors of production, namely land and labour. To produce one unit of X, labour is used to a larger extent than land - making it a labour intensive good. The reverse is true for the production of Y, rendering it a land intensive good. Moreover, the countries employ their full resources and operate under conditions of perfect competition. “Ukraine” is relatively abundant with labour whereas “Abroad” is relatively abundant with land.14 As factors of production can be moved between one industry and another, the production possibility frontier takes a convex shaped form. It shows how much an economy can produce given its amount of productions factors. Thus, in order to increase the production of X, the economy will have to reduce its production of Y. As the shape of the production possibility frontier is convex, this implies that the marginal cost in terms of Y when expanding the production of X will be increasing. The slope of the production possibility frontier then expresses the marginal rate of transformation.15 This is how much an economy will have to sacrifice Y, in order to be able to produce an additional X.16 This is shown in figure 2.1. 11 Stiglitz & Andrew:1999, p.12 12 Krugman & Obstfeld:2006, p.2 13 Krugman & Obstfeld:2006, p.50 14 Krugman & Obstfeld:2006, p.61 15 Krugman & Obstfeld:2006, p.53 16 Frank:2005, p.599

Figure 2.1 Production possibility frontier and relative prices
In order to maximise the value of its productisovalue line is tangent to the production possibility frontier. The isovalue line is a line along which the value of the production is the same and the slope is equal to the relative price between the two goods in consideration. In the case of a closed economy, its consumption will be restrained by its production. If this economy opens up for international trade, it will be able to export some of its production and import some of its consumption. Then the economyconsumption will not be constrained by its production but of the value of its exports. Hence the economy will be able to consume at a point along the budget constraint other than the point corresponding to its production. This will allow the economy to consumption and welfare, best illustrated by the indifference curves. The point of consumption with trade allows the economy to attain a higher indifference curve. A higher indifference curve means by its assumption greater welfare.
Figure 2.2
17 Krugman & Obstfeld:2006, p.87
11
Production possibility frontier and relative prices
In order to maximise the value of its production, such an economy will produce where the isovalue line is tangent to the production possibility frontier. The isovalue line is a line along which the value of the production is the same and the slope is equal to the relative price
in consideration. In the case of a closed economy, its consumption will be restrained by its production. If this economy opens up for international trade, it will be able to export some of its production and import some of its consumption. Then the economyconsumption will not be constrained by its production but of the value of its exports. Hence the economy will be able to consume at a point along the budget constraint other than the point corresponding to its production. This will allow the economy to consumption and welfare, best illustrated by the indifference curves. The point of consumption with trade allows the economy to attain a higher indifference curve. A higher indifference curve means by its assumption greater welfare.17 See figure 2.2.
Figure 2.2 Enhancement of International Trade
Production possibility frontier and relative prices
ion, such an economy will produce where the isovalue line is tangent to the production possibility frontier. The isovalue line is a line along which the value of the production is the same and the slope is equal to the relative price
in consideration. In the case of a closed economy, its consumption will be restrained by its production. If this economy opens up for international trade, it will be able to export some of its production and import some of its consumption. Then the economy´s consumption will not be constrained by its production but of the value of its exports. Hence the economy will be able to consume at a point along the budget constraint other than the point corresponding to its production. This will allow the economy to increase its consumption and welfare, best illustrated by the indifference curves. The point of consumption with trade allows the economy to attain a higher indifference curve. A higher
e 2.2.

12
One of the advantages of the Heckscher-Ohlin model is its ability to analyse how trade will affect the income distribution within an economy. Since “Ukraine” is relatively abundant in labour, its production possibility frontier will be biased towards the production of the labour intensive good X and will at all price levels tend to produce a higher ratio of X relative to Y. Similarly, “Abroad’s” production possibility frontier is biased toward the production of the land intensive good Y and will at any price level produce a higher ratio of Y relative to X.18 When the two countries trade with each other the relative price will tend to converge and as a result, the relative price of X will rise and that of Y will decrease from Ukraine’s point of view. As the price of X rises and that of Y decreases, Ukraine will increase its consumption of Y at the expense of X and eventually become a net importer of Y and a net exporter of X. The reverse will of course be true for “Abroad”. From this we can conclude that producers of X in Ukraine will gain from trade due to the higher price at which they can sell their production. A similar reasoning gives us that the producers of Y in Ukraine will lose due to the lower prices of Y.19 However, the story does not end here - when analysing trade one must fully comprehend the effects of the changed price levels as this will affect the consumers. As the price of Y rises due to trade, consumers of this good face a higher price of their consumption and will be made worse off. However, consumers of the imported good X, will be made better off as this good now is available cheaper than before. The theory then predicts that implementing trade will make the economy as a whole better off due to increased efficiency and also lays out a framework for interpreting the distributional effects within the countries.
2.2 Poverty implications of international trade Economic theory does not provide us with a framework for analysing the effects on poverty due to trade reform. Thus, a necessary step will be to investigate the consequences and the possible channels for these effects to trickle down to the poor. Researchers must rather evaluate the capacities of the poor to opportunities such as increased or decreased employment. In the case of an increased output due to new markets opening up after trade liberalisation, the effect on employment will depend on how much of this increase turns into an augmented demand for labour. Further, as already noted, the poor may or may not be able to respond to the augmented demand. If the case is the latter, it will have little effect on poverty.20 In the next section we will present an analytical framework developed by Winters, McCulloch and McKay, with some minor modifications. The framework identifies three channels through which trade affects the economy; productivity, employment and price levels. This helps to understand and identify the effects that trade liberalisation has on poor.
18 Krugman & Obstfeld:2006, p.54 19 Krugman & Obstfeld:2006, p.64 20 Stiglitz & Charlton:2005, p.69, p, 194, p.198-199

The model should serve as a guideline for the reader throughout this thesis. Employment, productivity and prices are believed to poverty. However, it is important to remember that other factors, such as education andalso influence on poverty.
Figure 2.3 Analytical Framework
13
ld serve as a guideline for the reader throughout this thesis. Employment, productivity and prices are believed to be the channels by which trade liberalisationpoverty. However, it is important to remember that other factors, such as education and
Figure 2.3 Analytical Framework
ld serve as a guideline for the reader throughout this thesis. Employment, be the channels by which trade liberalisation affects
poverty. However, it is important to remember that other factors, such as education and aid

14
2.2.1 Economic growth and productivity The fact that the key component to sustainable poverty reduction in the long run is economic growth is hardly a contested matter amongst economists and development practitioners. Furthermore, there exist several empirical studies that support the idea that trade liberalisation and openness in a country affects economic growth positively. However, to completely prove this linkage has not yet been possible.21 This fact stems from three important sources:
• The difficulty of measuring the degree of freedom to trade – when taking into account problems of measuring non-tariff barriers, aggregating tariffs, assessing quantitative restrictions and so on.
• Difficulties of proving causality – for example, it might be so that economic growth leads to openness and trade liberalisations.
• The fact that sustainable or permanent growth probably needs to be accompanied by other important policies such as investment friendly climate, frameworks for conflict resolution and supportive environments for human-capital accumulation.22
On the other hand, it cannot be proven that openness and trade liberalisation has a negative impact on economic growth. One approach is to see how trade liberalisation affects a country’s productivity, as does the traditional theory. Increased productivity is necessary for continuous growth, but not always sufficient. For example, if higher productivity results in a decreased input rather than increased output then the short-term effect might be decreased employment and consequently increased poverty. Due to possible distributional implications, it might be that the positive effects on poor people are smaller than those from others sources affecting economic growth.23 The widely accepted economic theory stipulates growth as a result from openness to trade via increase in productivity in the medium term and long term benefits such as access to new technology, access to intermediate and capital goods, benefits of scale and competition and so on. However, one can easily construct models that implies opposite effects. For example, a plausible scenario might be that trade liberalisation pushes countries into less dynamic sectors like primary extraction. The final issue of the effects thus remains an empirical one.24 This will be further elaborated in the forthcoming section “the research so far”. The pathways of the effects of trade liberalisation on growth are not evident, but it is likely that it works at least partly on the technical progress. For example; access to imports makes new inputs, technologies and management techniques available for the country. Moreover, the improved competition comes as a result from reduced protection which forces producers to improve their technical efficiency. In addition, openness might improve the flow of information and technical skills. 25 In general, the empirical studies show that openness and trade liberalisation leads to a strong increase in productivity. In some cases the effects are direct and immediate. The net effects on employment depend on the relative sizes of output and on the productivity chocks and are also affected by factors such as the flexibility on the labour and credit markets. 26
21 Winters et al:2004, p. 76 22 Winters et al::2004, p.77 23 Winters et al::2004, p.80 24 Winters et al::2004, p.76 25 McCulloch et al:2001, p.25-26 26 Winters et al::2004, p.83

15
2.2.2 Prices The Heckscher-Ohlin model, as mentioned before, predicts a price increase of the good in which the economy has its comparative advantages. At the same time, the good produced inefficiently at home will be replaced by cheaper imports. The assumption made by the Heckscher–Ohlin model that individuals have completely identical preferences has to be seen in a different light. When considering individuals as a heterogeneous group, the price fluctuations will consequently have diverse effects on different income groups. The effect on poor households will depend very much upon their consumer bundle. If the poor household is a net producer of the good that experiences a price increase, the household will certainly be better off. Of course there is no reason to believe that the opposite will not occur and hence the household will see the price of its production decline while the price of its consumption rises.27 Nevertheless, even if only net producers benefit from trade reform and the vast majority of poor people do not belong to this group, the multiplier effect implies that these will spend parts of their increased income on local goods and services which might benefit the poor. 28 The effects on prices by trade liberalisations such as tariff reduction will probably be smaller for the manufactory industry than for the agricultural industry because of natural consumer expenditures. For poor people, food makes up a larger share of consumption than does manufactured goods. There might however be commodities of importance coming from the manufacturing industry such as agricultural inputs and clothes.29 Another aspect of importance is if the country depends on import for its electricity is that of energy prices A lower tariff at the border induced by trade liberalisations may or may not be transmitted to the local market. Transportation costs, monopolistic distribution channels and other market imperfections might partly or fully eradicate positive or negative consequences of lower tariffs on poor households.30 The infrastructure can be of such poor quality that tariffs only represent a small share of the cost of providing the goods to the markets. Improvements in the infrastructure would then have a much greater impact on prices than a tariff reduction.31
2.2.3 Wages and Employment Surveying the trade reform’s impact on the labour market is of great importance since most individuals obtain their income from labour work. Being employed is often decisive whether or not an individual is to be considered poor.32 If the good exported by the economy is a labour intensive one an augmented demand will lead to an increased demand for labour.33 Two extremes can occur in the labour market depending on the elasticity of supply of labour. The increase in demand will either lead to an increase in wages or an increase in the level of employment. Of course positions in between theses extremes are possible and the final result might also be that employment as well as wages rise.34 It is not certain however, that trade liberalisation will lead to an increase in demand for unskilled labour, which is the type of labour that most often provides job opportunities to poor. On the contrary, the Heckscher-Ohlin model implies that an economy will export goods
27 Winters et al::2004, p.74, 28 Winters et al::2004, p.93 29 McCulloch et al:2001, p.265 30 Winters et al:2004, p 74, p.86-87 31 McCulloch et al:2001, p.72 32 Winters et al:2004, p. 33 Krugman & Obstfeld:2006, Chapter 4 34 Winters et al:2004, p.97

16
using its relatively abundant production factors. A developing economy is not per se a country that will have comparative advantages in unskilled labour. It might as well have other advantages such as raw extraction of minerals, medium or high skilled labour which reasonably does not benefit the poorest. Furthermore, trade liberalisation can result in increased wages of workers with primary education, but not for totally uneducated persons. 35 Even if the economy will export a good that uses labour as its main factor of production, this will not assure poverty alleviation. As seen above, the structure of the labour market might be such that wages will not rise even if demand rises. Even if wages were to rise, this could prove insufficient to lift the employees out of poverty if the wage rate lies under the poverty line.36 Moreover, it is not clear whether the poor will be able to respond at all to the increase in labour demand. On the contrary, the poor can be left further behind if their responsiveness is low and new jobs created are taken by workers just above the poverty line.37 Another aspect is the structure and flexibility of the labour market. If trade liberalisation gives rise to job destruction, the poverty impact will largely depend on the capabilities of re-employment. 38 In summarising this chapter, trade liberalisation implies distributional changes. Consumer prices as well as production prices will fluctuate and this may eventually reduce the wellbeing of some individuals whereas others will experience an increase. Trade reforms leave no guarantee that poor individuals will be excluded from possible negative impacts of trade reform. The final outcome will thus depend on numerous factors particular to each and every economy such as the implementation process of the reforms, the current situation of the economy and the characteristics of the poor. No conclusion can therefore be expected to be of general validity across developing economies, and consequently case studies come in handy in this occurrence.
35 Winters et al:2004, p.100-101 36 Winters et al:2004, page 98 37 Khan:2001, p.2 38 Winters et al:2004, p.267

17
3 Empirics
3.1 The Research so far The effect of international trade on poverty is a research area that has attracted increasing attention the last years by researchers trying to quantify the impacts.39 Despite extensive difficulties of identifying, measuring and isolating variables when studying the relation between trade liberalisation and poverty and despite the lack of accurate data on poverty and inequality, several studies have been made with cross country data dating back from the 60’s until today. One example is a study carried out by Dollar & Kraay from the World Bank in 2002 entitled “Growth is Good for the Poor”. This is perhaps the most extensive study conducted on relations between inequality, incomes and growth with regards of the amount of data processed. It comprises 953 observations in 137 countries over the period 1950-1999.40 According to the conclusion of the authors, the average income of the poorest fifth in the society moves proportionally in the same direction as for the average income of the society as a whole. In other words, in the long run – a one percent increase in the average income will be reflected in a one percent increase in the income of the poorest fifth. Another researcher at the World Bank, McCulloch, highlights the fact that in contrast to the evidence on the positive impact of growth on poverty – it has been far more difficult to find connections between trade liberalisation and growth. This primarily has two reasons; first of all measuring trade barriers and openness is difficult. For example, Carlsson & Lundström finds a negative relation between freedom to trade and growth using indexes from Economic Freedom of the World: 2008 Annual Report from the Fraser Institute.41 This interesting result pinpoints the difficulty of measuring an overall trade policy which also includes non-tariff barriers. Secondly, the direction of causality between trade liberalisation and growth is difficult to establish. Does trade liberalisation lead to increased growth or do countries with increased growth tend to liberalise their trade policy?42 Several studies have been realised in order to estimate the effect of trade reform on poverty through employment. Those have however assumed segmented labour markets and overall conclusions on poverty are difficult to draw upon these. In his paper, Aziur Rahman Khan analyses the links between growth, employment and poverty reduction. He shows that an increase of productive and remunerative employment is associated with a decrease in the level of poverty. 43 Another study also stresses the importance of economic growth to reduce poverty but at the same time points out that this is only a necessary condition and not sufficient condition for poverty reduction. The different paths of East Asia and South East Asia serve to make this point clear. The former has much higher employment elasticity of economic growth than the latter which has also been translated into a much more impressive rate of poverty reduction.44 The general conclusion hence is then that although trade reform is an important path out of poverty, research conducted within the field show none or small impacts on the level of
39 Hertel & Reimer:2005, p.377 40 Dollar & Kraay:2002, p. 200 41 Carlsson & Lundström:2001, p.342 42 McCulloch:2005, p.14 43 Khan:2001, p.3 44 Islam et al: 2005,p.1

18
employment. Furthermore no evidence has been found that labour used in the export industry would be the least skilled and therefore most likely to be poor. 45
3.2 Ukraine – a brief prelude The modern economy of Ukraine was developed under the Soviet Union era and with exception of the brief period between 1918 and 1920, Ukraine did not gain full independence until 1991, briefly after the collapse of the Soviet Union.46 During the time when Ukraine was an integral part of Soviet, the country itself accounted for 17 % of the total industrial sector output and 21 % of the total agricultural sector output of the Soviet Union as a whole.47 These sectors are still today Ukraine’s most important ones, even though the industry is in need of massive reinvestments in order to reach international standards. The Ukrainian agriculture sector was often referred to as the granary of Europe largely due to its richness of black soils – Ukraine has one of the most fertile soils in the world. 48 It would take the country five more years after the independence to elaborate a new democratic constitution. These years were marked by great political disagreement over which economic policy should be pursued and differing ideas over the transition from planned economy to market economy. Struggling Ukrainian industries and farms lobbied for state subsidies, protectionism and the preservation of collective farms. At the same time the country suffered from large insider privatization schemes which generated the prevailing oligarchs in Ukraine when previous state-owned enterprises where sold out for bargain prices. The country was also burdened by the ex-soviet infrastructure implying an energy-intensive and defence-orientated industrial economy that had been more or less isolated from the international markets.49Ukraine suffered a period of extreme inflation in the early 1990s that had severe effects on the population, forcing citizens to grow their own food and turning to a barter economy. In 1992 the yearly inflation was as high as 4735 %. By 1996 the inflation had dropped to manageable levels and some sort of stability had been achieved. Between 1990 and 1998, the GDP fell by 40 %.
Figure 3.1 Inflation rate
45 Winters et al:2004, p.100 46 Encyclopædia Britannica:2009a 47 Encyclopædia Britannica:2009b 48 Utrikespolitiska Institutet:2009 49 World Bank:2004, p.1-2
80%
16%11%
23%28%
12%
1%5%
9%13%
9%13%
0%
10%
20%
30%
40%
50%
60%
70%
80%
90%
1996 1997 1998 1999 2000 2001 2002 2003 2004 2005 2006 2007
Source: IMF

19
Lately, Ukraine has managed to emerge from recession and has attained high rates of growth, partly due to high metal prices in the world market. However, this situation is not expected to continue and therefore, it cannot form a sustainable basis for further economic growth. Diversification into other competitive markets has however been hindered by an unfavourable business climate characterised by its complexity and unpredictability, and not seldom corruptly administrated.
3.3 Poverty measures & Poverty in Ukraine
3.3.1 Definitions Poverty as a notion has many dimensions and can be addressed to from various disciplines such as political science, sociology, health science and economics.50 The latter is the focus of this study and the economic approach to poverty is also the main strategy of the World Bank, which has been and persists to be the largest institution in the world focusing on development issues.51 The World Bank mostly uses income or expenditure as measurement of poverty, even though other types of measurements are being given increasingly more importance.52 However, when measuring poverty in an economic point of view, it can be done in either absolute or relative terms. Absolute terms refers to a set standard which is constant and uses a poverty line that measures an approximation of the minimum costs needed to sustain the human body. This is approximately 2000-2500 calories per day for an adult mate, and thus the minimum income of achieving this minimum consumption varies from country to country. A common poverty line for extreme poverty is $1 per day. The absolute measure is often referred to as headcount index when expressed in percentage of the population living below the indicated value. An advantage of the absolute poverty measure is that it allows for comparisons through time and between countries.53 A relative term on the other hand reflects the relativity of the poverty. In other words, it emphasises on the inequality between the poorest and the richest in a given population. The lower the gap, the higher the amount of middle class income people. The poverty line in this case is relative to the general standard of living in a given country and might be drawn as a fraction of average income or average wage. Some argue that the concept of poverty should always be perceived as relative to the welfare of others.54 In order to capture the dynamics of the notion poverty, this study will measure poverty according to the World Bank’s methods of both absolute and relative poverty.
3.3.2 Poverty in Ukraine According to the World Bank, the Ukrainian Government, the State Statistical Committee and other non-governmental research organization in the country, Ukraine has very strong capabilities of monitoring and analysing poverty. 55 However, the Ukrainian authorities have used two different kinds of measures that the World Bank have found somewhat insufficient when estimating differences over time. The first measure uses a relative concept of poverty in defining the level of well-being as 75 % of the median expenditures per individual. Because
50 McCulloch et al:2001, p.38 51 Encyclopædia Britannica:2009 52 World Bank homepage:2009b 53 McCulloch et al:2001, p.47 54 McCulloch et al:2001, p.47 55 World Bank:2005b, p.xix
20
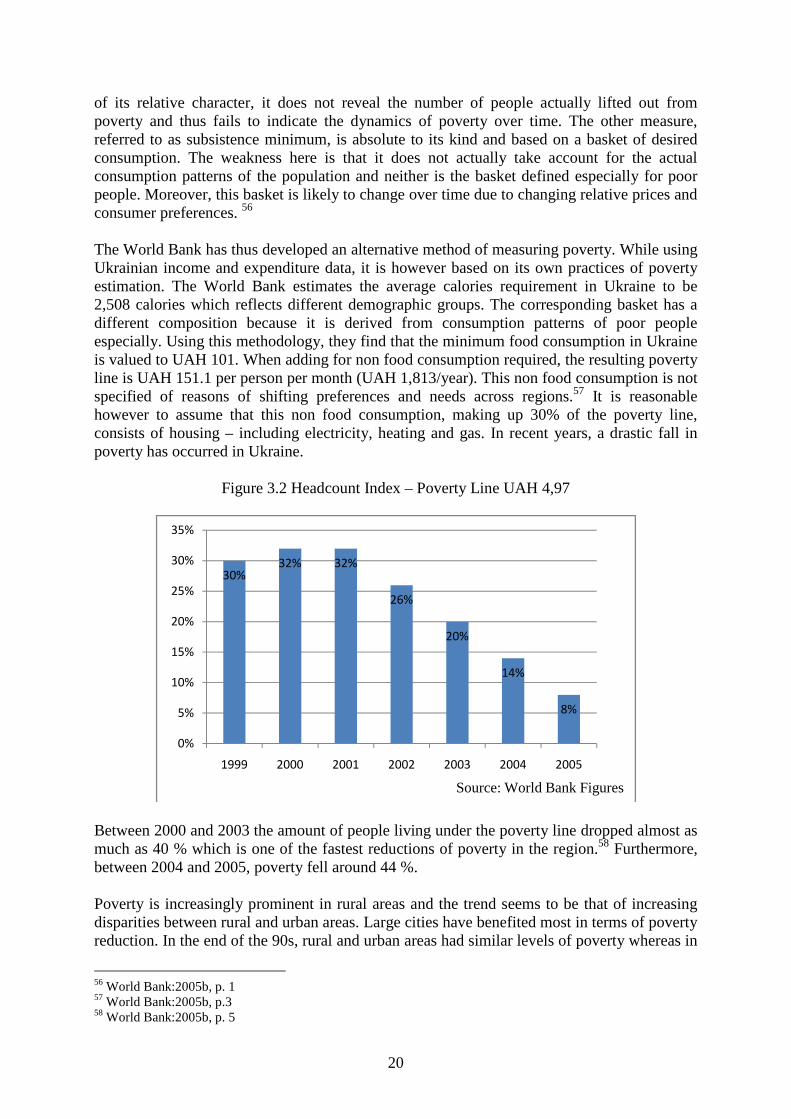
of its relative character, it does not reveal the number of people actually lifted out from poverty and thus fails to indicate the dynamics of poverty over time. The other measure, referred to as subsistence minimum, is absolute to its kind and based on a basket of desired consumption. The weakness here is that it does not actually take account for the actual consumption patterns of the population and neither is the basket defined especially for poor people. Moreover, this basket is likely to change over time due to changing relative prices and consumer preferences. 56 The World Bank has thus developed an alternative method of measuring poverty. While using Ukrainian income and expenditure data, it is however based on its own practices of poverty estimation. The World Bank estimates the average calories requirement in Ukraine to be 2,508 calories which reflects different demographic groups. The corresponding basket has a different composition because it is derived from consumption patterns of poor people especially. Using this methodology, they find that the minimum food consumption in Ukraine is valued to UAH 101. When adding for non food consumption required, the resulting poverty line is UAH 151.1 per person per month (UAH 1,813/year). This non food consumption is not specified of reasons of shifting preferences and needs across regions.57 It is reasonable however to assume that this non food consumption, making up 30% of the poverty line, consists of housing – including electricity, heating and gas. In recent years, a drastic fall in poverty has occurred in Ukraine.
Figure 3.2 Headcount Index – Poverty Line UAH 4,97
Between 2000 and 2003 the amount of people living under the poverty line dropped almost as much as 40 % which is one of the fastest reductions of poverty in the region.58 Furthermore, between 2004 and 2005, poverty fell around 44 %. Poverty is increasingly prominent in rural areas and the trend seems to be that of increasing disparities between rural and urban areas. Large cities have benefited most in terms of poverty reduction. In the end of the 90s, rural and urban areas had similar levels of poverty whereas in
56 World Bank:2005b, p. 1 57 World Bank:2005b, p.3 58 World Bank:2005b, p. 5
30%32% 32%
26%
20%
14%
8%
0%
5%
10%
15%
20%
25%
30%
35%
1999 2000 2001 2002 2003 2004 2005
Source: World Bank Figures

21
2003 - rural poverty was twice as large as in big cities. Consequently, the capital of Ukraine has the lowest poverty level in the country.59 However, the fact that rural poverty levels are not reduced as much as urban ones might be due to a high concentration of pensioners in the country side and an over-estimation of the effects of inflation on implicit incomes in rural areas. In the country side, a great number of households have their own plot of land where they can be self-sufficient in terms of food. In addition, the economy in rural areas is often demonetarised as a great deal of transactions is made in kind. Poverty rates are in general high amongst large families, infants and children, people without education and the unemployed. When decomposing the labour status of poor people in Ukraine following results were obtained in 2003:
Figure 3.3 Labour status of poor
As we see, employed is the major occupational status of poor people in Ukraine. Pensioners represent the second largest occupational status followed by unemployed. At a first glance, this somewhat peculiar relation seems intuitively strange. It is however partly explained by the fact that a majority of the total population are in fact employed, and only a small proportion of the total population is unemployed. This implies that poor are under-represented amongst employed and over-represented amongst unemployed. Further, the poverty headcount of all employed people in Ukraine, i.e. the share of poor people amongst the employed, is half as big as the one of unemployed. In other words, the risk of being poor is twice as big for an unemployed person than for an employed one. 60 When examining the sources of income for poor household defined as the poorest quintile of the total population, the composition yields a quite consistent pattern between 1999 and 2003.
59 World Bank:2005b, p. 9 60 World Bank:2005b, p.13
Unemployed
17%
Pensioners
35%
Other
6%
Employed
42%
Source: World Bank

22
Figure 3.4 Poor Household Income Structure
Throughout the whole period, wages & self-employment – making up the largest share of income – has increased by 14% in real terms. Pensions & transfers have experienced a slightly larger increase of 16%, but represent roughly only half the share of wages & self-employment and thus yields a smaller impact on poor. Home production, i.e. agriculture & food production generated privately, represents the second biggest source of income for the poor. Its average growth was however only 6%.
Table 3.1 Yearly and Average Growth of Income by Source Source of Income 2000 2001 2002 2003 Average growth 2000-2003 Income from Assets 6% -1% 7% 14% 6% In-kind subsidies -2% -18% -18% -3% -10% Private transfers -5% -3% 1% 20% 3% Pensions and transfers 4% 12% 40% 9% 16% Home production -12% -5% 7% 35% 6% Wages and Self-employment 1% 22% 28% 6% 14% Total Income -2% 8% 21% 13% 10% Source: World Bank
3.3.3 Dynamics When comparing poverty with other countries, the World Bank standard poverty line for extreme poverty is $1 per day. This is however not an accurate measure for Ukraine and the surrounding region of Commonwealth of Independent States (CIS)61 countries. A poverty line which takes account for a colder climate and thus higher costs for clothing and heating than that of southern developing countries is needed. In Ukraine and the surrounding region, the World Bank estimated in a research report that $2.15 was an overall good poverty line.62
61 See Appendix 2 for explanation 62 World Bank:2005a, p.50
0%
10%
20%
30%
40%
50%
60%
70%
80%
90%
100%
1999 2000 2001 2002 2003
Income from Assets
In-kind subsidies
Private transfers
Pensions and
transfers
Home production
Wages and
Selfempolyment
Source: World Bank

23
Adjusted for 2005 PPP exchange rate, figure 3.5 gives the following indications of poverty in Ukraine.
Figure 3.5 Headcount Index – Poverty Line $ 2.15/day
It’s important to highlight the differences observed as a consequence of which consumption basket has been used. These numbers are calculated with the 2005 PPP exchange rate, and thus based on a different consumption basket than the former table expressed in UAH. To illustrate the dynamics of the poor, something that is often missed out when using an absolute poverty line, we run the same data with a poverty line twice as big as before – namely $4.3per day. This illustrates individuals that are close to being very poor and gives insights in how the trend of these people living close to $2.15/day has developed.
Figure 3.6 Headcount Index – Poverty Line $ 4.3/day
Even though the figures are largely different, the trend seems to be the same. A poverty increase between 1996 and 1999, and then a substantial poverty reduction up to 2005. The
10%
17%
5%
1%0%
2%
4%
6%
8%
10%
12%
14%
16%
18%
1996 1999 2002 2005
Source: World Bank Povcal
46%
66%
39%
15%
0%
10%
20%
30%
40%
50%
60%
70%
1996 1999 2002 2005
Source: World Bank Povcal

24
$4.3/day poverty line illustrates that a large amount of people with incomes at the lower end of the income spectra has had a substantial improvement in the latest years. Again, using the official Ukrainian measure of the subsistence minimum with desired consumption, the amount of poor people is somewhat bigger than the previous calculations.
Figure 3.7 Headcount Index – Official Ukrainian subsistence minimum
The trend however is consistent with the earlier outlined poverty indicators. Using this calculation, poverty has dropped by 64 % since 2000. However, when taking account for the change of level the subsistence minimum, some interesting observations can be pointed out. The numbers shows us that between 2000 and 2003, no great change can be observed in the poverty rate. An explanation to this is that income levels for poor have not increased proportionally to the increase of the subsistence minimum level. If the increase in the subsistence minimum level reflects increases of price, income will have to increase at the same rate in order to maintain a constant poverty rate. This has not been the case, and that is why we are observing a slight increase in poverty. However, between 2002 and 2007, although we observe increases in the subsistence minimum – poverty has dropped significantly. Here incomes have increased at a higher rate than increases of price – and thus we observe a large decline in the headcount index.
3.4 Ukraine & the Trade
3.4.1 Trade liberalisation Since its independence, Ukraine has made substantial progress in terms of liberalizing its trade regime. In the beginning of the last decade, export and imports in Ukraine imposed many Non-Tariff Barriers (NTB)63, quotas, licenses, state trading, wide ranging price-controls
63 See Appendix 2 for explanation
0%
10%
20%
30%
40%
50%
60%
70%
80%
90%
2000 2001 2002 2003 2004 2005 2006 2007
Source: SSC
Yearly size of subsistence minimum per person -UAH279 311 342 342 362 423 472 532

25
and foreign exchange restrictions. Today, although non-tariff barriers still exist, most of these restrictions have been removed and Ukraine enjoys a generally liberal trade policy.64 The current trade regime has seen three different phases of change. The first one occurred briefly after the independence and reflected the painful reformation of the economic system. During this time, Ukraine handed in its WTO-application. In the same period, the U.S. and Ukraine reciprocally granted each other MFN-status.65 In 1994, a second phase was initiated by a large reform package, including measures to stabilise, liberalise and privatise the economy. EU and Ukraine, granted each other MFN-status during this period. The package was however not so successful in its implementation, especially considering the trade policy measures. It was not until 1999, when the Prime Minister Victor Yuschenko initiated the new program for a broad economic liberalisation, that the country made significant steps in its path to a modern economy. Ukraine placed EU-integration as an important strategy, boosted the negotiations concerning the WTO-accession and reduced preferential import tariffs on over 200 commodity groups by 5-15%.66 The latest stage of this trade liberalisation includes a broad liberalisation with the strategic priority to access the WTO, successfully completed in May 2008. The largest steps in the framework of WTO-accession have been taken in form of internal reforms aimed at removing non tariff barriers as to facilitate trade.67 Despite this, average tariffs have remained more or less constant since independence although important fluctuations have occurred within different groups of goods. Agriculture products have seen a threefold rise in average tariff in the period between 1993 and 2002.68 In addition, many of the reforms impinged on Ukraine by the WTO have had a domestic institutional character. This is to say, institutional reforms such as standards, intellectual property rights and the removal of agricultural subsidies. 69 When considering the openness of a trade regime, what is also very much important, is to what degree a country is domestically liberalised. 70 Ukraine gained recognition as a market economy by the EU and the US in 2005 and 2006 respectively – further indicating the domestic liberalisation progress.7172 Exports plus imports constitute about 100% of GDP, which is fully comparable with other economies in the region.73 Russia has traditionally been the major trade partner. Since the EU’s latest enlargement this role has however been overtaken by the Union. Thus, around 1/3 of Ukraine’s exports are destined to EU today. Asia has also increased its trade with Ukraine at the expense of Russia.74 The trade relations between Ukraine and EU have been based on the Partnership and Cooperation Agreement (PCA) which came into force in 1998.75 A new agreement to replace the PCA is under negotiation and is intended to create a free trade area which would not only
64 World Bank:2004c, p.39 65 Agreement on Trade Relations between the U.S. and Ukraine, art.I 66 World Bank:2004c, p.39 67 World Bank:2004c, p. 39 68 World Bank:2004c, p. 40 69 WTO Homepage:2005 70 World Bank:2004c, p.74 71 Radio Free Europe:2005 72 Radio Free Europe:2006 73 See figure 3.11 74 Emerson et al: 2005, p.32 75 Emerson et al: 2005 p. 50

26
see the abolition of tariffs, but also a complete harmonization of Ukraine’s regulatory standards with the EU.76 The PCA assures access to the European market and Ukraine also benefits from EU’s Generalised System of Preferences (GSP) which has lowered some tariffs for Ukrainian exports. However, the GSP treatment is not applicable for Ukraine’s most important export goods such as iron and steel, fertilizers, fishery products, grain, seeds, fruits and plants. It thus has a quite neglectable impact.77 Trade with Russia and other former Soviet republics collapsed in the early 1990s but several attempts have been made to re-establish the traditional link between these countries. Many of these multilateral agreements have failed to make any effective impact although some bilateral agreements are in place. Ukraine has established bilateral free trade areas with the CIS, even though some goods regarded sensitive are excluded from the agreement.78 In 2002, roughly 50% of Ukraine’s total imports originated from FTA’s - implying a 0% tariff rate.79 This represented the FTA with the CIS and the three Baltic countries. In 2006, the trade with Ukraine’s FTA-partners had decreased to 31% - illustrating a reallocation of trade towards EU and also indicating the end of the FTA with the Baltic countries. 80 In 2001 Ukraine’s import patterns were roughly divided as follows: 50% of imports took place within FTA’s, implying a zero tariff rate. 40 % came from MFN-partners and the remaining 10% was subjected to full tariff rates, normally double the MFN-ones. 81
3.4.2 Measuring the Openness Measuring openness in a country is a difficult task. Typically, two approaches can be used when measuring openness: openness in practice and openness in policy. Openness in practice focuses on the factual trade in a country’s economic activities and does not take into account the reasons for the trade. Openness in policy however, examines the existence and implementation of policy measures designed for controlling the trade. The fact that a country is open in practice, does not guarantee its openness in policy, and vice versa. It is also important to keep in mind that small countries often have a greater share of trade to GDP than big countries. Consequently, it does not say much about their trade policy restrictions. 82 However, when seen together, they give clear indications on the level of trade liberalisation. The World Bank elaborates over 300 different indices with respect to trade liberalisation. 83 We have chosen to account for some of the most common ones by including three policy measures and two practice measures. In addition, we have added an index depicted as aggregated as it accounts for tariff as well as non-tariff barriers to trade.
76 Shumylo et al:2007, p. 11 77 Emerson et al: 2005, p.50 and World Bank:2004c, p.73-86 78 Emerson et al: 2005, p. 55 79 World Bank:2004c, p.40 80 World Bank Homepage:2009a 81 World Bank:2004c, p.40 82 Winters et al:2004, p.14-15 83 World Bank Homepage:2009

27
Table 3.2
Ukraine Openness to trade indices
Time Period 1996 1997 1998 1999 2000 2001 2002 2003 2004 2005 2006 Openness in Policy Simple Average Tariff 8.4 7.6 7 6.9 4.8 Average Weighted Import Tariff 3.1 4.6 5 4.9 4.4 4.7 5
*Non-agricultural Goods 2.1 2.6 3 3 2.8 2.7 2.7 2.7 *Agricultural Goods 14.9 28.1 27.9 26.7 22.9 27.6 31.4
Average Weighted Import Tariff - MFN 6 9.3 9.7 10.2 8.9 9.1 9.7 5.31 *Non-agricultural Goods 4.4 5.5 6.5 6.7 6 5.8 5.9 5.9 3.98
*Agricultural Goods 17.6 37 33.4 35.5 30.2 33.3 37.6 25.38 Non-Tariff Measure Indices
*Simple-average index 16.8 17 17.6 19 19.2 13.5 13.6 15,6 17,5 *Import-Weighted index 10.5 10.7 11.2 14.1 14.2 8.8 8.7 11,8 10
Openness in Practice Real growth of total trade 16.3 -5.0 1.6 -9.7 22.6 2.6 6.5 5,5 18.7 -5.3 0.5 Trade Integration 73 94 84 87 102 120 109 106 113 120 102 Aggregated index Freedom to Trade Index 66.0 66.0 53.0 53.0 70.0 70.0 71.0 74.6 74.4 76.2 77.2 Source: Derived from World Bank & Heritage Foundation
For a complete explanation and definition of the accounted indices in table 3.2, see Appendix 1. The table above shows numbers that point in different directions, thus a general sum-up is difficult to give. However, when considering the indices separately, important observations can be made. First we account for the Openness in Policy measures. The Simple Average Tariff indicates a 3.6 percentage point reduction between 1997 and 2006. Although some years are missing, the trend in tariff reduction to all goods subjected to import tariffs is evident. This pattern is not observable when using the weighted-import tariff. What we see here is rather a small increase in non-agricultural goods and a substantial increase in tariffs on agricultural goods. When isolating imports with only MFN-partners, we observe the same trend. The Ukrainian import pattern, accounted for in the previous chapter, explains the fact that the Average Weighted Import tariff rate –AWITR– to all countries is lower than the AWITR to the MFN’s. All imports subjected to 0% tariff rate are included in the AWITR to all nations, giving it a much lower value. Thus, the reason for the somewhat contradictory results in terms of tariff reduction between the simple average and the average weighted indices stems from the fact that Ukraine has reorganised its trade patterns. It has over the years replaced FTA-imports from the CIS with MFN-imports from the EU. The Simple Average tariff is hence a more nuanced measure when accounting for the actual tariff reduction and tariff liberalisation that has occurred in Ukraine. When observing the NTB’s, Ukraine shows a slight increase using both types of measures. This however is not a phenomena particular to Ukraine. The global trend has been that of decreasing tariffs in favour of increased NTB’s. In fact, Ukraine is quite liberal in terms of NTB’s when compared to the OECD-average. 84
84 World Bank:2004c, p.66

28
Regarding Openness in Practice, Ukraine shows a somewhat volatile but in general significant liberalisation of its trade. Nevertheless, it should be brought in mind that these types of measures illustrate the actual trade flow - not the policy behind it. Policy makers dispose tools such as tariffs and quotas; they do not control the actual outcome of import and exports.85 When observing the trade flow, one has to account for exogenous factors such as the exchange rate, relative prices or the international business cycle in order to interpret the explanatory factors that lie behind.86 Finally, the freedom to trade index shows an increase in openness since 1996 peaking at the end of the period with the score 77.2. As this index takes into consideration tariffs as well as non-tariffs, this gives a broad view of Ukraine’s trade policy. Of particular interest is the leap taking place in 2000, illustrating the impact of Ukraine’s third phase of liberalisation. OECD shows that Ukraine’s barriers to trade are just slightly above the OECD-average.87 However, when barriers to trade and investment are taken together, the average is three times as big as in the OECD-average.88
3.4.3 Trade Flows Ukraine’s export sector has been growing massively since the beginning of the current century. In only four years, between 1999 and 2003, exports increased by nearly 100 %. This surge in exports contributed to as much as 40% of GDP-growth in this period.89 The strong growth of exports combined with a contraction of imports contributed to an improvement in the trade balance and converted it from a deficit into a surplus.90
Figure 3.8 Exports of goods and services – Percentage change
85 Rodrik:2000, p.1 86 Krugman & Obstfeld:2006, p.390 87 OECD:2007, p.124 88 OECD:2007, p.98 89 World Bank:2004b, p.2 90 World Bank:2004c, p.4
-20%
-10%
0%
10%
20%
30%
40%
50%
2000 2001 2002 2003 2004 2005 2006
Price deflators, $
Volume
Value, $
Source: OECD

29
The graph shows the growth of exports, decomposed into fluctuations of prices and volume. The green line thus indicates the total growth of exports. The increase in exports can partly be explained by high world market prices in Ukraine’s main export sectors; iron & steel and mineral products which together accounted for almost 50% of total exports in 2002. As figure 3.8 shows, the growth in exports has been positive since 2000. However, as raw materials make up for such a large share of Ukrainian exports, the performance is very dependent on fluctuations in world market prices. In fact, had not prices on export increased by around 20% in 2005 and 2006, then export growth these years would have been negative. Hence, the current export structure will not be viable to sustain continuous growth. Moreover, these products often compete in protected markets which further increase their vulnerability.91 For example, Ukrainian exports of metal to the EU were restricted by quotas until the WTO-adhesion.92
Figure 3.9 Imports of goods and services – Percentage change
Imports have also been growing, although at a slower rate which, as earlier noted, has improved Ukraine’s trade balance.
Figure 3.10 Trade Balance
91 World Bank:2004c, p.12 92 Emerson et al: 2005, p.51
-10%
-5%
0%
5%
10%
15%
20%
25%
30%
35%
2000 2001 2002 2003 2004 2005 2006
Price deflators, $
Volume
Value, $
Source: OECD
-5%
0%
5%
10%
15%
1996 1997 1998 1999 2000 2001 2002 2003 2004 2005 2006
Source: IMF

30
Figure 3.11 Commodity structure of exports
The commodity structure of exports has been relatively static since 1996. Both metals and Iron & steel have increased their share, further increasing the vulnerability of Ukraine’s economy.93 A large share of exports concentrates on natural resources and on labour intensive products. 94
Figure 3.12 Commodity structure of imports
The commodity structure of imports is equally concentrated as the one of exports. Energy import accounts for between 40 to 50% during the time period. Food products and agricultural materials have declined, both as part of total exports and total imports.95 The commodity structure of the trade with the CIS differs from that of the EU. Exports to CIS are to a larger extent manufacture goods while exports to EU are made up by raw materials. Similarly,
93 World Bank:2004c, p.11 94 Weber:2005, p.15 95 World Bank:2004c, p.12
0,0%
10,0%
20,0%
30,0%
40,0%
50,0%
60,0%
70,0%
80,0%
90,0%
100,0%
1996 1997 1998 1999 2000 2001 2002
Other
Food Products and
Agricultural Materials
Energy
Ores, minerals & metals
Iron & Steel
Manufacturing
Source: World Bank
0%
10%
20%
30%
40%
50%
60%
70%
80%
90%
100%
1996 1997 1998 1999 2000 2001 2002
Other
Food Products and
Agricultural Materials
Energy
Ores, minerals & metals
Iron & Steel
Manufacturing
Source: World Bank

31
imports from EU are mainly hi-tech goods while imports from CIS almost exclusively consist of energy.96
Figure 3.13 Share of high and medium technology in manufacturing exports to OECD-countries
The geographical structure of Ukraine’s exports has experienced more fundamental shifts. The dependence on CIS-countries and foremost Russia has declined. In 1996, Ukraine’s export to these was around 50% and in 2002, the share was less than 30%. This decline has to a large extent been replaced by trade with the EU- amounting to 33%- and to some extent by exports to Asia.97 An export specialization index is often used to evaluate the product in which a country specialises in. An OECD-analysis reveals that Ukraine only has comparative advantages in 14 out of 94 product groups, further illustrating the concentration of the Ukrainian export sector. Iron and steel is by far the product group revealing strongest comparative advantages in the period between 1996 and 2006. Other Revealed Comparative Advantages (RCA)98 are to be found in sectors producing cereals, vegetable fats and cork and wood. In the machine-building industry, Ukraine enjoys RCA in the production of railway vehicles and equipments.99 It is important to point out however, that most of the sectors in which Ukraine has RCA’s are very energy intensive. These sectors have comparative advantage largely due to extremely low gas prices that Ukraine has enjoyed via imports from Russia. The gas imports have been substantially subsidised by the Russian state, and thus the prices should be seen as rather artificial.100 This misleading pricing of energy reveals that Ukraine in fact has false competitive advantages for energy intensive sectors.101 In addition, the gas “discounts” by Russia, have gradually diminished and will probably cease to exist in the nearest future. 102
96 World Band 2004c, p.17 97 World Band 2004c, p.13 98 See Appendix 2 for explanation 99 OECD:2007, p.108 100 OECD:2007, p.106 101 OECD:2007, p.122 102 OECD:2007, p.29
2% 16% 62% 20%
High-technology Medium-high technology Medium-low technology Low technology
Source: OECD

32
3.5 Economic Growth When going through the GDP growth numbers of Ukraine during the 90s, the label “lost decade” seems to be highly justifiable.
Figure 3.14 Yearly Real GDP-growth
The political and economic turmoil during the 90s is observed in the country’s growth figures. Between 1996 and 1999 the yearly average growth was -3.8 % and the turning point came 1999, when Ukraine started showing positive growth rates. Until 1999, Ukraine was the only ex-soviet country that had not achieved a single year of positive growth since the independence. What were the reasons behind the sudden turn in growth in 2000? From this year until 2007, Ukraine had an average yearly growth of 7.5 %. Growth accounting is a difficult task, and different qualitative approaches exist in the case of post communist transition economies. Stiglitz for example argue that the reason behind large output declines of post-Soviet countries after independence was reforms being too radical, and thus criticises the Washington consensus.103 Åslund, on the other hand argues that the reason for the economic decline was the opposite, too little and too slow reform – indicating that the 90’s was characterised by arbitrary state intervention, unorthodox privileges for oligarchs made possible by legal regulations, subsidies to oligarchs and their business sectors and a great lack of liberalisation of supply.104 What explains the turning point according to him is rather new liberal economic policy reforms initiated by the new government, involving a cleanup of the corruption.105 Other argue that the growth has primarily been driven by external factors such as depreciation, low wage costs, macroeconomic stabilization and excess economic capacity. The World Bank emphasises all these factors as being important and explanatory for the
103 Stiglitz:1999, p.156-160 104 Åslund:2002, p. 5 105 Åslund:2002, p.16
-15%
-10%
-5%
0%
5%
10%
15%
1996 1997 1998 1999 2000 2001 2002 2003 2004 2005 2006
Source: IMF
33
recent growth and highlights stabilization, financial discipline, allocation of state resources and agricultural reform as also important 106 In the aftermath of the Russian financial crisis in 1998 which also affected Ukraine, three important factors for the growth increase are highlighted by the World Bank:
• Depreciation of the Ukrainian currency towards the dollar the Euro and the Rubel • Increasing world market prices • External financial constraints on government and business
The real depreciation that occurred in 1999 gave an upswing to the Ukrainian exports to the CIS, the US and the EU. Furthermore, in 2000 when the world awoke from the economic slumber spurred by the Asian and Russian crisis, world market prices on metals rose impacting positively on Ukrainian trade. Finally, the large foreign debt resulted in tensed relation to foreign lenders - Ukraine finally started fighting its deficit with tighter financial constraints and political resolve instead of borrowing out of the problems as it had done before.107 Even though exports have played a major role in the economic growth, domestic demand is what has been the primary engine of growth since 2001.108 From this year, household consumption increased largely due to fast increases in wages and an increase in employment.109 In a regional World Bank report on Eastern Europe and the former Soviet Union, Middle income CIS (Ukraine, Belarus, Kazakhstan, Russia, Armenia, Kyrgyz Republic and Moldova) showed an average elasticity of poverty to growth in consumption per capita between 1998-2003 to be -3.1. This means that a one percent increase in growth led to a 3.1 percent decrease in poverty. However, these are cross-country means and should rather be treated as indicatives than representative of real values.110 Using the Cobb-Douglas function to illustrate Ukraine’s relationship of aggregated outputs and inputs we get the following graph.
106 World Bank:2004, p.1-2 107 World Bank:2004, p.3-4 108 World Bank:2004, p.7 109 OECD:2007, p.9 110 World Bank:2005a, p.83
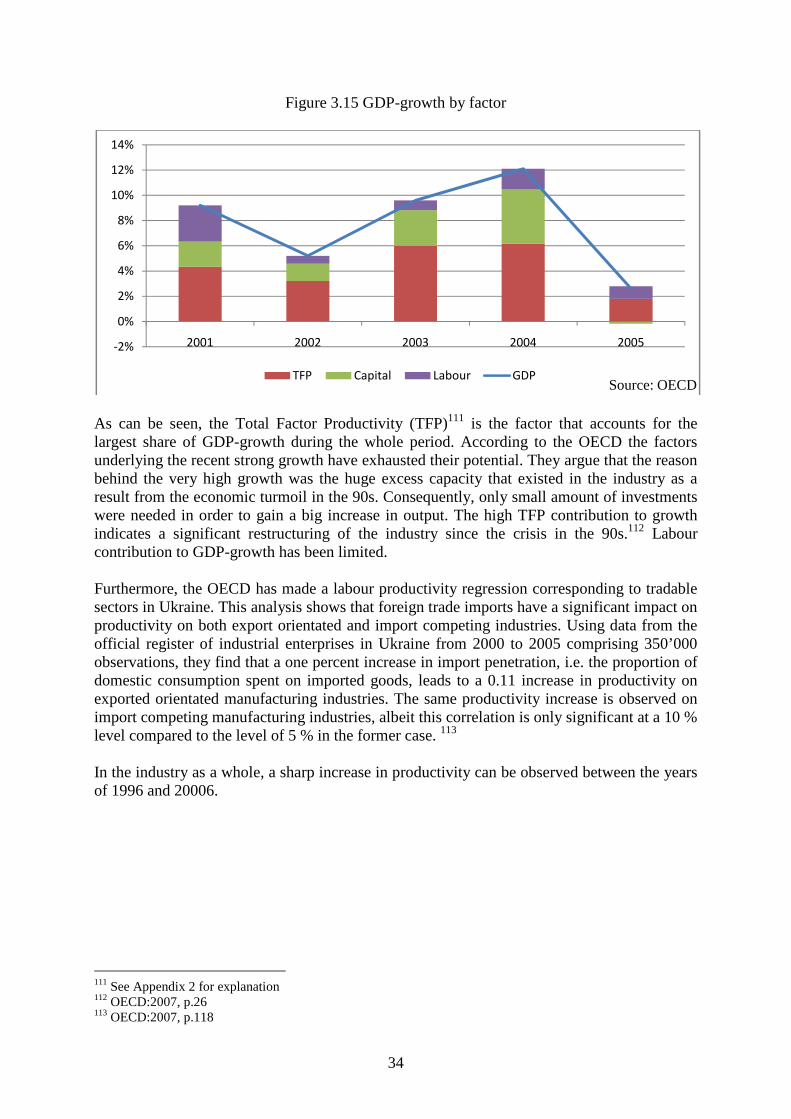
34
Figure 3.15 GDP-growth by factor
As can be seen, the Total Factor Productivity (TFP)111 is the factor that accounts for the largest share of GDP-growth during the whole period. According to the OECD the factors underlying the recent strong growth have exhausted their potential. They argue that the reason behind the very high growth was the huge excess capacity that existed in the industry as a result from the economic turmoil in the 90s. Consequently, only small amount of investments were needed in order to gain a big increase in output. The high TFP contribution to growth indicates a significant restructuring of the industry since the crisis in the 90s.112 Labour contribution to GDP-growth has been limited. Furthermore, the OECD has made a labour productivity regression corresponding to tradable sectors in Ukraine. This analysis shows that foreign trade imports have a significant impact on productivity on both export orientated and import competing industries. Using data from the official register of industrial enterprises in Ukraine from 2000 to 2005 comprising 350’000 observations, they find that a one percent increase in import penetration, i.e. the proportion of domestic consumption spent on imported goods, leads to a 0.11 increase in productivity on exported orientated manufacturing industries. The same productivity increase is observed on import competing manufacturing industries, albeit this correlation is only significant at a 10 % level compared to the level of 5 % in the former case. 113 In the industry as a whole, a sharp increase in productivity can be observed between the years of 1996 and 20006.
111 See Appendix 2 for explanation 112 OECD:2007, p.26 113 OECD:2007, p.118
-2%
0%
2%
4%
6%
8%
10%
12%
14%
2001 2002 2003 2004 2005
TFP Capital Labour GDPSource: OECD

35
Figure 3.16 Composition of Industrial Productivity Growth – Annual Percentage Change
As the diagram shows, the yearly productivity increase until 2001 is largely due to a decrease in labour. Consequently, when employment remains more or less constant between 2004 and 2006 - productivity decreases.
3.6 Prices After its independence, Ukraine faced high inflation rates during some years. As shown by figure 3.1, this situation has now been put under control and inflation rates are now, although still high compared to more advanced economies, at more moderate levels. As outlined in the theoretical chapter, one of the advantages of international trade is the possibility to replace expensive products produced domestically with imports produced at a lower price. Cheaper products will then be made available to consumers who, in turn will be made better off. To derive the trade’s impact on inflation rates is however difficult as many other factors such as the exchange rate and the utilization rate influence as well. Moreover, food and agriculture products are excluded from trade agreements and tariffs on these products are generally higher than on industrial products. This implies that the agricultural sector is not as well integrated into the world trade as other sectors of the economy.114 Agriculture made up less than 10% of Ukraine’s imports in 2003.115 However, given that this product group make up the basis for the poverty line, it is of great importance to evaluate the impacts trade has on its prices.116 An attempt will be made to illustrate the evolution of the price level of agricultural products relative to the consumer price index in order to understand how price levels have affected the poor in Ukraine.
114 Shumylo:2007, p. 62 115 World Bank:2004c, p.187 116 World Bank Report:2005b, p. 3
-10%
-5%
0%
5%
10%
15%
20%
25%
1996 1997 1998 1999 2000 2001 2002 2003 2004 2005 2006
Employment Production Productivity Source: OECD

36
Figure 3.17 Consumer Price Index
The diagram shows that, in general, food prices have increased at a slightly higher rate than the Consumer Price Index (CPI), which could have been extra burdensome to the poor as food makes up a larger part of their consumer basket than the average Ukrainian. Even so, the difference has not been great and should therefore not have had any major distributional effects. Another aspect of trade’s supposedly effects on prices, and in turn poverty, is the extent to which market prices are distorted by inefficient and costly distributional channels. Even if tariffs were lowered, this would not certainly mean that the reduction of prices will be transmitted into lower prices at the local markets. The Logistics Performance Index can be used to evaluate the efficiency of the distributional channels. On the overall index, Ukraine’s score is 2.55 which indicate that trading across border still is a problem. The score is however comparable with other lower middle income countries and about one point lower than the EU. For the purpose of examining distribution channels, maybe the most important and interesting subcategory of this index is the cost of domestic transport. Ukraine’s score is quite high compared to other countries and even higher than that of the EU. This implies that there are no large obstacles for cheap imports to be transformed into lower prices at the local markets.117 The price transmission would occur in the same way if prices on domestic markets were to increase due to Ukrainian producers exporting to foreign markets, which could imply higher prices on national markets.
3.7 Employment and Wages
3.7.1 Employment The labour market in Ukraine can be divided into two periods. Between 1996 and 1999 it was characterised by declines in the employment rate and increases in the unemployment rate. 117 World Bank Homepage:2009a
90
95
100
105
110
115
120
125
130
135
140
2001 2002 2003 2004 2005 2006
Consumer price index Food Housing, water, electricity & gas
Source: SSC

37
Figure 3.18 Employment, Participation and Unemployment rates
The labour force participation rate increased slightly in 1997 and 1998 but then experienced a dramatic drop from 70% to 60%.118 The slight increase in the participation rate can partly be explained by the emigration that took place in the nineties. It is estimated that around 140’000 Ukrainians annually left the country.119 From 2000 and on, the labour market started to show some, albeit modest, signs of progress. The unemployment rate fell from its highest peak of 11.6% in 2000 to 6.8% in 2006.120 Although employment has decreased, important sectorial shifts have taken place in the Ukrainian labour market. The two graphs presented below show the respectively growth rate of four sectors and their relative share of the total labour force.
118 World Bank, 2005b p. xii 119 World Bank, 2005b p.16 120 World Bank, 2005b p. xii
64%
54%
57%
5,8%
68%
60%
61%
7,6%
11,6%
9,1%
6,8%
4%
5%
6%
7%
8%
9%
10%
11%
12%
50%
55%
60%
65%
70%
75%
1996 1997 1998 1999 2000 2001 2002 2003 2004 2005 2006
Employment rate (Left axis) Participation rate (Left axis)
Unemployement rates (Right axis)Source: World Bank & ILO

38
Figure 3.19 Growth of employment
Some features are of particular interest. First, agriculture employment has witnessed a decline during the whole time period, implying that around 700’000 persons have been laid off from the sector. Employment in mining and manufacturing has also declined throughout the period, although at a lower rate than agriculture. The only sectors that have had positive growth throughout the period is wholesale, retail and hotel, which means that little more than one million people have been employed in these sectors.
Figure 3.20 Employment as a share of Total Employment
Although the agricultural & fishing sector has experienced negative growth, the sector still employs 16% of the labour force and is also the sector with the largest share of poor people.121 Other important sectors for poor are construction and commerce. At the labour
121 World Bank, 2005b p.22
-10%
-8%
-6%
-4%
-2%
0%
2%
4%
6%
8%
10%
2002 2003 2004 2005 2006 2007
Construction
Wholesail, Retail and Hotel
Total Employment
Mining and Manufacturing
Agriculture & Fishing
Source: ILO
0%
20%
40%
60%
80%
100%
2001 2002 2003 2004 2005 2006 2007
Wholesale, Retail & Hotel
Construction
Mining & manufaturing
Agriculture & Fishing
Skilled sectors
Source: ILO

39
market as a whole, it is foremost the wholesale, retail and hotel sectors that have increased their share. The skilled sectors constitute all other sectors that typically do not employ poor people.122 In its household budget survey, the World Bank studies different labour participation rates according to the individual’s economic situation and geographically location. Labour force participation of the poor has been situated on a slightly lower level compared to the overall labour force participation rate.123
3.7.2 Dynamics in the labour market Although employment rates have remained constant and only a slight decline in unemployment rates has been registered, the labour market has become increasingly dynamic. Job destruction124 understandably dominated during the years of recession but job creation has increased since 1999 when the economy began to show signs of recovery. These rates have remained more or less equal and as a consequence, the employment rate has only increased slightly, as shown by figure 3.18. However, low productivity jobs have been replaced by high productivity jobs, contributing to wage increases. The metal industry is one of the few sectors that have experienced net growth. Other sectors such as electric machinery and textiles on the other hand, have witnessed negative net employment growth.125 In a study aimed at relating trade liberalization to employment in the manufacturing sector, Christev, Kupets and Lehmann use an index of actual trade as a measure of trade liberalisation to determine whether trade liberalisation has had an impact on employment growth.126 The study spans from 1993 to 2000 and hence covers some years not considered in this study. The relationship follows geographical patterns as firms trading with the EU show higher rates of job creation and lower rates of job destruction. Firms trading with CIS countries destroy fewer jobs but have no increased job creation.127
122 Several sectors such as public administration, financial intermediation and communication have been included in the skilled sector. The categorisation has been done by the authors. 123 World Bank, 2005b p.21 124 See Appendix 2 for explanation 125 World Bank, 2005b p.26 126 Christev, Kupets and Lehmann, 2005 p. 8 127 Konings, Kupets and Lehmann: 2003, p.27

40
3.7.3 Wages
Figure 3.21 Real wages & labour productivity
As mentioned in the economic growth chapter, the motor behind Ukraine’s recent growth has been domestic demand and private consumption. Real wages in Ukraine have seen a strong growth. During the entire period – real wages increased by an impressive 184%. The yearly growth since 2000 has been around 20%. Figure 3.21 indicates that the large parts of the growth in real wages can be explained by the fact that real wages were lagging the labour productivity growth in the end of the 90’s. Thus, wage increases can be seen as a “catching-up”-phenomenon. Since 1999, real wages have been increasing at a higher rate than labour productivity – surpassing it in 2004. In order to see if some sectors have benefited more than others, we divide nominal wages into sectors and compare sectorial wages with the average wage over time.
0
50
100
150
200
250
300
1997 1998 1999 2000 2001 2002 2003 2004 2005 2006
Labour productivity Real wages
Index 1997=100
Source: OECD

41
Figure 3.22 Wages as a Percentage of Average Wages – by Sector
Wages in agriculture and fishing is roughly half of the average wage during the whole period, which is a significantly smaller part. On the other hand, increases in wages have benefited this sector only slightly less than the average wage, reaching the bottom in 2003 when wages in this sectors only made up only 48% of the average. The largest reallocation of wage distribution has occurred in the mining and quarrying sector. Even though this sector has high wages compared to the average, it has seen a sharp drop from 175 % to 146% over the entire period. With exception of this sector, the shares have not changed much when comparing the first and last year even though they are somewhat volatile over time.
0%
20%
40%
60%
80%
100%
120%
140%
160%
180%
200%
1998 1999 2000 2001 2002 2003 2004 2005 2006 2007
C: Mining and Quarrying F: Construction
D: Manufacturing G: Wholesale and Retail Trade
H: Hotels and Restaurants Agriculture & Fishing
Source: ILO

42
4. Analysis To be able to assess how trade liberalization and international trade have affected poverty in Ukraine, it is necessary to depict and fully comprehend the channels by which trade policy affects the poor. There is however no direct link between these two but rather a complex system in which numerous factors interlink to produce the outcome of the economy, which in no way should be regarded as static. At their disposal, policy makers have various measures to put in practice in order to control the trade flows. Given the desire of Ukraine to integrate further in the world trade, Ukraine has pursued a policy to facilitate trade and reap the benefits of its outcome.
4.1 Linking trade policy with trade Since independence, Ukraine has substantially transformed its trade policy. The difference between being an integrated part of the Soviet Union, isolated from outside international trade and being an acknowledged market economy is substantial. Nevertheless, Ukraine has succeeded in changing into a system of market economy, successively liberalising both its domestic institution as well as its trade regime in less than fifteen years. The openness to trade indices acknowledges the fact that Ukraine has liberalised its trade both in terms of policy and practice. The freedom to trade index and the measures of openness in practice, such as the real growth of trade, seem to covariate - especially between 1999 and 2000 when liberalisation took its most prominent steps. Naturally, to argue that all of Ukraine’s increased trade is due to changes in the trade regime would be unreasonable. Nevertheless, our indicators support the fact that liberalisation has been a contributory factor.
4.2 The Three Channels of Trade
4.2.1 Trade and economic growth To evaluate the growth of the economy, one can do so by examining either the expenditure side of growth or illustrating it by the use of the production factors, as done in figure 3.15. From the expenditure side, only export is a contributory cause to GDP. The trade balance was negative between 1996 and 1999, and turned over to a surplus in 2000. The trade surplus between 2000 and 2004 might have had effects on the demand for labour in exporting industries in Ukraine. Figure 3.8 illustrate that growth in exports has not only been driven by fluctuations in prices – the volume of exports has accounted for at least half of the growth. World market prices on raw materials mainly explain the share of price accounting for the total value of exports and contribute for half of the growth of exports from 2003 and on. High world market prices probably had some small effects on the volume, although much smaller than on prices. The other half however can be explained by two probable causes. The first one is the depreciation of the Ukrainian currency in 1999, which induced a higher volume of the exports – as Ukrainian goods turned relatively cheaper for foreign countries. This had little or no effects on prices. Secondly, albeit less quantifiable, is Ukraine’s trade liberalisation – which took a great leap in 1999. Although difficult to determine, increased competition and new

43
technology has most probably affected the productivity of the Ukrainian export sector – boosting its output to the world markets. Using production factors as determinants to the GDP-growth, the same connection can be made regarding total factor productivity. Figure 3.15, show that increases in productivity has accounted for 50% or more of the growth between 2001 and 2005. Labour, and with it employment, represents only a small fraction of total growth. Can the increase in exports be linked to any increase in demand for labour in these sectors? This somewhat complicated issue will be further elaborated in section 4.2.3. However, even though exports increased dramatically 2003 and 2004 by 24% and 43% respectively, total employment rates remained constant. The figures rather point in the opposite direction when examining employment rates in Ukraine's most important exports sectors - indicating a decrease in employment that covaries with the increase in exports. In addition, the GDP by factor graph supports the fact that increased employment has contributed to GDP-growth to a very small extent. What are the reasons behind the TFP then - accounting for such a large share of growth? Deriving the reasons for shifts in labour and capital might be done more directly, TFP however is determined by more abstract conditions. Human capital, technology, increased competition and efficient management are factors often quoted as determinative for the TFP. Suggesting that increased competition made possible due to trade liberalisations, with foreign competitors producing some goods more efficiently than Ukrainian domestic enterprises, accounts for parts of the TFP seems highly plausible. The same goes for human capital advancements as the trade enables share of thoughts, innovation and competence across the border. A more concrete liason can be made regarding technology. When Ukraine entered into the PCA-agreement and adopted the MFN-principle, high-technology goods from the EU were made cheaper. In fact, Ukraines largest import share from the EU consists of high-tech goods - a trade that probably has increased the productivity of Ukrainian industries. In this occurrence, the EU evidently has comparative advantages towards Russia and the CIS - inducing the shift of the Ukrainian trade pattern accounted for earlier in the thesis. Moreover, the OECD-regression mentioned in chapter 3.6 points out that the course of events goes in the same direction. Although it would be bravely to suggest that Ukraine's increased imports have all contributed equally to the productivity in competing export related domestic industries - the general pattern supports the idea that trade has induced productivity improvements in Ukraine. Another factor most probably contributing to the TFP growth and to some extent also driven by trade liberalisation is the domestic institutional change in Ukraine, induced principally by EU and WTO. Reducing the role of corruption, state subsidies, interventions and monopolies that distort and undermines the efficiency of markets has probably made equally important contributions to TFP and economic growth in Ukraine. As accounted for in chapter 3.1, studies have shown that long term effects of economic growth implies that a 1% increase in income leads to a 1% increase in income of the poorest. Hence - a sustainable economic growth most surely is the key to poverty alleviation in the long-run. Even though the growth in Ukraine has recently been very high, its fluctuations cast some shadows of doubt of its sustainability.
44
4.2.2 Trade and prices The revealed comparative advantages in Ukraine are steel & iron, cereals, vegetable fats and cork & wood. Neither of these commodities are represented in a consumer basket developed for poor.128 Thus, eventual price changes on these due to increase in exports would have no effect on poor. Yet, Ukrainian agriculture export amounts to 10% of total exports – could trade in this sector have affected the prices? The theoretical framework highlights a possible positive impact on poverty if cheaper imports of goods belonging to the consumption basket are made possible due to trade liberalization. We have shown that tariffs on agricultural products in Ukraine have increased during our time of study. This suggests that cheaper imports of agricultural products have probably not reached the country. In addition, the inflation rate of agricultural products has more or less been equal to CPI. The small relative increase observed in figure 3.17 in 2003 and 2004 could be explained by the large fall of people living under the poverty line. Real wages increased by around 20% these years and this could have increased the demand for food as people recently lifted out of poverty increased their food consumption. In general however, trade liberalisation has not been viable in this sector thus ruling out the possibility of price changes in agriculture due to trade. The outcome of an eventual future mutual trade liberalisation in the agriculture sector between Ukraine and its trading partners is however uncertain. Price levels in Ukraine are likely to be lower than in other markets, of two reasons: low wages of labour and extremely fertile soil. A trade liberalisation would then benefit net-producers of agricultural goods but discourage net-consumers. Whether poor belong to the former or latter group is determined by the source of income. As shown by figure 3.4 more than 20% of poor household's income stems from home production, although the rate has declined over the years. If prices were to increase due to a trade liberalisation, the value of home production would then most probably increase and make these households better off. However, a rise in agricultural prices would have a negative effect on net-consumers. As food make up a large part of the consumption basket for poor people, a price rise would be extremely harmful to the poor. In this case, the total effect by price increases would as a whole make poor worse off. Amongst poor, 4/5ths are not home producers and would not benefit from prices increase in agricultural products. However, we know that poor are over-represented in the agricultural sector and that wages is the most important source of income to the poor. Hence, if prices on agricultural products were to rise, workers in this sector could profit by increases in wages or the sector might increase its demand for labour. These effects are however uncertain - and in total, despite this counterbalancing factor, the poor as a whole would be worse off. Moreover, as Ukraine's domestic transportation costs are low - price changes due to import and exports would easily be transmitted to local markets. No thorough examination has been done in this thesis on domestic distribution channels - and we thus rely on the domestic transportation cost index accounted for in chapter 3.6 for our conclusions. Another imported good that has a considerable impact on poor is electricity. As noted in chapter 3.3, the non food consumption that makes up 30% of the consumption basket might be attributed to electricity, gas and housing. Electricity accounts for around 45% of Ukraine's
128 In fact, vegetable oil make up for 1.3% of the consumption basket developed by the World Bank, but is considered to be neglectable. See World Bank:2005b, p.3

45
imports, and imported gas from Russia represented the largest share of electricity until 2003. After this, oil exceeded gas and became the largest share of electricity.129 Liberalisation in the gas sector is however non-existing. Gas prices are negotiated by Russia and Ukraine at state level and are thus not influenced by market powers. The inflation on the commodity group "housing, water, electricity, gas and other fuels" in figure 3.17 co-varies more or less with the CPI during the period except for 2006. This last increase was largely due to Russian demands on Ukraine to pay world market prices on their gas, which earlier and despite Russian demands continues to be subsidised by Russia. In general then, this has had little effect on poor. However, should Ukraine be submitted to pay world market prices on its gas imports from Russia - the impact on poor would be considerable. The stroke would also be hard for the majority of Ukrainian industries, having an extremely energy intensive structure. False comparative advantages based on low prices for energy inputs would then be revealed and incur negative effects on the economy as whole and most surely on the labour market. In this particular occurrence, trade liberalisation, i.e. the removal of the price distorting measures of subsidies, would most certainly have negative impacts on poor.
4.2.3 Trade and the labour market As derived from figure 3.18, the employment rate was, with exception from the steep fall in 1999, relatively constant. In the earlier section, 4.2.1, the question was raised whether the increase in exports had resulted in an increase in demand for labour. The SSC has measured the demand for labour by economic activities since 2002, and reveals that an increase in demand for industrial labour actually did occur during these years.130 The reason then that employment in these sectors decreased is the dynamics of the labour market. Even though new jobs were created, old ones were destroyed at a higher rate. Taking into account that total employment has been constant since 2000, there is reason to believe that Ukraine's export growth has not affected the rate of employment in the country at all. To conclude however that trade liberalisation has had no or low impact on the labour market would be erroneous. We know that employment has decreased in low-productive sectors and been replaced by jobs created in high-productive sectors. There seems to be a reallocation in the labour markets that explains for a big part of the increased productivity in Ukraine during these years. What has driven this reallocation and these productivity gains resulting in the dynamics of the labour market? One plausible reason is that increased imports have tightened competition in Ukraine. For instance, the manufacturing sector has increased its share of total imports and this has probably driven less efficient domestic firms out of business, reducing employment as a consequence. Although static on an aggregated level, important sectorial shifts have taken place indicating that the dynamics in the labour market have increased. Job destruction rate has been around 9% between 1998 and 2001 but in the last two years, the job creation rate has increased, indicating a positive trend. To conclude, the overall trend has been that increased competition and high-tech import goods has led to productivity gains. These have expressed themselves as increases in real wages, as showed in figure 3.21. The fact that poor are over-represented in the agricultural sector and that labour force participation rates has declined among the poorest part of the
129 World Bank:2004c, p.184 130 See Appendix 3 for explanation

46
population suggests negative effects on poverty. On the other hand, we know that wages as a source of income has had a slight increase during our time of study, indicating that poor at least to some extent have been able to take advantage of new job opportunities being created. This statement is also supported by the decline in unemployment rates by as much as 4.4% between 1999 and 2005.
4.3 The outcome on poverty rates in Ukraine The consumption basket of 151.1 UAH developed by the World Bank as poverty line, adjusted for inflation, makes a comparison between the development of wages and poverty rates possible.131 The average wages are during the whole time period significantly above the poverty line. Agriculture & fishing is the only sector in which averages wages fall below the poverty line – this occurs in 2002. However, between 1998 and 2001, average wage in this sector lie very close to the poverty line. From then and on, wages boost significantly – following the pattern of the total average wage increase. Since then, real wages have grown at an annual rate of 20%, firmly contributing to the reduction of the headcount index, as we observed in figure 3.2. The strong effect on the headcount index is explained by the fact that the largest part of poor people actually are employed, as figure 3.3 shows.
131 See Appendix 3 for explanation

47
5. Conclusions We have shown that the trade liberalisation initiated by Ukraine, especially since the end of the 90’s, has contributed to growth in exports and imports – integrating Ukraine with the world economy. Many of the theoretical gains of international trade seem to have been realised in Ukraine, perhaps mostly in terms of large productivity gains. The effects have trickled down to poor people with a net-positive impact on the reduction of poverty via the three channels. Growth, despite its volatility, has during our time period of study reached impressive rates. Prices have developed without any major disparities amongst product groups especially sensitive for poor. The dynamics of the labour market –spurred by gains from international trade- has contributed to positive reallocations of employment. Finally, large real increases in wages, made possible by productivity gains, have perhaps most of all contributed to the strong reduction of poverty in the country.

48
List of References
Books Frank H.Robert, Microeconomics & Behaviour, 6th edition, McGraw-Hill, 2005 Gilbert, Geoffrey, World Poverty, Contemporary World Issues, 2004 Krugman Paul & Obstfeld, International Economics – Theory & Policy, 7th edition, Pearson International Edition, 2006 McCulloch, Neil, Winters, L Alan & Cirera, Xavier, Trade Liberalization and Poverty: A Handbook, Centre for Economic Policy Research Stiglitz E. Joseph & Chartlon Andrew, Fair Trade for All – How Trade Can Promote Development, , Oxford University Press, 2005
Organisations State Statistics Committee of Ukraine <http://www.ukrstat.gov.ua/> World Bank Press release No: 2009/065/DEC <http://web.worldbank.org/WBSITE/EXTERNAL/NEWS/0,,contentMDK:21881954~pagePK:64257043~piPK:437376~theSitePK:4607,00.html> World Bank, World Trade Indicator User Guide, 2008 <http://info.worldbank.org/etools/wti2008/docs/userguide.pdf> World Bank Homepage, World Trade Indicators, 2009a <http://web.worldbank.org/WBSITE/EXTERNAL/TOPICS/TRADE/0,,contentMDK:21393040~pagePK:210058~piPK:210062~theSitePK:239071,00.html> World Bank Homepage, Understanding Poverty, 2009b <http://go.worldbank.org/K7LWQUT9L0> UNDP, Origin of the Human Development Approach, 2009 <http://hdr.undp.org/en/humandev/origins/> WTO Homepage, Ukraine’s Accession to the WTO, 2005, Retrieved 28 May 2009 from: <http://www.worldbank.org/html/prddr/trans/July_September_2005/Ukraines_Accession_to_the_WTO.htm> WTO Homepage, Ukraine Trade Profile, April 2009, Retrieved 17 May 2009 from: <http://stat.wto.org/CountryProfile/WSDBCountryPFView.aspx?Language=E&Country=UA>

49
Reports Azizur Rahman Khan, Issues in Employment and Poverty, ILO, 2001 OECD, OECD Economic Surveys – Ukraine Economic Assessment Volume 2007/16, September 2007 The World Bank, Ukraine – Building Foundations for Sustainable Growth – A Country Economic Memorandum, Report no. 30928-UA, December 27, 2004a The World Bank, Ukraine Trade Policy (vol. 1), 2004b The World Bank, Ukraine Trade Policy (vol. 2), 2004c The World Bank, Growth, Poverty and Inequality – Eastern Europe and the Former Soviet Union, 2005a The World Bank, Ukraine: Poverty Assessment – Poverty and Inequality in a Growing Economy, 2005b
Scientific articles Carlsson, Fredrik & Lundström, Susanna Economic freedom and growth: Decomposing the effects, Public Choice, no. 112, p.342, 2002 Dollar, David & Kraay, Aart, Growth is Good for the Poor, Journal of Economic Growth, no. 7, 2002 Emerson Michael et al, The Prospect of Deep Free Trade Between the European Untion and Ukraine, Centre for European Policy Studies, 2005 Flyvbjerg Bent, Five Misunderstandings About Case-Study Research, Qualitative Inquiry, vol.12, nr.2, 2006 Hertel W.Thomas & Reimer J.Jeffrey, Predicting the Poverty Imnpacts of Trade Reform, Journal of International Trade & Economic Development, no.4, December 2005 Konings, J., O. Kupets and H. Lehmann. 2003, Gross Job Flows in Ukraine: Size, Ownership and Trade Effects, The William Davidson Institue, 2003 McCulloch, Neil, The Impact of Trade Liberalisation on Poverty, 2005 Rodrik, Dani, Comments on “Trade, Growth and Poverty,” by D. Dollar and A. Kraay, Shumylo Olha et al, Free Trade between Ukraine and the EU: An Impact Assesment, International Centre for Policy Studies, 2007 Stiglitz, Joseph Whither Reform? – Ten Years of the Transition, Paper presented at the Annual Bank Conference on Development Economics, Washington DC, April 1999
50
Weber, Schlomo, Ukraine, The Enlargement of the European Union and Consequences for Higher Education, 2005 Williamson, John, A Short History of the Washington Consensus, Institute for International Economics , 2004 Winters, McCulloch and Mckay, Trade Liberalisation and Poverty: The evidence so far, Journal of Economic Literature Vol. XLII, 2004 Åslund, Anders Why Has Ukraine Returned to Economic Growth?, Institute for Economic Research and Policy Consulting, July 2002
Newspapers & Media Radio Free Europe/Radio Liberty, EU Grants Ukraine ‘Market Economy’ Status, December 2005, retrieved May 2008 from <http://www.rferl.org/content/Article/1063412.html> Radio Free Europe/Radio Liberty, U.S. Grants Ukraine Market-Economy Status, 17 February 2006, retrieved May 2008 from <http://www.rferl.org/content/Article/1065884.html> WTO Press Release, WTO Welcomes Ukraine as a new member, Press/511, 5 February 2008
Treaties Agreement on Trade Relations between the United States and Ukraine, 6 May 1992 < http://tcc.export.gov/Trade_Agreements/All_Trade_Agreements/exp_005485.asp>
Other Encyclopædia Britannica Online, ”Ukraine”, 23 Apr. 2009a <http://search.eb.com/eb/article-9108710> Encyclopædia Britannica Online, ”Ukraine”, 23 Apr. 2009b <http://search.eb.com/eb/article-30104> Encyclopædia Britannica Online, ”World Bank”, 12 May 2009c <http://search.eb.com/eb/article-9042574> Encyclopædia Britannica Online, ”World Bank”, 12 May 2009d Suranovic M., Steven, International Trade Theory and Policy, 2006 < http://internationalecon.com/Trade/Tch20/T20-1.php> The Heritage Foundation, Freedom to Trade Index – Ukraine, 2009a <http://www.heritage.org/index/Default.aspx> The Heritage Foundation, Methodology for the 10 Economic Freedoms, 2009b <http://www.heritage.org/Index/PDF/Index09_Methodology.pdf> Utrikespolitiska Institutet - Landguiden, Ukraina – Jordbruk och fiske, 2009

51
Statistics Figure 3.1: Inflation, average consumer prices, IMF World Economic Outlook Database, April 2009 <http://www.imf.org/external/ns/cs.aspx?id=28> Figure 3.2: Headcount Index – Poverty Line UAH 4.97/day, World Bank, Ukraine: A Poverty Assessment – Poverty and Inequality in a Growing Economy, December 2005, p. 5 Figure 3.2: Headcount Index – Poverty Line UAH 4.97/day, World Bank, Ukraine. Poverty Update, June 2007, p.1 Figure 3.3: Labour Status of Poor, World Bank, Ukraine: A Poverty Assessment – Poverty and Inequality in a Growing Economy, December 2005, p. 13 Figure 3.4: Poor Household Income Structure, World Bank, Ukraine: A Poverty Assessment – Poverty and Inequality in a Growing Economy, December 2005, p. 64 Figure 3.5: Headcount Index – Poverty Line $2.15/day, calculated with World Bank database PovcalNet, <http://iresearch.worldbank.org/PovcalNet/povcalSvy.html> Figure 3.6: Headcount Index – Poverty Line $4.3/day, calculated with World Bank database PovcalNet, <http://iresearch.worldbank.org/PovcalNet/povcalSvy.html> Figure 3.7: Headcount Index – Official Ukrainian Subsistence minimum, State Statistics Committee of Ukraine, <http://www.ukrstat.gov.ua/> Figure 3.8: Exports of Goods and Services – Percentage Change, OECD Economic Surveys – Ukraine Economic Assessment Volume 2007/16, p. 23 or statlink: <http://dx.doi.org/10.1787/072245550763> Figure 3.9: Imports of Goods and Services – Percentage Change, OECD Economic Surveys – Ukraine Economic Assessment Volume 2007/16, p. 23 or statlink: <http://dx.doi.org/10.1787/072245550763> Figure 3.10: Trade Balance, IMF World Economic Outlook Database, April 2009 <http://www.imf.org/external/ns/cs.aspx?id=28> Figure 3.11: Commodity structure of exports, World Bank, Ukraine Trade Policy, November 2004, p.11 Figure 3.12: Commodity structure of imports, World Bank, Ukraine Trade Policy, November 2004, p.12
52
Figure 3.13: Share of High and medium high technology in manufacturing exports to OECD-countries, OECD Economic Surveys – Ukraine Economic Assessment Volume 2007/16, p. 115 or statlink: <http://dx.doi.org/10.1787/072808468601> Figure 3.14: Yearly Real GDP Growth, IMF World Economic Outlook Database, April 2009 <http://www.imf.org/external/ns/cs.aspx?id=28> Figure 3.15: GDP-Growth by Factor, OECD Economic Surveys – Ukraine Economic Assessment Volume 2007/16, p. 26 or statlink: <http://dx.doi.org/10.1787/072323203050> Figure 3.16: Composition of Industrial Productivity Growth – Annual Percentage Change, OECD Economic Surveys – Ukraine Economic Assessment Volume 2007/16, p. 51 or statlink: <http://dx.doi.org/10.1787/072770872761> Figure 3.17: Consumer Price Index, State Statistics Committee of Ukraine, <http://www.ukrstat.gov.ua/> Figure 3.18: Employment, Participation and Unemployment rates, World Bank, Ukraine: A Poverty Assessment – Poverty and Inequality in a Growing Economy, December 2005, p.16 and the International Labour Organization database, Laborista: <http://laborsta.ilo.org/> Figure 3.19: Growth of Employment, The International Labour Organization database, Laborista: <http://laborsta.ilo.org/> Figure 3.20: Employment as a Share of Total Employment, The International Labour Organization database, Laborista: <http://laborsta.ilo.org/> Figure 3.21: Real Wages and Labour Productivity, OECD Economic Surveys – Ukraine Economic Assessment Volume 2007/16, p. 21 or statlink: <http://dx.doi.org/10.1787/072231581807> Figure 3.22: Wages as a Percentage of Average Wages – by Sector, The International Labour Organization database Table 3.1: Yearly and Average Growth of Income by Source, Own calculations with data from: World Bank, Ukraine: A Poverty Assessment – Poverty and Inequality in a Growing Economy, December 2005, p. 64 Table 3.2: Ukraine Openness to Trade indices, Derived from the World Bank’s World Trade Indicators database Country Snapshot <http://info.worldbank.org/etools/wti2008/2a1.asp> and the Heritage Foundation, <http://www.heritage.org/Index/>
53
Appendix 1
Notes on measures of openness to trade As the indices used to measure the openness to trade are quite technical, we have chosen to elaborate a more detailed description and explanation of the indices in order for the reader to fully comprehend their implications.
Simple Average Tariff The Simple Average Tariff is a measure of a country’s import tariffs and is expressed as a rate. Normally, the tariff is calculated by adding all the different tariff rates and divided by the sum of the number of products.
������ ����� ���� = ����� ��� �� ���� � + ��� �� ���� � + ��� �� ���� �÷ ����� �� �������� �ℎ�� ���� 3
This measure can give an overall picture of the degree of protection but is however not completely flawless. If goods subjected to no or low tariffs make up the bulk of a country’s imports while goods subjected to high tariffs constitute a small share of the imports, then this index will overstate the degree of protection.132
Average Weighted Import Tariff The Average weighted import tariff is used in order to avoid some of the inaccuracy of the simple average tariff by taking into account each good’s share of total imports. The standard way to calculate this index is to divide the total tariff revenue by the value of imports. However, as with the simple average tariff, this method may in certain situations measure a country’s level of protection in an inaccurate manner. This can happen if a country has high tariffs on some goods so that their import is effectively prohibited while it has lower tariffs on the group of goods actually imported. This will yield a low amount of tariff revenue, a fair value of imports and consequently a low average weighted import tariff. The level of protection would in this case be underestimated.133
Non-Tariff Measures The non-tariff index measures the extent to which imports are subjected to non-tariff barriers. The design of the index is simply a count of the number of non-tariff barriers, thus it does not hint to which degree these impinge on trade. Several barriers are identified and accounted for in the index.134 These include the following;
• Compulsory certification of conformity to standards • Licensing o f selected export and import activities • Minimum value requirement (in effect from 1996-2000) • Preliminary customs declaration • Ecological control
132 Suranovic 2006 133 Suranovic 2006 134 World Bank 2004c, p.47

54
• Sanitary control • Phytosanitary control • Veterinary control • Permits for medicine imports • State procurement regulations with regard to imports • Customs value calculation inquiry (checking declared value for the purpose of tax and
tariff calculations, in effect from 1996-2000) • Customs controls • Verification of contract price and origin for selected commodities • Control over selected types o f technology and equipment, such as energy-saving
equipment, meteorological equipment, nuclear materials, weapons materials, materials that could be used to produce chemical and bacteriological weapons, and equipment for clandestine information gathering.135
Real growth of total trade The real growth of trade is calculated as the annual growth rate of exports plus imports, deflated by export and import prices.136
Trade integration Trade integration is an indicator of the outcome of trade. It shows the ratio of exports and imports to GDP.137
Freedom to Trade Index The freedom to trade index takes into consideration both the level of tariffs as well as the extent of use of non-tariff barriers. The formula is constructed as follows;
��� !������ = "#� ������$ – ����� ÷ � ������$ − ������� ' × 100+ − � �
where Trade Freedomi represents the trade freedom in country i, Tariffmax and Tariffmin represent the upper and the lower bounds for tariff rates(%), and Tariffi represents the average weighted import tariff. A score of NTB is then given to each country depending on its use of non-tariff barriers Depending on the country’s use of non-tariff barriers, the NTB is given a score ranging from 0, implying no use of non tariff barriers to 20, implying extensive use.138
135 World Bank 2004c, p.48 136 World Bank 2008, p.24 137 World Bank 2008, p.24 138 The Heritage Foundation:2009b, p.442
55
Appendix 2
Definitions
Commonwealth of Independent States – CIS The CIS was created as a regional organization briefly after the Soviet Union fell with the purpose of coordinating trade, finance, lawmaking and security. The member states are: Armenia, Azerbaijan, Belarus, Georgia, Kazakhstan, Kyrgyzstan, Moldova, Russia, Tajikistan, Turkmenistan, Ukraine and Uzbekistan.
Job Creation The sum of all employment gains in a given year in all firms
Job Destruction The sum of all employment losses in firms that contract or shut down in a given year
Job Reallocation The sum of job Creation and Job Destruction
Most Favoured Nation – MFN The MFN status is an agreement commonly used in international trade policy and one of the cornerstones of the WTO. It implies a commitment of giving the partner nation same advantages, in this case tariff rates, as it does to its most favoured nation. This status is often granted mutually between the concerned parts.
Total Factor Productivity – TFP The variable accounting for the share of total output not caused by any inputs. Expressed in a Cobb-Douglas form, the total output (Y) is expressed as a function of TFP (A), capital input (K) and labour input (L): , = � × - × .
Revealed Comparative Advantages – RCA RCA is a measure of specialization which does not determine the true comparative advantages, but is decided on the composition of exports of one country to a certain market with the composition of total exports that are absorbed by the market.
/�� = 100�0�1 ÷ 021 ÷ �0�� ÷ 02� where Xij is exports by country i (w=world) of good j (t=total for all goods).

56
Appendix 3 Wages by Sector in UAH
Total men and women 1998 1999 2000 2001 2002 2003 2 004 2005 2006 2007 Total 153.5 177.5 230.1 311.1 376.4 462.3 589.6 806.2 1042 1351
A-B 89.2 101.9 114.3 155.1 183.7 220.2 311.9 437.7 580.9 769.9
C-Q 169.2 195.7 257.1 343.6 411.9 499.4 625.5 847.7 1086 1400
A: Agriculture & Hunting 89.2 101.8 113.9 154.5 182.9 219.2 311 436.8 580.5 770.6
B: Fishing 90.1 110 146.5 203.6 241.6 290.6 374.7 499 606.7 721.3
C: Mining and Quarrying 268.1 302 393.4 516.7 609.9 701.3 910 1246 1536 1971
D: Manufacturing 159.7 191.3 270.7 368.3 441.3 552.9 700.6 905.1 1137 1456
E: Electricity, Gas and Water 249.2 293 370.7 475.8 562.1 651.3 766.9 969 1228 1577
F: Construction 184.1 206.7 260.2 362.4 427.5 546.3 708.7 894 1140 1486
G: Wholesale and Retail Trade 139.7 174.9 225.5 283.6 330.4 393.7 508.7 713.2 898.2 1145
H: Hotels and Restaurants 114.3 141.2 178.2 234.8 286.1 339.6 429.4 566.5 735.1 943.9
Real Poverty Line 80.9 99.2 127.2 142.5 143.6 151.1 164.7 183.4 200.1 225.7
2002 2003 2004 2005 2006 2007
Industrial demand for Labour
(in thousands) 49.6 53.6 63.1 65.8 55.8 57.4

57
Appendix 4 Key indicators and variables
Key Indicators 1996 1997 1998 1999 2000 2001 2002 2003 2004 2005 2006 2007 GDP-growth(%) -10 -3 -2 0 6 9 5 10 12 3 7
Trade balance (%) -7 -6 -5 -1 2 1 2 0 6 -2 -6
Export growth(%) 14 8 11 24 43 8 14
Import Growth(%) 16 14 5 29 31 20 22
Inflation rate (%) 80 16 11 23 28 12 1 5 9 13 9 13
Employment (%) 64 64 62 54 56 56 57 57 57 58
Unemployment (%) 8 9 11 12 12 11 10 9 9 7 7
Wages (average) (UAH) 154 178 230 311 376 462 590 806 1042 1351
Growth in Wages (%) 16 30 35 21 23 28 37 29 30
Real Growth in Wages (%) -7 2 23 20 18 19 24 20 17
Freedom to Trade Index 66 66 53 53 70 70 71 75 75 76 77
Headcount Index (%) 30 32 32 26 20 14 8
Real Poverty Line (UAH) 81 99 127 143 144 151 165 183 200 226