The Canadian Space Program One Amateur’s Adventures in The Canadian Space Program
Upload
melanie-marjorie-gainesCategory
view
215download
0
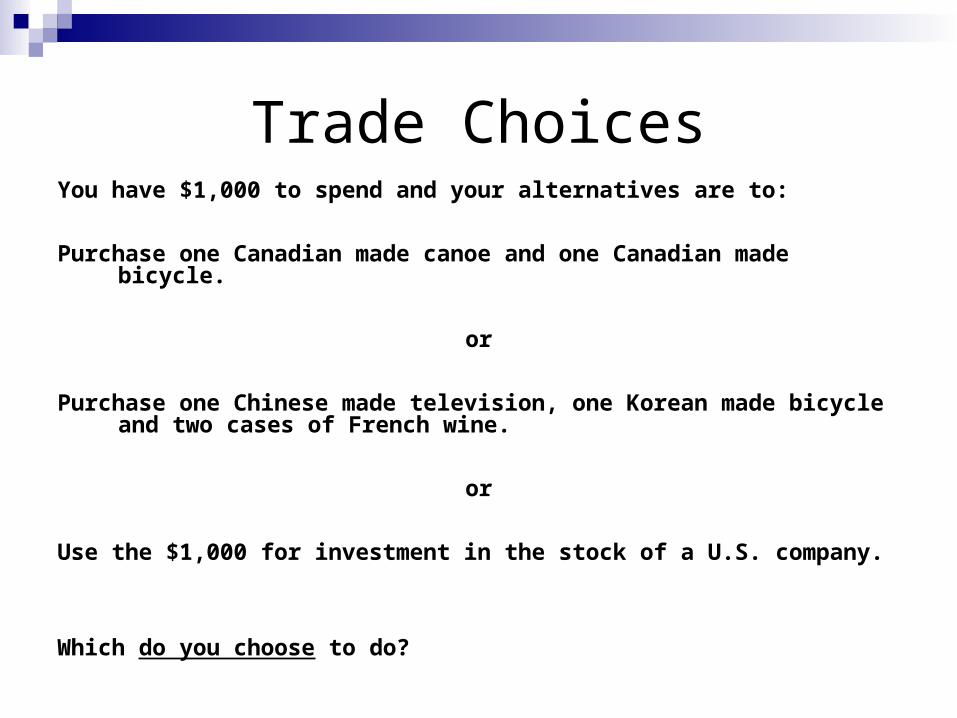
Trade ChoicesYou have $1,000 to spend and your alternatives are to:
Purchase one Canadian made canoe and one Canadian made bicycle.
or
Purchase one Chinese made television, one Korean made bicycle and two cases of French wine.
or
Use the $1,000 for investment in the stock of a U.S. company.
Which do you choose to do?

Kenneth Leonard PhDFoundation for Teaching Economics
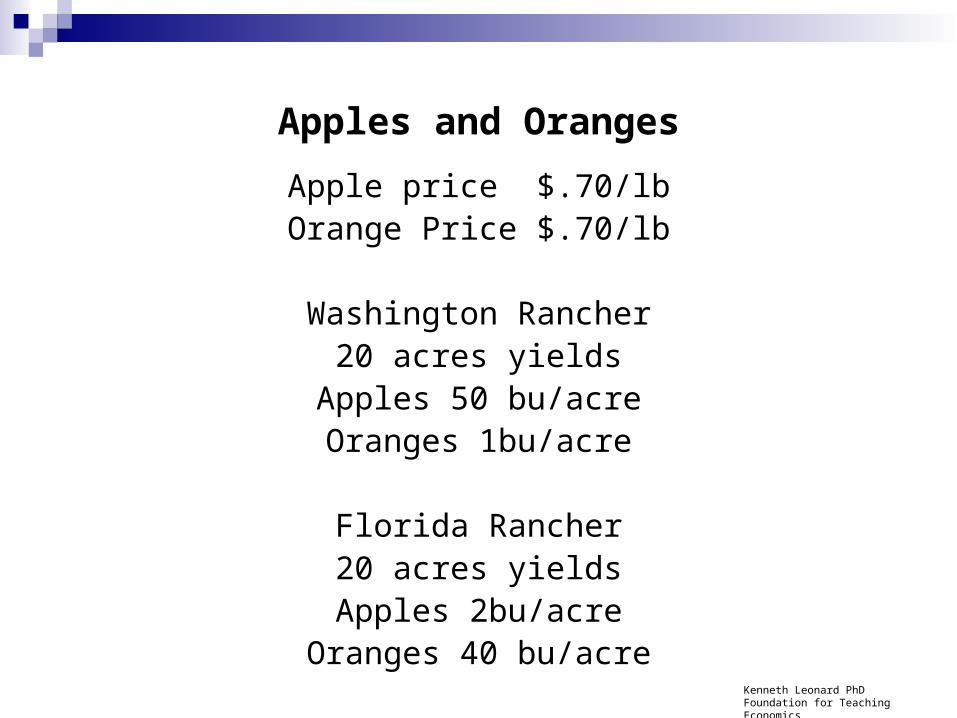
Apples and Oranges
Apple price $.70/lbOrange Price $.70/lb
Washington Rancher20 acres yields
Apples 50 bu/acreOranges 1bu/acre
Florida Rancher20 acres yields
Apples 2bu/acreOranges 40 bu/acre
Kenneth Leonard PhDFoundation for Teaching Economics
Year GDP Total Exports
Total Imports
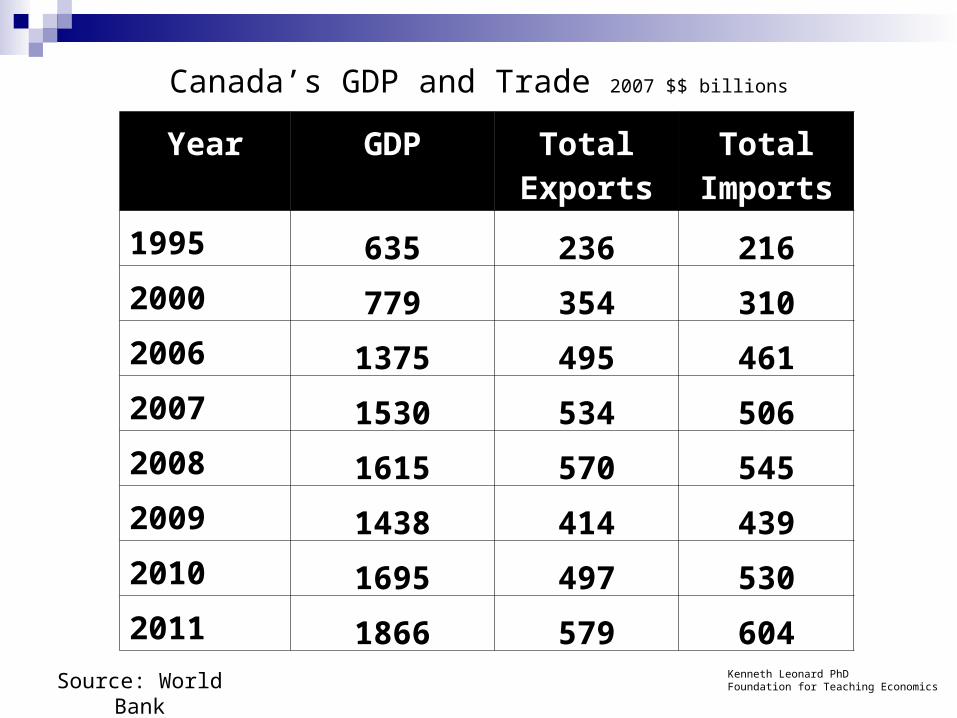
1995 635 236 216
2000 779 354 310
2006 1375 495 461
2007 1530 534 506
2008 1615 570 545
2009 1438 414 439
2010 1695 497 530
2011 1866 579 604
Canada’s GDP and Trade 2007 $$ billions
Source: World Bank Kenneth Leonard PhDFoundation for Teaching Economics
2001 2002 2003 2004 2005 2006 2007
2008 2009 2010 2011
2012
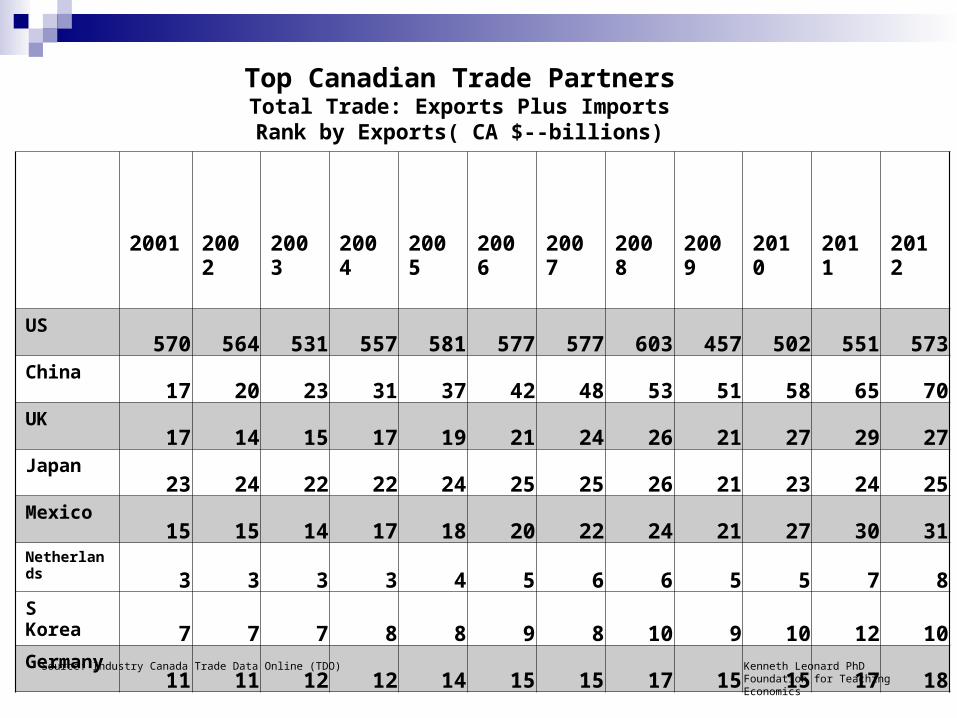
US570 564 531 557 581 577 577 603 457 502 551 573
China17 20 23 31 37 42 48 53 51 58 65 70
UK17 14 15 17 19 21 24 26 21 27 29 27
Japan23 24 22 22 24 25 25 26 21 23 24 25
Mexico15 15 14 17 18 20 22 24 21 27 30 31
Netherlands
3 3 3 3 4 5 6 6 5 5 7 8S Korea
7 7 7 8 8 9 8 10 9 10 12 10Germany
11 11 12 12 14 15 15 17 15 15 17 18
Top Canadian Trade PartnersTotal Trade: Exports Plus ImportsRank by Exports( CA $--billions)
Source: Industry Canada Trade Data Online (TDO) Kenneth Leonard PhDFoundation for Teaching Economics
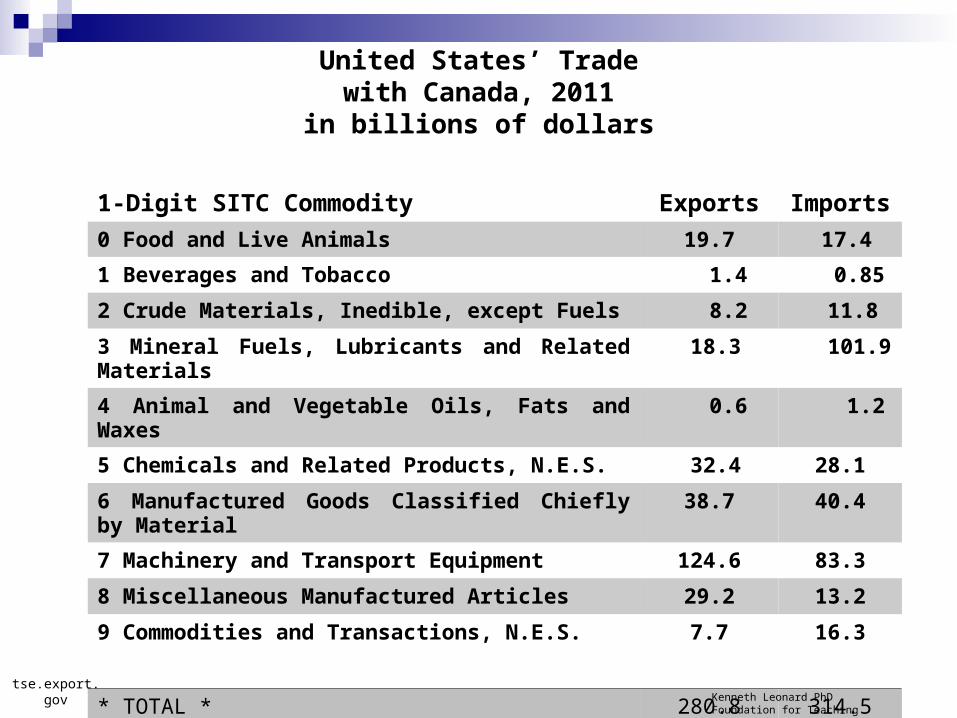
United States’ Trade with Canada, 2011
in billions of dollars
1-Digit SITC Commodity Exports Imports
0 Food and Live Animals 19.7 17.4
1 Beverages and Tobacco 1.4 0.85
2 Crude Materials, Inedible, except Fuels 8.2 11.8
3 Mineral Fuels, Lubricants and Related Materials 18.3 101.9
4 Animal and Vegetable Oils, Fats and Waxes 0.6 1.2
5 Chemicals and Related Products, N.E.S. 32.4 28.1
6 Manufactured Goods Classified Chiefly by Material 38.7 40.4
7 Machinery and Transport Equipment 124.6 83.3
8 Miscellaneous Manufactured Articles 29.2 13.2
9 Commodities and Transactions, N.E.S. 7.7 16.3
* TOTAL * 280.8 314.5tse.export.gov
Kenneth Leonard PhDFoundation for Teaching Economics
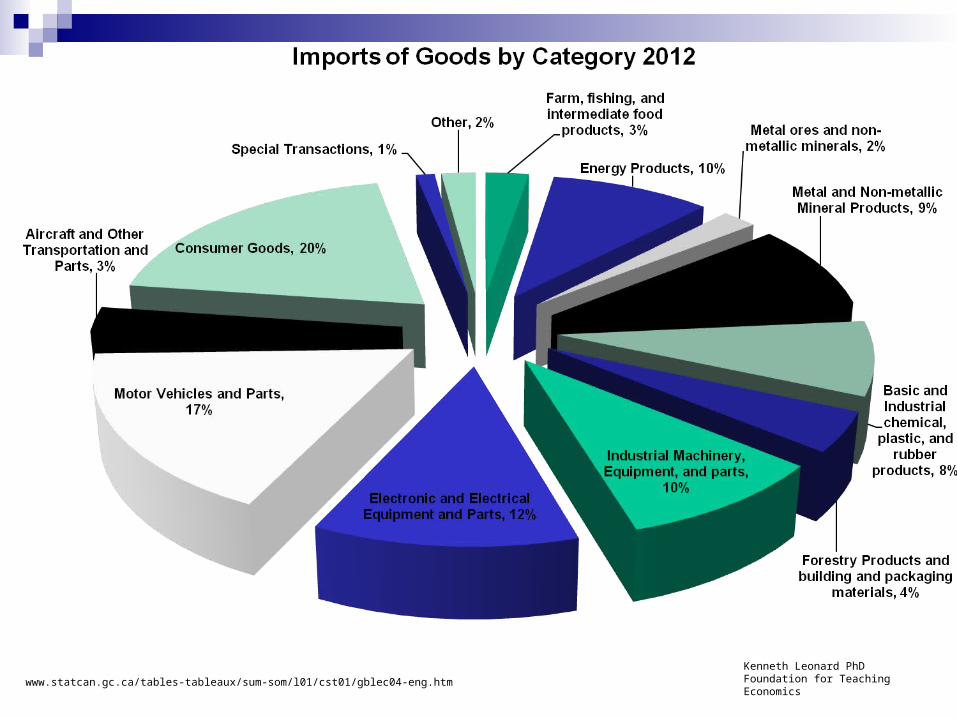
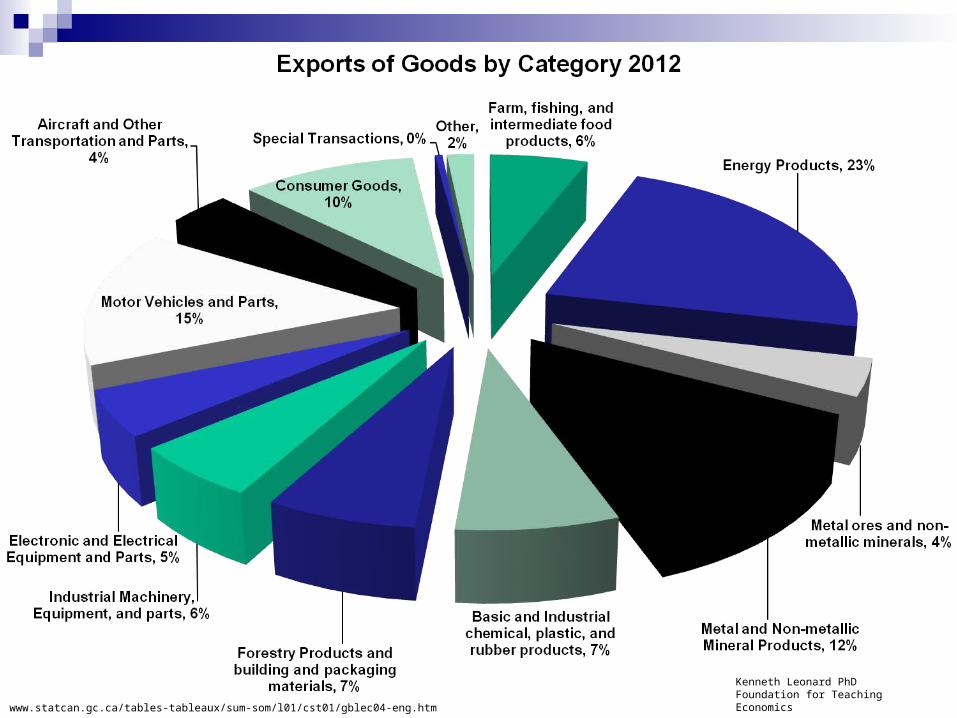
Kenneth Leonard PhDFoundation for Teaching Economicswww.statcan.gc.ca/tables-tableaux/sum-som/l01/cst01/gblec04-eng.htm
Kenneth Leonard PhDFoundation for Teaching Economics
www.statcan.gc.ca/tables-tableaux/sum-som/l01/cst01/gblec04-eng.htm
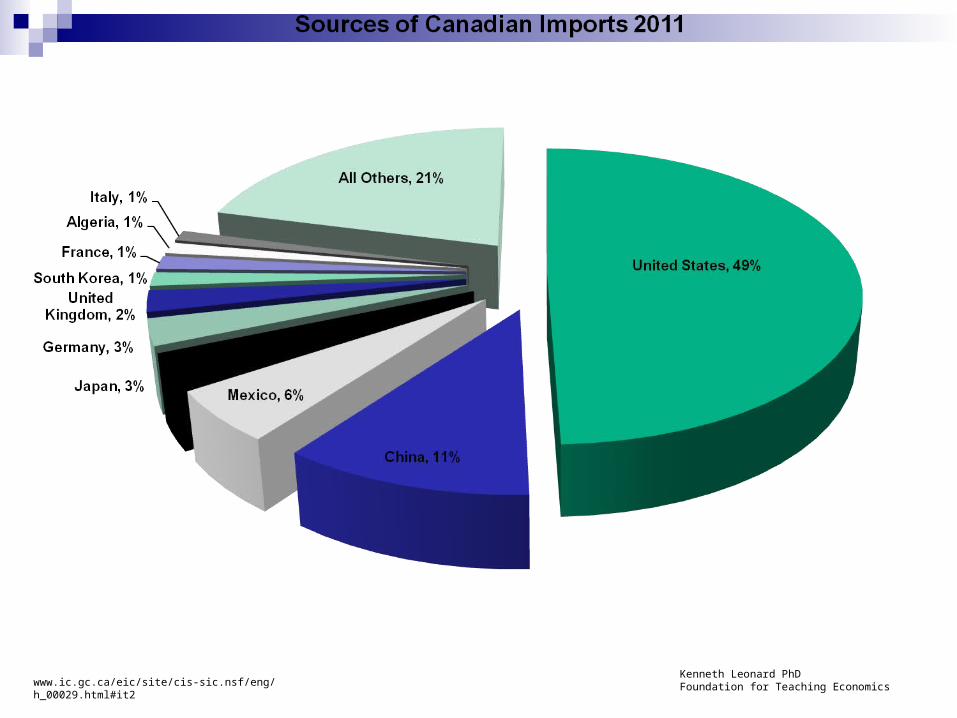
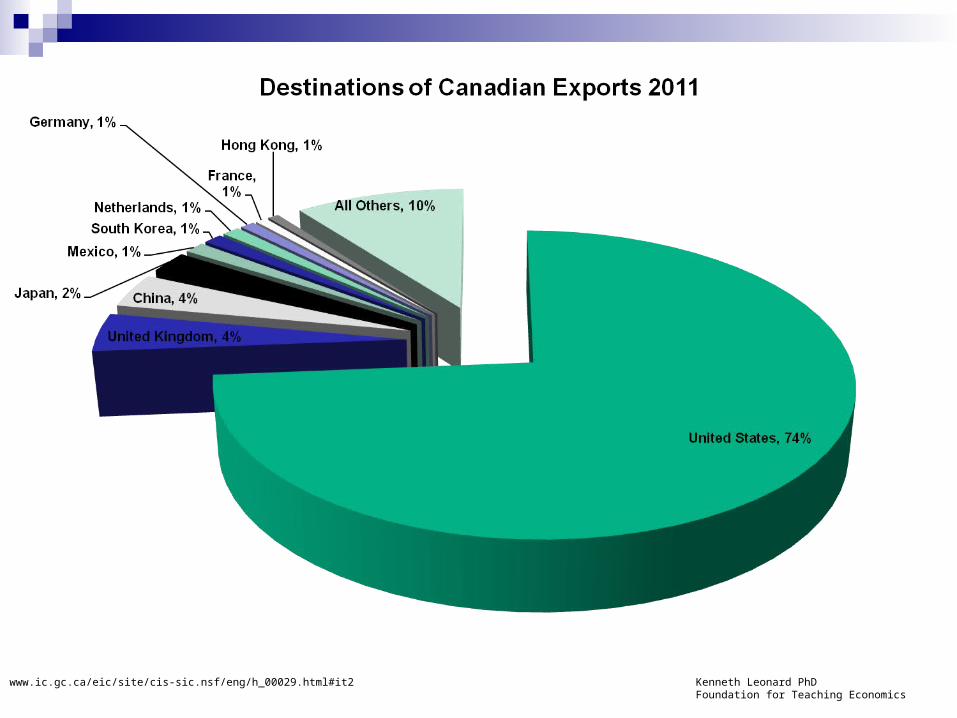
Kenneth Leonard PhDFoundation for Teaching Economicswww.ic.gc.ca/eic/site/cis-sic.nsf/eng/h_00029.html#it2
Kenneth Leonard PhDFoundation for Teaching Economics
www.ic.gc.ca/eic/site/cis-sic.nsf/eng/h_00029.html#it2
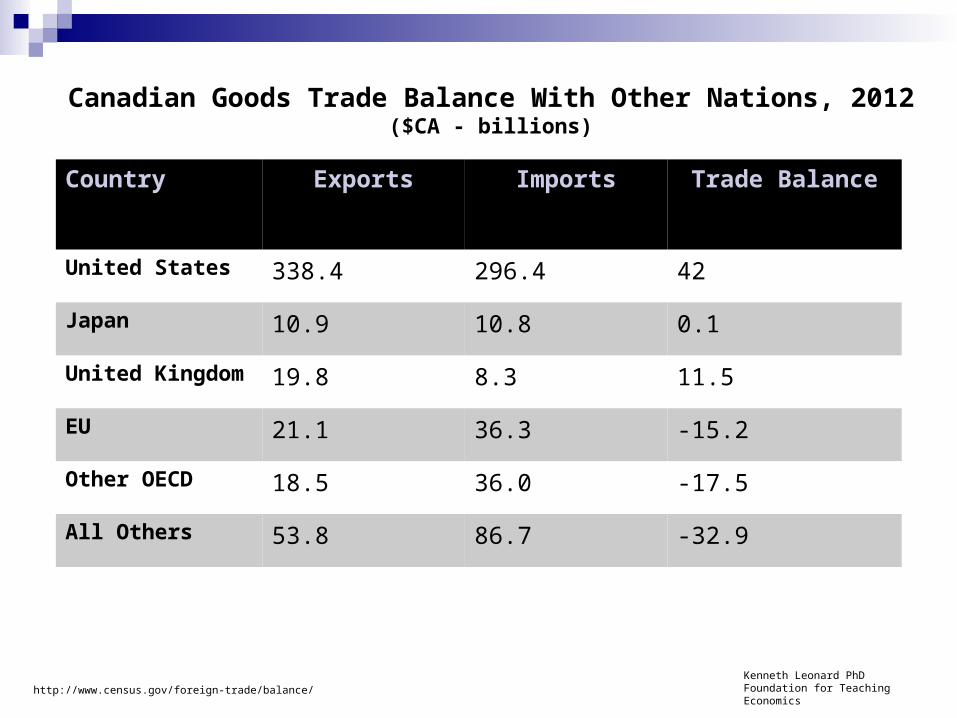
Canadian Goods Trade Balance With Other Nations, 2012($CA - billions)
Country Exports Imports Trade Balance
United States 338.4 296.4 42
Japan 10.9 10.8 0.1
United Kingdom 19.8 8.3 11.5
EU 21.1 36.3 -15.2
Other OECD 18.5 36.0 -17.5
All Others 53.8 86.7 -32.9
http://www.census.gov/foreign-trade/balance/Kenneth Leonard PhDFoundation for Teaching Economics
U.S. Balance of Payments 2008($ billions)
Current Account -706.0
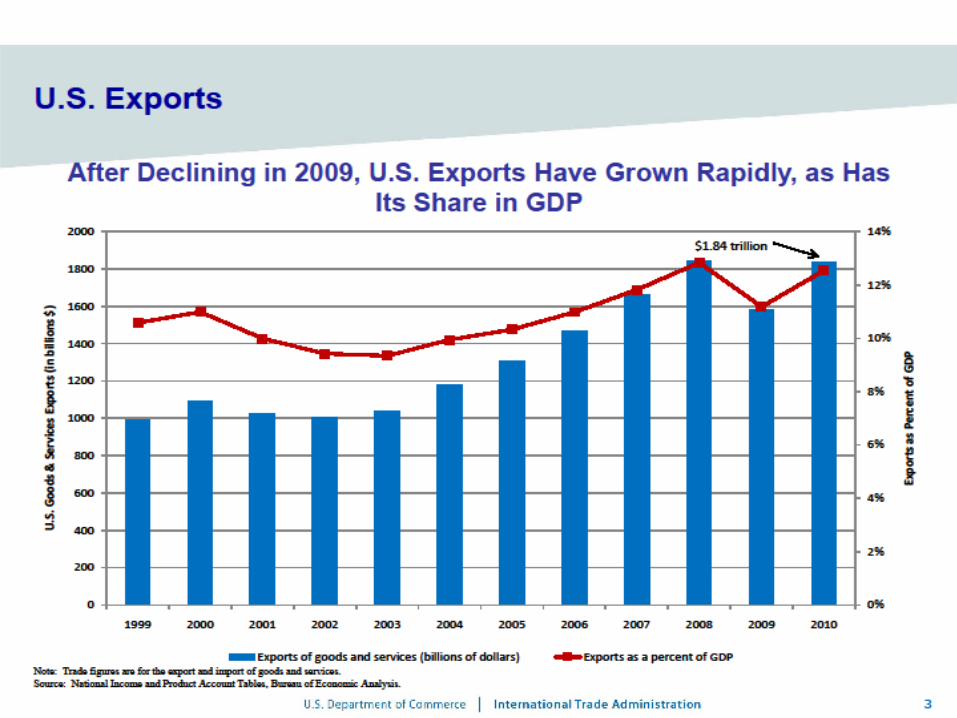
Merchandise trade balance -695.9Goods & Services exports 1,826.6Goods & Services imports -2,522.5
Net Transfers -128.3Net Income Payments 118.2
Capital Account +706.0
Increase in U.S. holdings of foreign assets -106Increase in Foreign holdings of U.S. assets 505,166
Statistical Discrepancy +200
http:bea.gov
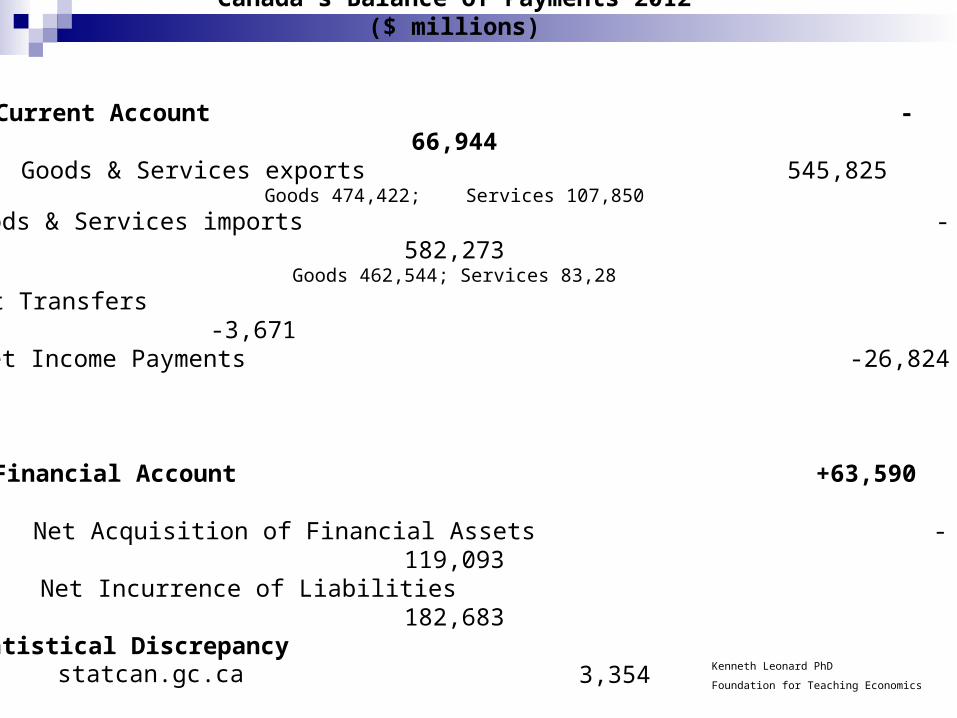
Canada’s Balance of Payments 2012($ millions)
Current Account -66,944Goods & Services exports 545,825
Goods 474,422; Services 107,850
Goods & Services imports -582,273Goods 462,544; Services 83,28
Net Transfers -3,671 Net Income Payments -26,824
Financial Account +63,590
Net Acquisition of Financial Assets -119,093 Net Incurrence of Liabilities 182,683
Statistical Discrepancy 3,354
statcan.gc.ca Kenneth Leonard PhD
Foundation for Teaching Economics
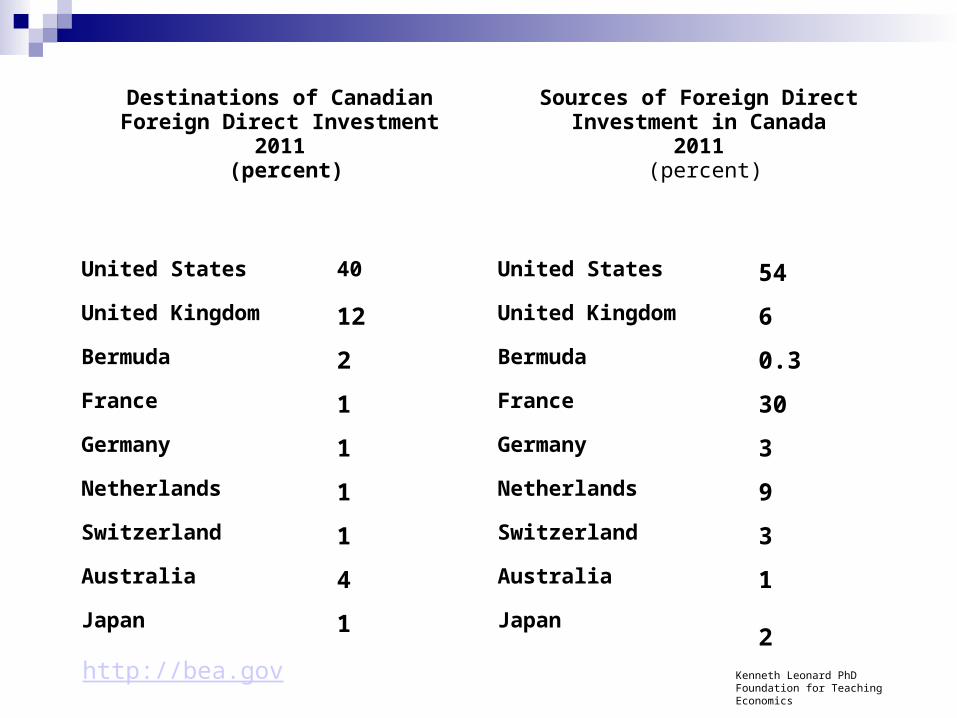
Destinations of Canadian Foreign Direct Investment
2011 (percent)
Sources of Foreign Direct Investment in Canada
2011 (percent)
United States 40 United States 54
United Kingdom 12 United Kingdom 6
Bermuda 2 Bermuda 0.3
France 1 France 30
Germany 1 Germany 3
Netherlands 1 Netherlands 9
Switzerland 1 Switzerland 3
Australia 4 Australia 1
Japan 1 Japan2
http://bea.gov Kenneth Leonard PhDFoundation for Teaching Economics
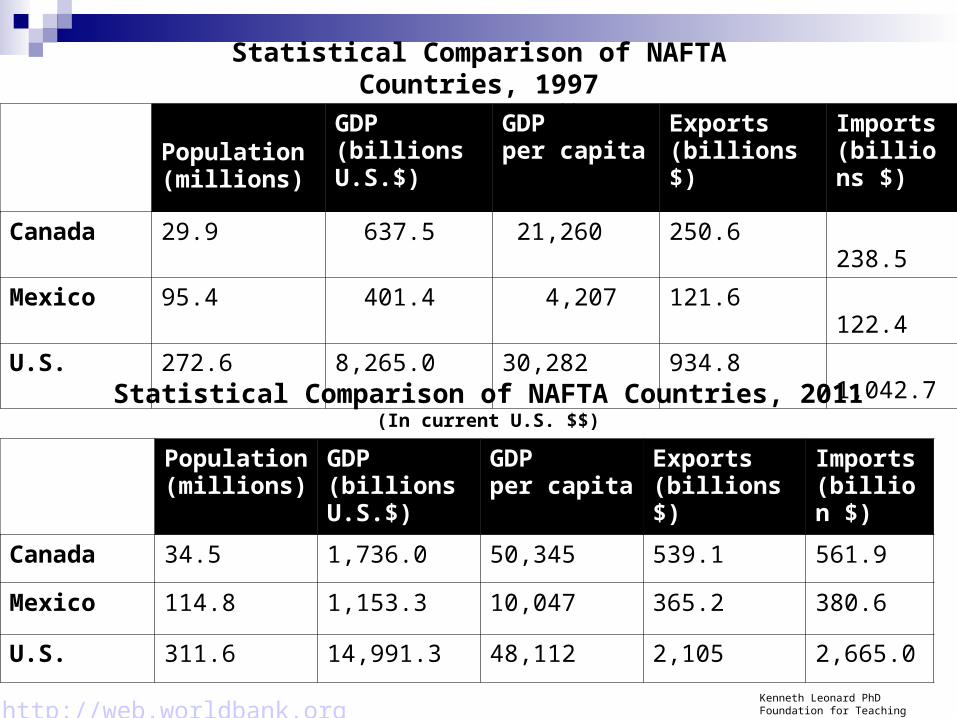
Statistical Comparison of NAFTA Countries, 1997(In current U.S. $$)
Population(millions)
GDP(billions U.S.$)
GDPper capita
Exports(billions $)
Imports(billions $)
Canada 29.9 637.5 21,260 250.6 238.5
Mexico 95.4 401.4 4,207 121.6 122.4
U.S. 272.6 8,265.0 30,282 934.8 1,042.7
Statistical Comparison of NAFTA Countries, 2011(In current U.S. $$)
Population(millions)
GDP(billions U.S.$)
GDPper capita
Exports(billions $)
Imports(billion $)
Canada 34.5 1,736.0 50,345 539.1 561.9
Mexico 114.8 1,153.3 10,047 365.2 380.6
U.S. 311.6 14,991.3 48,112 2,105 2,665.0
http://web.worldbank.org Kenneth Leonard PhDFoundation for Teaching Economics
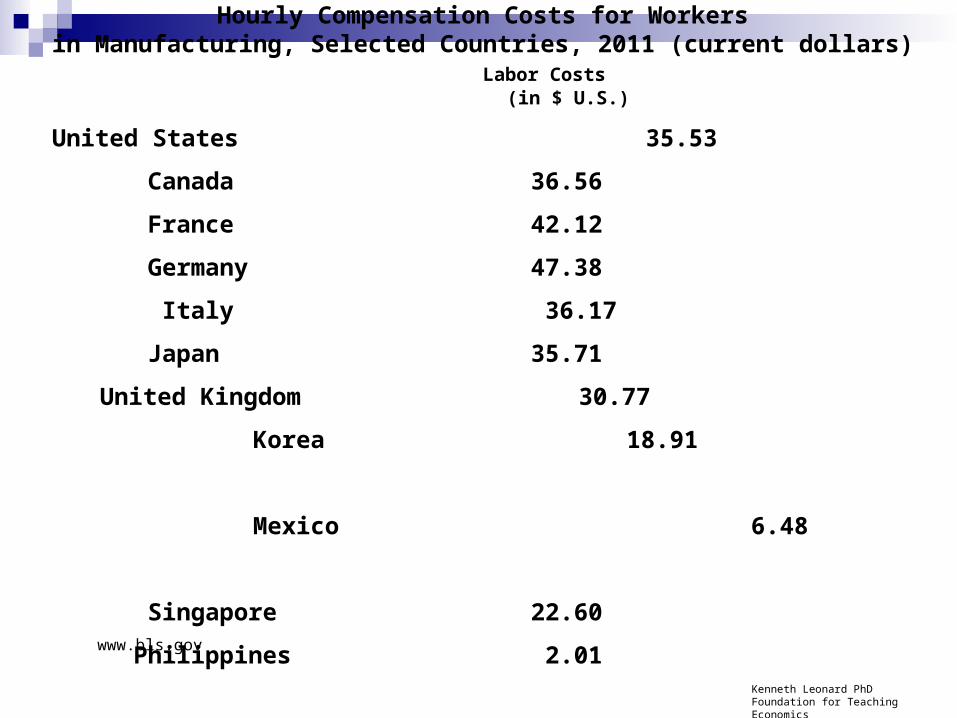
Hourly Compensation Costs for Workersin Manufacturing, Selected Countries, 2011 (current dollars)
Labor Costs (in $ U.S.)
United States 35.53
Canada 36.56
France 42.12
Germany 47.38
Italy 36.17
Japan 35.71
United Kingdom 30.77
Korea 18.91
Mexico 6.48
Singapore 22.60
Philippines 2.01 vwww.bls.gov
Kenneth Leonard PhDFoundation for Teaching Economics

The Magic of Markets: Trade Creates Wealth
Classroom Activity:
www.fte.org/teacher-resources/lesson-plans/efllessons/the-magic-of-markets-trade-creates-wealth/

Foreign Currency &
Foreign Exchange
Classroom Activity:
http://www.fte.org/teacher-resources/lesson-plans/efllessons/foreign-currencies-and-foreign-exchange/
The “Giant Sucking Sound”
Classroom Activity:
http://www.fte.org/teacher-resources/lesson-plans/efllessons/the-giant-sucking-sound-job-woes-or-trade-flows/
Background
The demand for labor is derived demand. The demand for workers is dependent upon the demand for the product the workers make. If no one wants to purchase the product, then there will be no demand for workers to produce it.
Background
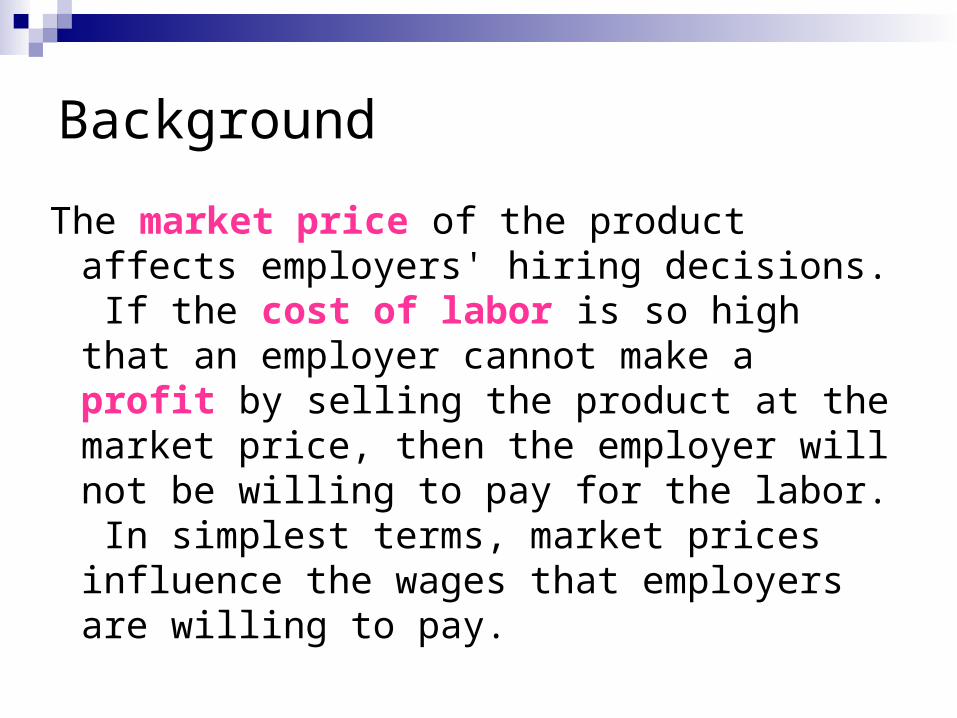
The market price of the product affects employers' hiring decisions. If the cost of labor is so high that an employer cannot make a profit by selling the product at the market price, then the employer will not be willing to pay for the labor. In simplest terms, market prices influence the wages that employers are willing to pay.
Background
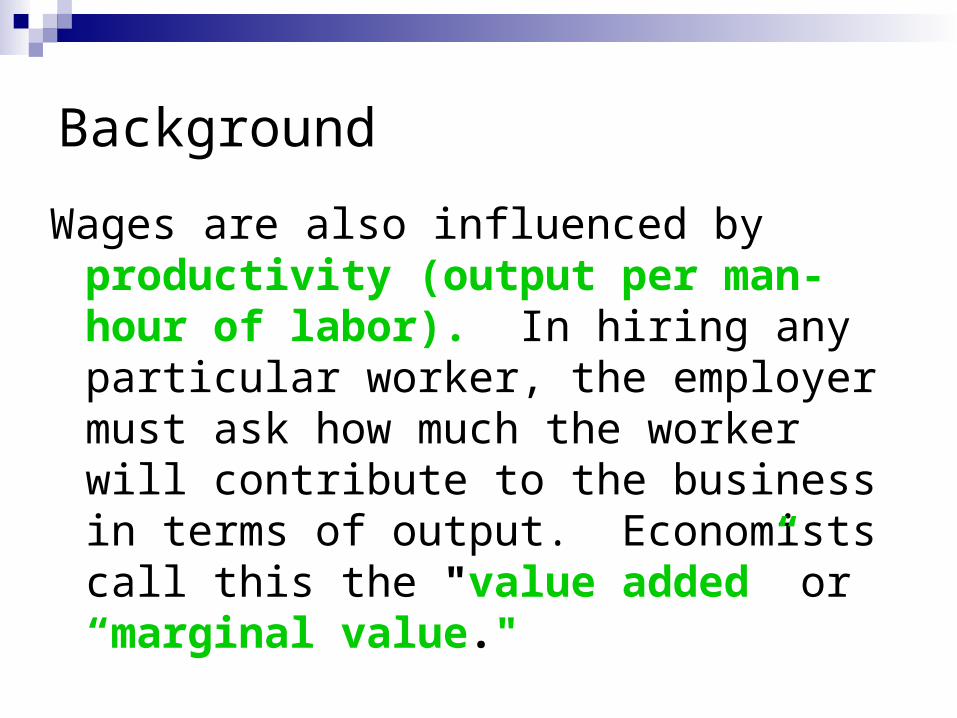
Wages are also influenced by productivity (output per man-hour of labor). In hiring any particular worker, the employer must ask how much the worker will contribute to the business in terms of output. Economists call this the "value added” or “marginal value."
Productivity
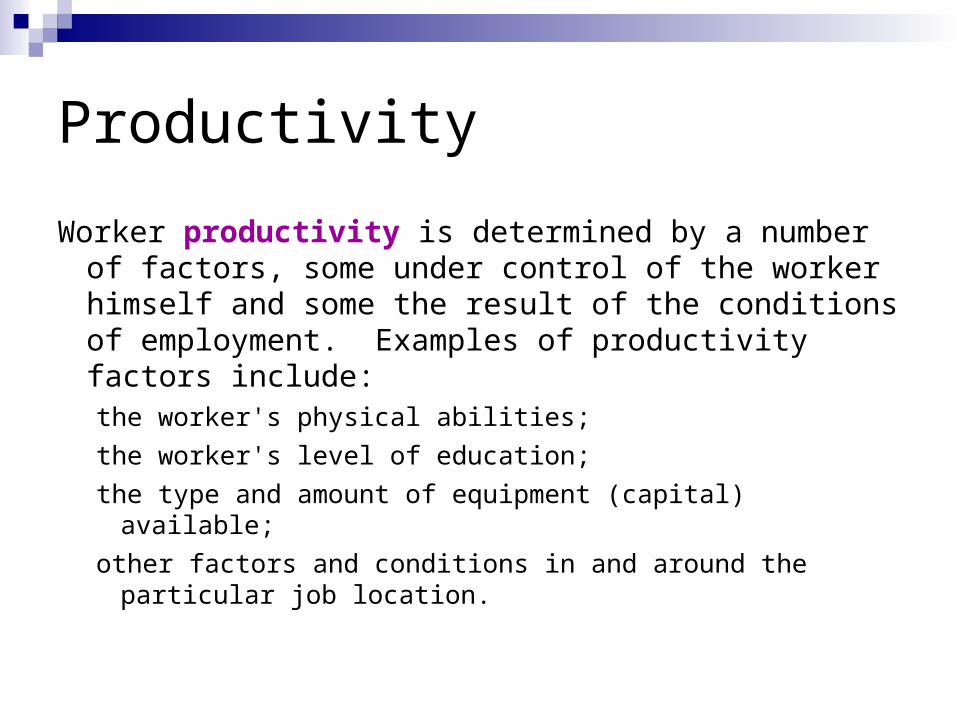
Worker productivity is determined by a number of factors, some under control of the worker himself and some the result of the conditions of employment. Examples of productivity factors include:the worker's physical abilities;
the worker's level of education;
the type and amount of equipment (capital) available;
other factors and conditions in and around the particular job location.
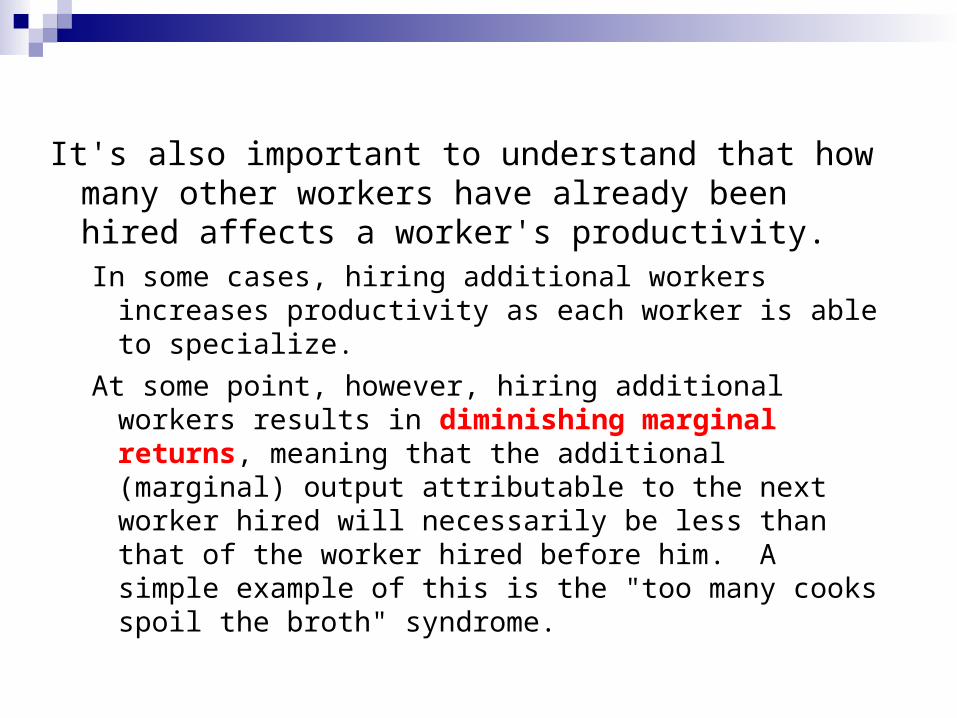
It's also important to understand that how many other workers have already been hired affects a worker's productivity. In some cases, hiring additional workers increases
productivity as each worker is able to specialize.
At some point, however, hiring additional workers results in diminishing marginal returns, meaning that the additional (marginal) output attributable to the next worker hired will necessarily be less than that of the worker hired before him. A simple example of this is the "too many cooks spoil the broth" syndrome.
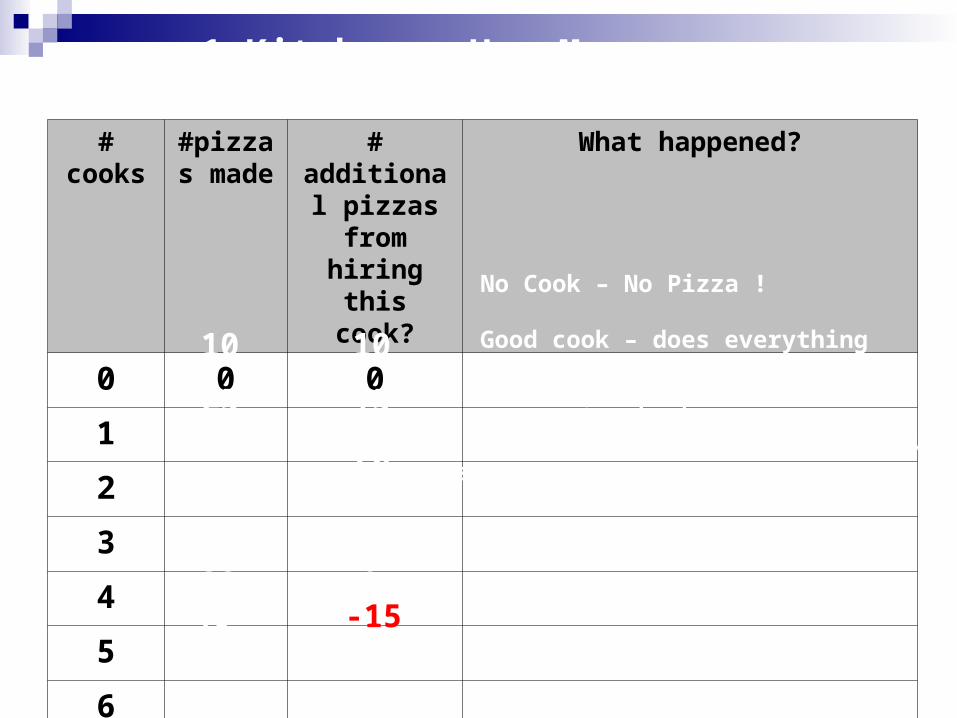
Would you hire 6 cooks? What's the most you'd be willing to pay cook #4?
1 Kitchen - How Many Cooks?
# cooks
#pizzas made
# additional pizzas from hiring this
cook?
What happened?
0 0 0
1
2
3
4
5
6
No Cook – No Pizza !
10 10
25
45
55
55
40
15
20
10
0
-15 Get her out of the way !
Things aren’t so hectic
Extra guy – helps who ever is behind
1 baker+1 prep+1 waiter – what a system!
1 baker, 1 prep and waiter
Good cook – does everything himself
Scenario
In college, Maria and Mario started a t-shirt business out of their parents' garage. Now they've graduated, and would like to expand the business and become the bosses instead of the "do-everything" people.
They've made a list of the different tasks involved in the business - most of which they now do themselves. They figure there are 2 kinds of tasks in the t-shirt business:
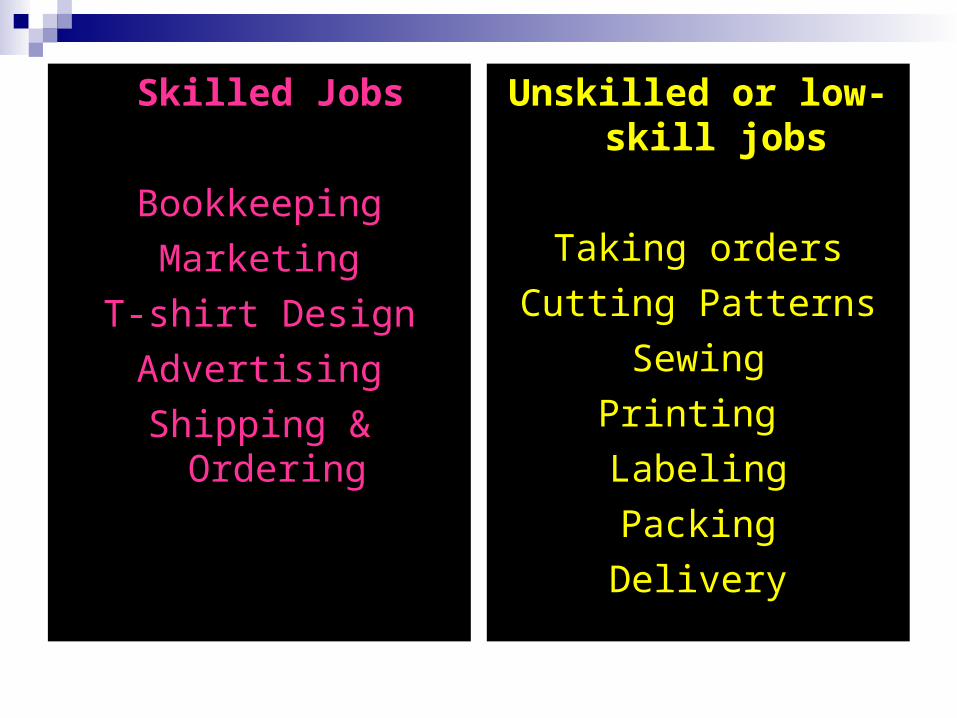
Skilled Jobs
Bookkeeping
Marketing
T-shirt Design
Advertising
Shipping & Ordering
Unskilled or low-skill jobs
Taking orders
Cutting Patterns
Sewing
Printing
Labeling
Packing
Delivery

Every person they hire means one less thing they have to do themselves - and they can choose to do the things they enjoy most - like the design and marketing, for example. The question is how many people to hire.
Based on past experience, here's what they think will happen when they begin to hire workers:
Mario & Maria’s dilemma
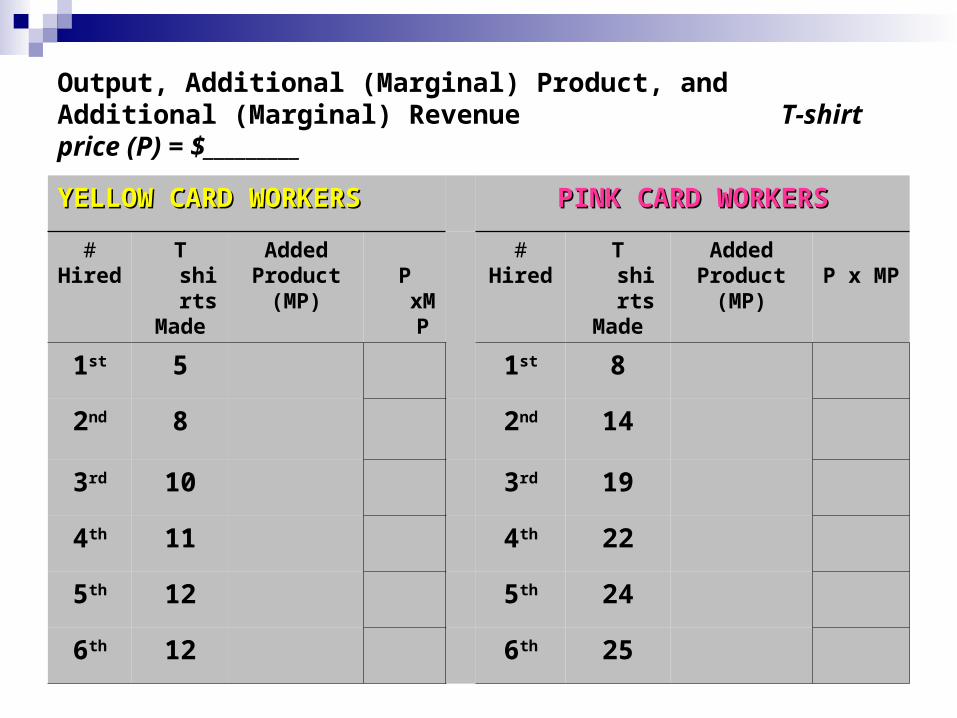
Output, Additional (Marginal) Product, and Additional (Marginal) Revenue T-shirt price (P) = $_________
YELLOW CARD WORKERSYELLOW CARD WORKERS PINK CARD WORKERSPINK CARD WORKERS
#Hired
T shirtsMade
AddedProduct
(MP)P xMP
#Hired
T shirtsMade
AddedProduct
(MP)P x MP
1st 5 1st 8
2nd 8 2nd 14
3rd 10 3rd 19
4th 11 4th 22
5th 12 5th 24
6th 12 6th 25
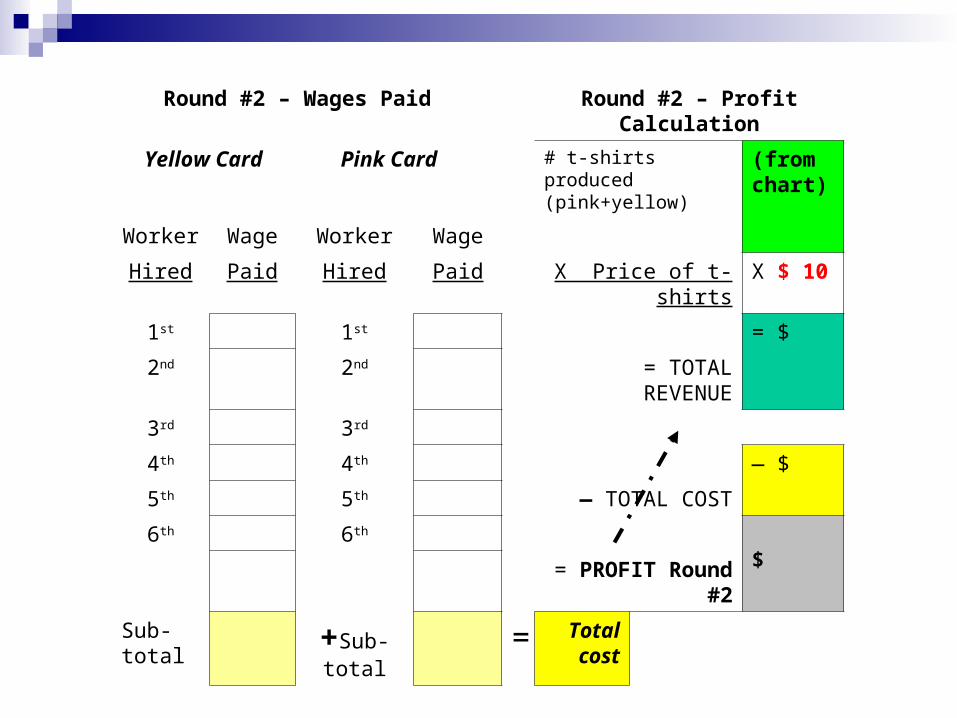
Round #2 – Wages Paid Round #2 – Profit Calculation
Yellow Card Pink Card # t-shirts produced (pink+yellow)
(from chart)
Worker Wage Worker Wage
Hired Paid Hired Paid X Price of t-shirts X $ 10
1st 1st = $
2nd 2nd = TOTAL REVENUE
3rd 3rd
4th 4th — $
5th 5th — TOTAL COST
6th 6th
$= PROFIT Round #2
Sub-total +Sub-total = Total cost
ProblemYou are a member of your firm's Make It Work Circle. The firm has
adopted a profit-sharing scheme and created the MIW Circle in which employees, management and ownership meet regularly to discuss the business. The profit-sharing agreement means that employees have a stake in the success of the business - if the firm makes more profit, the employee gets more income - and therefore, employees participate enthusiastically in the MIW meetings.
The market for t-shirts has grown in response to fashion trends and the employer has found a backer willing to provide the investment funds necessary to triple the size of the company. However, the company's personnel recruiter has reported that it's practically impossible to hire yellow card workers.
The employer has called an MIW meeting to brainstorm solutions to this labor dilemma. Make a list of things the company could do to take advantage of the opportunity to expand.
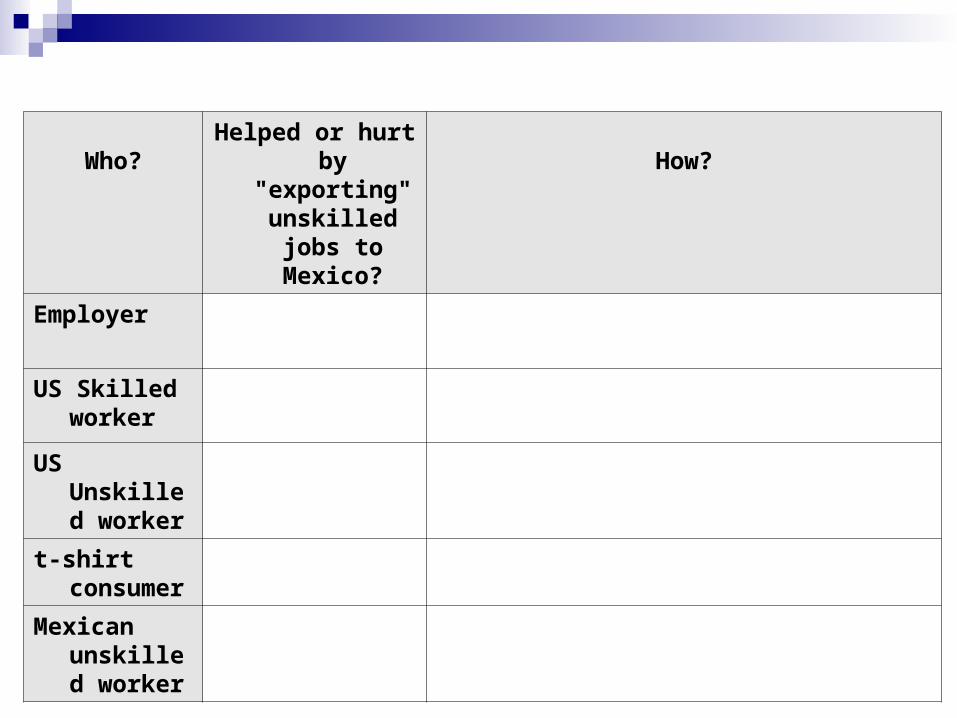
Who?Helped or hurt by
"exporting" unskilled jobs
to Mexico?
How?
Employer
US Skilled worker
US Unskilled worker
t-shirt consumer
Mexican unskilled worker
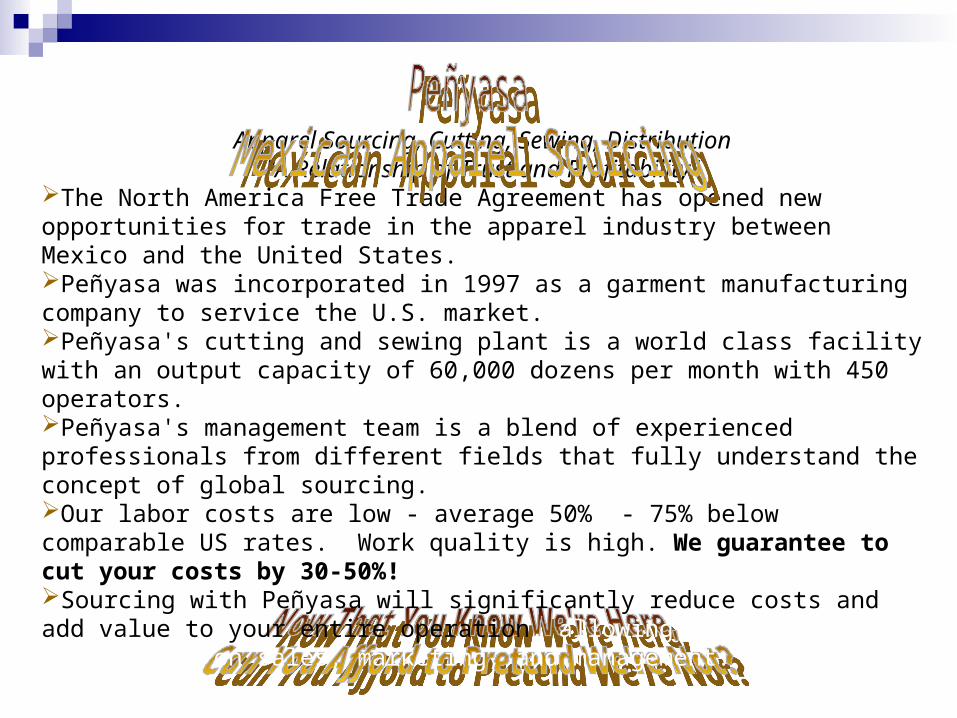
Apparel Sourcing, Cutting, Sewing, Distribution"A Relationship of Trust and Profitability"
The North America Free Trade Agreement has opened new opportunities for trade in the apparel industry between Mexico and the United States. Peñyasa was incorporated in 1997 as a garment manufacturing company to service the U.S. market.Peñyasa's cutting and sewing plant is a world class facility with an output capacity of 60,000 dozens per month with 450 operators. Peñyasa's management team is a blend of experienced professionals from different fields that fully understand the concept of global sourcing.Our labor costs are low - average 50% - 75% below comparable US rates. Work quality is high. We guarantee to cut your costs by 30-50%!Sourcing with Peñyasa will significantly reduce costs and add value to your entire operation, allowing you to concentrate on sales, marketing, and management.