Tracer report plus 10 figs - Worthington Groundwater tracing report.pdf · In our original report...
27
Karst hydrogeological investigations at Walkerton Addendum Report Stephen R.H. Worthington C. Christopher Smart and Wilf W. Ruland Prepared for Concerned Walkerton Citizens November 23 2001
Transcript of Tracer report plus 10 figs - Worthington Groundwater tracing report.pdf · In our original report...
Karst hydrogeological investigations
at Walkerton
Addendum Report
Stephen R.H. Worthington C. Christopher Smart and Wilf W. Ruland
Prepared for Concerned Walkerton Citizens
November 23 2001
2
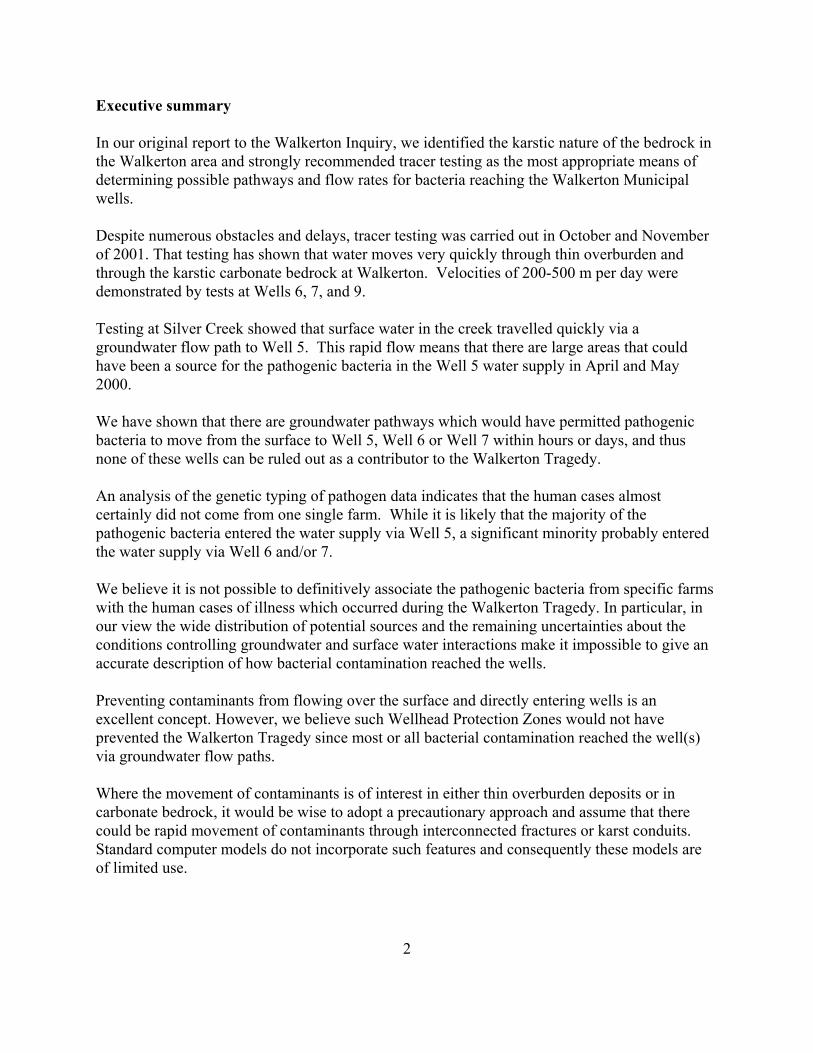
Executive summary In our original report to the Walkerton Inquiry, we identified the karstic nature of the bedrock in the Walkerton area and strongly recommended tracer testing as the most appropriate means of determining possible pathways and flow rates for bacteria reaching the Walkerton Municipal wells. Despite numerous obstacles and delays, tracer testing was carried out in October and November of 2001. That testing has shown that water moves very quickly through thin overburden and through the karstic carbonate bedrock at Walkerton. Velocities of 200-500 m per day were demonstrated by tests at Wells 6, 7, and 9. Testing at Silver Creek showed that surface water in the creek travelled quickly via a groundwater flow path to Well 5. This rapid flow means that there are large areas that could have been a source for the pathogenic bacteria in the Well 5 water supply in April and May 2000. We have shown that there are groundwater pathways which would have permitted pathogenic bacteria to move from the surface to Well 5, Well 6 or Well 7 within hours or days, and thus none of these wells can be ruled out as a contributor to the Walkerton Tragedy. An analysis of the genetic typing of pathogen data indicates that the human cases almost certainly did not come from one single farm. While it is likely that the majority of the pathogenic bacteria entered the water supply via Well 5, a significant minority probably entered the water supply via Well 6 and/or 7. We believe it is not possible to definitively associate the pathogenic bacteria from specific farms with the human cases of illness which occurred during the Walkerton Tragedy. In particular, in our view the wide distribution of potential sources and the remaining uncertainties about the conditions controlling groundwater and surface water interactions make it impossible to give an accurate description of how bacterial contamination reached the wells. Preventing contaminants from flowing over the surface and directly entering wells is an excellent concept. However, we believe such Wellhead Protection Zones would not have prevented the Walkerton Tragedy since most or all bacterial contamination reached the well(s) via groundwater flow paths. Where the movement of contaminants is of interest in either thin overburden deposits or in carbonate bedrock, it would be wise to adopt a precautionary approach and assume that there could be rapid movement of contaminants through interconnected fractures or karst conduits. Standard computer models do not incorporate such features and consequently these models are of limited use.

3
1 Introduction A major question concerning the cause of bacterial contamination of the Walkerton water supply in May 2000 is the possible role of groundwater flow in carrying pathogenic bacteria to one or more wells supplying the town. Most of the illnesses in May 2000 occurred within two weeks of heavy rain. Consequently, it is a reasonable supposition that the bacteria may have been transported from a source on the ground surface (probably manure from cattle) to one or more wells in less than two weeks. In our July 2001 report we suggested that bacteria could travel within days from the surface via groundwater flow paths to Wells 5, 6, and 7, and that such short travel times could occur over distances of at least two kilometres. We suggested such short travel times are possible because of the combination of thin silty tills and limestone and dolostone bedrock. The thin silty tills are subject to fracturing and the bedrock is subject to karstification. The standard method of determining actual (as opposed to theoretical) travel times in both fractured tills and in karst aquifers is to measure the travel times by undertaking tracer tests. We met with Town, MOE, and OCWA representatives on April 17th 2001 and outlined the tracer tests which we wished to carry out to Wells 5, 6, and 7. Unfortunately, permission was not forthcoming in time for our July 2001 report nor until Well 5 was destroyed and Wells 6 and 7 significantly modified to exclude shallow water. Several tracer tests have now been carried out, and these are described in Section 2 of this report. In Section 3 we present other hydrogeological data which have been collected and analysed since our July 2001 report. In Sections 4 and 5 we discuss the relevance of these new data in the context of determining the cause of the Walkerton Tragedy. 2 Tracer testing 2.1 Tracer tests to Well 7 Two tracer tests were carried out to Well 7 under the auspices of Golder Associates, based largely on design recommendations of S. Worthington and C. Smart. The water samples from Well 7 were analysed on site by S. Worthington using two filter fluorometers (one for each dye being used). This real-time analysis allowed the sample collection program to be modified once both dyes had arrived at Well 7. Samples were also collected by Golder Associates for more detailed analysis on scanning spectrofluorometers at the University of Western Ontario (by C. Smart and B. Simpson, for Concerned Walkerton Citizens) and at the University of Western Kentucky (by Crawford Hydrology Lab, for Golder Associates). The computer program PeakFit was used at both labs to identify dye peaks and concentrations. At this time our analysis is not

4
completed, and the results we present are only the raw fluorescence curves. However, results from both labs are essentially identical. The dyes used were sodium fluorescein (also known as fluorescein or uranine) and eosine. The amount of dye to be used was calculated by S. Worthington, and designed so that neither dye would be visible in the water supply. The two dyes are non-toxic and were approved for use by the Bruce Grey Health Unit and by the Ministry of the Environment. The breakthrough (concentration versus time) curves for the two traces to Well 7 are shown in Figure 1. Eosine injected in Well 9 first appeared in Well 7 after five hours and reached a peak after ten hours. Fluorescein injected in Well 6 first appeared in Well 7 after 26 hours and reached a peak two to three days later. These times correspond to velocities of 200 to 500 metres per day. These rapid travel times accord with our expectations for karst aquifers since there is rapid flow in conduits. For instance, S. Worthington (slide 34, PowerPoint presentation to the Inquiry, Exhibit 417) predicted a travel time of about a day from Spring B to Well 7. The trajectories of the traces are shown in Figure 2. These proven rapid velocities mean that the bacterial contamination found in the water supply could have come from several different farms and travelled rapidly to the wells in just a few days.
2.2 Tracer testing from Silver Creek Silver Creek lies to the west of Well 5 and flows from south to north. At its closest point it is only 500 m from Well 5. In August 2001 a kilometre long stretch of Silver Creek dried up. On August 28th 2001 we measured the flow in the creek at several points (Figure 3). Some of the water disappearing in the creek bed may have been flowing to the springs adjacent to Well 5, as shown in Figure 3. A second possibility is that the water was flowing to the north along the Silver Creek valley. There is the potential for groundwater flow from Silver Creek to Well 5. The elevation of the creek at the nearest point to Well 5 (point 4 in Figure 4) is about one metre higher than the springs at Well 5, and is three metres higher than the water level in Well 5 when it was pumping. There were no monitors located close to the Silver Creek during the August 2000 pumping test at Well 5. The closest monitoring well is MW11D, and this had a drawdown of 0.75 m in response to pumping (Golder Associates, 2000b, Table 3). Extrapolation of the drawdown to the creek

5
gives a value of more than 0.5 m at the creek. This indicates that Well 5 was likely to have induced recharge of water from the bed of Silver Creek (Figure 4b). On August 24th the Town informed us that tracing would take place at Well 7 in September, and possibly as early as the week of September 10th. We decided to carry out a tracer test in Silver Creek at the same time as the tracing at Well 7 to make efficient use of our time in Walkerton. Following a series of delays in the tracing at Well 7, we went ahead and injected fluorescein dye in Silver Creek on October 25th 2001 (at point 1 on Figure 4a). The flow in the creek at the time was 300 L/s and flow at the springs next to Well 5 was 21 L/s. Consequently only a small proportion of the flow in the creek could be sinking into the creek bed and flowing to Well 5. This was therefore a particularly challenging trace to design. Results of analysis of water samples are shown in Figure 5a for the springs next to Well 5 and in Figure 5b for a domestic well midway between Silver Creek and the springs (for location see Figure 4a). We recovered fluorescein dye at both sampling locations, largely in the first three days after dye injection. Neither dye breakthrough curve shows the smooth increase and decrease typically associated with tracer tests (e.g. Figure 1), probably due to the presence of domestic wells in the area. We also caution that fluorescein is used in some domestic products and in vehicle antifreeze and so at least some of the dye could be from septic tank discharge or from road or yard runoff. However, we have not located fluorescein in regional stream samples, and in the week preceding November 17, all fluorescein had disappeared from the well and spring. Our conclusion is that the results indicate rapid migration of water (under high flow conditions) from Silver Creek (or some other surface source) through the aquifer to Well 5. We attempted to raise funds for a supplementary trace with eosine, but these were not forthcoming, and so we repeated the trace with stocks of fluorescein on November 17th. Water samples are still being collected from this test. There is rapid flow of surface water through the aquifer supplying Well 5. It would certainly be possible for pathogenic bacteria to have been carried through the aquifer from Silver Creek to Well 5 in May 2000. The entire catchment of Silver Creek upstream of Well 5 and the currently undefined recharge area for Well 5 must now be considered as potential sources of contamination of the Walkerton drinking water supply in May 2000.

6
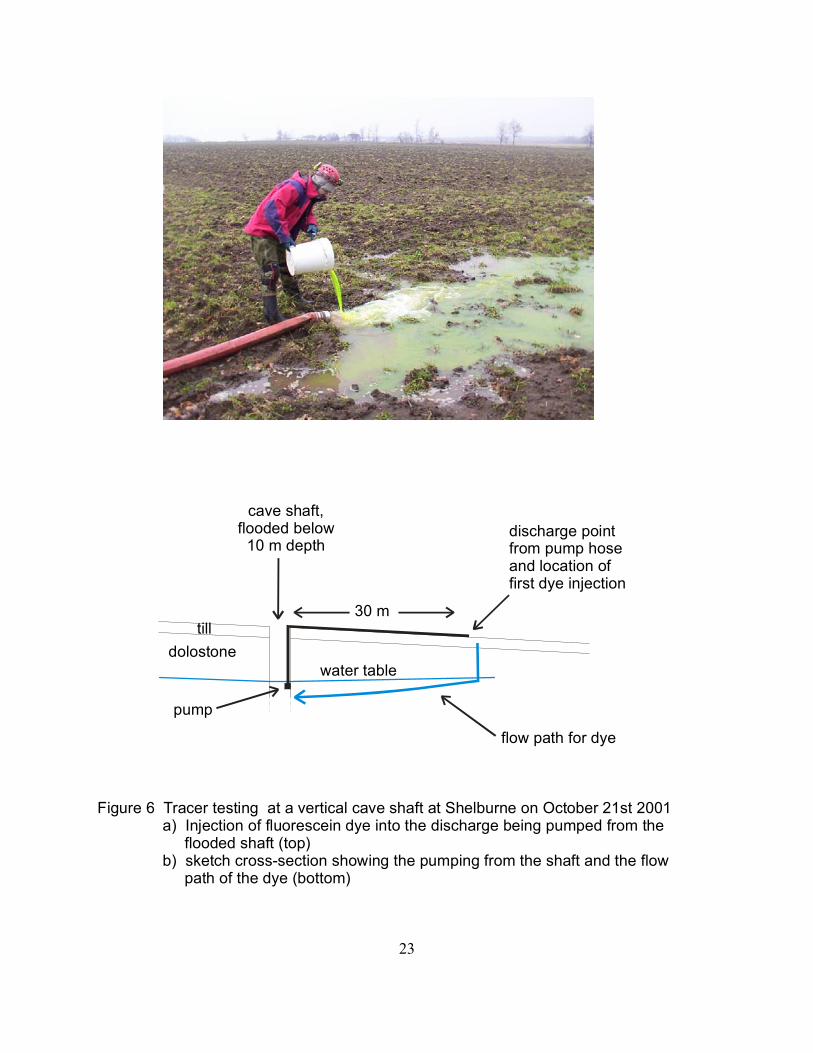
2.3 Tracer testing through the overburden at Shelburne A key question regarding possible sources of bacterial contamination of the karstic bedrock aquifers at Walkerton is whether groundwater flow through fractures in the thin silt till layer over the bedrock could have transmitted bacteria from the ground surface to the bedrock (and if so, then how fast?). A wide range of estimates for travel time through the till have been given at the Inquiry. For instance, Dr. Gillham suggested a travel time of one year (Gillham, 2001, p. 25), but under cross-examination he conceded that downward travel times of minutes to hours would be possible assuming that there were fractures which were transmitting water (Transcripts, March 1 2001, page 130). Our work at other locations throughout southern Ontario (some of it published, some unpublished) has established that fine grained overburden materials such as the silt and silt till materials which are found in the Walkerton area are commonly fractured to depths in the range of 5 to 10 metres (e.g. Ruland et al., 1991). In Walkerton, drilling done by Golder Associates (2000a) established that the silts and tills in the vicinity of Wells 5, 6, and 7 are only 3 to 4 metres thick in places. Bedrock is even closer to the ground surface in adjacent uplands. Based on our experience at other locations, we anticipate that fractures extend from top to bottom through these silt and till materials. Several researchers have established through tracer tests that rapid horizontal groundwater flow occurs in fractured tills (McKay et al., 1992; D'Astous et al., 1989; McKay et al., 1991). On October 21st 2001 we used tracer dyes to measure downward travel times through about two metres of sandy and silty till near Shelburne (Figure 6). The dye took less than one hour to travel vertically through 2 m of till and 8 m of bedrock and to travel horizontally 30 m in the bedrock to the sampling pump (Figure 7a). A second test nearby showed a travel time of less than two hours downward though the till and over a horizontal distance of 45 m through the bedrock (Figure 7b). These tests indicate that thin overburden deposits cannot be regarded as a protective barrier for underlying groundwater. 3 New hydrogeological data 3.1 Wetlands and Spring B near Well 7 We monitored water levels continuously at Spring B during the summer and fall of 2001. The spring was dry from mid July to early September, after which several major rain events resulted

7
in water flowing into the aquifer for periods of hours to days (Figure 8). By mid-October the spring was discharging continuously though the flow diminishes when either Well 7 or 9 is pumping. We earlier noted the close association between changes in the water chemistry at Spring B and pumping at Well 7 (Worthington et al., 2001, page 22 and Figure 33). The valley to the south-east of Well 7 did not generate runoff in response to fall rains and appears to act as a major area of recharge to the local aquifer. Evidence at the Inquiry showed that Spring A (the Gregg or Duncan Spring) and the nearby spring-fed pond dried up when Well 6 was first installed. This revealed an intimate association between spring flow and pumping of Well 6, and showed that water flow into the spring orifice could have been a source of aquifer contamination. In the absence of tracer testing, Spring A and the valley on both sides of Durham Road must be regarded as possible sources of contamination of Wells 6 and 7 in May 2000. They remain potential entry points for water-borne contaminants of all kinds. 3.2 Response of the aquifer to pumping at Wells 6, 7, and 9 Pumping in karst aquifers often produces an irregular pattern of drawdown in the surrounding aquifer, reflecting axes of preferred flow, and corresponding variability in groundwater velocity. We have processed data from the pumping tests of Wells 6 and 7 (Figure 9a) and of Well 9 (Figure 9b). The former data show a regular pattern around the pumping wells but the latter figure shows irregularity in the form of the drawdown contours. Neither test gave any indication of actual travel times in the aquifer. We strongly recommend that in karst aquifers pumping tests alone should not be used to estimate groundwater velocities or to prepare maps with time of travel contours. 3.3 Contamination in Well 6 Measurements in the summer of 2000 showed that 50% of the inflow to Well 6 was at a depth of 19.2 m (Golder Associates, Interim Report, Exhibit 258, Appendix E). Our own profiling confirmed this major inflow, and indicated that it may be surface water reentering the aquifer (Worthington et al., 2001, Figure 35). A recent water sample collected in the 19m zone showed evidence of contaminated surface water. In the fall of 2001 Well 6 was converted to a monitoring well. Clay plugs were installed at 22-27 m, 31-33 m and 37-45 m, and these separated four monitoring zones. On October 26th 2001 Golder personnel measured the response of these four zones after Well 9 stopped pumping. Over a period of 110 minutes the water level in the three upper zones recovered by 0.28 m, 0.30 m, and 0.32 m, respectively, but the deepest zone recovered by 1.66 m. These measurements are of great significance as they indicate that Well 6 may have acted as a conduit delivering contaminated shallow water to the deep aquifer drawn on by Well 7 in May 2000.

8
The very large recovery of water level measured on October 26th 2001 at the bottom of Well 6 demonstrates that there would have been strong flow of potentially contaminated water down the well during routine pumping of Well 7 in May 2000. The water would have entered the well at a depth of 19 m and flowed down the well to major transmissive horizons at depth. It would have exited the well at one or more of these horizons and flowed to Well 7 in one to two days, as demonstrated by the tracer tests on October 29th 2001 (Figure 10). Well 6 was inactive for over a week in June 2000, and decommissioned after August 2000 because of bacterial contamination. At these times when Well 6 was inactive, Well 7 showed frequent bacterial contamination. Unfortunately, cessation of pumping at Well 6 may have allowed bacteria in the well to be drawn to Well 7. The absence of bacteria at Well 7 during the pumping test in the summer of 2000 is not relevant to these observations since Well 6 was also pumping at that time and thus Well 6 could not have been a conduit for downward movement of bacteria. The three day pumping test at Well 9 is the closest analogy. Bacteria concentrations varied greatly during the test, with maxima of 26 total coliforms per 100 mL and 180 heterotrophic plate counts per mL. Fortunately, no E. coli were measured in the Well 9 water at that time. 4 Determining the cause of bacterial contamination at Wells 5, 6, and 7 (in May 2000) 4.1 Matching of bacterial sources and human cases Sampling for pathogenic bacteria was carried out in the spring and summer of 2000 (Tables 1,2,& 3). There were deaths both from infection by E. coli O157:H7 and by Campylobacter jejuni, and so it is important to ascertain the possible sources of both these bacteria. Genetic matching between water and cattle samples and samples from sick people are shown in Tables 2 and 3. Genetic matching fails in a number of instances, which are shown in bold in Tables 2 and 3. Neither Farm 1 nor Farm 2 was likely to have been the sole source of the pathogenic bacteria implicated in the Walkerton Tragedy. It is possible that Farm 1 was one of the sources of the bacterial contamination of the water supply. However, the lack of genetic matching in six instances in Tables 2 and 3 indicates a supplementary source, though only 11% of cattle were tested. At Farm 2, 38% of cattle were tested. Again, the lack of genetic matching in six instances in Tables 2 and 3 suggests that it was not the sole source.

9
E. coli PFGE pattern A was identified in 150 of 174 human cases. It was discovered in cattle near Well 5. It was also found in surface water near Well 6. In the case of Campylobacter jejuni only phage type 33 was found at Farm 2, and almost half the human cases of Campylobacter jejuni had other phage types, implying unidentified contamination sources. We believe it is not possible to definitively associate the pathogenic bacteria from specific farms with the human cases for the following reasons: 1) Only a minority of cattle were tested for genetic matching of their bacteria to the human
cases at any given farm. 2) There was a lack of genetic testing of Farms 3-7, at which Campylobacter jejuni was
found in cattle. 3) Genetic testing was not undertaken at Farm Z, where E. coli O157:H7 was found in
water. 4) The source of the E. coli O157:H7 PFGE pattern A found in a pipe near Well 6 remains
indeterminate. 5) Pathogenic bacteria sources anywhere in the upstream part of the Silver Creek catchment
are now known to have potentially reached Well 5 within a day or so. 6) We found no indication that manure imported and spread on non-livestock farms had
been investigated. 4.2 Potential sources and pathways to Well 5 The evidence for bacterial contamination of Well 5 via groundwater flow in May 2000 includes $ E. coli in samples from Well 5 in late May and June 2000 $ Genetic matches between most human cases and Farm 2, although many of these human
cases also match other sources $ Rapid groundwater flow demonstrated by tracer testing $ Statistically significant correlation between the distribution of human cases in Walkerton
and distribution of water from Well 5 through the municipal water lines. Overland flow to Well 5 might have brought some pathogenic bacteria to the well, though a number of cases occurred before the heavy rains associated with the peak of the epidemic. We believe that overland flow would have only provided a restricted contribution at most. The combination of thin overburden and carbonate bedrock provided fast pathways for pathogenic bacteria to reach Well 5 via a groundwater flow path from two sources, which are shown in Figure 44 of our July 2001 report. These are: $ Farms within the groundwater catchment for Well 5 and the adjacent springs.

10
$ Farms within the Silver Creek surface catchment to the south of Highway 9. In our view the wide distribution of potential sources and remaining uncertainties about the conditions controlling groundwater and surface water interaction make it impossible to give an accurate description of how bacterial contamination reached Well 5. 4.3 Potential sources and pathways to Wells 6 and 7 The evidence for possible bacterial contamination at Well 6 and/or 7 via groundwater flow in May 2000 includes $ Intermittent bacterial contamination occurred in Wells 6 and 7 in the summer of 2000. $ E. coli O157:H7 human cases and water from pipe near Well 6 are genetically matched. $ There is a genetic match for some E. coli and some Campylobacter jejuni human cases
and Farm 1. $ Tracer testing demonstrates rapid, unfiltered groundwater flow in the area. $ Springs that cease flowing when the municipal wells are pumping may be potential entry
points for contaminated surface water. Although Spring B would not have ceased flowing during May 2000, it is quite possible that Spring A (the Gregg or Duncan Spring) and/or the wetland nearby did dry up and were input points to the aquifer for pathogenic bacteria.
$ The lack of chlorination at Well 7 in the period May 2nd to May 9th 2000, which includes May 8th when there was substantial rain, and which precedes the human cases by a few days.
The lack of E. coli in Wells 6 and 7 in late May and in June does not provide evidence that these wells were not contaminated in early or mid May. Subsequent routine sampling showed that significant bacterial contamination at the wells typically lasts for only hours to days. The combination of thin overburden and carbonate bedrock provided fast pathways for pathogenic bacteria to reach Well 6 and 7 via a groundwater flow path from several sources, which are shown in Figure 44 of our July 2001 report. These are: $ Farms in the vicinity of the wetland immediately south of Durham Road, as shown in
Figure 10. $ Farms with shallow overburden (a few metres or less in thickness) and within the
indeterminate capture zone for groundwater flow to Wells 6 and 7 and nearby springs.
11
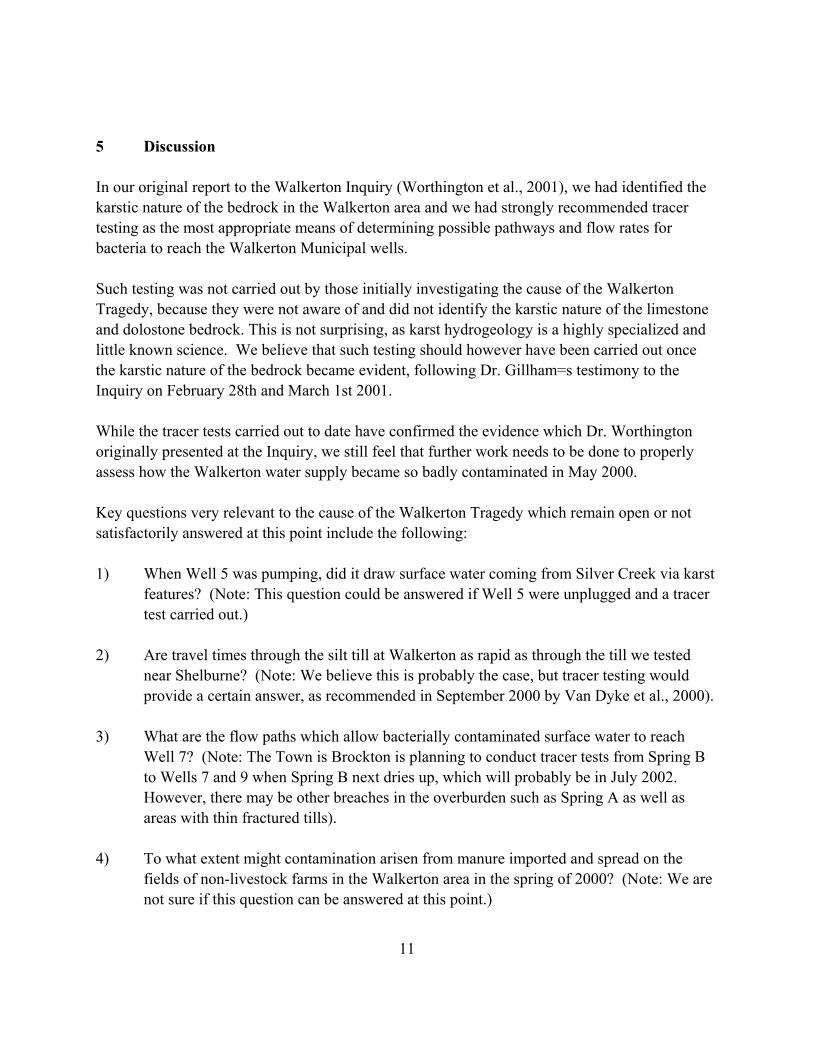
5 Discussion In our original report to the Walkerton Inquiry (Worthington et al., 2001), we had identified the karstic nature of the bedrock in the Walkerton area and we had strongly recommended tracer testing as the most appropriate means of determining possible pathways and flow rates for bacteria to reach the Walkerton Municipal wells. Such testing was not carried out by those initially investigating the cause of the Walkerton Tragedy, because they were not aware of and did not identify the karstic nature of the limestone and dolostone bedrock. This is not surprising, as karst hydrogeology is a highly specialized and little known science. We believe that such testing should however have been carried out once the karstic nature of the bedrock became evident, following Dr. Gillham=s testimony to the Inquiry on February 28th and March 1st 2001. While the tracer tests carried out to date have confirmed the evidence which Dr. Worthington originally presented at the Inquiry, we still feel that further work needs to be done to properly assess how the Walkerton water supply became so badly contaminated in May 2000. Key questions very relevant to the cause of the Walkerton Tragedy which remain open or not satisfactorily answered at this point include the following: 1) When Well 5 was pumping, did it draw surface water coming from Silver Creek via karst
features? (Note: This question could be answered if Well 5 were unplugged and a tracer test carried out.)
2) Are travel times through the silt till at Walkerton as rapid as through the till we tested
near Shelburne? (Note: We believe this is probably the case, but tracer testing would provide a certain answer, as recommended in September 2000 by Van Dyke et al., 2000).
3) What are the flow paths which allow bacterially contaminated surface water to reach
Well 7? (Note: The Town is Brockton is planning to conduct tracer tests from Spring B to Wells 7 and 9 when Spring B next dries up, which will probably be in July 2002. However, there may be other breaches in the overburden such as Spring A as well as areas with thin fractured tills).
4) To what extent might contamination arisen from manure imported and spread on the
fields of non-livestock farms in the Walkerton area in the spring of 2000? (Note: We are not sure if this question can be answered at this point.)

12
6 Conclusions 1) In our view the available evidence strongly suggests that the bacterial contamination in
the Walkerton water supply in May 2000 came from a number of sources at different farms.
2) We believe that the most likely pathways for the bacteria from these sources to reach the
Walkerton wells are rapid downward flow through fractures or other breaches in the overburden, followed by rapid groundwater flow through the bedrock via karst features to the Walkerton municipal wells.
3) A number of tracer tests have now been carried out, and these have yielded the following
results:
a) Rapid groundwater flow rates (of up to hundreds of metres per day) which are typical of karst aquifers occur in the vicinity of the Walkerton municipal wells. For example, the travel time for groundwater to cover the 350 metres from Well 6 to Well 7 is less than two days.
b) The borehole of Well 6 (and likely those of other wells in the area) would have
been an effective conduit for transmitting bacterially contaminated shallow groundwater downward to deeper aquifer units. From there, the bacteria would have travelled rapidly to Well 7 via karst conduits in the bedrock.
c) Surface water from Silver Creek (which is a "losing stream" in the area
upgradient of Well 5 and the nearby springs) rapidly travels to both a domestic well half way between the creek and Well 5 and also to the springs near Well 5. This provides solid evidence that bacterially contaminated surface water from Silver Creek could have been drawn to Well 5 via karst conduits in the dolostone bedrock under pumping conditions.
d) A downward tracer test through silt till overburden from a field to a karst cave
near Shelburne provided strong evidence that rapid downward groundwater flow through fractures in the silt till overburden followed by rapid flow through karst conduits in the bedrock is a plausible pathway for bacterially contaminated surface water to have reached any of Wells 5, 6, and 7 in May 2000.

13
4) While bacterially contaminated groundwater from Well 5 is implicated in the majority of the human illnesses in May 2000, we see strong evidence to suggest that Well 6 and/or Well 7 could have been a secondary source of bacterially contaminated groundwater which contributed to the human illnesses in the Walkerton Tragedy.
5) We believe it is not possible to definitively associate the pathogenic bacteria from
specific farms with the human cases of illness which occurred during the Walkerton Tragedy. In particular, in our view the wide distribution of potential sources and the remaining uncertainties about the conditions controlling groundwater and surface water interactions make it impossible to give an accurate description of how bacterial contamination reached Well 5.
6) We believe that overland flow would have only provided a restricted contribution at most
to the bacterial contamination at Well 5. Protection of the areas around wells from ingress of contaminated surface water by means of Wellhead Protection Zones is an excellent concept. However, we believe that even if such protection had been in place before May 2000, it would not have prevented the Walkerton Tragedy since most or all bacterial contamination reached the well(s) via groundwater flow paths.
7) Where the movement of contaminants is of interest in either thin overburden deposits or
in carbonate bedrock, it would be wise to adopt a precautionary approach and assume that there could be rapid movement of contaminants through interconnected fractures or karst conduits. Such flow is not incorporated into standard computer models and consequently these models often yield inaccurate results in areas within thin overburden or carbonate bedrock.
References D'Astous, A.Y., Ruland, W.W., Bruce, R.J., Cherry, J.A., and Gillham, R.W. 1989. Fracture
Effects in the Shallow Groundwater Zone in Weathered Sarnia Area Clay. Canadian Geotechnical Journal, Vol. 26, No. 1, p. 43-56.
Gillham, 2001, Hydrologic environment as it pertains to bacterial contamination of the water
supply in Walkerton, Ontario. Presentation prepared for Walkerton Inquiry, 50 p., (Exhibit 256).
Golder Associates, 2000a, Interim report on hydrogeological assessment, well integrity testing,
geophysical surveys and land use inventory, bacteriological impacts, Walkerton town

14
wells, Municipality of Brockton, County of Bruce, Ontario, 69p. plus figures, tables and appendices (Exhibit 258).
Golder Associates, 2000b, Report on hydrogeological assessment, bacteriological impacts,
Walkerton town wells, Municipality of Brockton, County of Bruce, Ontario, 50p. plus figures, tables and appendices, (Exhibit 259).
Golder Associates, 2001, Report on hydrogeological assessment, Walkerton Well 9,
Municipality of Brockton, County of Bruce, Ontario, 15 p. plus figures, tables and appendices.
McKay, L.D., Gillham, R.W., and Cherry, J.A. 1992. Field Experiments in a Fractured Clay Till:
2. Solute and Colloid Transport. Water Resources Research, Vol. 29, No. 12, p. 3879-3890.
McKay, L.D., Cherry, J.A., Bales, R.C., Yahya, M.T., and Gerba, C,P. 1991. A field example of
bacteriophage as tracers of fracture flow. Environmental Science and Technology, Vol. 27, No. 6, p. 1075-1079
Ruland, W.W., Cherry, J.A., and Feenstra, S. 1991.The Depth of Fractures and Active Ground
Water Flow in a Clayey Till Plain in Southwestern Ontario. Journal of Ground Water, Vol. 29, No. 3, p. 405-417.
Van Dyke, M., A. Scott, D. Van Bakel, L. Gin, G. Palmateer and R. Turnbull, 2000,
Investigations to trace the source of contamination and monitor disinfection of the drinking water system in Walkerton, Ontario, 91 p. Appendix A in: The Ontario Clean Water Agency=s report to the Walkerton Public Utilities Commission on the operational measures taken to address the E. coli water contamination in the town of Walkerton, Exhibit 228.
Worthington, S.R.H., Smart, C.C., and Ruland, W., 2001. Karst Hydrogeological Investigations
at Walkerton. Exhibit 416.

15
Table 1 E. coli O157:H7 from sampling by GAP Enviromicrobial Services and
OCWA GAP sample #
Date collected d/m/y
Site description
Matrix
Further testing
18997
08/06/00
4" flex pipe discharging to NE side of pond (near Well 6)
water
APositive for verotoxin production@; Ahad a DNA fingerprint identical to strains isolated from patients in Walkerton during the outbreak@ (Exhibit 228, Tab A, p. 17-18). The sample had PFGE pattern A (Transcripts, February 26 2001, p. 197)
19528
22/06/00
Farm Z (near Well 6) - sump beneath stairs
water
Anot tested for verotoxin production@. (Exhibit 228, Tab A, p. 20)
19529
22/06/00
Farm Z (near Well 6) - water trough
water
Anot tested for verotoxin production@. (Exhibit 228, Tab A, p. 20)

16
Table 2 E. coli matching between cattle, water samples and human cases (from BGOSHU report, Exhibit 203, except as noted)
Pathogen
Number of human cases from stool tests
Farm 1 (near Wells 6 and 7) 20 of 180 cattle tested
Farm 2 (near Well 5) 38 of 100 cattle tested
Pipe near Well 6
E. coli O157
174
Yes
Yes
Yes*
E. coli PFGE pattern A
150 of 174
Zero
6 of 38
Yes #
E. coli PFGE pattern A1
2 of 174
4 of 20
Zero
not known
E. coli PFGE pattern A4
2 of 174
Zero
yes, initial testing
not known
E. coli other PFGE patterns
presumably 20
Zero
Zero
not known
E. coli O157 phage type 14
147 of 174
Zero
6 of 38
not known
E. coli O157 phage type 14a
3 of 174
4 of 20
Zero
not known
E. coli O157 other phage types
presumably 24
Zero
Zero
not known
E.coli positive for verotoxin production
Yes*
E. coli O157 verotoxin 2 (VT2)
majority
not known
6 of 38
not known
E. coli O157 verotoxin 1 (VT1)
minority
not known
0 of 38
not known
Notes: Bold The cattle tested on this farm did not have this type of bacteria * GAP Enviromicrobial Services Inc report (Exhibit 228, Appendix A, p. 17-18) # Transcripts, February 26th 2001, p. 197 Caveats: 1) Not all cattle on any farm were tested 2) The testing was done several weeks after the contamination of the wells 3) The upstream part of the Silver Creek catchment is more than 4 km from Well 5, and there may
be cattle in this area which were not tested 4) It appears that there may be non-livestock farms which may have imported manure and spread
this on fields, and where no testing took place.

17
Table 3 Campylobacter matching between cattle, water samples and human cases
Pathogen
Number of human cases from stool tests
Farm 1 (near Wells 6 and 7) 20 of 180 cattle tested
Farm 2 (near Well 5) 38 of 100 cattle tested
Farms 3 to 7
Campylobacter
116
10 of 20
7 of 38
Yes
Campylobacter jejuni
between 98 and 109
9 of 20
7 of 38
Yes
C. jejuni phage type 33
56
0
7 of 38
unknown
C. jejuni other phage types
presumably between 42 and 53
9 of 20 (phage types 2, 13, 19 var, 44, 71)
0 of 38
unknown
Legend: Bold The cattle tested on this farm did not have this type of bacteria Caveats: 1) Not all cattle on any farm were tested 2) The testing was done several weeks after the contamination of the wells 3) The upstream part of the Silver Creek catchment is more than 4 km from Well 5, and
there may be cattle in this area which were not tested 4) It appears that there may be non-livestock farms which may have imported manure and
spread this on fields, and where no testing took place.

18
Figure 1 Tracer breakthrough curves for the tracer tests to Well 7 on October 29 2001

19
Figure 2 Trajectories and travel times for the tracer tests started on October 29th 2001, showing velocities of 200 - 500 metres per day in the carbonate bedrock.
720 hour travel timefrom MODFLOW
5 hour traveltime fromtracer test
0 100 m
Spring B
Durham RoadElora R
oad
26 hour travel
time fromtracer test
Well 7
Well 9
Well 6

20
12
5
00
0
1.2
1.8
1.8
27
Well 5
dry creek bed
0 1000 metres
Discharge in litres per second
Figure 3 Discharge in Silver Creek and its tributaries on August 28th 2001, showing the 1200 metre stretch of creek bed with no flow and the putative flow path from the sinking creek to the springs beside Well 5

21
Well5
MW11D
Potential flow fro
m
Silver Creek
to Well 5
MW8D
Springs
A
B
Highway 9
tracer injection point1
2
3
4
domesticwell
290
290
SilverCreek
MW11
SilverCreek
overburden
bedrock
MW8
water level on August 30 2000
water level after24 hours pumping
at Well 5
springsWell
5
major inflowto Well 5
2780 100 200 300 400 500 600 700
280
282
284
286
288
Elev
atio
n (m
etre
s ab
ove
sea
leve
l) 290
Distance (metres)
Figure 4 Relationship between Silver Creek and Well 5 a) Plan of the area b) Profile along line A - B in the plan, showing the potential for water to flow from Silver Creek to the springs at Well 5, and the greater potential when Well 5 was pumping. The vertical exaggeration is 30.

22
23
tilldolostone
cave shaft,flooded below
10 m depth
water table
30 m
pump
discharge pointfrom pump hoseand location offirst dye injection
Figure 6 Tracer testing at a vertical cave shaft at Shelburne on October 21st 2001 a) Injection of fluorescein dye into the discharge being pumped from the flooded shaft (top) b) sketch cross-section showing the pumping from the shaft and the flow path of the dye (bottom)
flow path for dye

24

25
3hours
20hours
Figure 8 Correlation between daily precipitation (grey columns), inflow events when water flowed from the surface ditch into Spring B (in red)and outflow events when Spring B flowed (in blue)
Wat
er le
vel a
bove
V-n
otch
in w
eir (
mm
) or p
reci
pita
tion
(mm
)
SpringoutflowwhenWell 9off
38hours
53hours
74hours
Reversingflow
Sept 1 6 11 16 21 26 6 11Oct 1

26
3.1
3.4
7.1
16.1 4.0
3.0
>1.4
4
1.8
5.5
4.8
1.21.0
2.11.35
3
4
2
1.5
2.0 3
4
Figure 9 Drawdowns (in metres) in response to pumping tests at Wells 6 and 7 in September 2000 (top) and at Well 9 in June 2001 (bottom). Data from Golder Associates (2000, 2001). The first test has a response found in both simple porous medium and in karst aquifers. The second test has a much less regular response as is often found in karst aquifers.

27
overburden
bedrock
Spring A (Gregg Spring)and wetland
1 - 2 day travel time
Well6
Well7
Figure 10 Potential pathway for surface water to travel to Well 7 in the period May 2 to May 9 2000.
major inflow pointin Well 6