Towards Scenarios of U.S. Demographic Change the Scenarios and Interpretive Science Coordinating...
62
Towards Scenarios of U.S. Demographic Change: Workshop Report July 2015 Report of a workshop on June 23-24, 2014 organized under the auspices of the Scenarios and Interpretive Science Coordinating Group, U.S. Global Change Research Program, and sponsored by the U.S. Department of Energy and U.S. Environmental Protection Agency. Prepared by ICF International under contract to EPA; Contract Number EP-C-14-001 Photo Credit (center photo): U.S. Census
Transcript of Towards Scenarios of U.S. Demographic Change the Scenarios and Interpretive Science Coordinating...

Towards Scenarios of
U.S. Demographic
Change:
Workshop Report
July 2015
Report of a workshop on June 23-24, 2014 organized under the auspices of the Scenarios
and Interpretive Science Coordinating Group, U.S. Global Change Research Program, and sponsored by the U.S. Department of Energy and U.S. Environmental Protection Agency.
Prepared by ICF International under contract to EPA; Contract Number EP-C-14-001
Photo Credit (center photo): U.S. Census

Disclaimer
The document was prepared by ICF International, an EPA contractor, as a general record of
discussions during the workshop. The document captures the main points and highlights of the
discussions and may include brief summaries of work group sessions. It is not a complete record of all details discussed, nor does it interpret or elaborate upon matters that were
incomplete or unclear. Statements represent the individual views of the workshop participants
and do not necessarily reflect the views of any U.S. federal agency.

Acknowledgements
The Workshop Federal Coordinating Group (FCG) would like to thank the Science Steering
Committee and participants for contributing their time and expertise to the workshop. This
report reflects their invaluable contributions. The FCG would especially like to thank Brian
O’Neill and Richard Moss for their help in organizing and leading the workshop sessions. The FCG is grateful to the Oak Ridge Associated Universitites team for their logistical support. We
extend sincere gratitude to the ICF International author team for their assistance in developing
the workshop report. Finally, the FCG would like to express a special thanks to Alison Delgado
for her help in coordinating the workshop and report development process.

About the Scenarios and Interpretive Science Coordinating Group
The Scenarios and Interpretive Science Coordinating Group (SISCG) of the United States
Global Change Research Program fosters interagency collaboration with the goal of building the
foundations for a coordinated U.S. scenario science enterprise. This effort is motivated by
shared agency information needs for quantitative and qualitative scenario-related products
aligned around regions, sectors, systems, and topics over spatial and temporal scales of interest.
The major objectives of the SISCG include:
Advancing collaborative science around critical knowledge gaps;
Enhancing methodologies for use-inspired scenario development, risk framing, and
contextual interpretation;
Developing the next generation of scenario work products for model intercomparison
efforts, national and international assessment, and related analyses; and
Improving interagency communications, coordination, and accessibility to knowledge,
work products, and technical resources.

Table of Contents
List of Acronyms ............................................................................................................................. i
Executive Summary ........................................................................................................................ ii
Meeting User Needs for Population Projections ........................................................................ iii
Capabilities for Developing U.S. Population Scenarios ............................................................ iv
Key Insights from Workshop Discussions .................................................................................. v
Next Steps: Moving Forward with U.S. Demographic Change Scenarios ................................. v
1. Workshop Process ................................................................................................................... 1
Scenarios and Interpretive Science Coordinating Group ............................................................ 1
Background on the U.S. Demographic Change Workshop ......................................................... 1
2. Workshop Agenda and the Workshop Report Format ............................................................ 3
Details of the Workshop Agenda ................................................................................................ 3
Structure of the Workshop Report .............................................................................................. 4
3. Meeting User Needs for Population Projections ..................................................................... 4
User Communities ....................................................................................................................... 5
Data Needs for Population Projections ....................................................................................... 7
Meeting User Needs: Projection Methods for Estimating Population ...................................... 12
4. Capabilities for Developing U.S. Population Scenarios ........................................................ 16
Characterizing the Future: Projections and Scenarios ............................................................... 17
Global and Societal Contexts .................................................................................................... 20
Available Data, Methods, and Tools ......................................................................................... 23
Capabilities: Revisiting the Issues ............................................................................................. 27
5. Key Insights from Workshop Discussions ............................................................................ 28
6. Next Steps: Moving Forward with U.S. Demographic Change Scenarios ............................ 33
Adopt Measures to Improve Data Coordination and Integration .............................................. 33
Conduct Research and Develop Methods ................................................................................. 34
Develop U.S. Population Scenarios .......................................................................................... 34
References ..................................................................................................................................... 36
Appendix A: Committees ............................................................................................................. 40
Appendix B: Workshop Agenda ................................................................................................... 41
Appendix C: List of Participants................................................................................................... 45
Appendix D: Summary of Findings from Workshop Background Research ............................... 47

i
List of Acronyms
ACS – American Community Survey
CMIP – Coupled Model Inter-Comparison Project
DOD – Department of Defense
DOE – Department of Energy
EPA – Environmental Protection Agency
GCAM – Global Change Assessment Model
GEO – Global Environmental Outlook
HHS – Health and Human Services
ICLUS – Integrated Climate and Land Use Scenarios
IPCC – Intergovernmental Panel on Climate Change
MA – Millennium Ecosystem Assessment
MAPE – Mean Absolute Percent Error
NCA – National Climate Assessment
NGO – Non-Governmental Organization
RCPs – Representative Concentration Pathways
SISCG – Scenarios and Interpretive Science Coordinating Group
SSPs – Shared Socioeconomic Pathways
SRES – Special Report on Emissions Scenarios
UNEP – United Nations Environment Program
USGCRP – United States Global Change Research Program
USGS – United States Geological Survey
USFS – United States Forest Service

ii
Executive Summary
The Scenarios and Interpretive Science Coordinating Group (SISCG) is an interagency
coordinating group, supporting the U.S. Global Change Research Program (USGCRP). The
SISCG convened the Towards Scenarios of U.S. Demographic Change Workshop in Rockville,
Maryland on June 23 and 24, 2014 to assess key factors in the development of long-term
population and demographic scenarios for use in interdisciplinary social and environmental
applications, with a strong focus on climate change. The workshop brought together 52 experts
from federal and state agencies, non-governmental organizations (NGOs), and research
institutions with backgrounds in climate change scenarios, environmental change, demographics,
and human health. Over the course of two days, participants explored the needs of the user
communities and the capabilities of the modeling community to meet these needs, and identified
next steps. This workshop report synthesizes the presentations and discussions held during the
workshop (as well as background materials and webinars held in advance of the workshop). The
sections below briefly summarize the report, paralleling its organization.
Text Box ES-1. IPCC Definitions of Future Characterizations
Some key terms from the IPCC typology are defined below. More information is available from the IPCC
reports.
Scenario is a coherent, internally consistent, and plausible description of a possible future state of the world,
which may be quantitative, qualitative, or both. The components of a scenario are often linked by an overarching
logic, for example a storyline that represents a qualitative, internally consistent narrative of how the future may
evolve.
Storylines describe the principal trends in key drivers and relationships among these drivers. Storylines may
be stand-alone, but more often underpin quantitative projections.
Projection is any description of the future and the pathway leading to it. In the climate world, projections are
often model-derived estimates of future conditions for an element (such as population) of an integrated system.
Projections are generally less comprehensive than scenarios. Projections may be probabilistic, while
probabilities are not ascribed to scenarios.
Probabilistic futures are futures with ascribed probabilities. Conditional probabilistic futures are subject to
specific underlying assumptions. Assigned probabilities may be imprecise or qualitative, as well as quantitative.
A prediction or forecast is a statement that something will happen in the future, based on what is known
today, and on the initial conditions that exist. An important part of a prediction is our degree of belief that it will
come true.
Sources: Carter et al., 2007; Solomon et al., 2007; Weaver et al., 2013.

iii
Although often used interchangeably to refer generically to a future characterization, the terms
“prediction,” “forecast,” “projection,” and “scenario” have different meanings, particularly for
the community involved in climate research (see Text Box ES-1). Moreover, different users may
have needs for different types of futures. For example, some users may rely on probabilistic
predictions that seek to answer a question of the type of “What will happen in the future?” while
others may rely on projections that are more in the nature of “what if” statements, and still others
may use scenarios identifying plausible descriptions of future states of the world. Some
workshop participants, particularly state and local government researchers, were more familiar
with the concepts of prediction or projection, while climate researchers viewed the scenario
approach as being more applicable, in part due to the long-term nature of (i.e., 100+ years) of
climate change. As discussed below and in the workshop report, over the course of the
workshop, commonalities and differences among the approaches and viewpoints were discussed
and assessed.
Meeting User Needs for Population Projections
Federal, state, and local agencies and the private sector use population projections to inform a
variety of regulatory and programmatic decisions and project design, for budget planning, and to
support the development of public policy. For example, population projections may be used to
develop estimates of school enrollment or to support annual appropriations within a state. The
population series provided by the U.S. Census Bureau are key building blocks for projections of
demographic and socioeconomic variables used by federal and state agencies, such as the Old
Age Survivors and Disability Insurance (OASDI) program (also known as Social Security), as
well as other types of projections, such as the projected demand and use of natural resources
developed by the U.S. Forest Service. In addition, climate change researchers inside and outside
the government are consumers of population projections; the community conducting impacts,
adaptation, and vulnerability (IAV) assessments use long-term demographic changes, which can
be challenging to develop at the time scale and granularity needed to support assessment.
The diversity of user communities generates a demand for population projections that span a
range of spatial, temporal, and demographic criteria. Different uses will require different
demographic details or groups, different time spans for the projection, and different geographic
coverage, as well as different levels of resolution and detail (ranging, for example, from national
projections all the way down to municipalities or U.S. Census tracts). Some users may need both
detailed and aggregate data, and so the capabilities of the user group to further refine or adapt the
population projection may also determine data needs.
Conventional population projections focus on demographic variables such as age, sex, and race,
and methods for projecting these variables are well understood and commonly applied. For some
purposes (e.g., determining environmental vulnerability or projecting health outcomes),
demographic projections that include socieconomic variables—such as income or education—
may be needed. These variables can be more difficult to project because they rely on behavioral

iv
factors and future policy decisions. Migration can also be difficult to project, increasing the
uncertainty of projections made at small geographic scales. Thus, the uncertainty of a projection
will depend on spatial resolution, time horizon, demographic characteristics, and socioeconomic
variables. Discussions at the workshop stressed the tradeoffs between different characteristics of
projections. Discussions also emphasized that more interaction between users and producers of
demographic projections is needed so that they can arrive at a common understanding of the
uncertainties and limitations associated with projections of particular characteristics and
time/space scales.
Capabilities for Developing U.S. Population Scenarios
Plausible futures can take different forms, and may require particular characteristics in order to
meet user needs. Projection is a relatively broad term, representing a description of the future
that is conditional on both current conditions and on how future conditions unfold. A projection
can be probabilistic or deterministic (without ascribed probability). A prediction, in contrast, is
based on what is known today and on the initial conditions, assuming that the future outcome
will not be greatly influenced by unpredictable or uncertain future conditions. Climate change
researchers also frequently make use of scenarios, which are coherent descriptions of a possible
future state of the world in quantitative or qualitative terms. Unlike projections, scenarios do not
have ascribed probability.
One of the issues prominent during discussions was the difference between projections and
scenarios, and the type of approach that can best serve different user communities. Participants
from the climate change community generally prefer a scenario approach because it reflects the
greater uncertainty about the future over the very long term and highlights the importance of
assumptions about key variables, including climate policies, economic growth, technological
change, and migration patterns. However, federal and state agencies may prefer a single
projection series on which to base policy and programmatic decisions.
In practical applications of projections to policy issues, the divergence between a scenario
approach and a projection approach is not always as great as the above discussion might imply.
Planners and other public officials may use scenario building or scenario-based planning. Some
users also employ “visioning” to develop different futures on which the projections are based, or
to bracket possible futures to reflect uncertainty in key drivers. While discussions and
presentations at the workshop clarified the differences and similarities in these approaches, many
of the demographers at the meeting expressed significant reservations about making long-term
demographic projections, especially for small areas. It will be particularly important to provide
context and guidance for such projections.
A range of global scenarios is available for use in climate change research, including the Special
Report on Emissions Scenarios (SRES), the Shared Socioeconomic Pathways (SSPs), the
Representative Concentration Pathways (RCPs), and scenarios developed for the Millennium
Ecosystem Assessment. The workshop explored issues in developing national scenarios and

v
population projections that are consistent with global scenarios. Discussion included how
consistency might be defined, and how to develop national scenarios that reflect national
conditions without being overly constrained by global scenarios.
Presentations at the workshop addressed the types of methods that are available to project
population at the national and subnational levels, and the strengths and weaknesses of alternative
methods. Methods that were discussed included cohort-component methods, proportional
scaling, trend extrapolation, and modeling approaches, such as microsimulation. Participants
pointed out that different methods (or combinations of methods) may be appropriate depending
on the scale of the projection, the demographic and socioeconomic variables to be projected, and
available resources and data. Participants also pointed out differences between top-down
methods where national or state level projections are distributed to smaller scales and bottom-up
methods that aggregate projections made at local levels. While methodological improvements
can be made, confidence in projection methods and data generally decreases with smaller
geographies and increased demographic detail.
Key Insights from Workshop Discussions
Key insights from the workshop included the following:
Developing population projections that have a high level of spatial resolution and include
socioeconomic characteristics of the population is difficult and sometimes infeasible.
Projecting over a long time horizon increases uncertainty.
Sub-county population projections are needed for climate impacts research and
adaptation planning.
For integrated climate change scenarios, demographic projections are not predictions of
the future; however, they should be well-grounded characterizations of plausible future
outcomes.
Maintaining and improving demographic data is essential to producing high-quality
population projections for use in global change scenarios.
Methods for producing national-level, spatially explicit population projections are at
relatively early phases of development; efforts to compare methods and model
simulations would facilitate further development of methods as well as help define the
research agenda.
Developing plausible alternative futures for migration, particularly internal migration,
would provide the most added value to a U.S. population scenarios effort.
It would be useful for U.S. population scenarios to be consistent with global scenarios;
however consistency should not overly constrain the development of U.S. scenarios.
Next Steps: Moving Forward with U.S. Demographic Change Scenarios
U.S. population scenarios would improve the ability of USGCRP to inform ongoing climate
impacts research, Integrated Assessment and Impacts, Adaptation, and Vulnerability models, the

vi
National Climate Assessment, and decision making at all levels of government and in the private
sector. Such scenarios could also form the basis of quantitative projections using demographic
and other modeling techniques.
Workshop participants offered many suggestions for moving a USGCRP scenario enterprise
forward. These largely fell in three main categories:
Adopt measures to improve data coordination and integration. Recommendations in this
area went beyond inventorying and evaluating existing datasets to determine their utility for
population scenarios. Several participants noted the need to develop coordinated information
networks around demographic and non-demographic factors. For example, collecting
demographic and non-demographic data contemporaneously would facilitate pooling data
efficiently. Standardized metadata protocols and consistent geospatial data formats would
facilitate integration and research on important relationships. Educating users of demographic
scenarios about their limitations as well as the need to reach outside of traditional USGCRP
communities (e.g., the U.S. Census) were also recommended.
Conduct research and develop methods. Workshop participants identified a number of
research activities that would advance our understanding and ability to project human
populations. These included a Model Inter-comparison Project (MIP) to compare national-scale
spatially explicit projection methods, a "bake off" between alternative approaches to allocate
populations at sub-county levels, and basic research to discover generalizable relationships
between non-demographic variables and how they influence population
size/composition/distribution over time. Improving methods to understand U.S. migration
dynamics was highlighted by participants as key to reducing uncertainty in spatially explicit
population projections. Exploring hierarchical approaches for developing projections with scale-
appropriate population characteristics and investigating the utility of new data sources such as
social media, “big data,” and remote sensing data were additional suggestions by workshop
participants. More specifically related to climate change, participants recommended exploring
how climate change impacts, especially disruptive events, can be incorporated into demographic
scenarios and projections.
Develop U.S. population scenarios. Workshop recommendations included an evaluation of
IPCC’s Representative Concentration Pathways and Shared Socioeconomic Pathways, including
comparisons with previous global scenario efforts to identify similarities and points of
divergence at national, regional, state, and county levels. A pilot project focused on U.S.
scenarios feeding into the next National Climate Assessment was also highlighted. More
specifically scenarios of migration between U.S. regions and among states could be used to
explore situations of particular interest to regional stakeholders. Scenarios of urban development
patterns, such as urban infill, dispersion to exurban and rural areas and consolidation of suburban
centers could serve a similar purpose for local and community planners. In efforts to develop

vii
U.S. population scenarios, workshop participants noted it would be important to engage
demographers in developing national, spatially explicit population scenarios. Equally important
would be to work with end users/local governments to ensure such scenarios can be merged with
participatory, bottom-up scenarios that can incorporate detailed, localized data (e.g., zoning
changes, housing development, and tax rates/assessments).

1
1. Workshop Process
Scenarios and Interpretive Science Coordinating Group
The U.S. Global Change Research Program’s (USGCRP) mission is “to build a knowledge base
that informs human responses to climate and global change through coordinated and integrated
federal programs of research, education, communication, and decision support” (USGCRP,
2014a). Within USGCRP, the goal of the Scenarios and Interpretive Science Coordinating Group
(SISCG) is to build a foundation for a science-based scenario enterprise that responds to shared-
agency needs for quantitative and qualitative scenarios-related products. In particular, the SISCG
aims to:
Advance collaborative science on critical gaps.
Enhance methodologies for use-inspired scenario development, risk framing, and
contextual interpretation.
Develop the next generation scenario work products for model inter-comparisons,
assessments, and analyses, including coordinated uses such as for the National Climate
Assessment (NCA), Intergovernmental Panel on Climate Change (IPCC), and the
Coupled Model Inter-comparison Project (CMIP).
Improve interagency communications, coordination, and accessibility to knowledge,
work products, and technical resources (USGCRP, 2014b).
As part of its ongoing efforts, the SISCG is conducting a series of workshops to elicit expert
opinion on the state of the science and for further defining long-term needs for the science. In the
near term, one of the SISCG’s top priorities is to better understand the human dimensions of
climate and global change scenarios. To this end, the SISCG organized workshops focusing on
land use and land cover change, U.S. demographic change, and is in the process of organizing an
additional workshop on regional economics.
Background on the U.S. Demographic Change Workshop
The SISCG convened the Towards Scenarios of U.S. Demographic Change Workshop in
Rockville, Maryland on June 23 and 24, 2014. The workshop was coordinated and supported by
member agencies, including U.S. Department of Energy (DOE), U.S. Environmental Protection
Agency (EPA), National Aeronautics and Space Administration (NASA), National Oceanic and
Atmospheric Administration (NOAA), U.S. Department of Defense (DOD), U.S. Department of Agriculture Forest Service (USFS), and U.S. Geological Survey (USGS).
Acknowledging the need for a coordinated, multi-disciplinary effort across the fields of climate
change and demographics, the SISCG planned the workshop in consultation with researchers and
decision makers from these fields. The goal of this workshop was to assess key factors in the

2
production of long-term population and demographics scenarios for use in interdisciplinary
social and environmental applications—with a strong focus on climate change.
The objectives for the Towards Scenarios of U.S. Demographic Change Workshop included:
Expanding the participants’ knowledge of key user needs for population scenarios;
Exploring new and existing methodologies and data for population characteristics and
geographic scales (including the data limitations); and
Examining the pros and cons of linking U.S. scenarios to global scenarios (USGCRP,
2014c).
To accomplish these objectives, the workshop brought together 52 experts with backgrounds in
climate change scenarios, environmental change, demographics, and human health. These
experts from state and federal agencies, non-governmental organizations (NGOs), and research
institutions, gathered to discuss the current state of the science and clarify both short-term and
long-term goals. (Appendix C: List of Participants contains the full list of workshop
participants.) In addition to the workshop events on June 23 and 24, 2014, background
information was distributed to workshop participants in advance of the workshop, and two
webinars conducted prior to the workshop provided information on U.S. socioeconomic
scenarios and land change modeling.1 This information was available to all workshop
participants, and is reflected in this synthesis report.
In the workshop, participants sought to identify:
End Uses. Characterizing end uses for population/migration scenarios, and narrowing the
set to high-priority end uses that could inform both discussions at the workshop and post-
workshop activities.
Drivers. Identifying key natural, physical, socioeconomic, and policy variables affecting
population/migration change.
Capacity. Inventorying existing data, modeling, and methodological capabilities that can
be leveraged and serve as foundational resources.
Gaps. Identifying key gaps in data, modeling, and analytical capacity related to
population/migration to inform future research needs.
Observational Intersects. Exploring the unique contributions and intersections of both
observationally-based and modeling-based methods for evaluating population/migration
and projecting future change.
Opportunities for Scenario Building. Constructing preliminary population/migration
scenarios to gain insights into framing, contextual variations, methodological approaches,
and paths forward for developing U.S. population/demographics-focused scenarios.
1 Background papers and recordings of the webinars held in advance of the workshop are available on USGCRP’s
website for the workshop: http://www.globalchange.gov/scenarios-workshop.

3
Community Building. Creating the foundations for a community of practice and
sustained efforts in the science, methodologies, tools, and applications of
population/migration scenarios.
Although the workshop was convened to share information so that USGCRP could continue to
develop more robust scenario work products, it is important to note that USGCRP did not intend
that workshop participants reach consensus in order for the workshop to be considered
successful, but rather emphasized the importance of individual contributions and viewpoints.
2. Workshop Agenda and the Workshop Report Format
Details of the Workshop Agenda
The SISCG organized the Towards Scenarios of U.S. Demographic Change Workshop with
support from various member agencies. A more detailed overview of the workshop agenda,
speakers, and organizers is presented in Appendix B. The workshop took place over two days
and included general presentations to the entire audience as well as smaller breakout sessions.
The first day of the workshop began with plenary discussions on the background, history, and
mission of the USGCRP; the goals for the workshop; and brief introductions on the topics of
climate change scenarios and population projections. The majority of first day of this workshop
explored the range of potential user needs for climate and demographics scenarios. The
discussion centered on determining which characteristics of population, spatial/temporal scales,
and types of scenarios are most important to users, and for what purposes. The first day’s
breakout sessions expanded on the initial objective of determining user needs and then
evaluating the feasibility of implementing more discrete data within population projections. The
smaller group sizes facilitated discussions that could include a wider spectrum of input on user
needs from the workshop attendees.
The second day of the workshop began by contextualizing the user needs explored on the first
day by evaluating the data and methodology used to model demographics. The discussion
included projections for states and smaller regions of the United States; spatial projections of
housing units with the Integrated Climate and Land Use Scenarios (ICLUS) model; and data
challenges with spatial population projections. Next, three breakout groups engaged on different
areas of interest: consistency across scale; urban community considerations; and rural
community considerations. The expert groups considered topics such as the feasibility of
projections at sub-national scales, key challenges to addressing user needs, and identifying which
types of projections could meet those needs in the near future.
The general presentations in the afternoon shifted the workshop’s focus to global scenarios and
their relevance to U.S. scenarios. Drawing upon the previous discussions, this session aimed to
place U.S. scenarios within a global context by considering the tradeoffs associated with linking

4
U.S. scenarios to global ones, as well as the role of socioeconomic factors on demographic
projections. Breakout groups in the afternoon discussed non-demographic factors within the
context of demographic scenarios, as well as the importance of aligning U.S. population
scenarios with global scenarios, and vice versa.
The workshop closed with a synthesis of participant suggestions. USGCRP did not intend that
workshop participants reach consensus in order for the workshop to be considered successful, but
rather emphasized the importance of individual contributions and viewpoints in identifying needs
and potential paths forward for the science of climate change scenarios and demographics
projections.
Structure of the Workshop Report
The remainder of this report is divided into four sections:
Section 3: Meeting User Needs for Population Projections. This section covers the
uses of population projections, user needs for projections, and projection methods for
meeting these needs.
Section 4: Capabilities for Developing U.S. Population Scenarios. This section reports
on discussions during the workshop as participants considered capabilities for developing
U.S. population scenarios, including defining and integrating different approaches, the
global context for U.S. scenarios, and current capabilities to meet user needs.
Section 5: Key Insights from Workshop Discussions. This section describes
discussions among workshop participants regarding key issues in building scenarios of
U.S. demographic change.
Section 6: Next Steps: Moving Forward with U.S. Demographic Change Scenarios.
This section concludes with a discussion of next steps on how to move ahead with
building U.S demographic change scenarios for use in interdisciplinary analysis of social
and environmental issues.
These sections are followed by references cited and four appendices that provide additional
information from the workshop.
3. Meeting User Needs for Population Projections
Federal government agencies, local decision makers, researchers, and private interests use
population projections to inform a range of regulatory and programmatic decisions that rely on
projecting population and related variables into the future. The workshop was attended by
representatives of a number of different user communities. It provided unique perspectives on the
needs for population projections and methods available for meeting those needs and engendered
a lively conversation on how researchers from different communities value and approach
questions of uncertainty. Understanding the context in which population projections are used and
the characteristics that are particularly useful for users will be important in determining how

5
demographic scenarios and projections can be formulated to meet those needs efficiently. This
section explores the issue of meeting needs from three perspectives: the role of population
projections in supporting decision makers in different user communities, potential user needs for
population projections, and methodologies that can be used to develop population projections
that are tailored toward user needs.
User Communities
Many federal and state agencies rely on population projections to identify trends in variables and
factors of interest to their missions, and as inputs into analyses designed to support the
development of public policies. In addition, researchers in a variety of disciplines use population
projections for both their own research and to support the development of government policy. To
better understand the range of uses, the workshop included presentations and participants from
federal and state government agencies and researchers from different fields. In addition, an
informal review of federal agency practices with respect to projections was conducted in advance
of the workshop. Collectively, the information presented and discussed at the workshop suggests
both considerable breadth in the user community and variety in the uses to which population
projections are put in analysis and policy development.
The Census Bureau of the Department of Commerce is a widely-used source of national
population projections, which embody assumptions and projections about how the U.S.
population will age over time (as far out as 2060) and change in terms of sex, race, and Hispanic
origin. Population data from the U.S. Census contribute directly and indirectly to the various
formulae used to distribute federal funds (Blumerman and Vidal, 2009) and are integral to
projecting future funding needs and programmatic costs. Numerous agencies, including NOAA,
Bureau of Land Management (BLM), EPA, Department of Transportation (DOT), Department of
Agriculture (USDA), Housing and Urban Development (HUD), Social Security Administration
(SSA), and Health and Human Services (HHS), use U.S. Census projections to forecast how key
drivers and variables will change in the future. In some cases, U.S. Census projections are used
directly, and in others, the data provide the building blocks of more detailed projections created
and used by other agencies. For example, population projections play a role in the production of
DOE’s Annual Energy Outlook (AEO),2 which includes variables such as vehicle miles traveled
and freight demand, and in turn help drive estimates of energy use and carbon emissions. EPA
uses population projections for a variety of purposes, including estimating population exposure
to different pollutants or the incidence of a disease- or health-related event. At the Office of the
Chief Actuary at the Social Security Administration, U.S. Census data are used in conjunction
with data on mortality rates from the National Center for Health Statistics (NCHS) and the
Medicare program and data on immigration to characterize the future solvency of the Old Age
Survivors and Disability Insurance (OASDI) program (OASDI, 2014). U.S. Census data, along
2 Current and past editions of the AEO are available at: www.eia.gov/forecasts/aeo/.

6
with other population projections and trend data, contribute to USDA/USFS projections of trends
in natural resource demand and use.
In some cases federal agencies may use population projections that span a range of probable
outcomes. The 2012 National Projections from the U.S. Census, for example, include a main
series and three alternative series, reflecting differing assumptions about net international
migration. No alternative series are currently on the Census website for the 2014 projections.
Climate change researchers inside and outside the government are another set of consumers of
population projections. As described by one presenter, the community conducting impact,
adaptation, and vulnerability
assessments, makes assumptions
about long term demographic
changes in estimating
vulnerabilities and impacts (see
Text Box 3-1. Demographic
Projections in Climate Change IAV
Research). Developing population
projections is particularly
challenging because of the long
time frame of these analyses, and a
common approach is to develop
scenarios that depict plausible
future states of the world, in order
to capture the unpredictability of the
future (these issues are discussed
more in Section 4 of this report).
Like federal agencies, state and
local governments and regional
planners use population projections
to support policy and programmatic
functions, project design, and
budget planning. For example,
population projections may be used
to develop estimates of school
enrollment or to support annual
appropriations within a state. State
and local governments generally
rely on the efforts of state
demographers, who in some cases build estimates based on older U.S. Census projections (since
the U.S. Census Bureau has not updated its state-level projections since 2005). Also, like
Text Box 3-1. Demographic Projections in Climate
Change IAV Research
One presenter stressed that demography is critical to understanding
vulnerability to climate change impacts, but indicated that the IAV
community has a distance to go in accounting for demographic
change in its research. The presenter included the figure below,
which illustrates how demography is a key driver of all types of
climate change vulnerabilities:
Age and sex are key factors influencing human health and
vulnerability to extreme events (first order);
The location of development and the capacity to absorb
economic losses shape the vulnerability of the built
environment (second order); and
The growth of urbanized areas drives climate feedbacks
(third order).
IAV research is improved by accounting for the influence of
demographic change on each of the classes of vulnerability.
Source: Preston, 2014.

7
national-level uses, businesses may use the projections to estimate future market shares and to
plan for demographic changes in the population. According to the U.S. Census, nearly all of the
states report producing population projections.3 One presenter indicated that the resolution
available in state projections generally reaches to the county level (although only rarely to the
city or municipal level), noting that some detail (on age, sex, or ethnicity) may be lost as the
focus narrows. Both the level of detail and the specificity in state projections is variable; some
states (such as Connecticut) make use of locally derived data (such as local fertility rates),
whereas other states (such as Michigan and Idaho) rely primarily on the last available state-level
projections from the U.S. Census Bureau.
Data Needs for Population Projections
The diversity of user communities generates a demand for population projections that span a
range of spatial, temporal, and demographic criteria. Different uses will require different
demographic details or groups, different time spans for the projection, and different geographic
coverage, as well as different levels of resolution and detail (ranging, for example, from national
projections all the way down to municipalities or U.S. Census tracts). Some users may need both
detailed and aggregate data, and so the capabilities of the user group to further refine or adapt the
population projection may also determine data needs. Moreover, different user groups may need
projections that represent different types of futures, (e.g., business as usual, most or least
probable, or best or worst case) depending on the purposes of the projection and the analysis or
policy decisions it is intended to support. Different user groups may also have a need for
different levels of accuracy and precision in the projection, depending, for example, on the
irreversibility of decisions that are being made, or the magnitude of the investments or other
costs involved.
Conventional population projections focus on
demographic variables such as age, sex, and race, and
methods for projecting these variables are well-
understood and commonly applied. For some purposes
(such as determining environmental vulnerability or
projecting health outcomes), demographic projections
that include socieconomic variables—such as income
or education—may be needed (see Text Box 3-2.
Specialized User Needs: Public Health). These
variables can be more difficult to project because they
rely on behavioral factors and future policy decisions.
Migration can also be difficult to project, increasing
the uncertainty of projections made at small
3 According to the U.S. Census website, all states but Vermont report projections. Available at:
http://www.census.gov/population/projections/data/state/st-prod-proj-list.html.
Text Box 3-2. Specialized User Needs:
Public Health
User needs may be more detailed within
specialized user communities, such as public
health researchers. Health impacts depend
on vulnerability, which can differ greatly by
age, sex, race/ethnicity, and socioeconomic
factors. In the third presentation of the
workshop, John Balbus of the U.S.
Department of Health and Human Services
noted that the health community wants
whatever richness of data they can get.
However, he noted that the field needs to
make more investments in how best to
generate and use detailed projections.

8
geographic scales. Thus, the uncertainty of a projection will depend on the spatial resolution,
time horizon, and demographics being projected.
Discussions at the workshop stressed the tradeoffs
between different characteristics of projections, as
well as the directions in which needs are evolving as
human systems evolve, for example, as “the urban
form” changes (see Text Box 3-3. Changes in the
Urban Form). Discussions also stressed that more
interaction between users and producers of
demographic projections is needed so that they can
arrive at a common understanding of the
uncertainties and limitations associated with
projections of particular characteristics and time/space scales.
Three key characteristics of population projections are explored below: population
characteristics, geographic scale, and time horizons.
Population Characteristics
The standard suite of variables that demographers project includes age, sex, and in some cases
race/ethnicity. For many purposes, one of these variables is sufficient. For example, projections
by age will allow planners to examine the future needs of different segments of the population,
such as children (at different educational levels), women in their reproductive years, persons in
the labor force, or the elderly. Projections by age are also essential for cost estimates and
projections related to the OASDI and Medicare programs. Projections by age, sex, and race are
important in health research, since dose-response—the statistical relationship between measures
of exposure and measures of disease—may vary by
age, sex, and race.
User needs for population characteristics range from
simple overall projections to projections with
considerable demographic and socioeconomic
details. Workshop participants identified a variety of
population characteristics that go beyond the standard
suite of variables, but which could be critical to some
analyses and planning efforts. Participants identified
variables such as educational achievement (see Text
Box 3-4. Challenges and Tradeoffs in Meeting User
Needs: Education), urban/rural classifications (see
Text Box 3-5. Urban vs. Rural), health status, and
income were among those identified. In some cases,
the need for population projections can become quite
Text Box 3-3. Changes in the Urban
Form
While the U.S. population is becoming
older and more urban, participants also
noted that our urban form is changing. It
was suggested that there is a need to marry
demography with GIS analysis. As
demographers develop a better
understanding of urban form, demography
can be applied in other uses—such as land
use and transportation—more effectively.
Text Box 3-4. Challenges and Tradeoffs
in Meeting User Needs: Education
Some participants indicated a strong need
for projections of educational attainment,
and recent work has shown the importance
of education in many analyses, including
studies of vulnerability to natural disasters
(Butz et al., 2014). However, other
participants emphasized the tradeoff
between the population characteristics being
projected and the geographic scale of the
projection; due to data limitations and the
increasingly important role of migration,
small scale projections cannot reliably
include as many population characteristics
as larger-scale projections can.

9
complicated, necessitating more sophisticated methods. For example, analyses involving
construction demand, property taxes, or emergency evacuation planning may require data and
projections for households rather than simply
numbers of people, including information on
permanent vs. seasonal residences, households by
living arrangement (married, children, single,
elderly), and types of housing units. Alternatively,
assessing vulnerability to coastal flooding requires
understanding and projecting patterns of land use,
including transportation modes and usage and trends
in urbanization. Even for a given variable, categories of interest may vary significantly from one
use to another. For example, one project may rely on total population and housing units for
municipalities with particular characteristics (e.g., small vs. large), while another may rely on
information on population and housing density on a neighborhood scale.
As projections expand beyond conventional demographic variables to socioeconomic variables,
the pathways are less well understood and, consequently, demographers may consider
projections to be more uncertain. For some socioeconomic characteristics, it can be extremely
difficult to obtain detailed data both at fine scales and for the nation as a whole, further
challenging demographers’ abilities to meet user needs for data. While users expressed a need
for sophisticated and detailed projections, some demographers at the workshop pushed back
strongly, questioning whether variables such as education can be reliably projected at the local
level. While certain uses may benefit from more detailed population characteristics and more
granular availability of data, participants agreed that there is a tradeoff between detail and
uncertainty, especially with regard to socioeconomic characteristics such as education, health
status, and income. Some participants even questioned why there would be a need for anything
more detailed than age, sex, and race, given the inherent uncertainties.
Geographic and Temporal Extent and Resolution
The extent and resolution of a projection will influence both its uncertainty and its saliency to its
users. Both geographic and temporal extent are important. Presentations and discussants
explored these issues in detail, both from the perspective of what user needs are, and how
uncertainty necessitates tradeoffs between meeting these needs and providing accurate and
precise results.
Potential user needs for population projections cover a broad spectrum of geographical
resolutions, including national, state, county, and sub-county outcomes, such as municipalities.
Many federal programs and policies use national, regional, or-state-level data. For example, the
Energy Information Administration of DOE uses regional (multi-state) and national population
projections as inputs into energy demand projections for the Annual Energy Outlook. As another
example, the USDA’s Southern Forest Futures Project projects changes in southern forests
Text Box 3-5. Urban vs. Rural
Some participants noted that it is important
to treat urban and rural areas differently, as
the processes of change can vary greatly
between urban and rural areas. Others felt it
was more important to think about an
urban/rural continuum, and not separate
them.

10
between 2010 and 2060 under different scenarios using state population estimates, among other
inputs. Analysis and research to support federal programs and policies, as well as “one-off”
reports and analyses, may use more detailed county or even sub-county data and projections. For
example, at the request of local stakeholders, the Bureau of Land Reclamation conducted a study
of water demand and water supply conditions in Coconino Plateau region, out to the year 2050;
the study used a combination of U.S. Census, state, and local data sources. Analyses conducted
by state and local governments will generally rely on more detailed geographic projections that
are informed by a detailed knowledge of local economic and regulatory factors; a national
agency may not have a need for the high level of resolution that cities and MPOs will require in
approaching and analyzing their study area.
The time horizons over which population projections are used by departments, agencies, and
offices within the U.S. Federal government typically range from as short as a decade (i.e., to
2025) to almost a century (2100), according to the informal review conducted before the
workshop. The time horizon will be dictated by the analysis or policy that the projection is
supporting, or the period for which planning or budgeting activities are being undertaken. For
example, the Department of Housing and Urban Development has used short- to medium-term
projections (i.e., to the year 2050) of the percentage of the population that will be age 65+, in
order to understand the demand for affordable and accessible housing over time. By contrast,
studies looking at the solvency of the social security system typically have much longer time
horizons (to 2085 or 2100). Similarly, studies and policy analyses looking at climate change,
both mitigation and impacts/adaptation, also focus on longer time frames (to 2100 or longer).
Geographically, local level populations are easily affected by specific local land-use policy and
local economies; however, these effects tend to even out over larger geographic scales.
Consequently, methods for projecting national population may be different from methods to
project population at the state or county level, where economic, social, and other factors come
into play and detailed micromodels can be employed. Depending on the data inputs, modeling
capabilities, and available resources, projections may be more or less uncertain at different
levels. Similarly, it is easier to project what will happen to population in the near term than over
the long term. Moreover, as described above, expanding the set of socioeconomic categories for
which population is projected equally expands the methodological complexity of the projection.
At the same time, these layers and levels of detail—geographic, temporal, and characteristics—
are often what policy makers and decision makers need.
While national or global projections may sometimes be made over the very long term,
projections for smaller areas are generally limited to a decade, or perhaps 30 years at most; as a
projection’s time horizon expands and the geographic focus narrows, uncertainty increases. One
presenter illustrated the uncertainty of increasing the spatial resolution and temporal extent of a
11
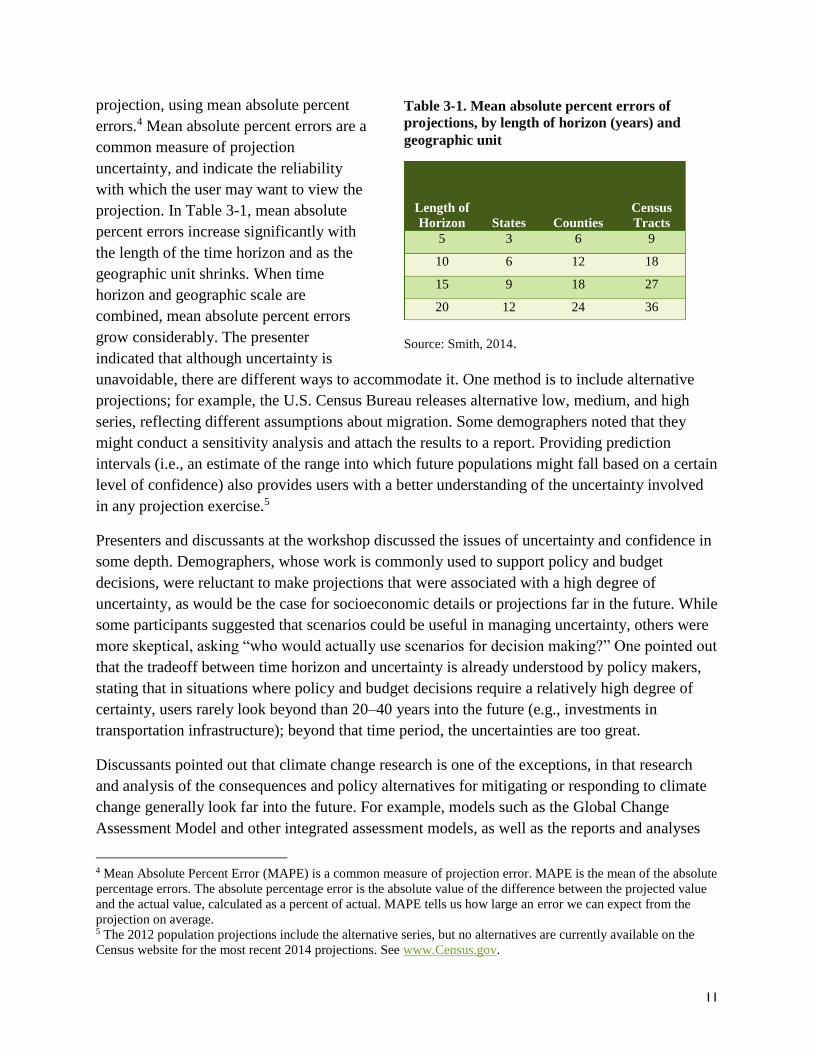
projection, using mean absolute percent
errors.4 Mean absolute percent errors are a
common measure of projection
uncertainty, and indicate the reliability
with which the user may want to view the
projection. In Table 3-1, mean absolute
percent errors increase significantly with
the length of the time horizon and as the
geographic unit shrinks. When time
horizon and geographic scale are
combined, mean absolute percent errors
grow considerably. The presenter
indicated that although uncertainty is
unavoidable, there are different ways to accommodate it. One method is to include alternative
projections; for example, the U.S. Census Bureau releases alternative low, medium, and high
series, reflecting different assumptions about migration. Some demographers noted that they
might conduct a sensitivity analysis and attach the results to a report. Providing prediction
intervals (i.e., an estimate of the range into which future populations might fall based on a certain
level of confidence) also provides users with a better understanding of the uncertainty involved
in any projection exercise.5
Presenters and discussants at the workshop discussed the issues of uncertainty and confidence in
some depth. Demographers, whose work is commonly used to support policy and budget
decisions, were reluctant to make projections that were associated with a high degree of
uncertainty, as would be the case for socioeconomic details or projections far in the future. While
some participants suggested that scenarios could be useful in managing uncertainty, others were
more skeptical, asking “who would actually use scenarios for decision making?” One pointed out
that the tradeoff between time horizon and uncertainty is already understood by policy makers,
stating that in situations where policy and budget decisions require a relatively high degree of
certainty, users rarely look beyond than 20–40 years into the future (e.g., investments in
transportation infrastructure); beyond that time period, the uncertainties are too great.
Discussants pointed out that climate change research is one of the exceptions, in that research
and analysis of the consequences and policy alternatives for mitigating or responding to climate
change generally look far into the future. For example, models such as the Global Change
Assessment Model and other integrated assessment models, as well as the reports and analyses
4 Mean Absolute Percent Error (MAPE) is a common measure of projection error. MAPE is the mean of the absolute
percentage errors. The absolute percentage error is the absolute value of the difference between the projected value
and the actual value, calculated as a percent of actual. MAPE tells us how large an error we can expect from the
projection on average. 5 The 2012 population projections include the alternative series, but no alternatives are currently available on the
Census website for the most recent 2014 projections. See www.Census.gov.
Table 3-1. Mean absolute percent errors of
projections, by length of horizon (years) and
geographic unit
Source: Smith, 2014.
Length of
Horizon States Counties
Census
Tracts
5 3 6 9
10 6 12 18
15 9 18 27
20 12 24 36

12
generated by the National Climate Assessment, extend to 2100. While participants were
concerned about the high degree of uncertainty inherent in long-term projections, many agreed
that the long lasting effects of climate change give rise to research questions that can only be
answered using long temporal horizons.
As a result of needs specific to long-term studies, some users have adopted the scenario approach
as a way to embrace and understand the impact of the uncertainty inherent in long-term
projections. These issues are discussed in Section 4: Capabilities for Developing U.S. Population
Scenarios.
Meeting User Needs: Projection Methods for Estimating Population
A variety of methods are available that project population at different levels of resolution and
scale, and capture different population groups and characteristics. At the national level,
population projections in the United States commonly use the cohort-component method. This
rather intuitive approach starts with population estimates for the number of individuals of each
age in a base year, and then base population is advanced each year using projected
survival/mortality rates. Each year, a new birth cohort is added to the population by applying
projected fertility rates to the female population, by age. One presenter pointed out that this
method is not as robust at the sub-national level, however, because of the difficulty of capturing
migration, which is particularly important when projecting spatial detail. Movements from one
sub-national area to another are less predictable, and are more likely to be driven by economic or
amenity factors. Several of the presenters pointed to a wide variety of methods (see Table 3-2, at
the end of this section) that are available for projecting population at the subnational level. These
methods range from relatively simple methods based on historical patterns and trends to more
sophisticated methods that try to model, or simulate, the changes in the drivers of behavior.
More than one method can be used for a given purpose, and participants at the workshop spent
considerable time discussing alternative methods and their strengths and weaknesses, as well as
the factors that contribute to selecting a methodology. Key factors identified by participants
included the ease of use and transparency of results, the quality of input data available, and the
desired scale and time horizon. For example, one presenter noted that trend extrapolation
methodology, which is fairly easy to implement, is often used at the local government level for
population projections, in part because budgets may not allow for more sophisticated methods.
Simpler methods may not only be more cost effective, but they may also be easier to
communicate. Approaches are not necessarily mutually exclusive. Moreover, in some cases, a
study may use multiple projection methods side by side; for example, the North Central Arizona
Water Study (Pinkham, 2002) uses both a cohort-component method as well as a linear
extrapolation of current growth to produce separate estimates of population growth that can be
compared and contrasted.

13
Key Points: Meeting User Needs for Population Projections
1. User communities that span all levels of government and the private sector create a need for population
projections that span a range of geographic scales and resolutions, time horizons, and population
characteristics.
2. Diverse user communities and types of applications of population projections make it difficult for a "one
size fits all" approach that satisfies the variety of needs.
3. In some cases, users can include a range of alternative projections, reflecting different futures with respect to
migration or other key variables.
4. Increasing levels of uncertainty are associated with projections over a longer time horizon or at finer
geographic resolution.
5. The choice of appropriate methodology will depend not only on user needs for specific population
projections, but also on resource constraints, data availability, and the importance of communicating methods
and transparency.

14
Table 3.2. A summary of projection methods discussed at the workshop
Method Description Examples of Uses Key Characteristics Citation
Proportional
Scaling
Use one or more data sets to disaggregate data
geographically or interpolate additional population
characteristics by scaling proportionally between
datasets.
Downscaled global SRES
scenarios at the national and grid
levels (van Vuuren et al., 2007).
Easy to implement but difficult to capture
complex processes.
Jones,
2014
Trend
Extrapolation
Can be used for total population or component (e.g.,
race). Applied to ratio as well (ratio of county to state).
Commonly used for local counties where there may be
limited options.
The Hamilton-Perry method for
projecting change based over a
short period using minimal data
inputs (Hamilton and Perry,
1962).
Easy to implement but difficult to capture
complex processes.
Assumes past is a good predictor of the future, so
it won’t capture divergences from past patterns.
May not have variables of interest. Does not
capture structural changes.
Jones,
2014;
Smith,
2014
Gravity-based Gravity models calculate the potential suitability or
desirability of each location. Variables for such models
usually include total population and geographic
suitability. Migration between two geographical points
is then determined by these variables.
Spatially explicit interpretations
of scenarios from SRES (Grübler
et al., 2007).
Accounts for population counts and geographic
suitability.
Does not formally account for demographic
behaviors, births, deaths, migration—or
socioeconomic conditions, but there is potential
to.
Balk,
2014;
Jones,
2014
Hybrid
Models
Combines multiple methodologies to project
demographics.
EPA’s ICLUS model combines
the cohort-component approach
with a gravity model for
migration. (U.S. EPA, 2009)
Incorporating multiple methodologies can
address limitations of individual methodologies.
More resource intensive to implement.
Jones,
2014
Cohort-
Component
Population is usually divided into age/sex groups. The
drivers for each group are:
1. Base population.
2. Baseline fertility, mortality, and migration rates.
3. The future fertility, mortality, and migration rates.
This method is used most frequently.
Census Bureau Projections (U.S.
Census Bureau, 2012). Most data requirements are not too difficult to
acquire.
Migration data can be difficult to come by, and
migration patterns are not as stable as other
variables.
Difficult to incorporate socioeconomic factors,
such as employment and economic growth.
Balk,
2014;
Smith,
2014
Structural
Models
A demographic variable is projected based on historical
values and external variables. Also commonly used.
Common variables include job growth, land use,
housing, and local services.
Can be applied to projecting
populations for small areas, where
other techniques are less reliable
(Chi and Voss, 2011).
Growth is measured, but demographic
components are not.
Better for short-term projections.
Used for local-area projections.
Balk,
2014;
Smith,
2014

15
Method Description Examples of Uses Key Characteristics Citation
Microsimulati
on (Agent-
based
Modeling)
Used on small areas. Focus on individual households or
people. Each individual is separate in the model.
Aggregate behavior is based on the sum of individual
behavior.
Duleep and Dowhan (2008)
proposed improving OASDI
projections by adding immigrants
to microsimulation models.
Limited in geographic scope and can be
expensive to develop.
Able to incorporate much detail through
individual decision-making.
Used largely for planning purposes.
Smith,
2014
Spatial
Diffusion
Models spread of population over space and time as
population spreads to less populated areas. Accounts
for density constraints and other geographical features.
Regions react to other regions (used by geographers
and planners).
Can be used to understand the
effects of social learning and
social influence on demographic
changes (Montgomery and
Casterline, 1996).
Used largely by geographers and planners. Smith,
2014

16
4. Capabilities for Developing U.S. Population Scenarios
The need for population projections that span demographic variables, time frames, and
geographic scales is as great—and diverse—as the communities that use these projections. The
workshop participants focused not only on what user needs were (as presented in Section 3,
above), but also on what our scientific capabilities are to meet those needs. The discussion in the
workshop report thus far has used “projection” as a
somewhat generic term characterizing a population future.
In reality, different users may have needs for different
types of futures. For example, some users may rely on
predictions that seek to answer a question of the type of
“What will happen in the future?” while others may rely
on projections that are more in the nature of “what if”
statements, and still others may use scenarios identifying
plausible descriptions of future states of the world. The
discussion below distinguishes between these types of
futures, and discusses the relationship among different
types of future characterizations.
In discussing capabilities, participants and presenters
identified a number of difficult challenges, stemming both
from the diversity of needs, and from the difficulty of
understanding and quantifying the pathways by which
socioeconomic and other variables influence changes in
populations. As that understanding improves, researchers
may become better able to reduce the uncertainty and
improve the reliability of projections. One presenter
highlighted these issues by looking at what scholars in the
1930s would have needed to project U.S. migration trends
(see Text Box 4-1).
This section reports on the discussions that occurred during the workshop as participants tackled
this issue from three perspectives: (1) future characterization (how do we define and integrate
different approaches to developing projections and scenarios), (2) the context for U.S. scenarios
that global scenarios and global demographic changes (e.g., migration) provide, and (3) the
“state of the science” and current capabilities to meet diverse user needs. The last subsection then
revisits the question of “capabilities,” identifying not only where we have the models and tools
we need, but also areas where new tools or sources of data are needed.
Text Box 4-1. Backcasting to 1939: A
Lesson in Humility
The story of migration patterns for the
last 100 years or so is persistence—e.g.,
fast-growing places tend to remain fast
growing and vice versa. The biggest
driver of this persistence appears to be
natural amenities (climate, landscape,
nice places).
Yet, scholars of the late 1930s would
have thought “people follow jobs” not:
“jobs follow people.” They would not
have understood key drivers in current
U.S. migration trends, such as:
Innovation in public health and air
conditioning
Congestion that closes off city
growth
Rise of information technology on
the West Coast
Pro-business policies in the South
after WWII
Source: Partridge, 2014.

17
Characterizing the Future: Projections and Scenarios
Analyzing the anticipated effects of policies, programs, and environmental change and other
conditions requires a view of what will happen in the future. Different uses may require different
types of population futures (Smith et al., 2013). In some cases, a qualitative statement of trends
and expected changes in key drivers suffices for planning or analytical purposes. In others,
quantitative population projections will be needed; these projections can be deterministic, or may
be probabilistic or stochastic. For some decision making purposes, projections can be used to
conduct “what if?” analyses, allowing researchers to consider the determinants of population
change. Projections can also take the form of scenarios; when there is considerable uncertainty
about the future, alternative scenarios can be used to explore the effects of different assumptions
about the future.
The IPCC has developed a typology of terms for describing future characterizations, including
scenario, storyline, projection, and probabilistic futures (see Text Box 4-2). The terms reflect
typical usage in climate change impact, adaptation, and vulnerability (CCIAV) studies (Carter et
al., 2007). They describe a range of approaches to describing plausible futures, with one key
difference among the approaches being the extent to which probabilities are ascribed to the
future.
Text Box 4-2. IPCC Definitions of Future Characterizations
Some key terms from the IPCC typology are defined below. More information is available from the IPCC
reports.
Scenario is a coherent, internally consistent, and plausible description of a possible future state of the world,
which may be quantitative, qualitative, or both. The components of a scenario are often linked by an overarching
logic, for example a storyline that represents a qualitative, internally consistent narrative of how the future may
evolve.
Storylines describe the principal trends in key drivers and relationships among these drivers. Storylines may
be stand-alone, but more often underpin quantitative projections.
Projection is any description of the future and the pathway leading to it. In the climate world, projections are
often model-derived estimates of future conditions for an element (such as population) of an integrated system.
Projections are generally less comprehensive than scenarios. Projections may be probabilistic, while
probabilities are not ascribed to scenarios.
Probabilistic futures are futures with ascribed probabilities. Conditional probabilistic futures are subject to
specific underlying assumptions. Assigned probabilities may be imprecise or qualitative, as well as quantitative.
A prediction or forecast is a statement that something will happen in the future, based on what is known
today, and on the initial conditions that exist. An important part of a prediction is our degree of belief that it will
come true.
Sources: Carter et al., 2007, Solomon et al., 2007. Weaver et al., 2013.

18
A projection is not the same as a prediction. A prediction is an attempt to produce an estimate of
the actual evolution of the future and is usually probabilistic in nature. A prediction assumes that
the future outcome will not be greatly influenced by unpredictable or uncertain future conditions.
A projection, in contrast, specifically allows for significant changes in the conditions that might
influence the prediction, creating “if this, then that” type statements. Thus, a projection is a
statement that it is possible that something will happen in the future if particular conditions (e.g.,
socioeconomic and technological developments) are realized. A projection is, therefore, subject
to substantial uncertainty.
One of the presenters referred to the following IPCC graphic (Figure 4-1), which maps the
approaches to characterizing the future described in Text Box 4-2 (among others) into the space
defined by the dimensions of comprehensiveness and plausibility. Comprehensiveness indicates
the degree to which the characterization possesses the variety of population attributes (and the
level of detail for each attribute), needed by the user community. Plausibility indicates a
subjective assessment of whether a characterization is possible; implausible futures are assumed
to have zero or negligible probability. As indicated on the graphic, scenarios typically are more
comprehensive than projections, because of the greater number of elements they include in
describing the future state of the world. However, projections, unlike scenarios, are sometimes
assigned probabilities.
One of the issues prominent during discussions was the difference between projections and
scenarios, and the type of approach that best serves different user communities. Participants from
the climate change community, for example, described an approach that focuses on building
alternative plausible futures and quantifying the outcomes for relevant elements of the scenarios.
The scenario approach is preferred by researchers and analysts looking at climate change
because it reflects the greater uncertainty about the future over the long term and the importance
Figure 4-1. Characterizations of the future
Figure Source: Carter et al., 2007.

19
of assumptions about key variables, including climate policies, economic growth, technological
change, and migration patterns.
According to presenters and discussants, many state agencies prefer a single projection series on
which to base policy and programmatic decisions; consequently state demographers may have
their projections interpreted as predictions, in the sense of representing a most likely outcome,
rather than a conditional statement about the future, driven by scenarios, storylines, or other
assumptions. In many cases, the discussion indicated that the development of alternative
projections by demographers is less a reflection of alternative visions for the future than an
intention to bracket the uncertainty in the projection.
In practical applications of projections to state
and local policy issues, the divergence between
a scenarios approach and a projection approach
is not always as great as the above discussion
might imply. State and local planners and other
public officials may use scenario building, or
scenario-based planning, as a systematic
approach to understanding current and
emerging trends that are shaping the
community, with a goal of developing a
reasonable, plausible population projection for
a community. For example, Franklin County in
Florida developed a population growth scenario
outlining the type of growth expected in the
county and identifying the facts driving growth
in the community. The scenario that was then
utilized in the preparation of a population
forecast for Franklin County (see Text Box 4-3;
Chapin and Diaz-Venegas, 2007).
Similarly, some users employ “visioning” to
develop different futures on which the
projections are based, or bracket possible futures to reflect uncertainty in key drivers. Planning
using scenarios may involve an iterative process of defining the vision; coming up with different
scenarios that articulate the vision; evaluating, refining, and identifying top priorities; and the
turning the findings into an actual plan, typically working with stakeholders like residents and
businesses throughout. Envision Utah, for example, works with communities throughout Utah to
engage residents in the planning process (see Text Box 4-4). Alternatively, scenarios may be
Text Box 4-3. A Population Growth Scenario for
Franklin County, Florida
Franklin County developed a growth scenario
through the year 2030, using interviews with local
experts, reviews of planning documents and print
media, and analysis of population and economic data
for the county, the region, and the state.
Developing a plausible scenario involved gathering
data and trends in key factors, including:
Dimensions of growth, including historical
population growth, emerging development
trends, and part-time residents;
Factors driving population increases, including
continued growth of the state and region, and
public and private efforts to create regional
branding for the Florida Panhandle, and the
location of a new state prison; and
Factors limiting population increases, including
infrastructure issues, public land holdings, and
county culture.
Source: Chapin and Diaz-Venegas, 2007.

20
developed that represent aspirational goals, or reflect different policy scenarios (e.g., changes in
zoning rules).
Discussions and presentations at the workshop
clarified some of the misunderstandings between
different groups regarding the differences between
projections and scenarios, and highlighted the
usefulness of a scenario approach in developing
conditional projections. Nonetheless, many of the
demographers at the meeting continued to express
significant reservations about making long-term
demographic projections, especially for small
areas. It will be particularly important to provide
content and guidance for appropriate use and
limitations of such projections.
Global and Societal Contexts
Complications are inherent in developing population scenarios that will meet the diverse user
needs for climate change analyses and other uses of population projections, articulated in Section
3 of this report. One set of issues surrounds the nature of global scenarios, which are used
extensively in the climate change arena, and may inform—but also can complicate—the process
of developing U.S. scenarios. At the workshop, participants explored existing global scenarios
and what it would mean for U.S. scenarios to be consistent with these scenarios. Participants also
explored how societal considerations and context add another layer of complexity to the process
of defining desirable characteristics for U.S. population scenarios. Key discussion questions and
responses are summarized below; these reflect the tenor of the dialog among participants.
A broad range of global scenarios is available for use in the CCIAV studies, including the
Special Report on Emissions Scenarios (SRES), the Shared Socioeconomic Pathways (SSPs), the
Representative Concentration Pathways (RCPs), and scenarios developed for the Millennium
Ecosystem Assessment. These scenarios can be used in global assessments and other studies,
such as the Millennium Ecosystem Assessment and the IPCC’s Assessment Reports. The
scenarios are generated from a set of assumptions about the future, and common drivers include
economic development, population growth, technological development, attitudes toward
environmental protection, and globalization (Moss, 2014).
One of the most widely used sets of scenarios are the so-called “SRES” scenarios, which were
developed for the CMIP and have been the mainstay in climate assessments for more than a
decade (Nakićenović et al., 2000). This SRES framework includes four storylines that extend to
2100, each of which is defined along two dimensions: environmental/economic patterns of
growth, and globalization vs. regionalization.
Text Box 4-4. Envision Utah’s Process
Envision Utah uses interviews, mapping exercises,
surveys and other means to hear from residents and
uses that information to present different community
scenarios based on the information
gathered. Residents react to the scenarios and choose
the future that best matches their vision. Based on
public input, Envision Utah's voluntary
recommendations for achieving that vision respect
private property rights and are grounded in the
realities of the local market. Local elected officials,
along with residents, have the opportunity to
implement the public’s vision as they best see fit.
Source: Envision Utah, 2014.

21
The SSPs are a new scenario
framework being developed that
includes five separate narratives or
storylines (see Figure 4-2). These
SSPs are designed to be used in
conjunction with the RCPs. The
RCPs are a set of four scenarios
containing GHG emissions, GHG
concentration, and land-use pathways
that are driven by underlying
scenarios of socioeconomic variables,
land-use and land-cover factors, and
GHG emissions. The RCPs were
developed by selecting and updating
scenarios described in the existing
literature, and then harmonizing and
downscaling emissions and land-use data (van Vuuren et al., 2011). The SSPs are being
developed as part of a parallel process to link climate modeling, integrated assessment modeling,
and impacts, adaptation, and vulnerability modeling. They represent more detailed
socioeconomic pathways that can be used to explore uncertainty in terms of the socioeconomic
challenges to mitigation and adaptation
shown along the two axes in Figure 4-
2. The ways in which different SSPs
may be linked to the RCPs are
demonstrated in Figure 4-3.
Participants pointed out that
researchers are already using the SSPs,
although many still use the SRES. In
addition to the scenarios being
designed for purposes of climate
change work, scenarios have been
developed for the Millennium
Ecosystem Assessment (Millennium
Ecosystem Assessment, 2005) and for
the UNEP Global Environmental
Outlook (UNEP, 2012), as described in
Text Box 4-5.
Figure Source: O’Neill, 2014b.
Figure 4-2. Qualitative descriptions of the SSPs
Figure 4-3. A crosswalk of the SSPs and the RCPs
Figure Source: Kram, 2012.

22
In some cases, alternative population projections
have been developed to be consistent with
scenarios, such as those developed by the IPCC
(Nakićenović et al., 2000). For example, the
USGS of the Department of the Interior developed
population scenarios to predict land use and land
cover changes, as well as disturbances to
ecosystems in different geographic areas in the
United States. These scenarios were developed to
be consistent with the qualitative IPCC storylines.6
Similarly, EPA’s Integrated Climate and Land-
Use Scenarios (ICLUS) provide detailed
population and land-use scenarios that are also
broadly consistent with the IPCC storylines. The scenarios are modified by adjusting
assumptions about fertility, international and domestic migration, household size, and travel time
to the urban core. Scenarios, rather than deterministic population projections, are particularly
important for analyses involving climate change because of the very long time frame of the
analysis, the close linkage between different population metrics and impacts, and the
heterogeneous nature—spatially and temporally—of climate-related hazards and demography.
Participants at the workshop discussed the possibility—and importance—of consistency between
the national and existing global scenarios, such as the SSPs (see Text Box 4-6). Some stressed
that although consistency is important, it should be defined loosely. This viewpoint stressed the
importance of consistency of U.S. scenarios with the underlying concepts reflected in global
scenarios, rather than the quantitative aspects (e.g., U.S. EPA, 2009; Jiang, 2014). More
generally, efforts to maintain consistency should not overly constrain or limit the suite of
plausible national U.S. scenarios. Others pointed out that the size and heterogeneity of the United
States fosters internal tensions and factors that may not be addressed by the SSPs or other global
6 Detailed background information on the IPCC storylines is available at:
www.ipcc.ch/ipccreports/sres/emission/index.php?idp=3.
Text Box 4-6. The Quantification of the Shared Socioeconomic Pathways (SSPs)
The SSP database aims at the documentation of quantitative projections of the Shared Socioeconomic Pathways
(SSPs). The database includes quantitative projections for population (by age, sex, and education), urbanization,
and economic development (GDP). These quantitative elements have been developed by collaboration among
different groups, including the International Institute for Applied Systems Analysis (IIASA), the National Center
for Atmospheric Research (NCAR), the Organisation for Economic Co-operation and Development (OECD),
and the Potsdam Institute for Climate Impact Research (PIK).
Source: Jiang, 2014. For additional information see also:
http://www.iiasa.ac.at/web/home/research/researchPrograms/Energy/SSP_Scenario_Database.html.
Text Box 4-5. UNEP Global
Environmental Outlook
The UNEP GEO provides another view of
global scenarios. While the SRES and SSP
scenarios represent pathways in the absence
of explicit climate change policies, the GEO
produces two storylines (to 2050): one
follows a business-as-usual trajectory, and the
other follows a path driven by global goals
and targets for environmental, social, and
economic sustainability.
Source: UNEP, 2012.

23
scenarios; consequently U.S.-specific variants or place-specific conditions could lead to
storylines that are qualitatively different from global storylines, as well. Still others pointed out
that the notion of “consistent” scenarios does not mean the same thing for all types of analyses;
some analyses can selectively focus on characteristics that are important for its framing. For
example, different aspects of a storyline may be more important for framing a mitigation
analysis, while others are critical to impacts and adaptation.
When the underlying concepts supporting scenarios at the national level are consistent with the
concepts driving global scenarios, national scenarios can be further tailored to reflect nationally
relevant factors. Participants pointed out that migration is one factor driving population scenarios
that may manifest differently at the national scale than at the global scale. Some noted that
internal migrations may not mirror global migrations; connections exist, but they are poorly
understood. Understanding migration patterns in the United States is important for understanding
national population distribution, population changes, and rates of population change along the
urban-rural continuum. As mentioned in Section 3, users have expressed an interest in having the
flexibility to consider different population scenarios that reflect an array of migration patterns.
The second broad type of complication arises from the socioeconomic and societal context
within which scenarios and projections are developed. Participants at the meeting identified
important categories of non-demographic factors, including governance, and education. They
also pointed out that abandonment is less well understood than development. With respect to
migration, the discussion identified a number of factors that can drive migration, including
housing, zoning, transportation, air quality, gasoline prices, taxes, short-term and long-term
economic change, environmental change, land availability, and human behavior. One presenter
pointed out that migration patterns in the United States for the past 100 years or so have been
remarkably persistent; fast-growing places tend to remain fast growing, and vice versa
(Partridge, 2014). The presenter shared tables and maps suggesting that the biggest driver of this
persistence appears to be natural amenities (climate, landscape, and nice places). He argued that,
while demographers often assume that people follow jobs, in fact the reverse may be true, and
jobs follow people.
Available Data, Methods, and Tools
A variety of tools, data, and methods are available to develop projections that incorporate
different population attributes, and different levels of spatial and temporal detail. In applying
these methods, the user community often faces tradeoffs; some variables (well-understood
variables such as age, race, and sex) will be relatively easy to project at the national and sub-
national level, but become more difficult as the geographic unit or scale shrinks. The sub-county
level can be particularly difficult to work with, especially for less well-understood variables,
such as education. Reconciling estimates for different geographic scales can also be difficult;
while statewide growth rates, for example, will influence growth rates in many communities,
population changes in local communities will also be governed by many highly local factors,

24
such as development patterns and building plans. Applying existing models, collecting important
data, and developing new techniques will all be part of developing population projections to suit
a variety of purposes, as well as turning the type of qualitative and quantitative scenarios that are
discussed above, into quantitative population projections.
Presentations at the workshop addressed the types of methods that are available to project
population at the national and subnational levels, and the strengths and weaknesses of different
methods. When developing aggregate national projections that require only core demographic
variables (e.g., population by age and sex), the cohort-component technique remains a useful and
common approach, as various presenters noted (Balk, 2014; Murdock, 2014; Smith, 2014).
Different scenarios can be developed by modifying the rates of change, particularly assumptions
about fertility and international migration. However, when a set of projections needs to include
socioeconomic variables or spatially explicit information, the cohort-component technique
cannot be used alone. It cannot easily be used to project non-demographic variables, nor can it be
used to project internal migration, which is critical to spatially explicit projections (Balk, 2014).
As the requirements for a set of projections grow more complex, other methods may be used
alone or in combination with one another. Some methods, such as proportional scaling make it
possible to develop spatially explicit projections or to incorporate additional demographic detail.
Scaling can also help address lack of fine-scale data, while also ensuring consistency between
the small scale and aggregate totals (Jones, 2014). Trend extrapolation can be used to develop
projections based on a curve fit to historical observations, particularly for variables such as
educational attainment, where historical trends can be observed (Balk, 2014; Jones, 2014; Smith,
2014). Other large-scale approaches can address some of the complexities; for example gravity-
based approaches can be used to project spatially explicit rates of change; however, while this
approach can capture geographic suitability and population counts, it cannot provide
demographic or socioeconomic detail (Balk, 2014; Jones, 2014).
These and other models—such as structural models and microsimulation models—provide
additional information, but also are data intensive. Consequently, they may be appropriate for
projections that are national in scope, yet require spatially explicit detail. Structural models,
which project demographic changes based on causal relationships between demographic and
non-demographic variables, provide an opportunity to explore the impact of non-demographic
drivers on various scenarios. At the same time, these methods do not handle demographic
processes, such as fertility and mortality, as easily as the cohort-component method, so hybrid
approaches are being used to gain the advantages of different techniques.
Scaling and extrapolation techniques are often used on the sub-county level due to resource or
data limitations. More detailed methods to develop sub-county projections typically require
detailed local knowledge, such as local economic dynamics, planned infrastructure investments,
and land-use regulations. For some climate change assessment, sub-county projections can be

25
critical, as in the case of sea level rise (see
Text Box 4-7). However, many local
governments do not have the data or resources
to implement more intensive modeling
approaches, and it is an open question as to
when and whether knowledge-based
projections perform better than more simple
techniques (see Text Box 4-8).
Participants at the workshop expressed a
number of different perspectives on
considerations in choosing and applying
existing data and modeling approaches. One
recurring theme was the importance of “right-
scaling.” One participant noted that people
have a tendency to think that more resolution
is better; in reality, greater resolution may
encourage a false sense of precision and
accuracy, and may not be necessary for the
task at hand. Therefore, “right-scaling” the
data and method for what one needs to investigate is an important first step. However, right-
scaling can be complicated to determine, when researchers do not have a specific question in
mind, but the goal is to develop projections or
scenarios that are useful for multiple
applications.
When users have different needs and
applications, a flexible approach may be
needed. In discussing geographic flexibility
(and important difference across user needs),
participants considered the usefulness of
providing data on a common grid, so that users
could move between scales more easily. One
participant noted that the United Kingdom and
some Scandinavian countries conduct their
censuses on a geographical grid. Some
participants felt that difficulties with gridded
data (e.g., the problem that not all data are
available at all scales) could be resolved, while
other argued that it is unrealistic to project
demographics on a grid, preferring the use of
Text Box 4-7. Sub-county Population and
Sea Level Rise
Population projection methodologies for small area
units—namely sub-county units—tend to be less
robust than projection methodologies at larger
scales. While population is particularly difficult to
project at the sub-county level, in some cases the
distinctions can be crucial, as in the case of sea
level rise, which will have the greatest effects on
populations and housing near the coast (which may
be only a portion of the county's population).
Researchers presenting at the 2014 annual meeting
of the Population Association of America developed
a methodology for population projection suitable for
sub-county units based on two other methods, and
demonstrated the method's application by
combining it with sea level rise modeling in Coastal
Georgia (Hauer, 2014). Research of this type may
be instrumental in expanding the available methods
for projecting population attributes at the sub-
county level.
Text Box 4-8. How Can We Project the
Future at a Sub-county Level?
A study in Demography (Chi, 2009) focused on the
need for more accurate population projections at
sub-county levels, as well as a consideration of
interactions among population growth, traffic flow,
land use, and environmental impacts. The study
asked whether more knowledge, especially that of
non-demographic factors (such as socioeconomic
conditions, transportation accessibility, natural
amenities, and geophysical limitations) could
improve sub-county population projections. The
study found that knowledge did not improve
population projections at sub-county levels, when
compared with statistical and mathematical methods
of extrapolation that do not depend on outside
knowledge, but also acknowledged that knowledge-
based approaches provide other useful information
for planners, including the investigation of "what if"
scenarios that can be used to devise development
and other strategies.

26
administrative units as the basis of projections. Participants also debated the question of whether
it is more appropriate to develop county-level projections and aggregate them, or to develop
national/state projections and distribute them downward. In both cases, additional research is
needed on resolving differences across scales, particularly in cases where metropolitan areas
cross state lines. Last, the discussion also touched on issues of how to provide flexibility in
methods across time and geography, with participants making several proposals about how
different approaches could be combined to provide coverage over different time scales and/or
geographies. Ultimately, incorporating flexibility into a scenario enterprise so that it meets the
needs of multiple research communities is a challenging task, and may require using different
methods at different scales. More research is needed to understand how to effectively balance
these considerations.
Data availability was a key concern for many of the participants. In some cases, data availability
limits potential applications. For example, small counties may have insufficient data available for
use in structural models, where independent drivers for key variables are needed. Some were
concerned about the continued availability of data from the U.S. Census and the American
Community Survey due to funding uncertainty. The U.S. Census, for example has not released
state projections since 2005. Several participants agreed that a credible set of state-level
projections from the Census would be a welcomed resource, as they are the definitive source for
data. Offering new options for the future, “big data,” and new forms of private data have the
potential to generate new insights, although there are limitations and more work needs to be done
to understand the potential in this area (see Text Box 4-9).
Text Box 4-9. New Opportunities and Challenges
There was interest in “big data” and social media, in
which some participants saw a potential opportunity
to capture data in new ways. For example, cell phone
or other records could help capture seasonal or
day/night migrations in a way that U.S. Census data
cannot. However, there are availability and privacy
concerns limiting broader use at this time.
Furthermore, they highlight the need to maintain
adequate representative sampling, as the population of
cell phone users, for example, may behave differently
from the rest of the population. It is important to
articulate these biases. One presenter also cautioned
how new techniques need to be carefully considered.
Nighttime light mapping has been used in a number of
applications recently, but a night light map of western
North Dakota reveals an unusual and extensive pattern
of lights that is explained by oil and gas extraction
activities, and not permanent urban settlements.
Source: NASA Earth Observatory and NOAA National
Geophysical Data Center.

27
Capabilities: Revisiting the Issues
Particularly at the national level, researchers have many of the capabilities needed to project
population and provide support for climate change assessments and policy development and to
meet other governmental policy and planning needs. However, researchers do not always have a
lot of confidence in these projections, particularly at fine geographic scales and over long time
periods, both of which are critical to climate change studies. Moreover, there is a lack of
systematic understanding of how non-demographic factors influence population, as well as how
to project these factors; if these factors are as important as some researchers believe (see Text
Box 4-10), then developing new methods that can project these population characteristics with
low uncertainty will be important to developing long-term population projections that meet a
variety of user needs.
At larger geographic scales, researchers have confidence in these projection methods and data,
but uncertainty increases with smaller geographies and increased demographic detail. One of the
presenters at the workshop illustrated the current state of the science using Figure 4-4 (see next
page).
In Figure 4-4, the green areas represent the standard demographic variables (age, sex, and race),
for which well-understood and
commonly applied methods
(such as the cohort-component
method) exist to project
population at the national,
state, and even county levels.
The yellow cells represent
socioeconomic variables, such
as health, status, education,
and income, which (as
described above) are more
difficult to project, even at the
national level. Going beyond the county level, to develop sub-county projections, presents its
own set of complications; many of the methods that can be applied at higher geographic scales
break down at the sub-county level, as uncertainty increases at smaller scales.
Text Box 4-10. Adding Education as a Standard Demographic Dimension
Canadian demographer Nathan Keyfitz wrote a famous paper (1981), in which he expressed the view that
demographic trends are easier to forecast than many social and economic trends. However, socioeconomic
variables may be important to understanding demographic trends, as well as key drivers of impacts or other
outcomes (see Text Box 4-4).
A recent paper by Lutz & Skirbekk (2014) provides evidence of a causal relationship between education and
health and fertility-related outcomes, making the case that education should be systematically added to age and
sex as a third standard demographic dimension.
Figure 4-4. Projection feasibility by population
characteristic and geographic resolution

28
The gray areas indicate the greatest challenges—projecting socioeconomic characteristics at the
sub-county level. Yet, as described previously in Text Box 4-7, sub-county projections may be
essential to some user communities, such as those conducting climate impact assessments, and so
new methods may need to be developed and applied.
Scenarios may be able to inform population projections where uncertainty is high, such as sub-
county projections of socioeconomic variables. Since the future remains uncertain, scenarios can
be used to consider the impact of specific changes (i.e., “what if?” scenarios) or various potential
futures based on combinations of assumptions.
5. Key Insights from Workshop Discussions
Developing population projections that have a high level of spatial resolution and include
socioeconomic characteristics of the population is difficult and sometimes infeasible.
Projecting over a long time horizon increases the uncertainty.
Many users indicated a desire for higher resolution projections as well as a list of population
characteristics. Small-area or higher-resolution (i.e., sub-county) population projections are used
for a variety of planning and budgeting purposes (e.g., land use, public school construction,
conservation strategies, future water consumption). Population characteristics that were
frequently mentioned included age, sex, urban/rural or density, education, health status, and
Key Points: Capabilities for Developing U.S. Population Scenarios
1. Scenarios and projections differ in terms of plausibility and comprehensiveness: scenarios typically are
more comprehensive than projections because of the greater number of elements they include in describing
the future state of the world. However, projections, unlike scenarios, are sometimes assigned probabilities.
Scenarios are one way of handling the large uncertainty about future conditions that can be associated with
projections.
2. Practically speaking, scenarios can be as important as projections for state and local policy issues: scenarios
can assist the researcher in quantifying a plausible storyline, bracketing a range of outcomes, or supporting
planning to achieve aspirational scenarios.
3. Global scenarios can inform and support the development of national and sub-national scenarios; however,
consistency should not constrain national scenarios from reflecting nationally relevant factors and conditions.
4. The user community faces tradeoffs when applying existing tools, data, and methods to projections that
incorporate different population attributes and different levels of spatial and temporal detail.
5. Applying existing models, collecting important data, and developing new techniques will all be part of
developing population projections to suit a variety of purposes, as well as transforming qualitative and
quantitative scenarios into quantitative population projections.
6. Scenarios can play a useful role in exploring projections of socioeconomic, spatial, or temporal detail
where confidence in data and methods is low.

29
income. However, the production of well-grounded projections involves a tradeoff between
spatial resolution and population characteristics; this tradeoff becomes even more pronounced
when projecting on the time scales typically used in global change assessments. In particular,
many workshop participants expressed unease in projecting non-demographic characteristics at
sub-national scales. Even for projections based on demographic factors, there is strong evidence
that projection uncertainty grows with finer spatial resolution and with longer time horizons.
Trying to do all three—non-demographic factors, fine resolution, and long time frames—is
challenging and may not be feasible with current understanding and available data.
Sub-county population projections are needed for climate impacts research and
adaptation planning.
Although projecting sub-county populations over longer time periods poses significant
challenges, they are needed for understanding the implications of climate change for the United
States. Hierarchical approaches have been used to develop such fine-scale population estimates
and forecasts for a wide array of analyses. In this approach, national, state, or county projections
are developed by authoritative sources (e.g., U.S. Census or state demographers), typically using
some variant of the cohort component method. Higher resolution projections for specific small
areas are made using a variety of approaches including trend extrapolation and ratio methods,
cohort-component methods (e.g., Hamilton-Perry), housing unit allocation approaches, structural
or “knowledge-based” models (e.g., economic-demographic, urban systems), and
microsimulation or agent-based models. Sub-county population projections are available for
many states, and there are guidelines for preparing these projections (see, for example, Smith et
al., 2013; Chapin and Diaz-Venegas, 2007). In some states, local knowledge about future
development and other factors is used to adjust sub-county projections.7 The private sector also
prepares localized population projections. Currently, however, there is no uniform method used
across the country for sub-county population projections.
Projecting sub-county populations has become increasingly important as understanding climate
change impacts on human populations and adaptive decision making have become new foci for
the climate change community. For example, sea level rise will not affect coastal county
populations equally; communities closer to the ocean will be more impacted and have a greater
need to adapt than those further away (within the same county). Sub-county population
projections are an active area of research and investigators are evaluating the usefulness of new
data and methods such as satellite remote sensing, cell phone data, and multiple regression
approaches. Given the need for high spatial resolution population data, research to address
concerns about uncertainty is a priority. A systematic evaluation of the various approaches and
their utility for specific applications would provide important insights for projecting sub-county
populations for climate impact studies.
7 See, for example, Arizona population projections at: https://population.az.gov/population-projections.

30
Demographic scenarios and projections are not predictions of the future; however, they
should be well-grounded characterizations of plausible future outcomes.
Criteria for judging the quality of a scenario or projection should be based not on whether it is an
accurate and precise prediction of future conditions, but on whether it is plausible, grounded in
data, developed using trusted methods, and internally consistent. For many demographers and
practitioners, this may involve using their methods in different ways than is typically the case.
Current practice focuses on developing a population forecast (i.e., the most probable future) and
using alternative specifications of demographic components (e.g., using high/low fertility rates,
mortality rates, or migration) to bracket the forecast in order to account for uncertainty. In some
cases, the effects of differing assumptions on future populations are explored to illustrate the
sensitivity of the forecast to these assumptions. Population scenarios and projections can also be
used to support particular political, economic, or social goals through, for example, the
development of aspirational views of the future. Population scenario efforts may include non-
demographic variables (e.g., education, health status, income), as well as alternate ranges of
demographic variables—“what if”–type scenarios—to describe a broader range of future
populations. Engaging additional communities beyond demographers—such as regional
economists, urban planners, and GIS experts—will be necessary to design broader scenarios of
societal changes that are capable of informing demographic projections. Climate offices in large
cities are another source of scenario information; they may offer additional insights for
understanding how to move forward with scenarios and projections.
Maintaining and improving demographic data is essential to producing high-quality
population projections for use in global change scenarios.
The importance of preserving and strengthening existing data collection efforts and datasets,
such as the American Community Survey (ACS), IRS datasets, National Center for Health
Statistics, and state offices of vital statistics, was noted by several workshop participants.
Consistent and cohesive collection of population, social, housing, and economic characteristics
facilitate the development of population projections. Moreover these data are familiar to many
users as they are routinely used by a wide range of groups including Federal, state, and local
agencies, NGOs, emergency planners, the private sector, and the general public. The ACS, in
particular, was mentioned as it is an important source of non-demographic information critical
for advancing our understanding. However, the ACS collects these data through surveys and
there is interest in developing more efficient and effective ways to get at the same data.
Participants noted that changes in information technology are opening up new possibilities. Big
data could be potentially quite useful, although data quality may be an issue. For example, these
data may not be representative of the whole population and therefore may not be suitable for
scientific uses. There are also privacy concerns and potential restrictions on sharing data. The
widespread use of GPS, such as in cell phones, may provide data for tracking temporary
migration, such as vacation travel and commuting patterns (i.e., day vs. night populations).

31
Satellite remote sensing has also opened new opportunities to track urban change (e.g., National
Urban Change Indicator) and inform population projections.
Methods for producing national-level, spatially explicit population projections are at
relatively early phases of development; efforts to compare methods and model
simulations would facilitate further development of methods as well as help define the
research agenda
Nationally benchmarked, spatially explicit population projections would provide data needed for
climate impacts research, development of adaptation options, and the National Climate
Assessment. The climate change science community has used formal processes to compare
model simulations to observations and to each other. The current Coupled Model Inter-
comparison Project (CMIP5) provided critical support to the 5th Climate Assessment Report of
the United Nations (IPCC AR5) and along with the previous CMIP (CMIP3), the National
Climate Assessment. The CMIP process has resulted in significant improvements in our
understanding of underlying processes, identification of key uncertainties in climate modeling,
and increased the usefulness of General Circulation Model (GCM) simulations for climate
impacts research and assessment. There exists a sufficient nucleus of national, spatially explicit
population modeling efforts to make a “PopMIP” a worthwhile endeavor, providing insights and
progress similar to those for the CMIP effort. Although the U.S. Census Bureau has not been
involved much in USGCRP, it would be a central player in any PopMIP exercise.
Another outcome of a PopMIP would be a rigorous identification of highly influential yet
uncertain population drivers, pointing the direction to the most important research areas. Hybrid
modeling approaches (combining top-down and bottom-up, and merging gravity- and agent-
based modeling) could also be evaluated relative to existing methods. A PopMIP would also
promote sharing and transparency of data inputs, assumptions, modeling approaches and
simulation results.
Developing plausible alternative futures for migration, particularly internal migration,
would provide the most added value to a U.S. population scenarios effort.
Migration continues to be the most uncertain demographic factor affecting population
projections at sub-national scales. Extrapolation of historic trends, simple rule-based methods
such as gravity models, and ad hoc assumptions relating population movement to other,
especially economic, variables have all been used to project population movements between
regions and states and within states. The danger of these approaches is that major shifts in
population migration patterns that could be important for climate impact studies and assessments
would be missed. More sophisticated modeling approaches have not been used; this is due, in
part, to a lack of understanding of the dynamics of population migration and the influence of
factors such as regional economics, income, environmental amenities, density/congestion, public

32
policies, and housing markets. Further, these influences may not exhibit the same structural
relationships with population in different parts of the country. At the sub-county level, applied
demographers have generally ignored such models when developing population forecasts for
sub-county areas, as they do not perform better than simpler models.
Developing such knowledge-based projections would be particularly useful for adaptation
studies. Additional “levers” would allow the analyst to explore feedbacks from climate change
and adaptation policies to population growth and economic development. Engaging additional
social sciences disciplines—such as human ecology, regional economics, population geography,
environmental sociology, and urban planning—could provide fresh views on modeling
population migration. In addition to research to develop such models, a scenario effort to explore
the effect of major population shifts is also needed to support the National Climate Assessment.
It would be useful for U.S. population scenarios to be consistent with global scenarios;
however consistency should not overly constrain the development of U.S. scenarios.
Consistency with global scenario efforts, such as SRES, SSPs, and RCPs, is beneficial.
Consistency with these efforts provides important context for interpreting results from analytic
studies and assessments. It also promotes internal consistency of climate impacts studies, i.e., the
scenario that drove the climate model and simulation results is consistent with the scenario that
drove the population projection results. Climate assessments are facilitated when the climate
impacts literature uses consistent scenarios as they can be compared and combined to yield
important insights. However, the flexibility to tailor U.S. scenarios to various needs, especially at
the finer geographic resolution needed for adaptation, needs to be preserved. The challenge for
the U.S. scenario enterprise is to develop methods such that top-down and bottom-up merging of
qualitative scenarios and quantitative simulation results are feasible and credible.
Selecting the appropriate global scenario that may be used to align a U.S. scenario effort can be
complicated. The SRES are widely known and used; given the time lags in publishing research
results, it seems prudent to maintain some connection with or acknowledgement of these global
scenarios. Newer generation scenarios (RCPs) are being used to drive global climate simulations
and maintaining internal consistency would suggest an embrace of these scenarios. Yet a third
option is the SSPs, which are designed to better link to mitigation and adaptation decision
making. It would be helpful to determine how much these scenarios overlap in the population
dimension so that equivalencies can be determined. Developing such a crosswalk would be a
useful first step in understanding which global scenario is preferable for a given purpose.
Another important issue related to the first question is how population information is to be
passed from global models to national, state, and county levels—i.e., how “tight” linkages should
be across geographic scales. One approach would be to hard-link national population totals only
and let sub-national models distribute population across the landscape without further guidance
from global scenarios. A second approach would go further and use “soft” linkages from global

33
scenarios to guide the spatial distribution of populations or to adjust demographic components of
change. The ICLUS projections are an example of such soft linkages. This approach could be
further augmented by developing relationships between global scenarios and localized features
not captured in a global setting. How information from global scenarios informs national, state,
and county projections (i.e., through hard and soft linkages) has implications for how uncertainty
is characterized. There are also path independence issues to overcome. It is important to note that
not everything needs to be carried across from global scenarios in order for it to be consistent
with U.S. scenarios.
6. Next Steps: Moving Forward with U.S. Demographic Change
Scenarios
U.S. population scenarios would improve the ability of USGCRP to inform ongoing climate
impacts research, both Integrated Assessment models and Impacts, Adaptation and Vulnerability
models, the National Climate Assessment, and decision making at all levels of government and
in the private sector. Such scenarios could also form the basis of quantitative projections using
demographic and other modeling techniques.
Workshop participants offered many suggestions for moving a USGCRP scenario enterprise
forward. These largely fell in three main categories: 1) Adopt measures to improve data
coordination and integration, 2) conduct research and develop methods, and 3) develop U.S.
population scenarios.
Adopt Measures to Improve Data Coordination and Integration
A. Inventory and evaluate existing datasets (e.g., ACS) and observations to determine how they
might be deployed to support development of spatially explicit population scenarios for the
United States. A robust data collection effort is necessary for the development of high-
quality population forecasts. The evaluation should include a characterization of data
availability, strengths, and limitations as well as identification of significant data gaps.
B. Develop coordinated information networks around demographic and key non-demographic
factors, such as regional economics, income, environmental amenities, density/congestion,
public policies, and housing markets.
1. Coordinate data collection: Collect data contemporaneously for demographic and
non-demographic factors, with the goal of collecting comparable data that can be
pooled efficiently.
2. Standardize metadata protocols: Standardize summary information and put datasets
into context in order to facilitate research on important relationships.
3. Make geospatial population data available in consistent data formats: Developing
gridded data for demographic and non-demographic data would facilitate integrated
research.
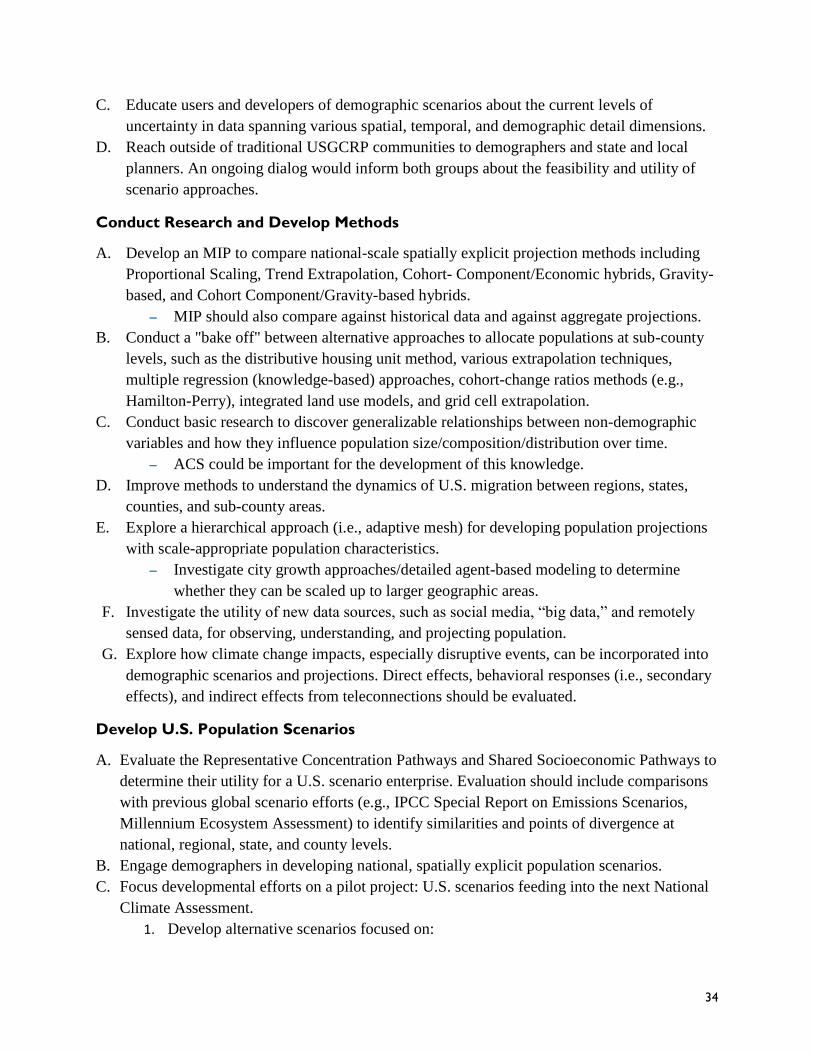
34
C. Educate users and developers of demographic scenarios about the current levels of
uncertainty in data spanning various spatial, temporal, and demographic detail dimensions.
D. Reach outside of traditional USGCRP communities to demographers and state and local
planners. An ongoing dialog would inform both groups about the feasibility and utility of
scenario approaches.
Conduct Research and Develop Methods
A. Develop an MIP to compare national-scale spatially explicit projection methods including
Proportional Scaling, Trend Extrapolation, Cohort- Component/Economic hybrids, Gravity-
based, and Cohort Component/Gravity-based hybrids.
MIP should also compare against historical data and against aggregate projections.
B. Conduct a "bake off" between alternative approaches to allocate populations at sub-county
levels, such as the distributive housing unit method, various extrapolation techniques,
multiple regression (knowledge-based) approaches, cohort-change ratios methods (e.g.,
Hamilton-Perry), integrated land use models, and grid cell extrapolation.
C. Conduct basic research to discover generalizable relationships between non-demographic
variables and how they influence population size/composition/distribution over time.
ACS could be important for the development of this knowledge.
D. Improve methods to understand the dynamics of U.S. migration between regions, states,
counties, and sub-county areas.
E. Explore a hierarchical approach (i.e., adaptive mesh) for developing population projections
with scale-appropriate population characteristics.
Investigate city growth approaches/detailed agent-based modeling to determine
whether they can be scaled up to larger geographic areas.
F. Investigate the utility of new data sources, such as social media, “big data,” and remotely
sensed data, for observing, understanding, and projecting population.
G. Explore how climate change impacts, especially disruptive events, can be incorporated into
demographic scenarios and projections. Direct effects, behavioral responses (i.e., secondary
effects), and indirect effects from teleconnections should be evaluated.
Develop U.S. Population Scenarios
A. Evaluate the Representative Concentration Pathways and Shared Socioeconomic Pathways to
determine their utility for a U.S. scenario enterprise. Evaluation should include comparisons
with previous global scenario efforts (e.g., IPCC Special Report on Emissions Scenarios,
Millennium Ecosystem Assessment) to identify similarities and points of divergence at
national, regional, state, and county levels.
B. Engage demographers in developing national, spatially explicit population scenarios.
C. Focus developmental efforts on a pilot project: U.S. scenarios feeding into the next National
Climate Assessment.
1. Develop alternative scenarios focused on:

35
a. Migration between regions (e.g., migration between the Northeast and
Southwest regions) and among states. These scenarios can be used to explore
“what if” situations that are of particular interest to regional stakeholders.
b. Urban development patterns (e.g., urban infill, dispersion to exurban and rural
areas, consolidation of suburban centers).
2. Work with end users/local governments to ensure top-down, demographically driven,
spatially explicit population scenarios can be merged with participatory, bottom up
scenarios that can incorporate detailed, localized data (e.g., zoning changes, housing
development, and tax rates/assessments).

36
References
Balk, D. 2014. Overview of challenges in projecting demographic change. Presentation at the
Towards Scenarios of U.S. Demographic Change workshop, Rockville, MD. June 23 –
24, 2014. Available at: http://www.globalchange.gov/about/iwgs/scenarios-
resources/workshop-presentations.
Blumerman, L. M. and P. M. Vidal. 2009. Uses of population and income statistics in Federal
funds distribution–with a focus on Census Bureau data. Governments Division Report
Series, Research Report #2009‐1.
Butz, W.P., W. Lutz, and J. Sendzimir (Eds.). 2014. Special feature: education and differential
vulnerability to natural disasters. Ecology and Society, March 2014.
Carter, T.R., R.N. Jones, X. Lu, et al. 2007. New assessment methods and the characterization of
future conditions. In: M.L. Parry, O.F. Canziani, J.P. Palutikof, P.J. van der Linden, C.E.
Hanson (eds). Climate Change 2007: Impacts, Adaptation and Vulnerability:
Contribution of Working Group II to the Fourth Assessment Report of the
Intergovernmental Panel on Climate Change. Cambridge, UK and New York:
Cambridge University Press. Available at: http://www.ipcc.ch/pdf/assessment-
report/ar4/wg2/ar4-wg2-chapter2.pdf.
Chapin, T. and C. Diaz-Venegas. 2007. Local government guide to population estimations and
projection techniques: a guide to data sources and methodologies for projecting
population growth. Florida Department of Community Affairs, Division of Community
Planning. Available at:
http://film.fsu.edu/content/download/75564/828103/file/Local%20Government%20Guide
%20to%20Population%20Estimation%20and%20Projection%20Techniques-
%20A%20Guide%20to%20Data%20Sources%20and%20Methodologies%20for%20Fore
casting%20Population%20Growth.pdf.
Chi, G. 2009. Can knowledge improve population forecasts at subcounty levels? Demography,
46(2): 405–427.
Chi, G. and P. Voss. 2011. Small-area population forecasting: borrowing strength across space
and time. Population, Space and Place 17(5): 505–520.
Duleep, H., and D. Dowhan. 2008. Adding immigrants to microsimulation models. Social
Security Bulletin 68(1): 51–66.
Envision Utah. 2014. Envision Utah’s process. Available at: http://envisionutah.org/process.
Accessed October 24, 2014.
Grübler, A., B. O’Neill, K. Riahi, V. Chirkov, A. Goujon, P. Kolp, I. Prommer, S. Scherbov, and
E. Slentoe. 2007. Regional, national, and spatially explicit scenarios of demographic and
economic change based on SRES. Technological Forecasting and Social Change, 74:
980–1029.

37
Hamilton, C. H. and J. Perry. 1962. A short method for projecting population by age from one
decennial census to another. Social Forces, 41: 163–170.
Hauer, M. 2014. Sub-county population projections and sea level rise in coastal Georgia. Paper
presented at the Population Association of America 2014 Annual Meeting. May 1–3,
2014. Boston, MA. Available at: http://paa2014.princeton.edu/papers/142367.
Jiang, L. 2014. Demographic components of the new societal scenarios for climate change
research. Presentation at the Towards Scenarios of U.S. Demographic Change workshop,
Rockville, MD, June 23–24, 2014. Available at:
http://www.globalchange.gov/about/iwgs/scenarios-resources/workshop-presentations.
Jones, B. 2014. Data challenges for spatial population projections. Presentation at the Towards
Scenarios of U.S. Demographic Change workshop, Rockville, MD, June 23–24, 2014.
Available at: http://www.globalchange.gov/about/iwgs/scenarios-resources/workshop-
presentations.
Keyfitz, N. 1981. The limits of population forecasting. Population and Development Review
7(4): 579–593.
Kram, T. 2012. Progress report on the community driven scenario process: new framework for
future scenario development. Presentation at the 35th Session of the IPCC, Geneva, June
8, 2012. Available at:
https://www.ipcc.ch/pdf/presentations/scenarios/new_scenarios_IPCC_P35_Kram.pdf.
Lutz, W, and V. Skirbekk. 2014. How education drives demography and knowledge informs
projections, in World Population and Human Capital in the 21st Century. Oxford, UK:
Oxford University Press.
Millennium Ecosystem Assessment. 2005. Ecosystems and Human Well-being: Scenarios,
Volume 2. Washington, DC: Island Press.
Montgomery, M.R. and J.B. Casterline. 1996. Social learning, social influence and new models
of fertility. Population and Development Review 22: 151–175.
Moss, R. 2014. Scenarios: background and update for workshop participants. Webinar presented
to the Population and Land use/cover Interagency Workshops. May 28, 2014. Available
at:
http://www.globalchange.gov/sites/globalchange/files/Moss_Scenarios_webinar_2014-
05-28.pdf.
Murdock, S. 2014. Determinants of U.S. national population change. Presentation at the Towards
Scenarios of U.S. Demographic Change workshop, Rockville, MD, June 23–24, 2014.
Available at: http://www.globalchange.gov/about/iwgs/scenarios-resources/workshop-
presentations.

38
Nakićenović, N., J. Alcamo, G. Davis, et al. 2000. Special Report on Emissions Scenarios.
Cambridge, UK and New York: Cambridge University Press. Available at:
http://www.grida.no/publications/other/ipcc_sr/?src=/climate/ipcc/emission/.
OASDI (Board of Trustees of the Federal Old-Age and Survivors Insurance and Federal
Disability Insurance Trust Funds). 2014. Annual report. Available at:
http://www.ssa.gov/oact/tr/2014/tr2014.pdf. Accessed October 15, 2014.
O’Neill, B. 2014a. Projections, scenarios, and their relation. Presentation at the Towards
Scenarios of U.S. Demographic Change workshop, Rockville, MD, June 23–24, 2014.
Available at: http://www.globalchange.gov/about/iwgs/scenarios-resources/workshop-
presentations.
O’Neill, B. 2014b. Overview of global scenarios and the new climate change scenario process.
Presentation at the Towards Scenarios of U.S. Demographic Change workshop,
Rockville, MD, June 23–24, 2014. Available at:
http://www.globalchange.gov/about/iwgs/scenarios-resources/workshop-presentations.
Partridge, M. 2014. Determinants of U.S. regional population change. Presentation at the
Towards Scenarios of U.S. Demographic Change workshop, Rockville, MD, June 23–24,
2014. Available at: http://www.globalchange.gov/about/iwgs/scenarios-
resources/workshop-presentations.
Pinkham, R. 2002. North Central Arizona water demand study. Available at:
http://www.rmi.org/Knowledge-Center/Library/W02-18_NorthCentralArizonaWater.
Accessed October 15, 2014.
Smith, S. 2014. Approaches to projections for states and smaller regions. Presentation at the
Towards Scenarios of U.S. Demographic Change workshop, Rockville, MD, June 23–24,
2014. Available at: http://www.globalchange.gov/about/iwgs/scenarios-
resources/workshop-presentations.
Smith, S.K., J. Tayman, and D.A. Swanson. 2013. A Practioner’s Guide to State and Local
Population Projections. (The Springer Series on Demographic Methods and Population
Analysis.) Heidelberg, New York, London: Springer Dordrecht.
Solomon, S., D. Qin, M. Manning, Z. Chen, M. Marquis, K.B. Averyt, M. Tignor, and H.L.
Miller, eds. 2007. Climate Change 2007: The Physical Science Basis: Contribution of
Working Group I to the Fourth Assessment Report of the Intergovernmental Panel on
Climate Change. Cambridge, UK and New York: Cambridge University Press.
UNEP (United Nations Environment Programme). 2012. Global Environment Outlook Geo 5:
Environment for the Future We Want. Nairobi, Kenya: United Nations Environment
Program.
U.S. Census Bureau. 2012. Methodology and assumptions for the 2012 national projections.
Available at:
http://www.census.gov/population/projections/files/methodology/methodstatement12.pdf.
Accessed October 15, 2014.

39
U.S. EPA. 2009. Land-use scenarios: National-scale housing-density scenarios consistent with
climate change storylines (Final Report). EPA/600/R-08/076F.
USGCRP (U.S. Global Change Research Program). 2014a. Mission, vision and strategic plan.
Available at: http://www.globalchange.gov/about/mission-vision-strategic-plan. Accessed
August 1, 2014.
USGCRP. 2014b. Interagency working groups. Available at:
http://www.globalchange.gov/about/iwgs. Accessed August 1, 2014.
USGCRP. 2014c. Scenarios and interpretive science coordinating group resources. Available at:
http://www.globalchange.gov/about/iwgs/scenarios-resources. Accessed August 1, 2014.
van Vuuren, D.P., P.L. Lucas, and H. Hilderink. 2007. Downscaling drivers of global
environmental change: enabling use of global SRES scenarios at the national and grid
levels. Global Environmental Change, 17: 114–30.
van Vuuren, D.P. et al. 2011. The representative concentration pathways: an overview. Climatic
Change 109 (1-2): 5–31.
Weaver, C.P., R.J. Lempert, C. Brown, J.A. Hall, D. Revell, and D. Sarewitz. 2013. Improving
the contribution of climate model information to decision-making: The value and
demands of robust decision frameworks. Wiley Interdisciplinary Reviews Climate
Change, 4, 39–60.

40
Appendix A: Committees
Scientific Steering Committee (SSC)
Brian O’Neill (Chair), National Center for Atmospheric Research
Deborah Balk, CUNY Institute for Demographic Research
Budhendra Bhaduri, Oak Ridge National Laboratory
Roger Hammer, Oregon State University
Ken Johnson, University of New Hampshire
Mark Montgomery, Stony Brook University/Population Council
Richard Moss, Joint Global Change Research Institute, Pacific Northwest National
Laboratory/University of Maryland
Federal Coordinating Group (FCG)
Anne Grambsch (Co-Chair), U.S. Environmental Protection Agency
Bob Vallario (Co-Chair), U.S. Department of Energy
Thomas Cuddy, U.S. Department of Transportation
Philip Morefield, U.S. Environmental Protection Agency
Libby White, U.S. Department of Energy
U.S. Global Change Research Program Scenarios and Interpretive Science Coordinating
Group
Bob Vallario (Co-chair), U.S. Department of Energy Linda Langner (Co-chair), U.S. Department of Agriculture Forest Service
Susan Aragon-Long, U.S. Global Change Research Program
Virginia Burkett, U.S. Department of the Interior Geological Survey
Alison Delgado, U.S. Global Change Research Program/Joint Global Change Research Institute
Dave Easterling, National Oceanic and Atmospheric Administration
Anne Grambsch, U.S. Environmental Protection Agency
John Hall, U.S. Department of Defense
Allison Leidner, National Aeronautics and Space Administration
Fred Lipschultz, U.S. Global Change Research Program
Chris Weaver, U.S. Global Change Research Program
ICF International (ICFI) Production Team
Anne Choate
Phillip Groth
Tara Hamilton
Cory Jemison
Nikita Pavlenko
Marybeth Riley-Gilbert
Dana Spindler
Frances Sussman

41
Appendix B: Workshop Agenda
Towards Scenarios of U.S. Demographic Change
Hilton Washington DC/Rockville Hotel & Executive Meeting Center
1750 Rockville Pike, Rockville, MD 20852
June 23–24, 2014
Overview and Objectives
The purpose of this workshop is to assess key factors involved in the production of long-term
scenarios of U.S. demographic change for use in interdisciplinary analysis of social and
environmental issues. The workshop will identify key user needs for demographic information;
assess observational, data, and modeling capabilities to produce such long-term projections; and
consider the relevance of non-demographic factors and global context for U.S. demographic
change.
The workshop is intended to bring together a group of experts from different backgrounds.
Anticipated outcomes are focused on improving our understanding of:
Key user needs for population scenarios, in order to guide the scenario production
effort,
Feasibility of producing projections of various population characteristics and
geographic scales, limitations and opportunities in terms of data and methods, and
Pros and cons of linking U.S. scenarios to global scenario exercises, consider what
other socioeconomic factors would be important to demographic projections, and
recommend process for carrying forward the U.S. scenarios activity.
Day 1: June 23, 2014
I. Monday a.m.: Welcome and overview (11:00–12:00)
Session Chair: Richard Moss, Joint Global Change Research Institute, DOE Pacific
Northwest National Laboratory
11:00–11:10 Welcome and USGCRP perspective (Bob Vallario, U.S. Department of Energy)
11:10–11:20 Welcome, meeting goals, overview of agenda (Brian O’Neill, National Center
for Atmospheric Research – NCAR)
11:20–11:40 Overview of use of population projections in global and environmental
change applications (Brian O’Neill, NCAR)
11:40–12:00 Overview of challenges in projecting demographic change (Deborah Balk,
Baruch College/ The City University of New York – CUNY )
12:00–1:00 Lunch

42
II. Monday p.m.: User needs (1:00–5:30) Session Chair: Mark Montgomery, Population
Council
Session goal: Understand key user needs for population scenarios, in order to guide the
scenario production effort.
1:00–3:00 Plenary Talks
1:00–1:30 An initial view on user needs from a state demographer (David Egan-
Robertson, University of Wisconsin-Madison)
1:30–2:00 Use of population projections in climate change impacts and vulnerability
research (Ben Preston, Oak Ridge National Laboratory)
2:00–2:30 Population scenarios to inform predictive health models of climate change
impacts (John Balbus, U.S. Department of Health and Human Services)
2:30–3:00 Break
3:00–4:30 Breakout session: user needs
Group 1 Chair: Anne Grambsch, U.S. EPA
Group 2 Chair: Richard Moss, Joint Global Change Research Institute
Group 3 Chair: Budhu Bhaduri, ORNL
Key questions to address:
What characteristics of population, spatial/temporal scales, and types of scenarios are most
important to users, and for what purpose?
1. Population characteristics: size, age, sex, urban/rural, income, education, etc.
2. Spatial scales of interest: national, state, county, grid, eco-region, etc.
3. Temporal scales of interest: <1 year, 10 years, 50 years, 100 years, etc.
4. Types of scenarios: central/business as usual, extreme outcomes, types of variants,
uncertainties that are important to cover, etc.
4:30–5:30 Report back to plenary
Day 2: June 24, 2014
III. Tuesday a.m.: Methods and data (8:30–12:00) Session Chair: Budhu Bhaduri, DOE Oak
Ridge National Laboratory

43
Tuesday a.m. session goal: Understand feasibility of producing projections of various
population characteristics and geographic scales, limitations and opportunities in terms of data
and methods.
8:30–10:00 Plenary Talks
8:30–9:00 Approaches to projections for states and smaller regions (Stan Smith,
University of Florida)
9:00–9:30 Spatial projections of housing units with the ICLUS model (Dave Theobald,
Conservation Science Partners)
9:30–10:00 Data challenges for spatial population projections (Bryan Jones, The City
University of New York – CUNY)
10:00–10:30 Break
10:30–12:00 Breakout session: methods and data
Group 1: Focused on consistency across scales – Chair: Roger Hammer, Oregon State
University
Group 2: Focused on urban community considerations – Chair: Deborah Balk, Baruch
College/CUNY
Group 3: Focused on rural community considerations – Chair: Ken Johnson,
University of New Hampshire
Key questions to address:
1. What approaches to projections at sub-national scales are available or on the horizon?
2. What are the key challenges to producing projections for different population
characteristics, and spatial/temporal scales?
3. Given user needs, what types of projections appear to be feasible and most likely to
meet those needs?
12:00–1:00 Lunch
IV. Tuesday p.m.: Global and societal context (1:00–5:15) Session Chair: Deborah Balk,
Baruch College/ The City University of New York
Tuesday p.m. session goal: Understand pros and cons of linking U.S. scenarios to global
scenario exercises, consider what other socioeconomic factors would be important to
demographic projections, and recommend a process for carrying forward the U.S. scenarios
activity.
1:00–1:45 Report back from morning breakouts

44
1:45–3:00 Plenary talks
1:45–2:00 Overview of global scenarios and the new climate change scenario process (Brian O’Neill, NCAR)
2:00–2:20 Demographic components of the new societal scenarios for climate change
research (Leiwen Jiang, NCAR)
2:20–2:40 Determinants of U.S. national population change (Steve Murdock, Rice
University)
2:40–3:00 Determinants of U.S. regional population change (Mark Partridge, Ohio State
University)
3:00–3:30 Break
3:30–4:30 Breakout session: global and societal context – addressing the questions below,
each taking a different one as a starting point.
Group 1 Chair: Mark Montgomery, Population Council
How important would it be to have U.S. population scenarios that are consistent
(in some way) with global scenarios? What global scenarios might it be useful for
U.S. scenarios to be consistent with? What forms of consistency are possible and
appropriate?
Group 2 Chair: Brian O’Neill, NCAR
What non-demographic factors would be most important to consider in producing
demographic scenarios?
4:30–5:15 Report back to plenary
V. Closure: Workshop Synthesis
Session Chair: Brian O’Neill, National Center for Atmospheric Research
5:15–6:00 Synthesis of meeting recommendations and discussion of possible next steps

45
Appendix C: List of Participants
Susana Adamo, CIESIN – Columbia
University
Susan Aragon-Long, U.S. Global Change
Research Program
John Balbus, NIEHS
Deborah Balk, CUNY Institute for
Demographic Research
Budhendra Bhaduri, Oak Ridge National
Laboratory
Britta Bierwagen, U.S. Environmental
Protection Agency
Eddie Bright, Oak Ridge National
Laboratory
Brigitte Brunelle, U.S. Department of
Defense
Tess Carter, U.S. Global Change Research
Program
Guangqing Chi, South Dakota State
University
Steven Carter Christopher, National
Geospatial–Intelligence Agency
John Coulston, USDA Forest Service
John Cromartie, Economic Research
Service, USDA
Thomas Cuddy, U.S. Department of
Transportation
Alex de Sherbinin, CIESIN, Columbia
University
Alison Delgado, USGCRP / PNNL
David Easterling, NOAA/National Climatic
Data Center
David Egan-Robertson, UW-Madison
Applied Population Lab
Ilya Fischhoff, U.S. Global Change
Research Program
Gerald Geernaert, U.S. Department of
Energy
Bryce Golden-Chen, U.S. Global Change
Research Program
Anne Grambsch, U.S. Environmental
Protection Agency
Elizabeth Grieco, U.S. Census Bureau
Philip Groth, ICF International
John Hall, U.S. Department of Defense
Linda Jacobsen, Population Reference
Bureau
Cory Jemison, ICF International
Leiwen Jiang, National Center for
Atmospheric Research
Ken Johnson, University of New
Hampshire
Bryan Jones, CUNY Institute for
Demographic Research
Mike Kuperberg, U.S. Department of
Energy
Linda Langner, U.S. Forest Service

46
Allison Leidner, NASA Earth Science
Division/USRA
Fred Lipschultz, U.S. Global Change
Research Program
David McGranahan, USDA Economic
Research Service
Mark Montgomery, Stony Brook
University/Population Council
Phil Morefield, U.S. Environmental
Protection Agency
Richard Moss, Joint Global Change
Research Institute
Steve Murdock, Rice University
Brian O’Neill, NCAR/IAM Group
Mark Partridge, Ohio State University
Marc Perry, U.S. Census Bureau
Benjamin Preston, Oak Ridge National
Laboratory
Robert Scardamalia, RLS Demographics,
Inc.
Adria Schwarber, University of Maryland
Stan Smith, University of Florida
Steve Smith, Joint Global Change Research
Institute
Dave Theobald, Conservation Science
Partners
Robert Vallario, U.S. Department of
Energy
Stephen Verzi, Sandia National
Laboratories
Chris Weaver, OSTP/ USGCRP
Libby White, U.S. Department of Energy –
BER

47
Appendix D: Summary of Findings from Workshop Background
Research
Prior to the workshop, a review was conducted to identify the uses of population projections by
federal government agencies. This revealed which agencies used the projections and what type of
projections were favored by those agencies. Through this review, several key roles for
population projections emerged.
Federal Government Users of Population Projections
A wide variety of users of population projections exist within the federal government. A review
of federal agencies revealed 22 agencies and 52 projects that use long-range population
projections—defined as projections to 2030 or beyond. Presumably many of these agencies
would benefit from the development of U.S. demographic scenarios. Table D-1 provides a
breakdown of the number of projects by agency.
Table D-1. Users of population projections within the federal government
Federal Agency # of
Projects Example Use for Agency
Department of Energy (DOE) 7 Forecasting motor vehicles on a county basis to look at
electricity demand from electric vehicles.
Environmental Protection Agency
(EPA)
6 Determining the risk of water stress for certain regions.
Health & Human Services (HHS) 5 Health implications for an aging and more diverse
nation.
Department of Interior (DOI) 4 Predicting future land use and land cover change.
Department of Commerce (DOC) 3 Human impacts and vulnerabilities of growth on the
coast.
Department of Transportation (DOT) 3 Growth of traffic in the gulf coast region.
Department of Housing and Urban
Development (HUD)
3 Need for future affordable housing near transit for an
aging population.
National Aeronautics and Space
Administration (NASA)
3 Land use planning and resource management for urban
development.
U.S. Department of Agriculture
(USDA)
3 Forecasting changes in southern forests.
Social Security Advisory Board (SSAB) 2 Examining the solvency of Social Security.
Congressional Budget Office (CBO) 2 Projecting long-term government revenues and
expenditures.
Social Security Administration (SSA) 1 Examining the solvency of Social Security.
U.S. Geological Survey (USGS) 1 Examining the effects of future development on sub-
basin stream flows.
Congressional Research Service (CRS) 1 Showing how shifts in future population demographics
will shape economic and social forces.
Tennessee Valley Authority (TVA) 1 Forecasting electricity demand.
Susquehanna River Basin Commission
(SRBC)
1 Forecasting water demand.
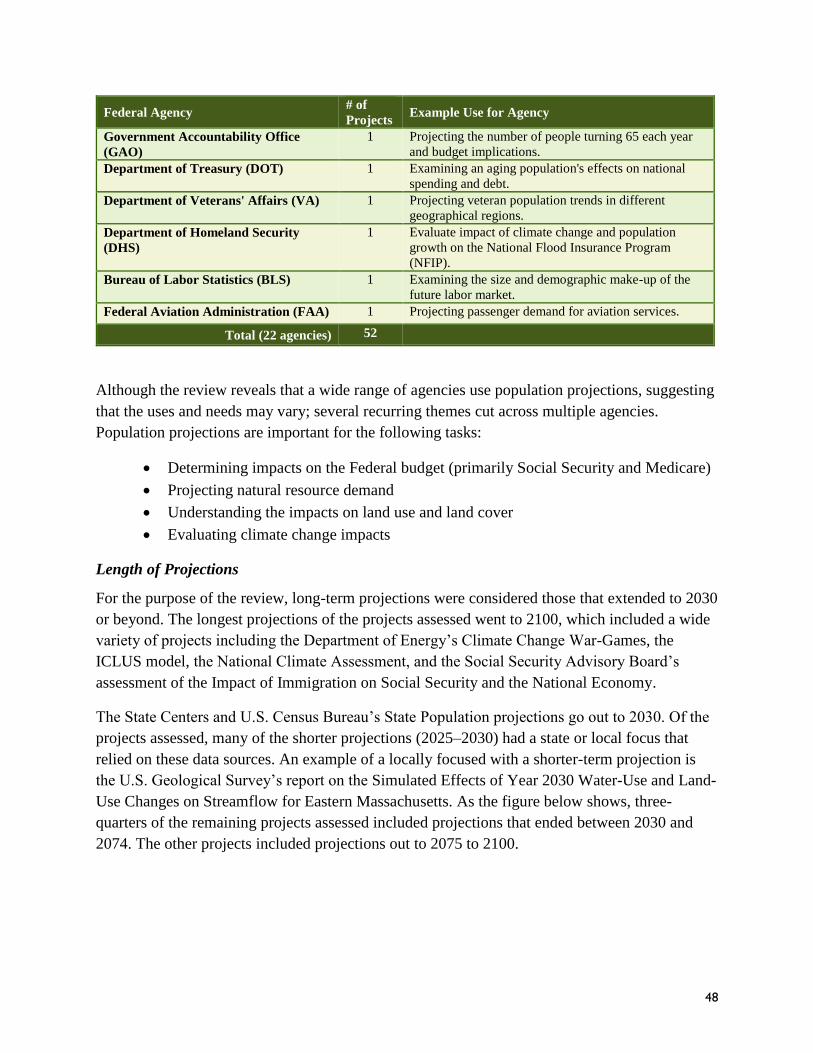
48
Federal Agency # of
Projects Example Use for Agency
Government Accountability Office
(GAO)
1 Projecting the number of people turning 65 each year
and budget implications.
Department of Treasury (DOT) 1 Examining an aging population's effects on national
spending and debt.
Department of Veterans' Affairs (VA) 1 Projecting veteran population trends in different
geographical regions.
Department of Homeland Security
(DHS)
1 Evaluate impact of climate change and population
growth on the National Flood Insurance Program
(NFIP).
Bureau of Labor Statistics (BLS) 1 Examining the size and demographic make-up of the
future labor market.
Federal Aviation Administration (FAA) 1 Projecting passenger demand for aviation services.
Total (22 agencies) 52
Although the review reveals that a wide range of agencies use population projections, suggesting
that the uses and needs may vary; several recurring themes cut across multiple agencies.
Population projections are important for the following tasks:
Determining impacts on the Federal budget (primarily Social Security and Medicare)
Projecting natural resource demand
Understanding the impacts on land use and land cover
Evaluating climate change impacts
Length of Projections
For the purpose of the review, long-term projections were considered those that extended to 2030
or beyond. The longest projections of the projects assessed went to 2100, which included a wide
variety of projects including the Department of Energy’s Climate Change War-Games, the
ICLUS model, the National Climate Assessment, and the Social Security Advisory Board’s
assessment of the Impact of Immigration on Social Security and the National Economy.
The State Centers and U.S. Census Bureau’s State Population projections go out to 2030. Of the
projects assessed, many of the shorter projections (2025–2030) had a state or local focus that
relied on these data sources. An example of a locally focused with a shorter-term projection is
the U.S. Geological Survey’s report on the Simulated Effects of Year 2030 Water-Use and Land-
Use Changes on Streamflow for Eastern Massachusetts. As the figure below shows, three-
quarters of the remaining projects assessed included projections that ended between 2030 and
2074. The other projects included projections out to 2075 to 2100.

49
As the figure below shows, a slight majority (54%) of the long-term projections (2075–2100)
were used in climate change–related models or projects. The remaining 46% of projects that used
long-term projections involved analysis of the Federal budget with respect to Social Security, an
aging population, and immigration.
Geographic Scope
A significant majority (58%) of the projects assessed used national-level population projections.
Only 11% of the projects used a global scope. The remaining projects used local level, regional
scale, or land area (e.g., GIS model relying on satellite imaging) projections.
25%
75%
Share of Population Projections by
Time Horizon
2075-2100
2030-2074
54%
46%
Share of Long-Term Population Projections by
Topic Area
Climate-Related
Other

50
Geographic Scale
The distribution of projections showing population growth on large and small scales was evenly
distributed. Just under 30% of the projections quantified results on a county-level scale, despite
being national, regional, or local in scope, whereas 35% of the projections provided results at a
national scale.
The remaining projects used a mix of scales including land area, state, census tract, or project-
specific regions.
Underlying Source Data
Almost two-thirds (69%) of projects assessed either drew solely on data from the U.S. Census
Bureau or the U.S. Census Bureau in conjunction with another data source to underpin their
projections. State- or local-level projects use State Data Centers for population projections. The
remaining population baseline data came from a variety of sources, including international data
sources, state and local data sources and project-specific survey data.
58%
11%
31%
Relative Shares of Geographic Coverage Among
Population Projections
National
Global/International
Other
29%
35%
37%
Distribution of Geographic Scales Within
Population Projections
County
National
Other