Towards an Accurate Modeling of Frequency-Dependent Wind ...
15
International Journal of Applied Power Engineering (IJAPE) Vol. 3, No. 2, August 2014, pp. 90~104 ISSN: 2252-8792 90 Journal homepage: http://iaesjournal.com/online/index.php/IJAPE Towards an Accurate Modeling of Frequency-Dependent Wind Farm Components under Transient Conditions M. A. Abd-Allah, Mahmoud N. Ali, A. Said Faculty of Engineering at Shoubra, Benha University, Egypt Article Info ABSTRACT Article history: Received Mar 2, 2014 Revised Jul 10, 2014 Accepted Jul 23, 2014 Frequency dependence complete model is set up for describing the lightning transient behavior of the wind turbines (WTs).To get an appropriate wind turbine model, a high frequency models of surge arrester protecting the boost transformer, transformer and ground electrode soil ionization are implemented. The transient responses and Ground Potential Rise (GPR) can be obtained at different locations in the WTs and connected grid in the time domain as well as in the frequency domain using Fast Fourier Transform (FFT). To check the validity of the model, Surge arresters protection level at different locations, at i.e. LV, MV and HV, is compared with ABB manufacture data sheet, Also a comparison has been made between simple and frequency dependence model of overall wind farm components using ATP/EMTP. This paper provides an accurate simulation of wind farm components under transient condition. Keyword: ATP/EMTP FFT GPR Surge arrester model Transient response WTs Copyright © 2014 Institute of Advanced Engineering and Science. All rights reserved. Corresponding Author: M. A. Abd-Allah, Faculty of Engineering at Shoubra, Benha University, Egypt. Email: [email protected] 1. INTRODUCTION With a rapid growth in wind power generation, lightning hazard to wind turbines (WTs) has come to be regarded with more attention. Due to their great height, distinctive shape, and exposed location, WTs are extremely vulnerable to lightning stroke. After a WT is struck by lightning, high lightning current flows through the WT and causes considerable damage to electrical equipment inside the WT structure and wind turbine nacelle results stop of the generator operation and probably expensive repairs [1]. In order to decrease downtime, repairs and blade damaged. Protecting the blade is very important and well-designed lightning protection is a necessity for this equipment so Modern wind turbine blades are made of insulating materials such as glass fibre reinforced plastic (GFRP) as a common material or wood epoxy. The lightning protection of wind turbine blades can be classified as receptor, metallic cap, mesh wire, and metallic conductor as reported in IEC-61400-24 standards. In general, the problem of lightning protection of wind turbine blades is to conduct the lightning current safely from the attachment point on the blade to the hub and then to the ground. However another serious problem known as "back-flow surge" which not only causes damages to the wind turbine that has been struck but also the other turbines that have not. The back-flow surge phenomenon has been defined as the surge flowing from a customer’s structure such as a communication tower into the distribution line. High resistivity soil often makes Surge Arresters (SAs) at tower earthing systems operate in reverse and allow backflow of surge current to the grid. The phenomenon of surge invasion from a wind turbine that is struck by lightning to the distribution line in a wind farm is quite similar to the case of ―back-flow surge‖ [2]. Due to significant influence on the wind farm behavior under lightning, the transient response must be either accurately measured which very expensive and time consuming or reliably predicated by simulations which allowing for parametric studies and optimization. Up till now the predominant approach
Transcript of Towards an Accurate Modeling of Frequency-Dependent Wind ...
International Journal of Applied Power Engineering (IJAPE)
Vol. 3, No. 2, August 2014, pp. 90~104
ISSN: 2252-8792 90
Journal homepage: http://iaesjournal.com/online/index.php/IJAPE
Towards an Accurate Modeling of Frequency-Dependent Wind
Farm Components under Transient Conditions
M. A. Abd-Allah, Mahmoud N. Ali, A. Said Faculty of Engineering at Shoubra, Benha University, Egypt
Article Info ABSTRACT
Article history:
Received Mar 2, 2014
Revised Jul 10, 2014
Accepted Jul 23, 2014
Frequency dependence complete model is set up for describing the lightning
transient behavior of the wind turbines (WTs).To get an appropriate wind
turbine model, a high frequency models of surge arrester protecting the boost
transformer, transformer and ground electrode soil ionization are
implemented. The transient responses and Ground Potential Rise (GPR) can
be obtained at different locations in the WTs and connected grid in the time
domain as well as in the frequency domain using Fast Fourier Transform
(FFT). To check the validity of the model, Surge arresters protection level at
different locations, at i.e. LV, MV and HV, is compared with ABB
manufacture data sheet, Also a comparison has been made between simple
and frequency dependence model of overall wind farm components using
ATP/EMTP. This paper provides an accurate simulation of wind farm
components under transient condition.
Keyword:
ATP/EMTP
FFT
GPR
Surge arrester model
Transient response
WTs Copyright © 2014 Institute of Advanced Engineering and Science.
All rights reserved.
Corresponding Author:
M. A. Abd-Allah,
Faculty of Engineering at Shoubra, Benha University, Egypt.
Email: [email protected]
1. INTRODUCTION
With a rapid growth in wind power generation, lightning hazard to wind turbines (WTs) has come to
be regarded with more attention. Due to their great height, distinctive shape, and exposed location, WTs are
extremely vulnerable to lightning stroke. After a WT is struck by lightning, high lightning current flows
through the WT and causes considerable damage to electrical equipment inside the WT structure and wind
turbine nacelle results stop of the generator operation and probably expensive repairs [1].
In order to decrease downtime, repairs and blade damaged. Protecting the blade is very important
and well-designed lightning protection is a necessity for this equipment so Modern wind turbine blades are
made of insulating materials such as glass fibre reinforced plastic (GFRP) as a common material or wood
epoxy. The lightning protection of wind turbine blades can be classified as receptor, metallic cap, mesh wire,
and metallic conductor as reported in IEC-61400-24 standards.
In general, the problem of lightning protection of wind turbine blades is to conduct the lightning
current safely from the attachment point on the blade to the hub and then to the ground.
However another serious problem known as "back-flow surge" which not only causes damages to
the wind turbine that has been struck but also the other turbines that have not. The back-flow surge
phenomenon has been defined as the surge flowing from a customer’s structure such as a communication
tower into the distribution line. High resistivity soil often makes Surge Arresters (SAs) at tower earthing
systems operate in reverse and allow backflow of surge current to the grid. The phenomenon of surge
invasion from a wind turbine that is struck by lightning to the distribution line in a wind farm is quite similar
to the case of ―back-flow surge‖ [2].
Due to significant influence on the wind farm behavior under lightning, the transient response must
be either accurately measured which very expensive and time consuming or reliably predicated by
simulations which allowing for parametric studies and optimization. Up till now the predominant approach
IJAPE ISSN: 2252-8792
Towards an Accurate Modeling of Frequecy-Dependent Wind Farm Components Under… (M. A. Abd-Allah)
91
for simulating transient due to lightning is based on the representation of the wind farm components by their
equivalent circuits. Performance of wind farm under lightning requires accurate modeling of its components.
So in this paper wind farm is implemented using high frequency models components as SA, Transformer and
ground electrode to integrally describe this lightning current path. Validation of these models and
computation, characteristics and hazards of back-flow surge in wind farm are analyzed using onshore wind
farm as an example.
2. DESCRIPTION OF THE INVESTIGATED ONSHORE WIND FARM:
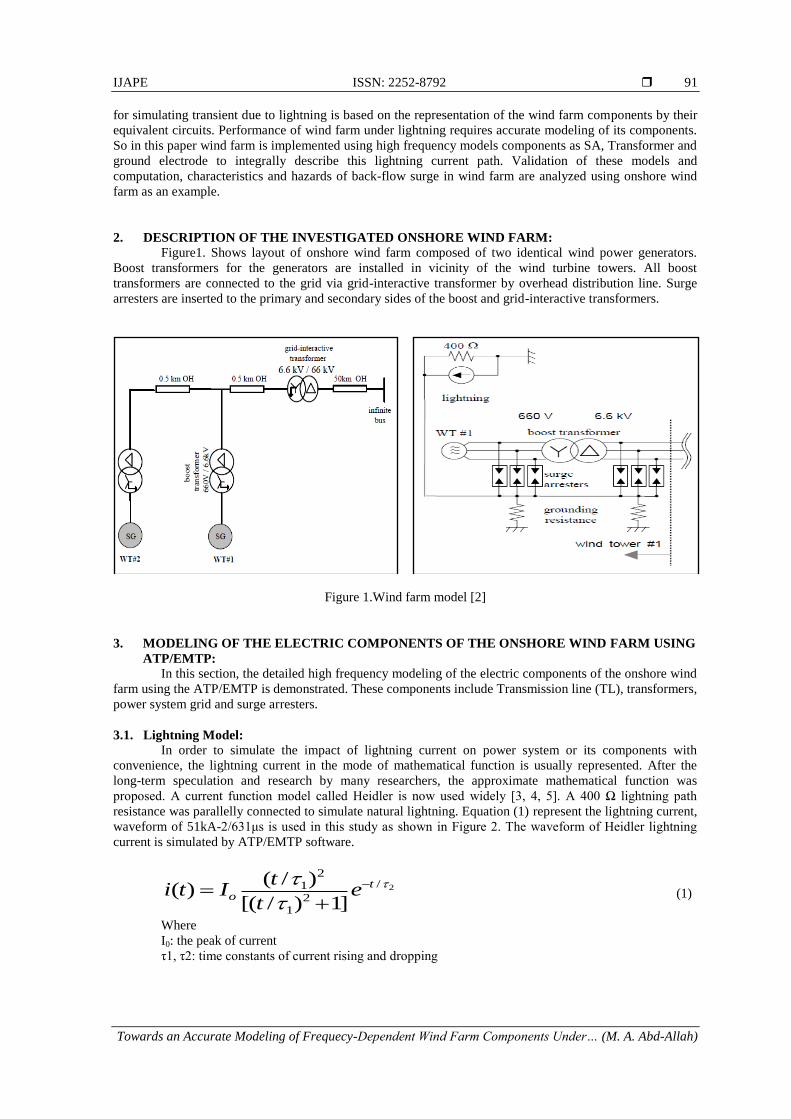
Figure1. Shows layout of onshore wind farm composed of two identical wind power generators.
Boost transformers for the generators are installed in vicinity of the wind turbine towers. All boost
transformers are connected to the grid via grid-interactive transformer by overhead distribution line. Surge
arresters are inserted to the primary and secondary sides of the boost and grid-interactive transformers.
Figure 1.Wind farm model [2]
3. MODELING OF THE ELECTRIC COMPONENTS OF THE ONSHORE WIND FARM USING
ATP/EMTP:
In this section, the detailed high frequency modeling of the electric components of the onshore wind
farm using the ATP/EMTP is demonstrated. These components include Transmission line (TL), transformers,
power system grid and surge arresters.
3.1. Lightning Model:
In order to simulate the impact of lightning current on power system or its components with
convenience, the lightning current in the mode of mathematical function is usually represented. After the
long-term speculation and research by many researchers, the approximate mathematical function was
proposed. A current function model called Heidler is now used widely [3, 4, 5]. A 400 Ω lightning path
resistance was parallelly connected to simulate natural lightning. Equation (1) represent the lightning current,
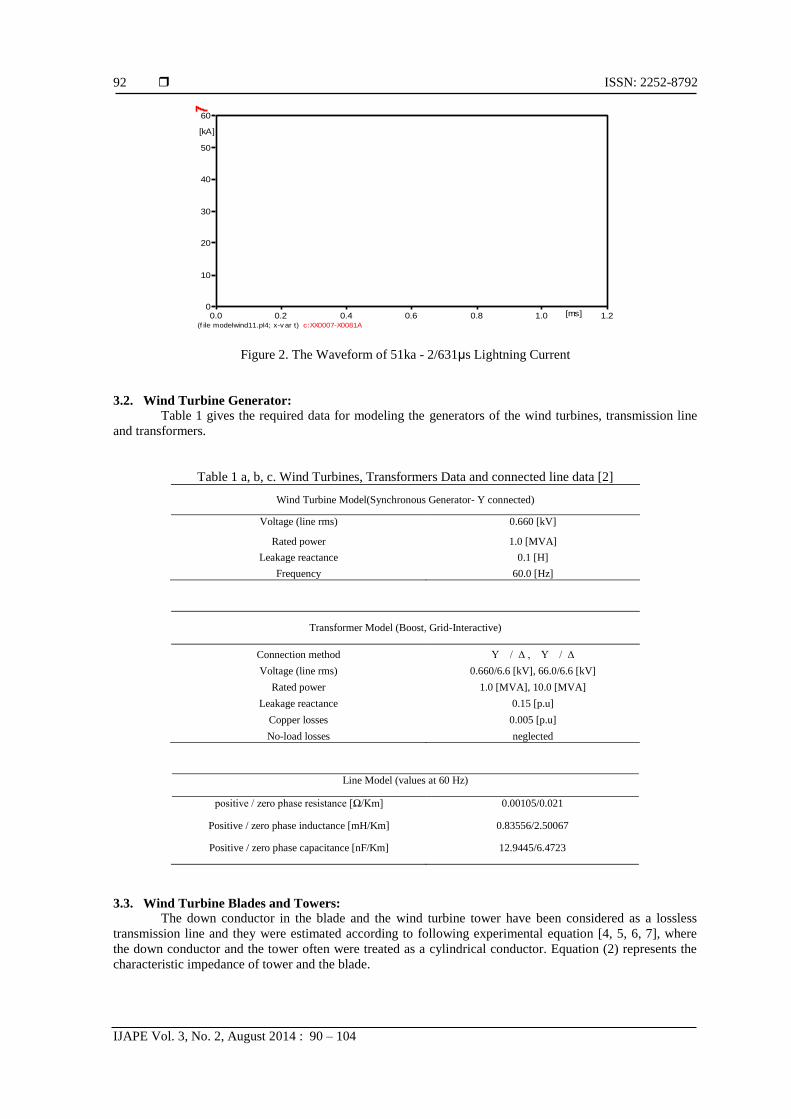
waveform of 51kA-2/631μs is used in this study as shown in Figure 2. The waveform of Heidler lightning
current is simulated by ATP/EMTP software.
2/
21
21
]1)/[(
)/()(
to e
t
tIti
(1)
Where
I0: the peak of current
τ1, τ2: time constants of current rising and dropping
ISSN: 2252-8792
IJAPE Vol. 3, No. 2, August 2014 : 90 – 104
92
Figure 2. The Waveform of 51ka - 2/631μs Lightning Current
3.2. Wind Turbine Generator:
Table 1 gives the required data for modeling the generators of the wind turbines, transmission line
and transformers.
Table 1 a, b, c. Wind Turbines, Transformers Data and connected line data [2]
Wind Turbine Model(Synchronous Generator- Y connected)
Voltage (line rms) 0.660 [kV]
Rated power 1.0 [MVA]
Leakage reactance 0.1 [H]
Frequency 60.0 [Hz]
Transformer Model (Boost, Grid-Interactive)
Connection method Y / Δ , Y / Δ
Voltage (line rms) 0.660/6.6 [kV], 66.0/6.6 [kV]
Rated power 1.0 [MVA], 10.0 [MVA]
Leakage reactance 0.15 [p.u]
Copper losses 0.005 [p.u]
No-load losses neglected
Line Model (values at 60 Hz)
positive / zero phase resistance [Ω/Km] 0.00105/0.021
Positive / zero phase inductance [mH/Km] 0.83556/2.50067
Positive / zero phase capacitance [nF/Km] 12.9445/6.4723
3.3. Wind Turbine Blades and Towers:
The down conductor in the blade and the wind turbine tower have been considered as a lossless
transmission line and they were estimated according to following experimental equation [4, 5, 6, 7], where
the down conductor and the tower often were treated as a cylindrical conductor. Equation (2) represents the
characteristic impedance of tower and the blade.
(f ile modelwind11.pl4; x-v ar t) c:XX0007-X0081A
0.0 0.2 0.4 0.6 0.8 1.0 1.2[ms]0
10
20
30
40
50
60
[kA]
IJAPE ISSN: 2252-8792
Towards an Accurate Modeling of Frequecy-Dependent Wind Farm Components Under… (M. A. Abd-Allah)
93
)222
(ln60 hr
Z (2)
Where, Z is the surge impedance, r and h are the cylinder radius and height, respectively. The wind
tower is taken as an iron vertical conductor of 60 m height and 3.0 m radius.
3.4. Transmission Lines and cables:
The overhead lines are considered and represented by single-phase positive wave impedance (i.e.
Surge impedance) with the light velocity.
CL/Z0 (3)
smLC
v /1
(4)
Where, C and L are the capacitance and inductance of line, respectively, Z0 is the surge impedance and
v is the propagation velocity [3, 8].
3.5. Transformer:
In order to study the transient involving frequencies up to a few kHz, stray capacitance of
transformer coils must be added to the transformer model. Capacitances are actually distributed, but lumped
parameters at the winding terminals for the total capacitance can be used with reasonable accuracy in this
case [3, 8, 9]. However, the transformer capacitances are often difficult to be determined. Transformer
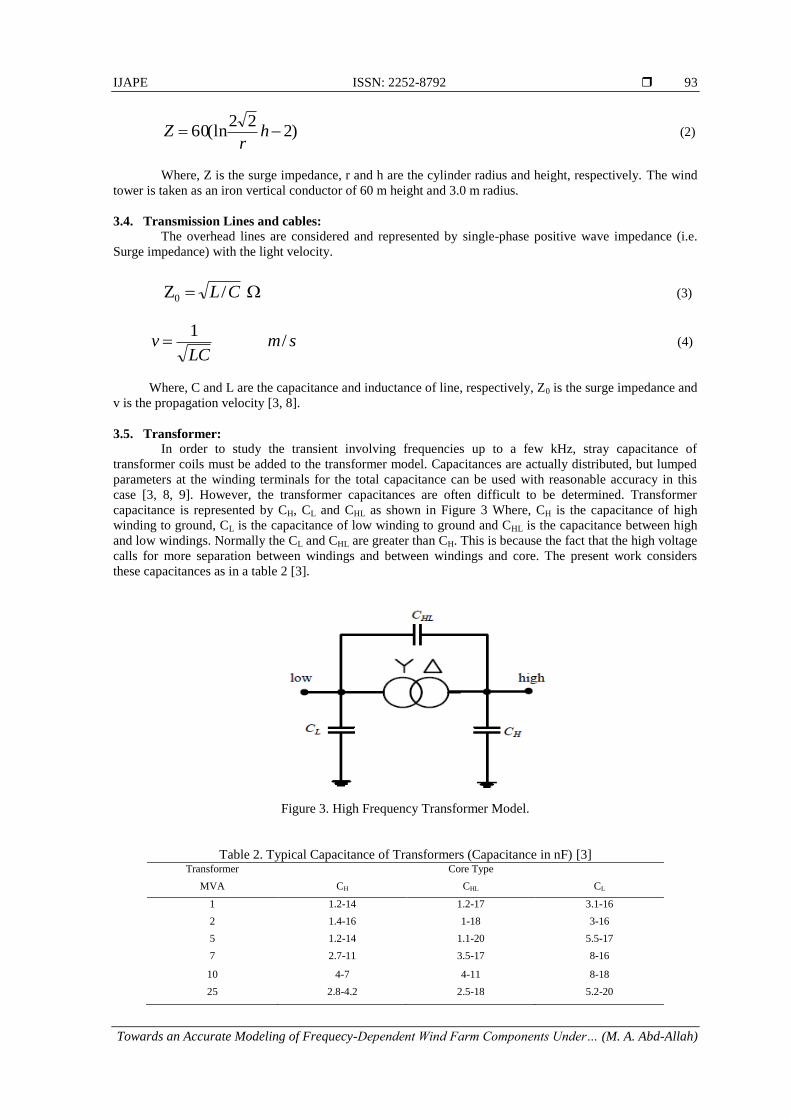
capacitance is represented by CH, CL and CHL as shown in Figure 3 Where, CH is the capacitance of high
winding to ground, CL is the capacitance of low winding to ground and CHL is the capacitance between high
and low windings. Normally the CL and CHL are greater than CH. This is because the fact that the high voltage
calls for more separation between windings and between windings and core. The present work considers
these capacitances as in a table 2 [3].
Figure 3. High Frequency Transformer Model.
Table 2. Typical Capacitance of Transformers (Capacitance in nF) [3] Transformer Core Type
MVA CH CHL CL
1 1.2-14 1.2-17 3.1-16
2 1.4-16 1-18 3-16
5 1.2-14 1.1-20 5.5-17
7 2.7-11 3.5-17 8-16
10 4-7 4-11 8-18
25 2.8-4.2 2.5-18 5.2-20
ISSN: 2252-8792
IJAPE Vol. 3, No. 2, August 2014 : 90 – 104
94
3.6. Surge Arrester:
Surge arrester devices play an important role for mitigating the overvoltage due to lightning,
switching. Under both normal and abnormal conditions, the arrester handles its operation based on its
nonlinearity, i.e. V-I characteristics [9].
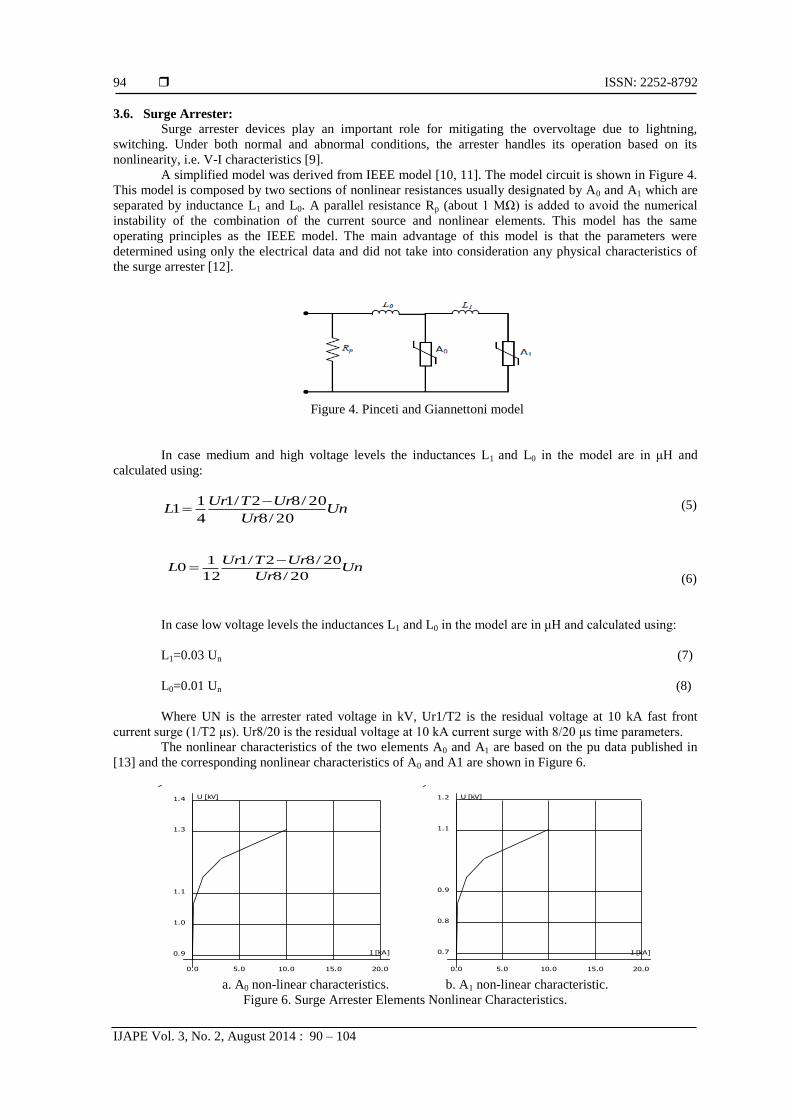
A simplified model was derived from IEEE model [10, 11]. The model circuit is shown in Figure 4.
This model is composed by two sections of nonlinear resistances usually designated by A0 and A1 which are
separated by inductance L1 and L0. A parallel resistance Rp (about 1 MΩ) is added to avoid the numerical
instability of the combination of the current source and nonlinear elements. This model has the same
operating principles as the IEEE model. The main advantage of this model is that the parameters were
determined using only the electrical data and did not take into consideration any physical characteristics of
the surge arrester [12].
Figure 4. Pinceti and Giannettoni model
In case medium and high voltage levels the inductances L1 and L0 in the model are in μH and
calculated using:
UnUr
UrTUrL
20/8
20/82/1
4
11
(5)
(6)
In case low voltage levels the inductances L1 and L0 in the model are in μH and calculated using:
L1=0.03 Un (7)
L0=0.01 Un (8)
Where UN is the arrester rated voltage in kV, Ur1/T2 is the residual voltage at 10 kA fast front
current surge (1/T2 μs). Ur8/20 is the residual voltage at 10 kA current surge with 8/20 μs time parameters.
The nonlinear characteristics of the two elements A0 and A1 are based on the pu data published in
[13] and the corresponding nonlinear characteristics of A0 and A1 are shown in Figure 6.
a. A0 non-linear characteristics. b. A1 non-linear characteristic.
Figure 6. Surge Arrester Elements Nonlinear Characteristics.
0.0 5.0 10.0 15.0 20.0
I [kA]0.9
1.0
1.1
1.3
1.4 U [kV]
0.0 5.0 10.0 15.0 20.0
I [kA]0.7
0.8
0.9
1.1
1.2 U [kV]
UnUr
UrTUrL
20/8
20/82/1
12
10
IJAPE ISSN: 2252-8792
Towards an Accurate Modeling of Frequecy-Dependent Wind Farm Components Under… (M. A. Abd-Allah)
95
The surge arrester model is simulated and tested using ATP/EMTP circuit shown in Figure 7.
Figure 7. ATP/EMTP Circuit for Surge Arrester.
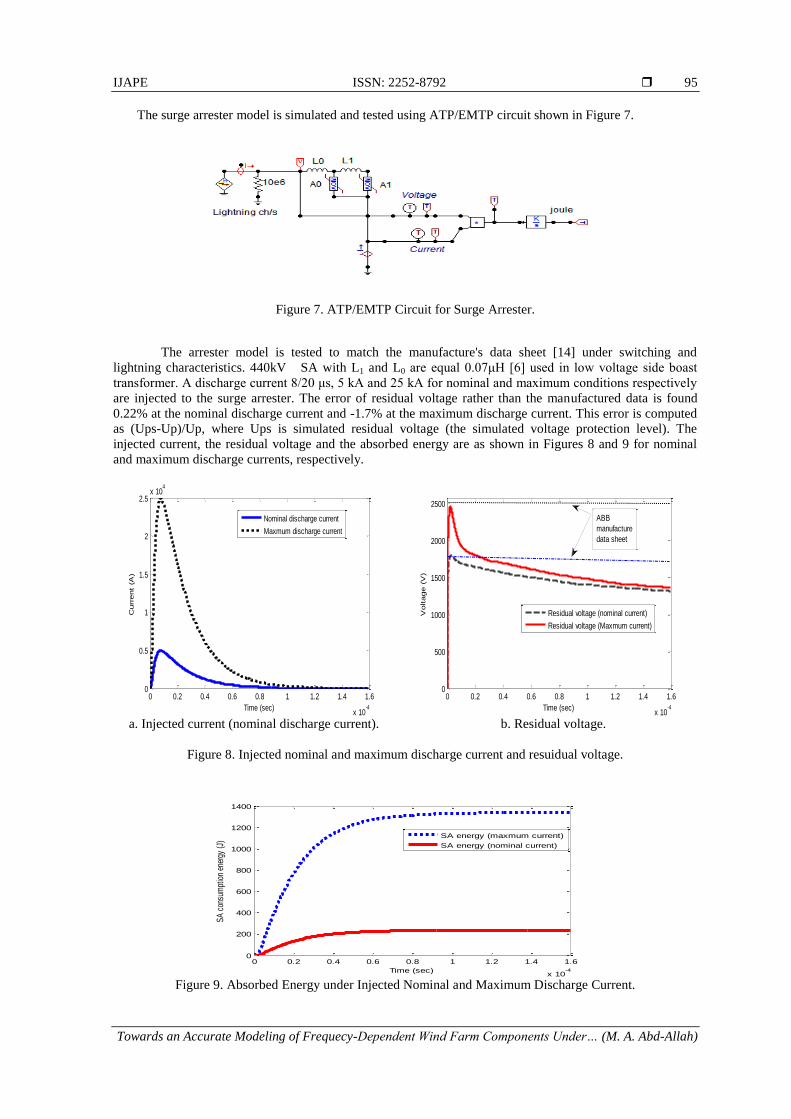
The arrester model is tested to match the manufacture's data sheet [14] under switching and
lightning characteristics. 440kV SA with L1 and L0 are equal 0.07μH [6] used in low voltage side boast
transformer. A discharge current 8/20 μs, 5 kA and 25 kA for nominal and maximum conditions respectively
are injected to the surge arrester. The error of residual voltage rather than the manufactured data is found
0.22% at the nominal discharge current and -1.7% at the maximum discharge current. This error is computed
as (Ups-Up)/Up, where Ups is simulated residual voltage (the simulated voltage protection level). The
injected current, the residual voltage and the absorbed energy are as shown in Figures 8 and 9 for nominal
and maximum discharge currents, respectively.
a. Injected current (nominal discharge current). b. Residual voltage.
Figure 8. Injected nominal and maximum discharge current and resuidual voltage.
Figure 9. Absorbed Energy under Injected Nominal and Maximum Discharge Current.
0 0.2 0.4 0.6 0.8 1 1.2 1.4 1.6
x 10-4
0
0.5
1
1.5
2
2.5x 10
4
Time (sec)
Curr
ent
(A)
Nominal discharge current
Maxmum discharge current
0 0.2 0.4 0.6 0.8 1 1.2 1.4 1.6
x 10-4
0
500
1000
1500
2000
2500
Time (sec)
Voltage (
V)
Residual voltage (nominal current)
Residual voltage (Maxmum current)
ABB
manufacture
data sheet
0 0.2 0.4 0.6 0.8 1 1.2 1.4 1.6
x 10-4
0
200
400
600
800
1000
1200
1400
Time (sec)
SA
con
sum
ptio
n en
ergy
(J)
SA energy (maxmum current)
SA energy (nominal current)
ISSN: 2252-8792
IJAPE Vol. 3, No. 2, August 2014 : 90 – 104
96
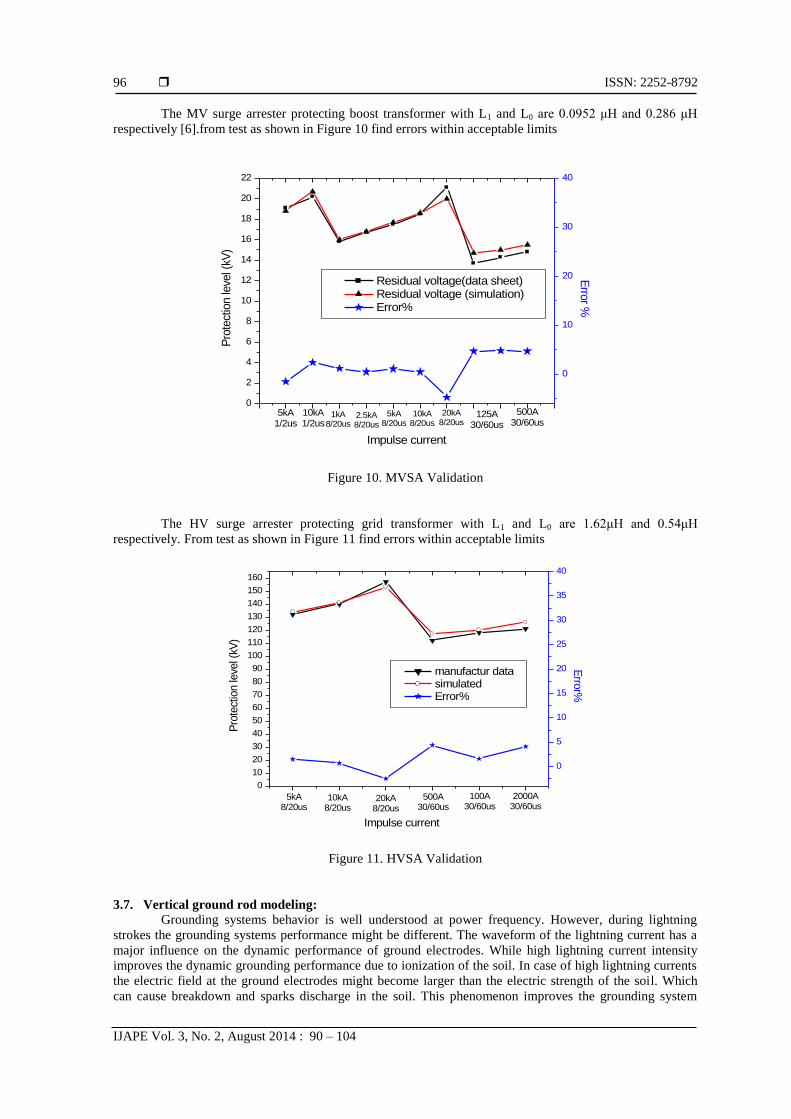
The MV surge arrester protecting boost transformer with L1 and L0 are 0.0952 μH and 0.286 μH
respectively [6].from test as shown in Figure 10 find errors within acceptable limits
0
2
4
6
8
10
12
14
16
18
20
22
500A30/60us
125A30/60us
20kA8/20us
10kA8/20us
5kA8/20us
2.5kA8/20us
1kA8/20us
10kA1/2us
5kA1/2us
Residual voltage(data sheet) Residual voltage (simulation) Error%
Impulse current
Pro
tect
ion le
vel (
kV)
0
10
20
30
40
Erro
r %
Figure 10. MVSA Validation
The HV surge arrester protecting grid transformer with L1 and L0 are 1.62μH and 0.54μH
respectively. From test as shown in Figure 11 find errors within acceptable limits
0
10
20
30
40
50
60
70
80
90
100
110
120
130
140
150
160
2000A30/60us
100A30/60us
500A30/60us
20kA8/20us
10kA8/20us
5kA8/20us
manufactur data simulated Error%
Impulse current
Pro
tect
ion le
vel (
kV)
0
5
10
15
20
25
30
35
40
Erro
r%
Figure 11. HVSA Validation
3.7. Vertical ground rod modeling:
Grounding systems behavior is well understood at power frequency. However, during lightning
strokes the grounding systems performance might be different. The waveform of the lightning current has a
major influence on the dynamic performance of ground electrodes. While high lightning current intensity
improves the dynamic grounding performance due to ionization of the soil. In case of high lightning currents
the electric field at the ground electrodes might become larger than the electric strength of the soil. Which
can cause breakdown and sparks discharge in the soil. This phenomenon improves the grounding system
IJAPE ISSN: 2252-8792
Towards an Accurate Modeling of Frequecy-Dependent Wind Farm Components Under… (M. A. Abd-Allah)
97
performance so its ignoring always gives inaccurate results. On the other hand, due to the frequency
dependent phenomena, the grounding performance might be much worse during fast front lightning current
pulses. This can deteriorate the efficiency of the protection. Grounding system of a wind turbine plays a
critical role, since overvoltages caused by lightning strikes and other faults has to be successfully dispersed
into the ground. So, it is important to get an accurate model of the wind turbine grounding system. In this
paper the behavior of the wind turbine under lightning strikes has been studied using two different models for
the grounding resistance [15]. The first model is the linear model of grounding resistance which is based on a
constant value for the grounding resistance i.e. low voltage, low frequency [16]. The constant resistance Ro
of the model is estimated in ohm based on the rod dimensions and the soil parameters [15]:
14
ln2
0 a
l
lR
(9)
Where, ρ is the soil resistivity (Ω.m), L is the electrode length (m) and a is the electrode radius (m).
The other model is based on the nonlinear performance of the grounding resistance with high
currents i.e. high voltage, high frequency [16]. The nonlinearity nature of the ground resistance can be
represented by a nonlinear resistance, RT, whose value is given as [15];
)(
1
)(
0
0
IgiFor
Ig
i
RRt
IgiForRRt
(10)
Where, i is the current through the rod (kA), and Ig is the critical current for soil ionization (kA)
which is given by:
2
0
0
2 R
EIg
(11)
Where, E0 is the critical soil ionization gradient.
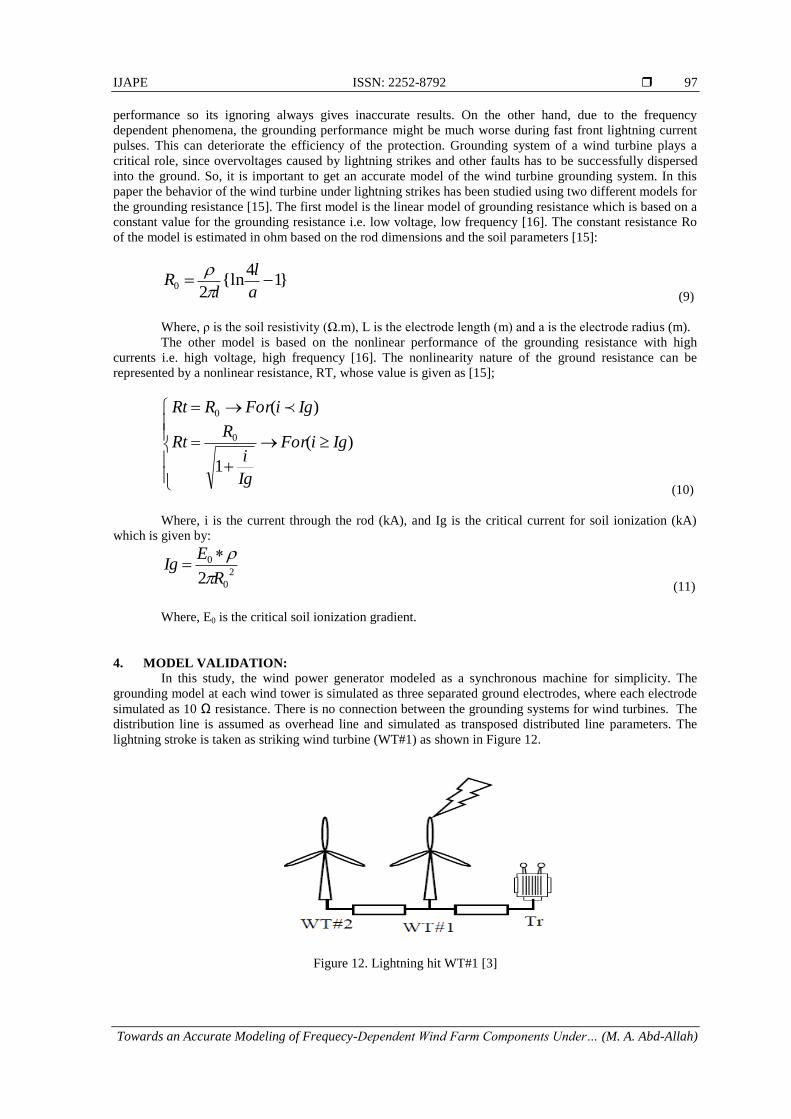
4. MODEL VALIDATION: In this study, the wind power generator modeled as a synchronous machine for simplicity. The
grounding model at each wind tower is simulated as three separated ground electrodes, where each electrode
simulated as 10 Ω resistance. There is no connection between the grounding systems for wind turbines. The
distribution line is assumed as overhead line and simulated as transposed distributed line parameters. The
lightning stroke is taken as striking wind turbine (WT#1) as shown in Figure 12.
Figure 12. Lightning hit WT#1 [3]
ISSN: 2252-8792
IJAPE Vol. 3, No. 2, August 2014 : 90 – 104
98
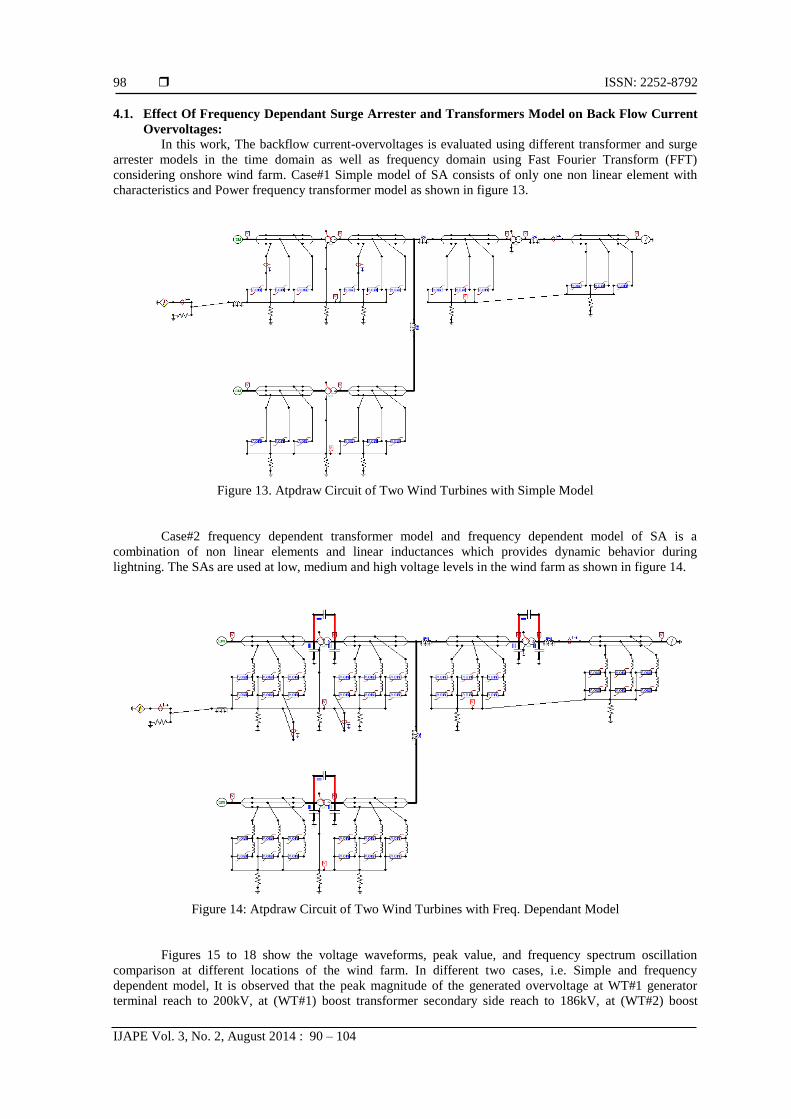
4.1. Effect Of Frequency Dependant Surge Arrester and Transformers Model on Back Flow Current
Overvoltages:
In this work, The backflow current-overvoltages is evaluated using different transformer and surge
arrester models in the time domain as well as frequency domain using Fast Fourier Transform (FFT)
considering onshore wind farm. Case#1 Simple model of SA consists of only one non linear element with
characteristics and Power frequency transformer model as shown in figure 13.
Figure 13. Atpdraw Circuit of Two Wind Turbines with Simple Model
Case#2 frequency dependent transformer model and frequency dependent model of SA is a
combination of non linear elements and linear inductances which provides dynamic behavior during
lightning. The SAs are used at low, medium and high voltage levels in the wind farm as shown in figure 14.
Figure 14: Atpdraw Circuit of Two Wind Turbines with Freq. Dependant Model
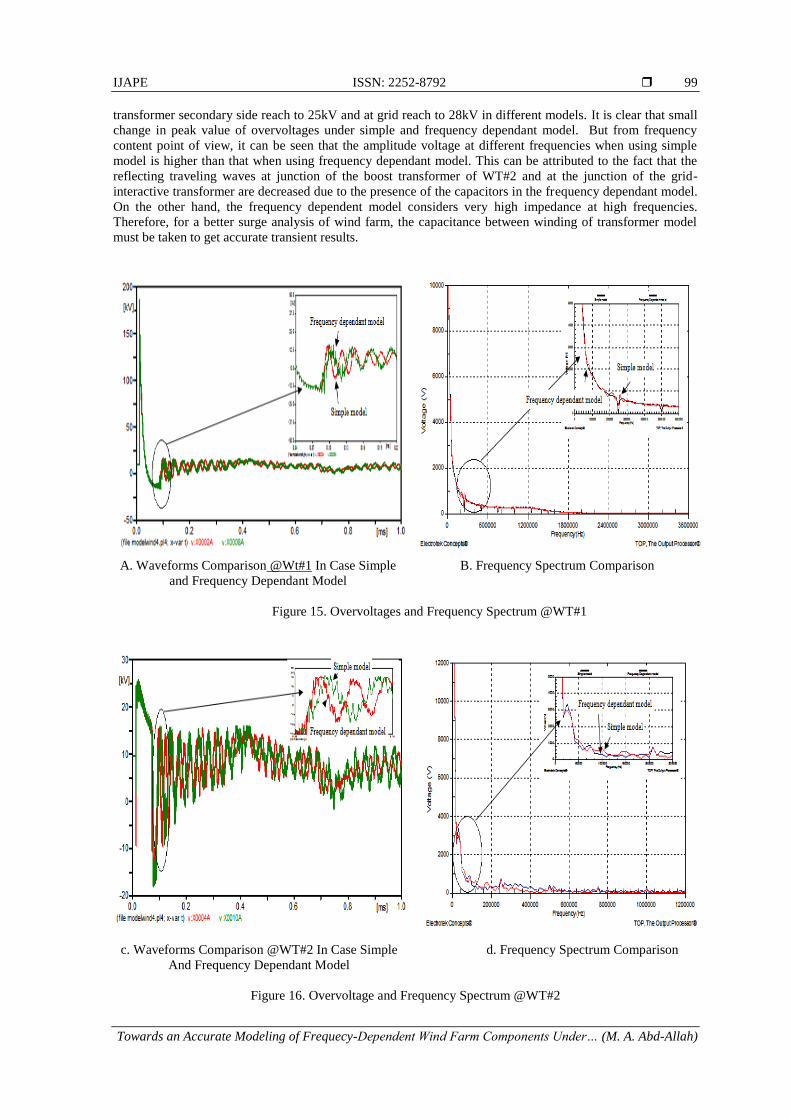
Figures 15 to 18 show the voltage waveforms, peak value, and frequency spectrum oscillation
comparison at different locations of the wind farm. In different two cases, i.e. Simple and frequency
dependent model, It is observed that the peak magnitude of the generated overvoltage at WT#1 generator
terminal reach to 200kV, at (WT#1) boost transformer secondary side reach to 186kV, at (WT#2) boost
IJAPE ISSN: 2252-8792
Towards an Accurate Modeling of Frequecy-Dependent Wind Farm Components Under… (M. A. Abd-Allah)
99
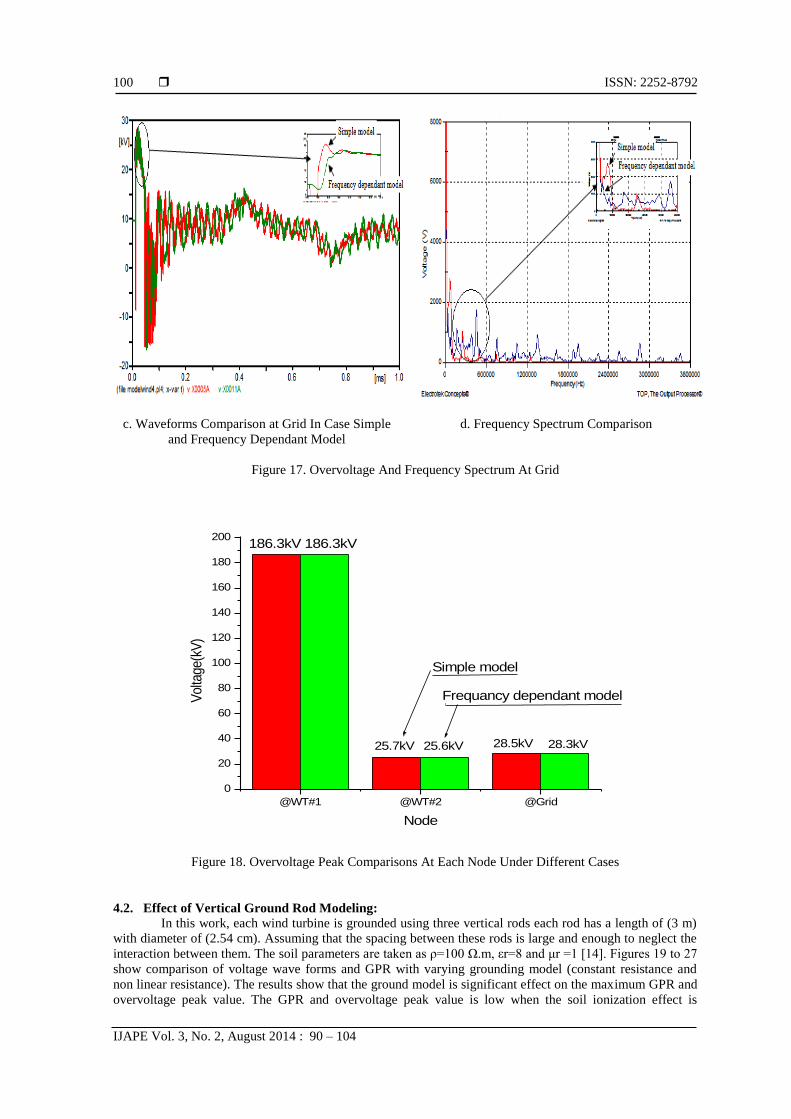
transformer secondary side reach to 25kV and at grid reach to 28kV in different models. It is clear that small
change in peak value of overvoltages under simple and frequency dependant model. But from frequency
content point of view, it can be seen that the amplitude voltage at different frequencies when using simple
model is higher than that when using frequency dependant model. This can be attributed to the fact that the
reflecting traveling waves at junction of the boost transformer of WT#2 and at the junction of the grid-
interactive transformer are decreased due to the presence of the capacitors in the frequency dependant model.
On the other hand, the frequency dependent model considers very high impedance at high frequencies.
Therefore, for a better surge analysis of wind farm, the capacitance between winding of transformer model
must be taken to get accurate transient results.
A. Waveforms Comparison @Wt#1 In Case Simple
and Frequency Dependant Model
B. Frequency Spectrum Comparison
Figure 15. Overvoltages and Frequency Spectrum @WT#1
c. Waveforms Comparison @WT#2 In Case Simple
And Frequency Dependant Model
d. Frequency Spectrum Comparison
Figure 16. Overvoltage and Frequency Spectrum @WT#2
ISSN: 2252-8792
IJAPE Vol. 3, No. 2, August 2014 : 90 – 104
100
c. Waveforms Comparison at Grid In Case Simple
and Frequency Dependant Model
d. Frequency Spectrum Comparison
Figure 17. Overvoltage And Frequency Spectrum At Grid
@WT#1 @WT#2 @Grid
0
20
40
60
80
100
120
140
160
180
200
Frequancy dependant model
Simple model
28.3kV28.5kV25.6kV25.7kV
186.3kV186.3kV
Vol
tage
(kV
)
Node
Figure 18. Overvoltage Peak Comparisons At Each Node Under Different Cases
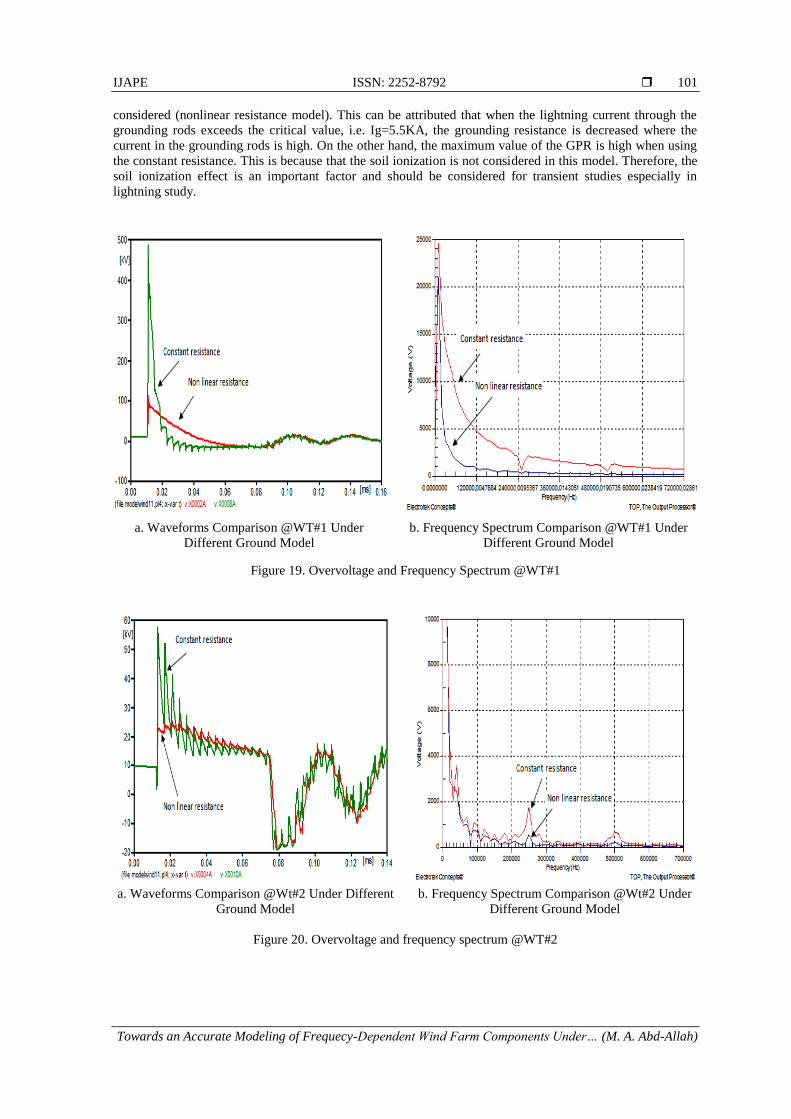
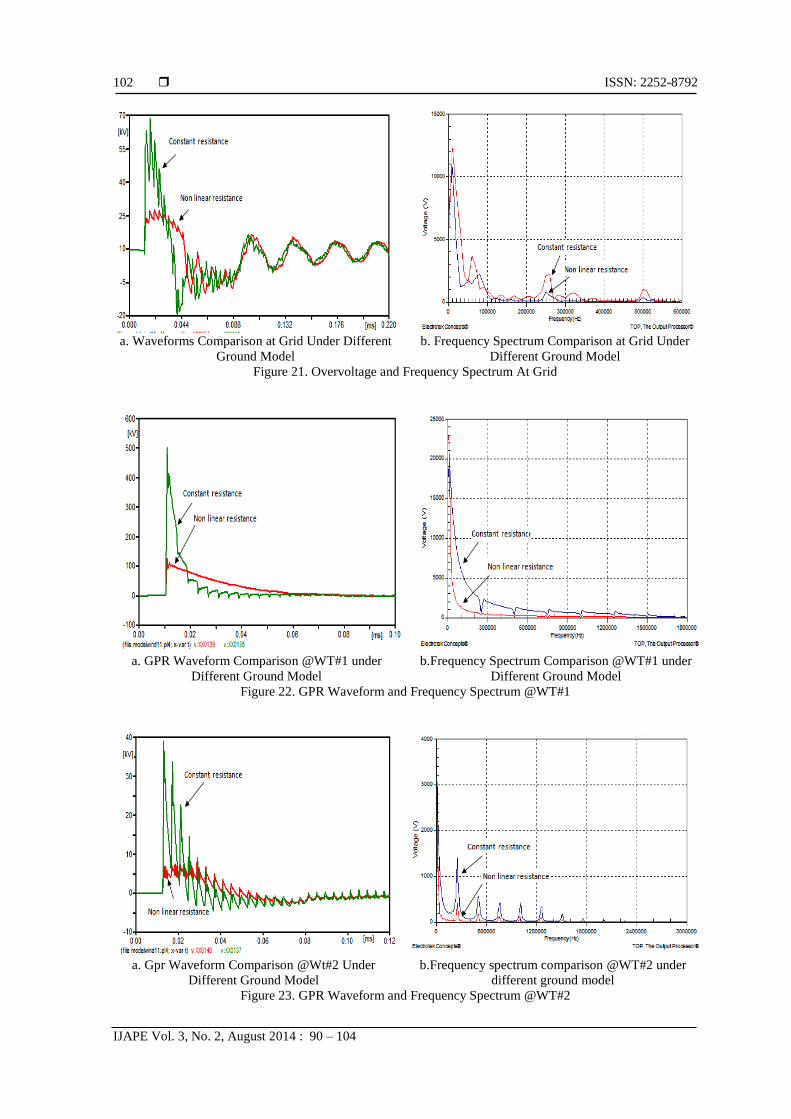
4.2. Effect of Vertical Ground Rod Modeling:
In this work, each wind turbine is grounded using three vertical rods each rod has a length of (3 m)
with diameter of (2.54 cm). Assuming that the spacing between these rods is large and enough to neglect the
interaction between them. The soil parameters are taken as ρ=100 Ω.m, εr=8 and μr =1 [14]. Figures 19 to 27
show comparison of voltage wave forms and GPR with varying grounding model (constant resistance and
non linear resistance). The results show that the ground model is significant effect on the maximum GPR and
overvoltage peak value. The GPR and overvoltage peak value is low when the soil ionization effect is
IJAPE ISSN: 2252-8792
Towards an Accurate Modeling of Frequecy-Dependent Wind Farm Components Under… (M. A. Abd-Allah)
101
considered (nonlinear resistance model). This can be attributed that when the lightning current through the
grounding rods exceeds the critical value, i.e. Ig=5.5KA, the grounding resistance is decreased where the
current in the grounding rods is high. On the other hand, the maximum value of the GPR is high when using
the constant resistance. This is because that the soil ionization is not considered in this model. Therefore, the
soil ionization effect is an important factor and should be considered for transient studies especially in
lightning study.
a. Waveforms Comparison @WT#1 Under
Different Ground Model
b. Frequency Spectrum Comparison @WT#1 Under
Different Ground Model
Figure 19. Overvoltage and Frequency Spectrum @WT#1
a. Waveforms Comparison @Wt#2 Under Different
Ground Model
b. Frequency Spectrum Comparison @Wt#2 Under
Different Ground Model
Figure 20. Overvoltage and frequency spectrum @WT#2
ISSN: 2252-8792
IJAPE Vol. 3, No. 2, August 2014 : 90 – 104
102
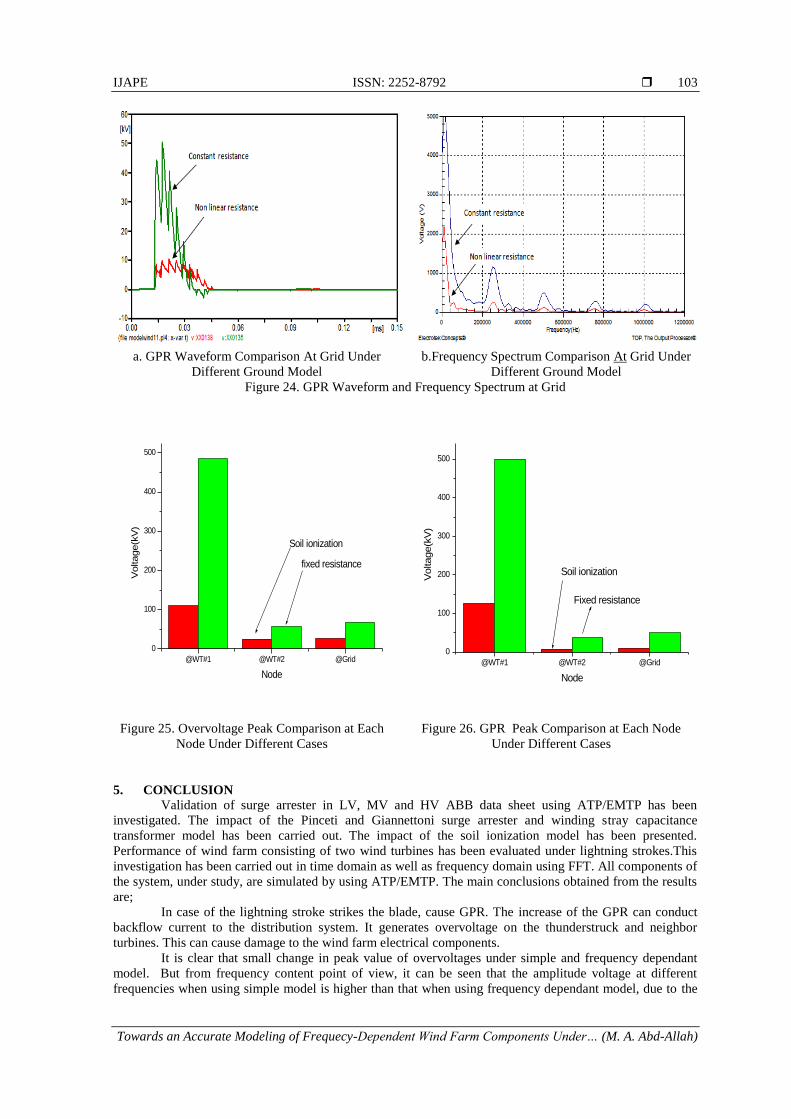
a. Waveforms Comparison at Grid Under Different
Ground Model
b. Frequency Spectrum Comparison at Grid Under
Different Ground Model
Figure 21. Overvoltage and Frequency Spectrum At Grid
a. GPR Waveform Comparison @WT#1 under
Different Ground Model
b.Frequency Spectrum Comparison @WT#1 under
Different Ground Model
Figure 22. GPR Waveform and Frequency Spectrum @WT#1
a. Gpr Waveform Comparison @Wt#2 Under
Different Ground Model
b.Frequency spectrum comparison @WT#2 under
different ground model
Figure 23. GPR Waveform and Frequency Spectrum @WT#2
IJAPE ISSN: 2252-8792
Towards an Accurate Modeling of Frequecy-Dependent Wind Farm Components Under… (M. A. Abd-Allah)
103
a. GPR Waveform Comparison At Grid Under
Different Ground Model
b.Frequency Spectrum Comparison At Grid Under
Different Ground Model
Figure 24. GPR Waveform and Frequency Spectrum at Grid
@WT#1 @WT#2 @Grid
0
100
200
300
400
500
Soil ionization
fixed resistance
Voltage(k
V)
Node
@WT#1 @WT#2 @Grid
0
100
200
300
400
500
Soil ionization
Fixed resistance
Voltage(k
V)
Node
Figure 25. Overvoltage Peak Comparison at Each
Node Under Different Cases
Figure 26. GPR Peak Comparison at Each Node
Under Different Cases
5. CONCLUSION
Validation of surge arrester in LV, MV and HV ABB data sheet using ATP/EMTP has been
investigated. The impact of the Pinceti and Giannettoni surge arrester and winding stray capacitance
transformer model has been carried out. The impact of the soil ionization model has been presented.
Performance of wind farm consisting of two wind turbines has been evaluated under lightning strokes.This
investigation has been carried out in time domain as well as frequency domain using FFT. All components of
the system, under study, are simulated by using ATP/EMTP. The main conclusions obtained from the results
are;
In case of the lightning stroke strikes the blade, cause GPR. The increase of the GPR can conduct
backflow current to the distribution system. It generates overvoltage on the thunderstruck and neighbor
turbines. This can cause damage to the wind farm electrical components.
It is clear that small change in peak value of overvoltages under simple and frequency dependant
model. But from frequency content point of view, it can be seen that the amplitude voltage at different
frequencies when using simple model is higher than that when using frequency dependant model, due to the
ISSN: 2252-8792
IJAPE Vol. 3, No. 2, August 2014 : 90 – 104
104
presence of the capacitors in the frequency dependant model. On the other hand, the frequency dependent
model considers very high impedance at high frequencies. Therefore, for a better surge analysis of wind
farm, the capacitance between winding of transformer model must be taken to get accurate transient results.
The nonlinearity behavior of the grounding resistance can be attributed to the decrease in the
grounding resistance within the increase in surge current through it. Therefore, the soil ionization effect is
important and should be considered for transient studies especially lightning study.
REFERENCES [1] IEC TR 61400-24, "Wind Turbine Generator Systems-Part 24: Lightning Protection", 2002.
[2] Yasuda Y and Funabashi T,‖ Analysis on Back-Flow Surge in Wind Farms.‖ IPST’07, Lyon, France, June 4-7,
2007.
[3] J. C. Das, ―Transients in Electrical Systems, Analysis, Recognition and mitigation", 2nd Edition, John Wiley and
Sons, Inc. 2010.
[4] Jheng-Lun Jiang, Hong-Chan Chang and Cheng-Chien Kuo,‖ Analysis of transient energy affection for wind farm
under lightning,‖ Energy 48 (2012) 292e297. www.elsevier.com/locate/energy
[5] Jheng-Lun Jiang , Hong-Chan Chang , Cheng-Chien Kuo and Cheng-Kai Huang,‖ Transient overvoltage
phenomena on the control system of wind turbines due to lightning strike‖, Renewable Energy 57 (2013) 181-189
[6] Amr M. Abd_Elhady, Nehmdoh A. Sabiha and Mohamed A. Izzularab,‖ Overvoltage Investigation Of Wind Farm
Under Lightning Strokes‖, IET Conference on Renewable Power Generation (RPG, 2011).
[7] T. Hara, and O. Yamamoto, "Modeling of a Transmission Tower for Lightning-surge Analysis", IEE Generation,
Transmission and Distribution, Vol. 143, No. 3, pp. 283-289, 1996.
[8] J. Marti, "Accurate Modeling of Frequency Dependent Transmission Lines in Electromagnetic Transients
Simulation", IEEE Transactions on Power Apparatus and Systems, PAS-101, No.1, pp. 147–157, 1982.
[9] A. Greenwood, "Electrical Transients in Power Systems", 2nd Edition, John Wiley and Sons, Inc. 1991.
[10] IEEE working Group 3.4.11, Application of Surge Protective Devices Subcommittee Surge Protective Devices
Committee, "Modeling of Metal Oxide Surge Arresters", IEEE Transactions on Power Delivery, Vol. 7, No. 1, pp.
302-309, January 1992.
[11] P. Pinceti and M. Giannettoni, "A Simplified Model for Zinc Oxide Surge Arresters", IEEE Transactions on Power
Delivery, Vol. 14, No. 2, PP. 393-398, April 1999.
[12] M. agro, M. Giannettoni and P. Pinceti, "Validation of ZnO Surge Arresters Model for Overvoltage Studies", IEEE
Transactions Power Delivery, Vol. 19, No. 4, PP. 1692-1695, October 2004.
[13] Nehmdoh A. Sabiha and Matti Lehtonen, ―Lightning-Induced Overvoltages Transmitted Over Distribution
Transformer With MV Spark-Gap Operation—Part II: Mitigation Using LV Surge Arrester‖ IEEE
TRANSACTIONS ON POWER DELIVERY, VOL. 25, NO. 4, OCTOBER 2010
[14] Surge Arresters, Datasheet, www.abb.com/arrestersonline.
[15] Amr M. Abd-Elhady, Nehmdoh A. Sabiha and Mohamed A. Izzularab” Evaluation of Different Grounding
Models for Studying Backflow Current-Overvoltages in Wind Farm” International Middle East Power Systems
Conference (MEPCON’12) 23-25 December 2012, Cairo, Egypt.
[16] ANSI/IEEE Std 80-1986‖ AC SUBSTATION GROUNDING‖