Towards a Cross-Layer Framework for Accurate Power ...
8
Towards a Cross-Layer Framework for Accurate Power Modeling of Microprocessor Designs Monir Zaman * , Mustafa M. Shihab * , Ayse K. Coskun † and Yiorgos Makris * * Department of Electrical and Computer Engineering, The University of Texas at Dallas, Richardson, Texas, USA † Electrical and Computer Engineering, Boston University, Boston, MA, USA Email: [email protected], [email protected], [email protected] and [email protected] Abstract—While state-of-the-art system-level simulators can deliver swift estimation of power dissipation for microprocessor designs, they do so at the expense of reduced accuracy. On the other hand, RTL simulators are typically cycle-accurate but overwhelmingly time consuming for real-life workloads. Conse- quently, the design community often has to make a compromise between accuracy and speed. In this work, we propose a novel cross-layer approach that can enable accurate power estimation by carefully integrating components from system-level and RTL simulation of the target design. We first leverage the concept of simulation points to transform the workload application and isolate its most critical segments. We then profile the highest weighted simulation point (HWSP) with a RTL simulator (AnyCore) for maximum accu- racy, while the rest are simulated with a system-level simulator (gem5) for ensuring fast evaluation. Finally, we combine the integrated set of profiling data as input to the power simulator (McPAT). Our evaluation results for three different SPEC2006 benchmark applications demonstrate that our proposed cross- layer framework can improve the power estimation accuracy by up to 15% for individual simulation points and by ∼9% for the full application, compared to that of a conventional system-level simulation scheme. I. I NTRODUCTION In recent years, continuous process scaling has rendered power dissipation a key consideration and figure of merit for microprocessor designs, often superseding the conventional performance parameters. At every stage of development, ac- curate simulation frameworks are instrumental for exploring the design space and ensuring selection of the most efficient one. Since exact technology libraries are initially unavailable for new architectures, designers typically simulate their design with either high (system) level models or with low (register transfer) level models. In fact, the choice of the simulation framework for estimating performance and power is a trade- off between accuracy and latency [1]. Register-transfer level (RTL) description of designs are written in hardware description languages (HDL) such as VHDL or Verilog. An RTL model can imitate the actual hardware in a cycle-accurate manner, and is significantly more precise than higher level abstractions. However, characterizing a microprocessor requires simulating it with real-life applica- tions, which can be impractically time-consuming with RTL simulators. We illustrate this in Figure 1 by comparing the RTL simulation time with that of a system-level (SL) simulator for three applications from the SPEC CPU2006 benchmark suite [2]. For example, simulating 100 million instructions of Fig. 1. RISC-V microprocessor simulation: Magnitude of difference in execution time often renders RTL simulation infeasible for designers. 401.bzip2 with the system-level simulator (gem5) takes only 54 minutes, whereas for the RTL simulator (AnyCore) it takes 377 minutes – which is a 600% increase in simulation time. We also observe that, this trend is common across all three benchmarks, and degrades exponentially for higher num- ber of instructions. It should be noted that, the RTL simulation times for the full benchmarks have been extrapolated from that of their respective first 100M instructions. Furthermore, the latest intellectual properties (IP) are often copyrighted by the commercial vendors, and are unavailable in the public domain. Therefore, the research community often has to depend on dated and less accurate simulation models [3]. On the other hand, system-level simulators model designs at a higher level of abstraction, and are typically written in general-purpose programming languages such as C/C++, Python etc. Consequently, the system-level model of a mi- croprocessor is significantly easier to develop, modify, and parametrize for design space explorations purposes, com- pared to its RTL counterparts. Most importantly, unlike RTL simulation, system-level simulators can profile large applica- tions within reasonable time (Figure 1). Unfortunately, the significant speedup in simulation comes with a trade-off in accuracy. While the system-level designs attempt to model the real hardware, they often fall short due to cycle inaccuracies and/or other internal design mismatch. Such inaccuracies can be categorized into modeling, specification and abstraction
Transcript of Towards a Cross-Layer Framework for Accurate Power ...
Towards a Cross-Layer Framework for AccuratePower Modeling of Microprocessor Designs
Monir Zaman∗, Mustafa M. Shihab∗, Ayse K. Coskun† and Yiorgos Makris∗∗Department of Electrical and Computer Engineering, The University of Texas at Dallas, Richardson, Texas, USA
†Electrical and Computer Engineering, Boston University, Boston, MA, USAEmail: [email protected], [email protected], [email protected] and [email protected]
Abstract—While state-of-the-art system-level simulators candeliver swift estimation of power dissipation for microprocessordesigns, they do so at the expense of reduced accuracy. Onthe other hand, RTL simulators are typically cycle-accurate butoverwhelmingly time consuming for real-life workloads. Conse-quently, the design community often has to make a compromisebetween accuracy and speed.
In this work, we propose a novel cross-layer approach thatcan enable accurate power estimation by carefully integratingcomponents from system-level and RTL simulation of the targetdesign. We first leverage the concept of simulation points totransform the workload application and isolate its most criticalsegments. We then profile the highest weighted simulation point(HWSP) with a RTL simulator (AnyCore) for maximum accu-racy, while the rest are simulated with a system-level simulator(gem5) for ensuring fast evaluation. Finally, we combine theintegrated set of profiling data as input to the power simulator(McPAT). Our evaluation results for three different SPEC2006benchmark applications demonstrate that our proposed cross-layer framework can improve the power estimation accuracy byup to 15% for individual simulation points and by ∼9% for thefull application, compared to that of a conventional system-levelsimulation scheme.
I. INTRODUCTION
In recent years, continuous process scaling has renderedpower dissipation a key consideration and figure of merit formicroprocessor designs, often superseding the conventionalperformance parameters. At every stage of development, ac-curate simulation frameworks are instrumental for exploringthe design space and ensuring selection of the most efficientone. Since exact technology libraries are initially unavailablefor new architectures, designers typically simulate their designwith either high (system) level models or with low (registertransfer) level models. In fact, the choice of the simulationframework for estimating performance and power is a trade-off between accuracy and latency [1].
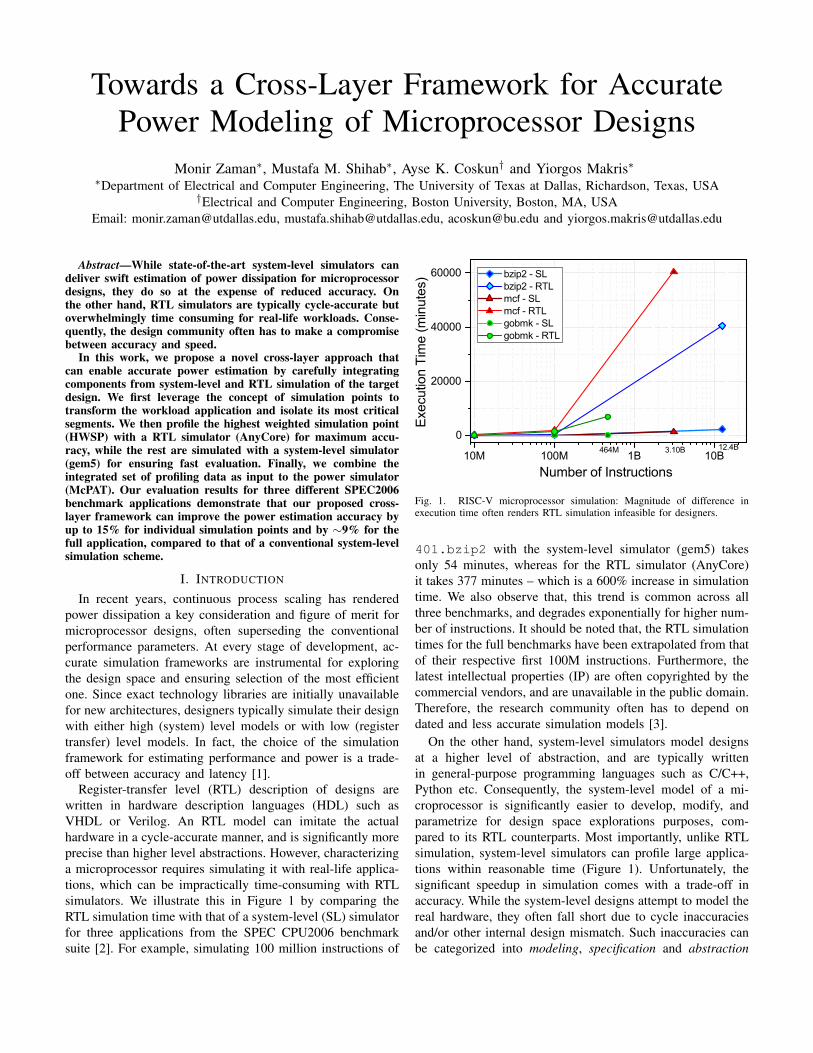
Register-transfer level (RTL) description of designs arewritten in hardware description languages (HDL) such asVHDL or Verilog. An RTL model can imitate the actualhardware in a cycle-accurate manner, and is significantly moreprecise than higher level abstractions. However, characterizinga microprocessor requires simulating it with real-life applica-tions, which can be impractically time-consuming with RTLsimulators. We illustrate this in Figure 1 by comparing theRTL simulation time with that of a system-level (SL) simulatorfor three applications from the SPEC CPU2006 benchmarksuite [2]. For example, simulating 100 million instructions of
10M 100M 1B 10B
0
20000
40000
60000
12.4B3.10B
Exec
utio
n Ti
me
(min
utes
) bzip2 - SL bzip2 - RTL mcf - SL mcf - RTL gobmk - SL gobmk - RTL
Number of Instructions
464M
Fig. 1. RISC-V microprocessor simulation: Magnitude of difference inexecution time often renders RTL simulation infeasible for designers.
401.bzip2 with the system-level simulator (gem5) takesonly 54 minutes, whereas for the RTL simulator (AnyCore)it takes 377 minutes – which is a 600% increase in simulationtime. We also observe that, this trend is common across allthree benchmarks, and degrades exponentially for higher num-ber of instructions. It should be noted that, the RTL simulationtimes for the full benchmarks have been extrapolated from thatof their respective first 100M instructions. Furthermore, thelatest intellectual properties (IP) are often copyrighted by thecommercial vendors, and are unavailable in the public domain.Therefore, the research community often has to depend ondated and less accurate simulation models [3].
On the other hand, system-level simulators model designsat a higher level of abstraction, and are typically writtenin general-purpose programming languages such as C/C++,Python etc. Consequently, the system-level model of a mi-croprocessor is significantly easier to develop, modify, andparametrize for design space explorations purposes, com-pared to its RTL counterparts. Most importantly, unlike RTLsimulation, system-level simulators can profile large applica-tions within reasonable time (Figure 1). Unfortunately, thesignificant speedup in simulation comes with a trade-off inaccuracy. While the system-level designs attempt to model thereal hardware, they often fall short due to cycle inaccuraciesand/or other internal design mismatch. Such inaccuracies canbe categorized into modeling, specification and abstraction
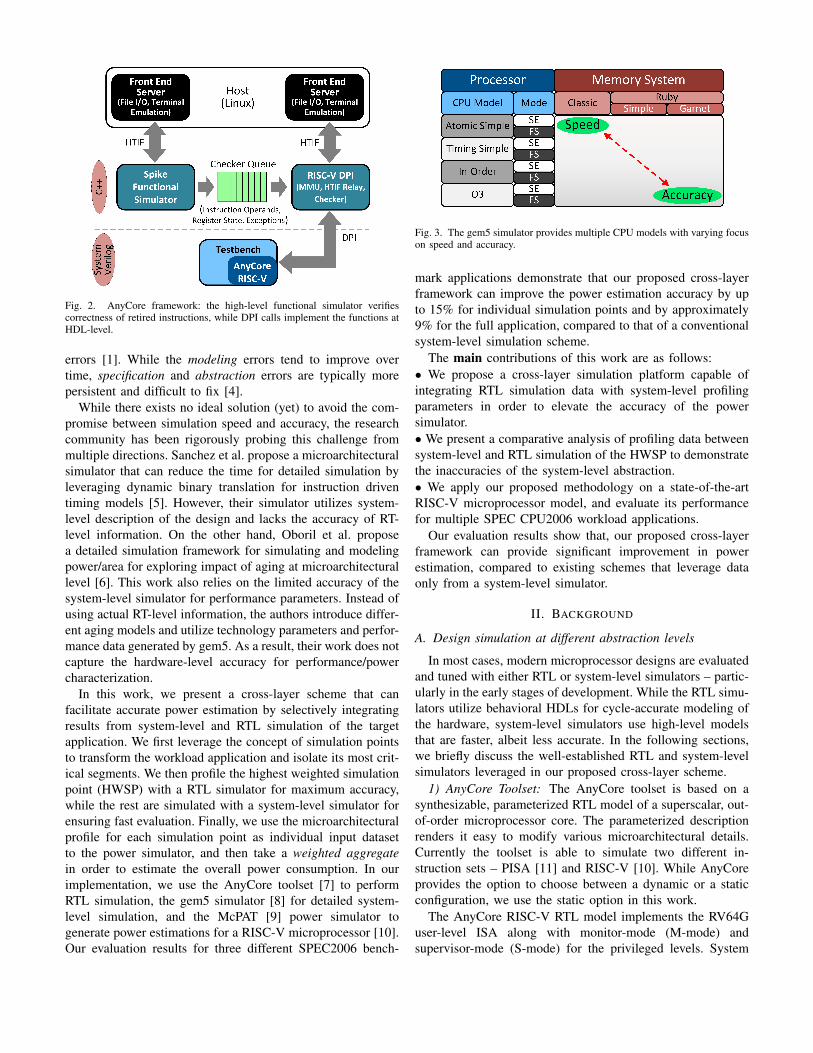
Fig. 2. AnyCore framework: the high-level functional simulator verifiescorrectness of retired instructions, while DPI calls implement the functions atHDL-level.
errors [1]. While the modeling errors tend to improve overtime, specification and abstraction errors are typically morepersistent and difficult to fix [4].
While there exists no ideal solution (yet) to avoid the com-promise between simulation speed and accuracy, the researchcommunity has been rigorously probing this challenge frommultiple directions. Sanchez et al. propose a microarchitecturalsimulator that can reduce the time for detailed simulation byleveraging dynamic binary translation for instruction driventiming models [5]. However, their simulator utilizes system-level description of the design and lacks the accuracy of RT-level information. On the other hand, Oboril et al. proposea detailed simulation framework for simulating and modelingpower/area for exploring impact of aging at microarchitecturallevel [6]. This work also relies on the limited accuracy of thesystem-level simulator for performance parameters. Instead ofusing actual RT-level information, the authors introduce differ-ent aging models and utilize technology parameters and perfor-mance data generated by gem5. As a result, their work does notcapture the hardware-level accuracy for performance/powercharacterization.
In this work, we present a cross-layer scheme that canfacilitate accurate power estimation by selectively integratingresults from system-level and RTL simulation of the targetapplication. We first leverage the concept of simulation pointsto transform the workload application and isolate its most crit-ical segments. We then profile the highest weighted simulationpoint (HWSP) with a RTL simulator for maximum accuracy,while the rest are simulated with a system-level simulator forensuring fast evaluation. Finally, we use the microarchitecturalprofile for each simulation point as individual input datasetto the power simulator, and then take a weighted aggregatein order to estimate the overall power consumption. In ourimplementation, we use the AnyCore toolset [7] to performRTL simulation, the gem5 simulator [8] for detailed system-level simulation, and the McPAT [9] power simulator togenerate power estimations for a RISC-V microprocessor [10].Our evaluation results for three different SPEC2006 bench-
Fig. 3. The gem5 simulator provides multiple CPU models with varying focuson speed and accuracy.
mark applications demonstrate that our proposed cross-layerframework can improve the power estimation accuracy by upto 15% for individual simulation points and by approximately9% for the full application, compared to that of a conventionalsystem-level simulation scheme.
The main contributions of this work are as follows:• We propose a cross-layer simulation platform capable ofintegrating RTL simulation data with system-level profilingparameters in order to elevate the accuracy of the powersimulator.• We present a comparative analysis of profiling data betweensystem-level and RTL simulation of the HWSP to demonstratethe inaccuracies of the system-level abstraction.• We apply our proposed methodology on a state-of-the-artRISC-V microprocessor model, and evaluate its performancefor multiple SPEC CPU2006 workload applications.
Our evaluation results show that, our proposed cross-layerframework can provide significant improvement in powerestimation, compared to existing schemes that leverage dataonly from a system-level simulator.
II. BACKGROUND
A. Design simulation at different abstraction levels
In most cases, modern microprocessor designs are evaluatedand tuned with either RTL or system-level simulators – partic-ularly in the early stages of development. While the RTL simu-lators utilize behavioral HDLs for cycle-accurate modeling ofthe hardware, system-level simulators use high-level modelsthat are faster, albeit less accurate. In the following sections,we briefly discuss the well-established RTL and system-levelsimulators leveraged in our proposed cross-layer scheme.
1) AnyCore Toolset: The AnyCore toolset is based on asynthesizable, parameterized RTL model of a superscalar, out-of-order microprocessor core. The parameterized descriptionrenders it easy to modify various microarchitectural details.Currently the toolset is able to simulate two different in-struction sets – PISA [11] and RISC-V [10]. While AnyCoreprovides the option to choose between a dynamic or a staticconfiguration, we use the static option in this work.
The AnyCore RISC-V RTL model implements the RV64Guser-level ISA along with monitor-mode (M-mode) andsupervisor-mode (S-mode) for the privileged levels. System
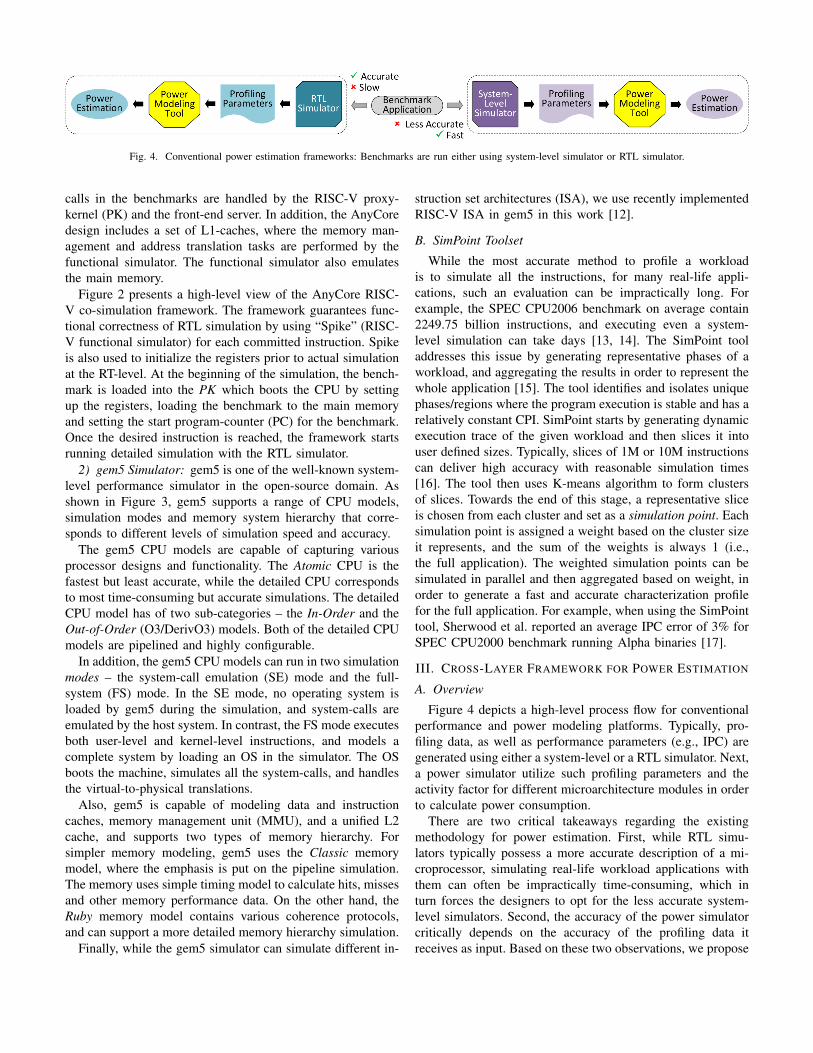
Fig. 4. Conventional power estimation frameworks: Benchmarks are run either using system-level simulator or RTL simulator.
calls in the benchmarks are handled by the RISC-V proxy-kernel (PK) and the front-end server. In addition, the AnyCoredesign includes a set of L1-caches, where the memory man-agement and address translation tasks are performed by thefunctional simulator. The functional simulator also emulatesthe main memory.
Figure 2 presents a high-level view of the AnyCore RISC-V co-simulation framework. The framework guarantees func-tional correctness of RTL simulation by using “Spike” (RISC-V functional simulator) for each committed instruction. Spikeis also used to initialize the registers prior to actual simulationat the RT-level. At the beginning of the simulation, the bench-mark is loaded into the PK which boots the CPU by settingup the registers, loading the benchmark to the main memoryand setting the start program-counter (PC) for the benchmark.Once the desired instruction is reached, the framework startsrunning detailed simulation with the RTL simulator.
2) gem5 Simulator: gem5 is one of the well-known system-level performance simulator in the open-source domain. Asshown in Figure 3, gem5 supports a range of CPU models,simulation modes and memory system hierarchy that corre-sponds to different levels of simulation speed and accuracy.
The gem5 CPU models are capable of capturing variousprocessor designs and functionality. The Atomic CPU is thefastest but least accurate, while the detailed CPU correspondsto most time-consuming but accurate simulations. The detailedCPU model has of two sub-categories – the In-Order and theOut-of-Order (O3/DerivO3) models. Both of the detailed CPUmodels are pipelined and highly configurable.
In addition, the gem5 CPU models can run in two simulationmodes – the system-call emulation (SE) mode and the full-system (FS) mode. In the SE mode, no operating system isloaded by gem5 during the simulation, and system-calls areemulated by the host system. In contrast, the FS mode executesboth user-level and kernel-level instructions, and models acomplete system by loading an OS in the simulator. The OSboots the machine, simulates all the system-calls, and handlesthe virtual-to-physical translations.
Also, gem5 is capable of modeling data and instructioncaches, memory management unit (MMU), and a unified L2cache, and supports two types of memory hierarchy. Forsimpler memory modeling, gem5 uses the Classic memorymodel, where the emphasis is put on the pipeline simulation.The memory uses simple timing model to calculate hits, missesand other memory performance data. On the other hand, theRuby memory model contains various coherence protocols,and can support a more detailed memory hierarchy simulation.
Finally, while the gem5 simulator can simulate different in-
struction set architectures (ISA), we use recently implementedRISC-V ISA in gem5 in this work [12].
B. SimPoint Toolset
While the most accurate method to profile a workloadis to simulate all the instructions, for many real-life appli-cations, such an evaluation can be impractically long. Forexample, the SPEC CPU2006 benchmark on average contain2249.75 billion instructions, and executing even a system-level simulation can take days [13, 14]. The SimPoint tooladdresses this issue by generating representative phases of aworkload, and aggregating the results in order to represent thewhole application [15]. The tool identifies and isolates uniquephases/regions where the program execution is stable and has arelatively constant CPI. SimPoint starts by generating dynamicexecution trace of the given workload and then slices it intouser defined sizes. Typically, slices of 1M or 10M instructionscan deliver high accuracy with reasonable simulation times[16]. The tool then uses K-means algorithm to form clustersof slices. Towards the end of this stage, a representative sliceis chosen from each cluster and set as a simulation point. Eachsimulation point is assigned a weight based on the cluster sizeit represents, and the sum of the weights is always 1 (i.e.,the full application). The weighted simulation points can besimulated in parallel and then aggregated based on weight, inorder to generate a fast and accurate characterization profilefor the full application. For example, when using the SimPointtool, Sherwood et al. reported an average IPC error of 3% forSPEC CPU2000 benchmark running Alpha binaries [17].
III. CROSS-LAYER FRAMEWORK FOR POWER ESTIMATION
A. Overview
Figure 4 depicts a high-level process flow for conventionalperformance and power modeling platforms. Typically, pro-filing data, as well as performance parameters (e.g., IPC) aregenerated using either a system-level or a RTL simulator. Next,a power simulator utilize such profiling parameters and theactivity factor for different microarchitecture modules in orderto calculate power consumption.
There are two critical takeaways regarding the existingmethodology for power estimation. First, while RTL simu-lators typically possess a more accurate description of a mi-croprocessor, simulating real-life workload applications withthem can often be impractically time-consuming, which inturn forces the designers to opt for the less accurate system-level simulators. Second, the accuracy of the power simulatorcritically depends on the accuracy of the profiling data itreceives as input. Based on these two observations, we propose
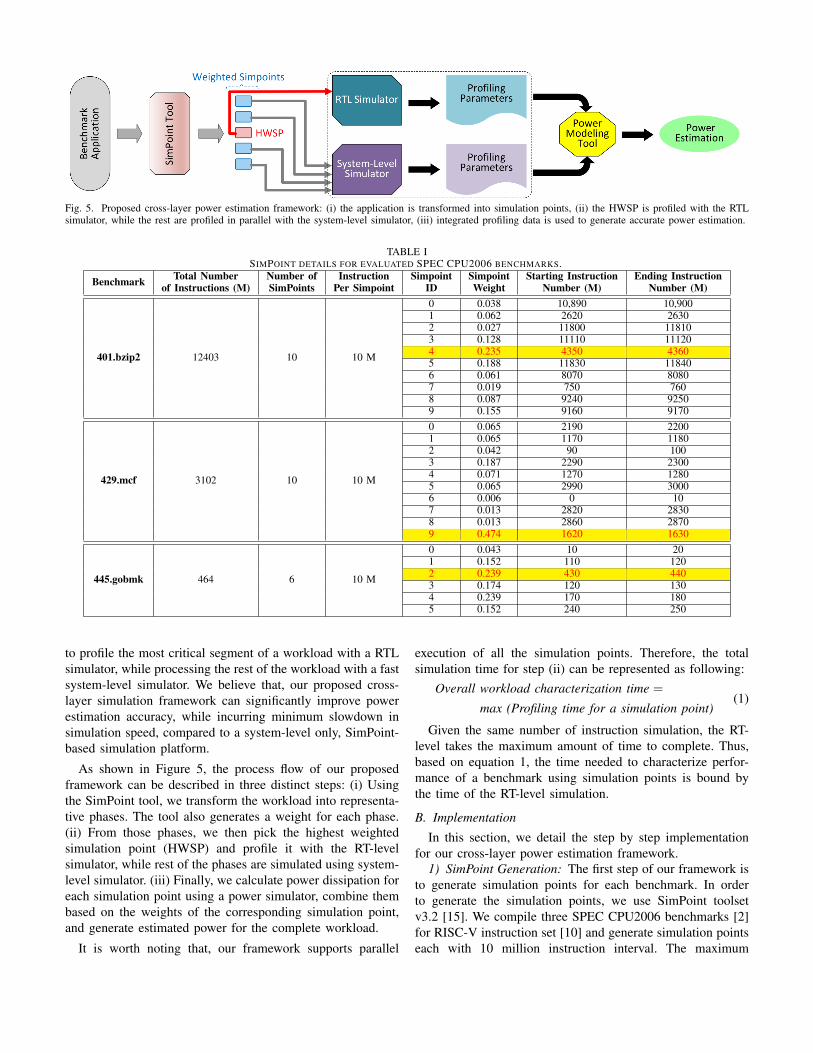
Fig. 5. Proposed cross-layer power estimation framework: (i) the application is transformed into simulation points, (ii) the HWSP is profiled with the RTLsimulator, while the rest are profiled in parallel with the system-level simulator, (iii) integrated profiling data is used to generate accurate power estimation.
TABLE ISIMPOINT DETAILS FOR EVALUATED SPEC CPU2006 BENCHMARKS.
Benchmark Total Number Number of Instruction Simpoint Simpoint Starting Instruction Ending Instructionof Instructions (M) SimPoints Per Simpoint ID Weight Number (M) Number (M)
401.bzip2 12403 10 10 M
0 0.038 10,890 10,9001 0.062 2620 26302 0.027 11800 118103 0.128 11110 111204 0.235 4350 43605 0.188 11830 118406 0.061 8070 80807 0.019 750 7608 0.087 9240 92509 0.155 9160 9170
429.mcf 3102 10 10 M
0 0.065 2190 22001 0.065 1170 11802 0.042 90 1003 0.187 2290 23004 0.071 1270 12805 0.065 2990 30006 0.006 0 107 0.013 2820 28308 0.013 2860 28709 0.474 1620 1630
445.gobmk 464 6 10 M
0 0.043 10 201 0.152 110 1202 0.239 430 4403 0.174 120 1304 0.239 170 1805 0.152 240 250
to profile the most critical segment of a workload with a RTLsimulator, while processing the rest of the workload with a fastsystem-level simulator. We believe that, our proposed cross-layer simulation framework can significantly improve powerestimation accuracy, while incurring minimum slowdown insimulation speed, compared to a system-level only, SimPoint-based simulation platform.
As shown in Figure 5, the process flow of our proposedframework can be described in three distinct steps: (i) Usingthe SimPoint tool, we transform the workload into representa-tive phases. The tool also generates a weight for each phase.(ii) From those phases, we then pick the highest weightedsimulation point (HWSP) and profile it with the RT-levelsimulator, while rest of the phases are simulated using system-level simulator. (iii) Finally, we calculate power dissipation foreach simulation point using a power simulator, combine thembased on the weights of the corresponding simulation point,and generate estimated power for the complete workload.
It is worth noting that, our framework supports parallel
execution of all the simulation points. Therefore, the totalsimulation time for step (ii) can be represented as following:
Overall workload characterization time =
max (Profiling time for a simulation point)(1)
Given the same number of instruction simulation, the RT-level takes the maximum amount of time to complete. Thus,based on equation 1, the time needed to characterize perfor-mance of a benchmark using simulation points is bound bythe time of the RT-level simulation.
B. Implementation
In this section, we detail the step by step implementationfor our cross-layer power estimation framework.
1) SimPoint Generation: The first step of our framework isto generate simulation points for each benchmark. In orderto generate the simulation points, we use SimPoint toolsetv3.2 [15]. We compile three SPEC CPU2006 benchmarks [2]for RISC-V instruction set [10] and generate simulation pointseach with 10 million instruction interval. The maximum
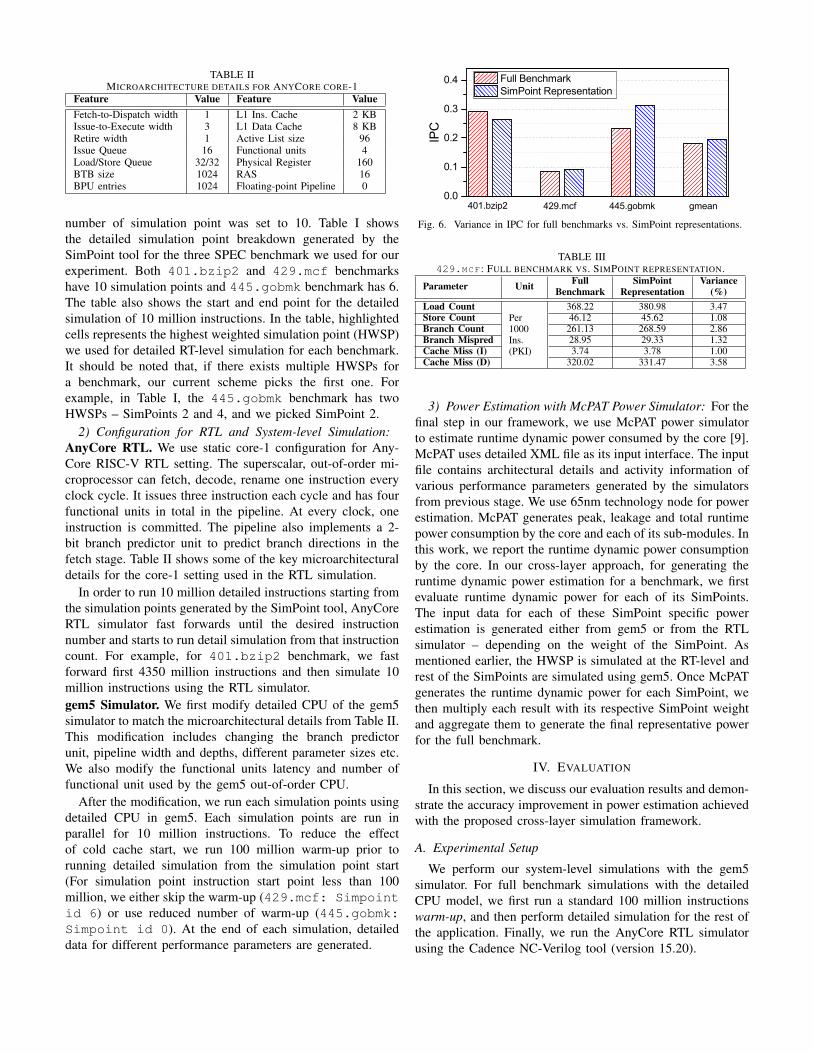
TABLE IIMICROARCHITECTURE DETAILS FOR ANYCORE CORE-1
Feature Value Feature ValueFetch-to-Dispatch width 1 L1 Ins. Cache 2 KBIssue-to-Execute width 3 L1 Data Cache 8 KBRetire width 1 Active List size 96Issue Queue 16 Functional units 4Load/Store Queue 32/32 Physical Register 160BTB size 1024 RAS 16BPU entries 1024 Floating-point Pipeline 0
number of simulation point was set to 10. Table I showsthe detailed simulation point breakdown generated by theSimPoint tool for the three SPEC benchmark we used for ourexperiment. Both 401.bzip2 and 429.mcf benchmarkshave 10 simulation points and 445.gobmk benchmark has 6.The table also shows the start and end point for the detailedsimulation of 10 million instructions. In the table, highlightedcells represents the highest weighted simulation point (HWSP)we used for detailed RT-level simulation for each benchmark.It should be noted that, if there exists multiple HWSPs fora benchmark, our current scheme picks the first one. Forexample, in Table I, the 445.gobmk benchmark has twoHWSPs – SimPoints 2 and 4, and we picked SimPoint 2.
2) Configuration for RTL and System-level Simulation:AnyCore RTL. We use static core-1 configuration for Any-Core RISC-V RTL setting. The superscalar, out-of-order mi-croprocessor can fetch, decode, rename one instruction everyclock cycle. It issues three instruction each cycle and has fourfunctional units in total in the pipeline. At every clock, oneinstruction is committed. The pipeline also implements a 2-bit branch predictor unit to predict branch directions in thefetch stage. Table II shows some of the key microarchitecturaldetails for the core-1 setting used in the RTL simulation.
In order to run 10 million detailed instructions starting fromthe simulation points generated by the SimPoint tool, AnyCoreRTL simulator fast forwards until the desired instructionnumber and starts to run detail simulation from that instructioncount. For example, for 401.bzip2 benchmark, we fastforward first 4350 million instructions and then simulate 10million instructions using the RTL simulator.gem5 Simulator. We first modify detailed CPU of the gem5simulator to match the microarchitectural details from Table II.This modification includes changing the branch predictorunit, pipeline width and depths, different parameter sizes etc.We also modify the functional units latency and number offunctional unit used by the gem5 out-of-order CPU.
After the modification, we run each simulation points usingdetailed CPU in gem5. Each simulation points are run inparallel for 10 million instructions. To reduce the effectof cold cache start, we run 100 million warm-up prior torunning detailed simulation from the simulation point start(For simulation point instruction start point less than 100million, we either skip the warm-up (429.mcf: Simpointid 6) or use reduced number of warm-up (445.gobmk:Simpoint id 0). At the end of each simulation, detaileddata for different performance parameters are generated.
0.0
0.1
0.2
0.3
0.4
gmean445.gobmk429.mcf
Full Benchmark SimPoint Representation
IPC
401.bzip2
Fig. 6. Variance in IPC for full benchmarks vs. SimPoint representations.
TABLE III429.MCF : FULL BENCHMARK VS. SIMPOINT REPRESENTATION.
Parameter Unit Full SimPoint VarianceBenchmark Representation (%)
Load CountPer1000Ins.(PKI)
368.22 380.98 3.47Store Count 46.12 45.62 1.08Branch Count 261.13 268.59 2.86Branch Mispred 28.95 29.33 1.32Cache Miss (I) 3.74 3.78 1.00Cache Miss (D) 320.02 331.47 3.58
3) Power Estimation with McPAT Power Simulator: For thefinal step in our framework, we use McPAT power simulatorto estimate runtime dynamic power consumed by the core [9].McPAT uses detailed XML file as its input interface. The inputfile contains architectural details and activity information ofvarious performance parameters generated by the simulatorsfrom previous stage. We use 65nm technology node for powerestimation. McPAT generates peak, leakage and total runtimepower consumption by the core and each of its sub-modules. Inthis work, we report the runtime dynamic power consumptionby the core. In our cross-layer approach, for generating theruntime dynamic power estimation for a benchmark, we firstevaluate runtime dynamic power for each of its SimPoints.The input data for each of these SimPoint specific powerestimation is generated either from gem5 or from the RTLsimulator – depending on the weight of the SimPoint. Asmentioned earlier, the HWSP is simulated at the RT-level andrest of the SimPoints are simulated using gem5. Once McPATgenerates the runtime dynamic power for each SimPoint, wethen multiply each result with its respective SimPoint weightand aggregate them to generate the final representative powerfor the full benchmark.
IV. EVALUATION
In this section, we discuss our evaluation results and demon-strate the accuracy improvement in power estimation achievedwith the proposed cross-layer simulation framework.
A. Experimental Setup
We perform our system-level simulations with the gem5simulator. For full benchmark simulations with the detailedCPU model, we first run a standard 100 million instructionswarm-up, and then perform detailed simulation for the rest ofthe application. Finally, we run the AnyCore RTL simulatorusing the Cadence NC-Verilog tool (version 15.20).
1.7
3.0
401.bzip2 429.mcf 445.gobmk0.0
500.0k1.0M1.5M2.0M2.5M3.0M3.5M4.0M4.5M Gem5 AnyCore
Variance (%)
Load
Cou
nt
0
25
50
75
100
125
150
175
Var
ianc
e (%
)
(a)
1.5
401.bzip2 429.mcf 445.gobmk0.0
500.0k
1.0M
1.5M
2.0M
2.5M
3.0M
3.5M Gem5 AnyCore Variance (%)
Stor
e C
ount
0
10
20
30
40
Var
ianc
e (%
)
(b)401.bzip2 429.mcf 445.gobmk
0.0500.0k
1.0M1.5M2.0M2.5M3.0M3.5M4.0M Gem5
AnyCore Variance (%)
Bran
ch C
ount
0
5
10
15
20
25
Var
ianc
e (%
)
(c)
2.2 4.
4
401.bzip2 429.mcf 445.gobmk0
100k
200k
300k
400k
500k
600k Gem5 AnyCore Variance (%)
Bran
ch M
ispr
edic
tion
0
5
10
15
20
25
Var
ianc
e (%
)
(d)
3689
9
300254
785
1306
6
401.bzip2 429.mcf 445.gobmk0
100k
200k
300k
400k
500k
600k Gem5 AnyCore Variance (%)
Cac
he M
iss
- Ins
truct
ion
01020304050607080
Var
ianc
e (%
)
(e)
3740
09
5803
35
401.bzip2 429.mcf 445.gobmk0.0
500.0k1.0M1.5M2.0M2.5M3.0M3.5M4.0M Gem5
AnyCore Variance (%)
Cac
he M
iss
- Dat
a
0
10
20
30
40
50
Var
ianc
e (%
)
(f)
401.bzip2 429.mcf 445.gobmk0.0
0.1
0.2
0.3
0.4
0.5 Gem5 AnyCore Variance (%)
IPC
0
10
20
30
40
50
Var
ianc
e (%
)
(g)
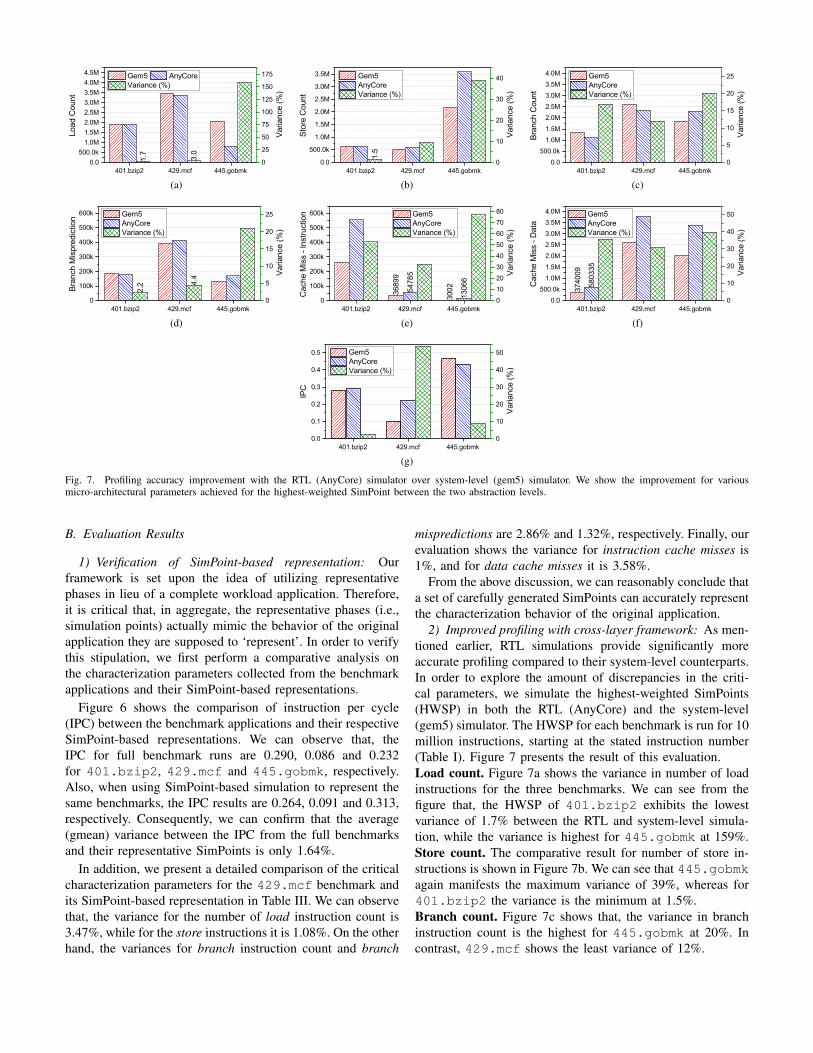
Fig. 7. Profiling accuracy improvement with the RTL (AnyCore) simulator over system-level (gem5) simulator. We show the improvement for variousmicro-architectural parameters achieved for the highest-weighted SimPoint between the two abstraction levels.
B. Evaluation Results
1) Verification of SimPoint-based representation: Ourframework is set upon the idea of utilizing representativephases in lieu of a complete workload application. Therefore,it is critical that, in aggregate, the representative phases (i.e.,simulation points) actually mimic the behavior of the originalapplication they are supposed to ‘represent’. In order to verifythis stipulation, we first perform a comparative analysis onthe characterization parameters collected from the benchmarkapplications and their SimPoint-based representations.
Figure 6 shows the comparison of instruction per cycle(IPC) between the benchmark applications and their respectiveSimPoint-based representations. We can observe that, theIPC for full benchmark runs are 0.290, 0.086 and 0.232for 401.bzip2, 429.mcf and 445.gobmk, respectively.Also, when using SimPoint-based simulation to represent thesame benchmarks, the IPC results are 0.264, 0.091 and 0.313,respectively. Consequently, we can confirm that the average(gmean) variance between the IPC from the full benchmarksand their representative SimPoints is only 1.64%.
In addition, we present a detailed comparison of the criticalcharacterization parameters for the 429.mcf benchmark andits SimPoint-based representation in Table III. We can observethat, the variance for the number of load instruction count is3.47%, while for the store instructions it is 1.08%. On the otherhand, the variances for branch instruction count and branch
mispredictions are 2.86% and 1.32%, respectively. Finally, ourevaluation shows the variance for instruction cache misses is1%, and for data cache misses it is 3.58%.
From the above discussion, we can reasonably conclude thata set of carefully generated SimPoints can accurately representthe characterization behavior of the original application.
2) Improved profiling with cross-layer framework: As men-tioned earlier, RTL simulations provide significantly moreaccurate profiling compared to their system-level counterparts.In order to explore the amount of discrepancies in the criti-cal parameters, we simulate the highest-weighted SimPoints(HWSP) in both the RTL (AnyCore) and the system-level(gem5) simulator. The HWSP for each benchmark is run for 10million instructions, starting at the stated instruction number(Table I). Figure 7 presents the result of this evaluation.Load count. Figure 7a shows the variance in number of loadinstructions for the three benchmarks. We can see from thefigure that, the HWSP of 401.bzip2 exhibits the lowestvariance of 1.7% between the RTL and system-level simula-tion, while the variance is highest for 445.gobmk at 159%.Store count. The comparative result for number of store in-structions is shown in Figure 7b. We can see that 445.gobmkagain manifests the maximum variance of 39%, whereas for401.bzip2 the variance is the minimum at 1.5%.Branch count. Figure 7c shows that, the variance in branchinstruction count is the highest for 445.gobmk at 20%. Incontrast, 429.mcf shows the least variance of 12%.
401.bzip2 429.mcf 445.gobmk0.0
0.1
0.2
0.3
0.4 gem5 Anycore Improvement (%)
Pow
er (W
att)
024
681012
14161820
Impr
ovem
ent (
%)
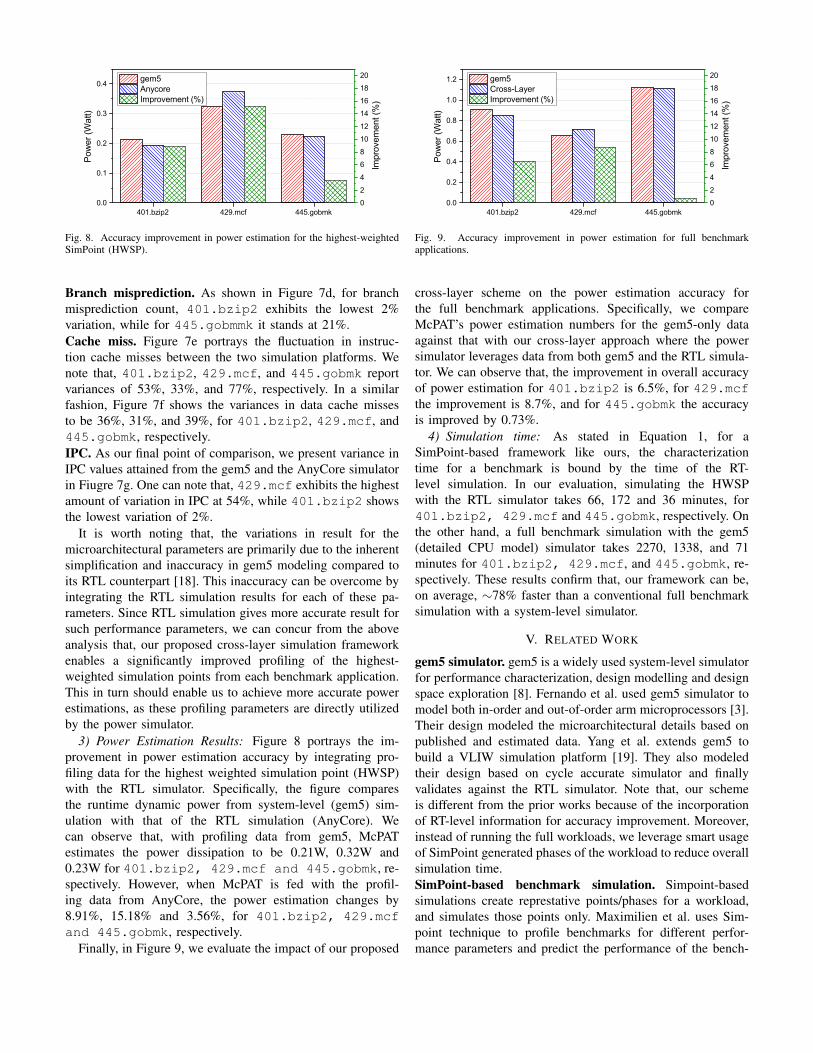
Fig. 8. Accuracy improvement in power estimation for the highest-weightedSimPoint (HWSP).
Branch misprediction. As shown in Figure 7d, for branchmisprediction count, 401.bzip2 exhibits the lowest 2%variation, while for 445.gobmmk it stands at 21%.Cache miss. Figure 7e portrays the fluctuation in instruc-tion cache misses between the two simulation platforms. Wenote that, 401.bzip2, 429.mcf, and 445.gobmk reportvariances of 53%, 33%, and 77%, respectively. In a similarfashion, Figure 7f shows the variances in data cache missesto be 36%, 31%, and 39%, for 401.bzip2, 429.mcf, and445.gobmk, respectively.IPC. As our final point of comparison, we present variance inIPC values attained from the gem5 and the AnyCore simulatorin Fiugre 7g. One can note that, 429.mcf exhibits the highestamount of variation in IPC at 54%, while 401.bzip2 showsthe lowest variation of 2%.
It is worth noting that, the variations in result for themicroarchitectural parameters are primarily due to the inherentsimplification and inaccuracy in gem5 modeling compared toits RTL counterpart [18]. This inaccuracy can be overcome byintegrating the RTL simulation results for each of these pa-rameters. Since RTL simulation gives more accurate result forsuch performance parameters, we can concur from the aboveanalysis that, our proposed cross-layer simulation frameworkenables a significantly improved profiling of the highest-weighted simulation points from each benchmark application.This in turn should enable us to achieve more accurate powerestimations, as these profiling parameters are directly utilizedby the power simulator.
3) Power Estimation Results: Figure 8 portrays the im-provement in power estimation accuracy by integrating pro-filing data for the highest weighted simulation point (HWSP)with the RTL simulator. Specifically, the figure comparesthe runtime dynamic power from system-level (gem5) sim-ulation with that of the RTL simulation (AnyCore). Wecan observe that, with profiling data from gem5, McPATestimates the power dissipation to be 0.21W, 0.32W and0.23W for 401.bzip2, 429.mcf and 445.gobmk, re-spectively. However, when McPAT is fed with the profil-ing data from AnyCore, the power estimation changes by8.91%, 15.18% and 3.56%, for 401.bzip2, 429.mcfand 445.gobmk, respectively.
Finally, in Figure 9, we evaluate the impact of our proposed
401.bzip2 429.mcf 445.gobmk0.0
0.2
0.4
0.6
0.8
1.0
1.2 gem5 Cross-Layer Improvement (%)
Pow
er (W
att)
024
681012
14161820
Impr
ovem
ent (
%)
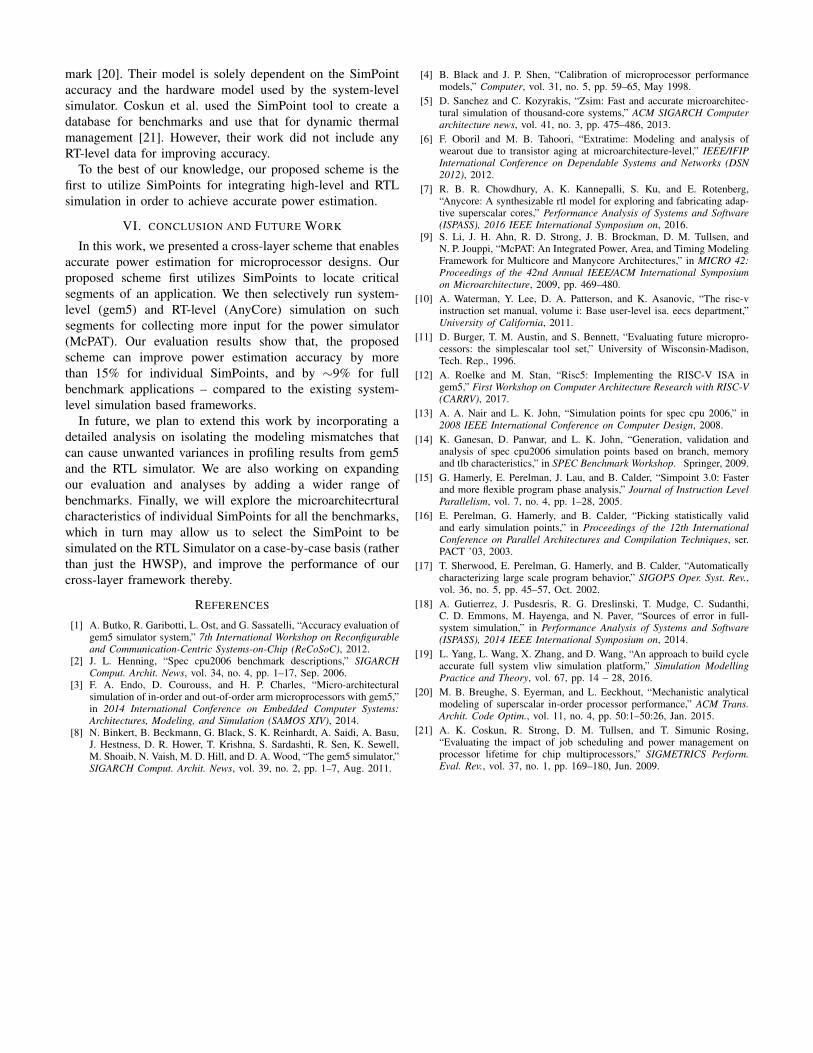
Fig. 9. Accuracy improvement in power estimation for full benchmarkapplications.
cross-layer scheme on the power estimation accuracy forthe full benchmark applications. Specifically, we compareMcPAT’s power estimation numbers for the gem5-only dataagainst that with our cross-layer approach where the powersimulator leverages data from both gem5 and the RTL simula-tor. We can observe that, the improvement in overall accuracyof power estimation for 401.bzip2 is 6.5%, for 429.mcfthe improvement is 8.7%, and for 445.gobmk the accuracyis improved by 0.73%.
4) Simulation time: As stated in Equation 1, for aSimPoint-based framework like ours, the characterizationtime for a benchmark is bound by the time of the RT-level simulation. In our evaluation, simulating the HWSPwith the RTL simulator takes 66, 172 and 36 minutes, for401.bzip2, 429.mcf and 445.gobmk, respectively. Onthe other hand, a full benchmark simulation with the gem5(detailed CPU model) simulator takes 2270, 1338, and 71minutes for 401.bzip2, 429.mcf, and 445.gobmk, re-spectively. These results confirm that, our framework can be,on average, ∼78% faster than a conventional full benchmarksimulation with a system-level simulator.
V. RELATED WORK
gem5 simulator. gem5 is a widely used system-level simulatorfor performance characterization, design modelling and designspace exploration [8]. Fernando et al. used gem5 simulator tomodel both in-order and out-of-order arm microprocessors [3].Their design modeled the microarchitectural details based onpublished and estimated data. Yang et al. extends gem5 tobuild a VLIW simulation platform [19]. They also modeledtheir design based on cycle accurate simulator and finallyvalidates against the RTL simulator. Note that, our schemeis different from the prior works because of the incorporationof RT-level information for accuracy improvement. Moreover,instead of running the full workloads, we leverage smart usageof SimPoint generated phases of the workload to reduce overallsimulation time.SimPoint-based benchmark simulation. Simpoint-basedsimulations create represtative points/phases for a workload,and simulates those points only. Maximilien et al. uses Sim-point technique to profile benchmarks for different perfor-mance parameters and predict the performance of the bench-
mark [20]. Their model is solely dependent on the SimPointaccuracy and the hardware model used by the system-levelsimulator. Coskun et al. used the SimPoint tool to create adatabase for benchmarks and use that for dynamic thermalmanagement [21]. However, their work did not include anyRT-level data for improving accuracy.
To the best of our knowledge, our proposed scheme is thefirst to utilize SimPoints for integrating high-level and RTLsimulation in order to achieve accurate power estimation.
VI. CONCLUSION AND FUTURE WORK
In this work, we presented a cross-layer scheme that enablesaccurate power estimation for microprocessor designs. Ourproposed scheme first utilizes SimPoints to locate criticalsegments of an application. We then selectively run system-level (gem5) and RT-level (AnyCore) simulation on suchsegments for collecting more input for the power simulator(McPAT). Our evaluation results show that, the proposedscheme can improve power estimation accuracy by morethan 15% for individual SimPoints, and by ∼9% for fullbenchmark applications – compared to the existing system-level simulation based frameworks.
In future, we plan to extend this work by incorporating adetailed analysis on isolating the modeling mismatches thatcan cause unwanted variances in profiling results from gem5and the RTL simulator. We are also working on expandingour evaluation and analyses by adding a wider range ofbenchmarks. Finally, we will explore the microarchitecrturalcharacteristics of individual SimPoints for all the benchmarks,which in turn may allow us to select the SimPoint to besimulated on the RTL Simulator on a case-by-case basis (ratherthan just the HWSP), and improve the performance of ourcross-layer framework thereby.
REFERENCES
[1] A. Butko, R. Garibotti, L. Ost, and G. Sassatelli, “Accuracy evaluation ofgem5 simulator system,” 7th International Workshop on Reconfigurableand Communication-Centric Systems-on-Chip (ReCoSoC), 2012.
[2] J. L. Henning, “Spec cpu2006 benchmark descriptions,” SIGARCHComput. Archit. News, vol. 34, no. 4, pp. 1–17, Sep. 2006.
[3] F. A. Endo, D. Courouss, and H. P. Charles, “Micro-architecturalsimulation of in-order and out-of-order arm microprocessors with gem5,”in 2014 International Conference on Embedded Computer Systems:Architectures, Modeling, and Simulation (SAMOS XIV), 2014.
[8] N. Binkert, B. Beckmann, G. Black, S. K. Reinhardt, A. Saidi, A. Basu,J. Hestness, D. R. Hower, T. Krishna, S. Sardashti, R. Sen, K. Sewell,M. Shoaib, N. Vaish, M. D. Hill, and D. A. Wood, “The gem5 simulator,”SIGARCH Comput. Archit. News, vol. 39, no. 2, pp. 1–7, Aug. 2011.
[4] B. Black and J. P. Shen, “Calibration of microprocessor performancemodels,” Computer, vol. 31, no. 5, pp. 59–65, May 1998.
[5] D. Sanchez and C. Kozyrakis, “Zsim: Fast and accurate microarchitec-tural simulation of thousand-core systems,” ACM SIGARCH Computerarchitecture news, vol. 41, no. 3, pp. 475–486, 2013.
[6] F. Oboril and M. B. Tahoori, “Extratime: Modeling and analysis ofwearout due to transistor aging at microarchitecture-level,” IEEE/IFIPInternational Conference on Dependable Systems and Networks (DSN2012), 2012.
[7] R. B. R. Chowdhury, A. K. Kannepalli, S. Ku, and E. Rotenberg,“Anycore: A synthesizable rtl model for exploring and fabricating adap-tive superscalar cores,” Performance Analysis of Systems and Software(ISPASS), 2016 IEEE International Symposium on, 2016.
[9] S. Li, J. H. Ahn, R. D. Strong, J. B. Brockman, D. M. Tullsen, andN. P. Jouppi, “McPAT: An Integrated Power, Area, and Timing ModelingFramework for Multicore and Manycore Architectures,” in MICRO 42:Proceedings of the 42nd Annual IEEE/ACM International Symposiumon Microarchitecture, 2009, pp. 469–480.
[10] A. Waterman, Y. Lee, D. A. Patterson, and K. Asanovic, “The risc-vinstruction set manual, volume i: Base user-level isa. eecs department,”University of California, 2011.
[11] D. Burger, T. M. Austin, and S. Bennett, “Evaluating future micropro-cessors: the simplescalar tool set,” University of Wisconsin-Madison,Tech. Rep., 1996.
[12] A. Roelke and M. Stan, “Risc5: Implementing the RISC-V ISA ingem5,” First Workshop on Computer Architecture Research with RISC-V(CARRV), 2017.
[13] A. A. Nair and L. K. John, “Simulation points for spec cpu 2006,” in2008 IEEE International Conference on Computer Design, 2008.
[14] K. Ganesan, D. Panwar, and L. K. John, “Generation, validation andanalysis of spec cpu2006 simulation points based on branch, memoryand tlb characteristics,” in SPEC Benchmark Workshop. Springer, 2009.
[15] G. Hamerly, E. Perelman, J. Lau, and B. Calder, “Simpoint 3.0: Fasterand more flexible program phase analysis,” Journal of Instruction LevelParallelism, vol. 7, no. 4, pp. 1–28, 2005.
[16] E. Perelman, G. Hamerly, and B. Calder, “Picking statistically validand early simulation points,” in Proceedings of the 12th InternationalConference on Parallel Architectures and Compilation Techniques, ser.PACT ’03, 2003.
[17] T. Sherwood, E. Perelman, G. Hamerly, and B. Calder, “Automaticallycharacterizing large scale program behavior,” SIGOPS Oper. Syst. Rev.,vol. 36, no. 5, pp. 45–57, Oct. 2002.
[18] A. Gutierrez, J. Pusdesris, R. G. Dreslinski, T. Mudge, C. Sudanthi,C. D. Emmons, M. Hayenga, and N. Paver, “Sources of error in full-system simulation,” in Performance Analysis of Systems and Software(ISPASS), 2014 IEEE International Symposium on, 2014.
[19] L. Yang, L. Wang, X. Zhang, and D. Wang, “An approach to build cycleaccurate full system vliw simulation platform,” Simulation ModellingPractice and Theory, vol. 67, pp. 14 – 28, 2016.
[20] M. B. Breughe, S. Eyerman, and L. Eeckhout, “Mechanistic analyticalmodeling of superscalar in-order processor performance,” ACM Trans.Archit. Code Optim., vol. 11, no. 4, pp. 50:1–50:26, Jan. 2015.
[21] A. K. Coskun, R. Strong, D. M. Tullsen, and T. Simunic Rosing,“Evaluating the impact of job scheduling and power management onprocessor lifetime for chip multiprocessors,” SIGMETRICS Perform.Eval. Rev., vol. 37, no. 1, pp. 169–180, Jun. 2009.