
Toughness of fibre reinforced hydraulic lime mortar. Part-2: Dynamic response
11
ORIGINAL ARTICLE Toughness of fibre reinforced hydraulic lime mortar. Part-2: Dynamic response Rachel Chan • Vivek Bindiganavile Received: 20 February 2009 / Accepted: 5 April 2010 / Published online: 14 April 2010 Ó RILEM 2010 Abstract The seismic rehabilitation of historical masonry buildings necessitates a quantitative under- standing of the repointing mortar under variable strain rates. In Part-1 of this paper, plain and fibre reinforced hydraulic lime mortar specimens were examined under compression, flexure and direct shear to evaluate the post-crack response under quasi-static loading. It was seen that although the fibres enhance the flexural toughness of hydraulic lime mortar, the material is weakest in Mode I fracture. In Part-2 of this paper, the authors describe the strain rate sensitivity of hydraulic lime mortar on the basis of impact testing of notched beams. The mixes were identical to those examined in Part-1, and the dynamic response was evaluated using a drop-weight impact machine for strain rates in the range of 10 -6 to 10 s -1 . The authors found that compared to fibre reinforced Portland cement-based mortar and con- crete, the flexural response of hydraulic lime mortar is more sensitive to strain rate. Keywords Hydraulic lime Mortar Fibre reinforcement Impact Strain rate sensitivity Dynamic impact factor Fracture toughness 1 Introduction Many old stone masonry structures are located in areas of seismic activity. The proper rehabilitation of such buildings requires a quantitative knowledge of the dynamic response of the masonry unit and its components. In particular, the bond between the stone blocks and the binding mortar is of concern [1]. As explained in Part-1 of this report [2], in the restora- tion of heritage stone masonry in Canada, hydraulic lime mortar is chosen for it is intentionally weaker than the stone blocks and also allows for their movement over the first few months. While there is considerable information on the strain rate sensitivity of Portland cement based composites [3], very little is known about fracture in hydraulic lime mortars (HLM) under high strain rates. A civil engineering structure may be subjected to a range of dynamic loading from creep to blast loads resulting in strain rates from 10 -5 to 10 3 s -1 [4]. The first part to this study [2] described the quasi-static response of these mortars in compression, flexure and shear. It was established that the principal mode of failure for both plain and fibre reinforced HLM was in flexure. This paper examines the flexural response at higher strain rates to evaluate the critical strain rate sensitive parameters for this material. In the absence of available data on the dynamic response of HLM, the authors drew lessons from existing literature on the dynamic response of mortars and fibre reinforced composites made with Portland cement. R. Chan V. Bindiganavile (&) Department of Civil and Environmental Engineering, University of Alberta, 9105-116th Street, Edmonton, AB T6G2W2, Canada e-mail: [email protected] Materials and Structures (2010) 43:1445–1455 DOI 10.1617/s11527-010-9599-3
-
Upload
rachel-chan -
Category
Documents
-
view
215 -
download
2
Transcript of Toughness of fibre reinforced hydraulic lime mortar. Part-2: Dynamic response
ORIGINAL ARTICLE
Toughness of fibre reinforced hydraulic lime mortar.Part-2: Dynamic response
Rachel Chan • Vivek Bindiganavile
Received: 20 February 2009 / Accepted: 5 April 2010 / Published online: 14 April 2010
� RILEM 2010
Abstract The seismic rehabilitation of historical
masonry buildings necessitates a quantitative under-
standing of the repointing mortar under variable
strain rates. In Part-1 of this paper, plain and fibre
reinforced hydraulic lime mortar specimens were
examined under compression, flexure and direct shear
to evaluate the post-crack response under quasi-static
loading. It was seen that although the fibres enhance
the flexural toughness of hydraulic lime mortar, the
material is weakest in Mode I fracture. In Part-2 of
this paper, the authors describe the strain rate
sensitivity of hydraulic lime mortar on the basis of
impact testing of notched beams. The mixes were
identical to those examined in Part-1, and the
dynamic response was evaluated using a drop-weight
impact machine for strain rates in the range of 10-6 to
10 s-1. The authors found that compared to fibre
reinforced Portland cement-based mortar and con-
crete, the flexural response of hydraulic lime mortar
is more sensitive to strain rate.
Keywords Hydraulic lime � Mortar �Fibre reinforcement � Impact � Strain rate sensitivity �Dynamic impact factor � Fracture toughness
1 Introduction
Many old stone masonry structures are located in
areas of seismic activity. The proper rehabilitation of
such buildings requires a quantitative knowledge of
the dynamic response of the masonry unit and its
components. In particular, the bond between the stone
blocks and the binding mortar is of concern [1]. As
explained in Part-1 of this report [2], in the restora-
tion of heritage stone masonry in Canada, hydraulic
lime mortar is chosen for it is intentionally weaker
than the stone blocks and also allows for their
movement over the first few months. While there is
considerable information on the strain rate sensitivity
of Portland cement based composites [3], very little is
known about fracture in hydraulic lime mortars
(HLM) under high strain rates. A civil engineering
structure may be subjected to a range of dynamic
loading from creep to blast loads resulting in strain
rates from 10-5 to 103 s-1 [4]. The first part to this
study [2] described the quasi-static response of these
mortars in compression, flexure and shear. It was
established that the principal mode of failure for both
plain and fibre reinforced HLM was in flexure. This
paper examines the flexural response at higher strain
rates to evaluate the critical strain rate sensitive
parameters for this material. In the absence of
available data on the dynamic response of HLM,
the authors drew lessons from existing literature on
the dynamic response of mortars and fibre reinforced
composites made with Portland cement.
R. Chan � V. Bindiganavile (&)
Department of Civil and Environmental Engineering,
University of Alberta, 9105-116th Street, Edmonton,
AB T6G2W2, Canada
e-mail: [email protected]
Materials and Structures (2010) 43:1445–1455
DOI 10.1617/s11527-010-9599-3

Schuler et al. [5] summarized the experimental
data over the past 30 years for cement based com-
posites in tension which was seen to obey the Comite
Euro-Beton equations as shown below [4]:
DIF ¼ _e_es
� �1:026d
for _e� 30 s�1 ð1aÞ
DIF ¼ c_e_es
� �1=3
for _e [ 30 s�1 ð1bÞ
where _e ¼ 10�6 s�1 and log c = 7.11d - 2.33, such
that:
d ¼ 1
10þ 6f 0cf 0co
ð1cÞ
However, Malvar and Ross [6] report that this
relation underestimates the dynamic impact factor
(DIF) for strain rates lower than 30 s-1 and suggest
the following modified expressions:
DIF ¼ _e_es
� �d
for _e� 1 s�1 ð2aÞ
DIF ¼ c_e_es
� �1=3
for _e [ 1 s�1 ð2bÞ
where _e ¼ 10�6 s�1 and log c = 6d - 2, such that:
d ¼ 1
1þ 8f 0cf 0co
ð2cÞ
The addition of discrete short fibres to Portland
cement mortar is seen to improve the fracture
toughness [7]. Studies under dynamic loading [8]
showed that when used at up to 1.4% of the mortar
volume, the steel fibres resulted in an increase of
toughness by 2.5 times at a stress rate of 103
MPa s-1. However, it must be noted that the data
available is for mortars with a tensile strength of
1.5 MPa, i.e. about 10 times more than that of HLM
investigated in this study. In such controlled low
strength materials, polymeric fibres may be better
suited due to their lower modulus of elasticity.
Besides, the strength of the matrix is also known to
affect the material’s strain rate sensitivity: At similar
densities, higher strength concrete typically has a
lower sensitivity to the loading rate [9]. Polymeric
fibres depict a significant rate sensitivity and the
fracture energy and impact strength of plain concrete
are improved even at a dosage of 0.5% volume
fraction [10]. In fact the resulting flexural toughness
may even exceed that of a corresponding mix
containing an equal amount of steel fibres [11].
Additionally, with polymeric fibres, the mode of
failure may switch from one of pullout to that of fibre
fracture, indicating embrittlement at higher loading
rates [12].
2 Experimental details
An instrumented drop-weight impact-testing machine
as shown in Fig. 1 was used to impart dynamic
loading. The machine has a capacity of 1000 J and is
capable of dropping a 60 kg mass from heights of up
to 2.5 m. A plain hydraulic lime mortar and two fibre
reinforced mixes with proportions as described in
Part-1 [2] were examined in three-point flexure. Note
that the water content was kept constant across all
three mixes (equal to 7.7%), although the addition of
fibres affected the workability as determined by the
spread on a flow table. The specimens were subjected
to impact loading from two drop heights of 250 mm
and 500 mm, respectively. This produced a corre-
sponding impact velocity of 2.20 and 3.10 m s-1,
respectively. The dimension of specimens was iden-
tical to those used for the flexural tests under quasi-
static loading (100 mm 9 100 mm 9 350 mm), so
that together with the two dynamic rates, a range of
strain rates between 10-6 to 10 s-1 was examined in
this program. These strain rates capture up to the
lower end of seismic activity.
Fig. 1 Instrumented drop-weight impact machine
1446 Materials and Structures (2010) 43:1445–1455

The loading history was captured with a load cell,
equipped with a Wheatstone bridge mounted on a tup
(Fig. 2). The acceleration history was captured using
a piezoelectric accelerometer that was attached to the
bottom of the specimen at midspan. The data from
the accelerometer was collected by a data acquisition
system at a rate of 100,000 Hz and was integrated
twice with respect to time so as to yield the deflection
history at mid-span of the beam. Since a suddenly
applied load creates an inertial response from the
specimen, it is required that this inertia be accounted
for to derive the flexural stresses on the beam as
experienced by the material [13]. The equivalent
static response has been derived based on the single-
degree-of-freedom approach. For a beam subjected to
3-point bending under impact, the generalized inertial
load on the specimen during the impact Pi(t) is
represented by [14]:
PiðtÞ ¼ qAaoðtÞ1
3þ 8ðovÞ3
3l2
" #ð3aÞ
where ao(t) = acceleration at midspan of the beam at
time, t; q = mass density for the beam material d
A = cross-sectional area of the beam; l = clear span
of the beam; ov = length of overhanging portion of
the Beam
Thus, the actual stressing load, Pb(t) is derived
after subtracting the inertial load from the total load
recorded by the load cell, Pt(t).
Pb tð Þ ¼ Pt tð Þ � Pi tð Þ ð3bÞAlso, the velocity and displacement histories, vo(t),
and, do(t), at the load-point were obtained by
integrating the acceleration history with respect to
time:
voðtÞ ¼Z
aoðtÞdt ð4Þ
doðtÞ ¼Z
voðtÞdt ð5Þ
The displacement history as derived in Eq. 5 was
used to represent the strain rate. In addition, two
high-speed cameras were employed to obtain a
stereoscopic record of the dynamic event. Both
cameras captured images at a frequency of
10,000 frames s-1 and were later analyzed with an
image processing software to derive displacement
histories. The load cell, the accelerometer and the two
cameras were all connected to an optical sensor that
served as the trigger device. This sensor was placed at
a distance of 2 mm above the top contact surface of
the specimen, Fig. 3. The devices were triggered
immediately once the hammer passed the sensor
causing a disconnection in the optical circuit. This
caused a previous voltage of 5 V to drop to 0 V,
effecting the start of data collection by the acquisition
system (EDAQ). By using this trigger mechanism,
the raw data from all four sources were synchronized
to the same time stamp. Six beams were tested per
mix so that the results shown in the following
sections are the representative data averaged over
each series of specimens.
3 Results and discussion
3.1 Analysis of impact test data
In this study, the acceleration under impact loading
was measured through three different sources
namely, a piezoelectric accelerometer, a blade load
cell based on a Wheatstone bridge and through high
speed cameras. Where as the accelerometer and the
load cell directly measured accelerations, the cameras
measured actual displacement. While the cameras
were set to record data at only 10,000 Hz, the load
cell and the accelerometer registered data at
100,000 Hz. The high speed images were analyzedFig. 2 600 blade load cell: a location of strain gauges in tup and
b Wheatstone bridge circuit
Materials and Structures (2010) 43:1445–1455 1447

to derive an acceleration-time response at midspan of
the beam and the acceleration histories from all three
sources are shown in Fig. 4. It is clear that the actual
displacements as recorded by the cameras are in
keeping with the accelerometer data, while the load
cell records lower accelerations. The strain rates
corresponding to the two drop heights of impact
are shown in Table 1. It was approximately 5 s-1 for
the drop height of 250 mm, while about 10 s-1 for
the higher drop height of 500 mm.
Fig. 3 Trigger mechanism
for activating the high speed
data collection
0
500
1000
1500
2000
2500
3000
3500
4000
0
1000
2000
3000
4000
5000
6000
7000
8000
Acc
eler
atio
n (m
/s)
0
1000
2000
3000
4000
5000
6000
7000
Acc
eler
atio
n (m
/s)
0 2 4 6 8 10 12 14 160 2 4 6 8 10 12 14 160
500
1000
1500
2000
2500
3000
3500
0 2 4 6 8 10 12 14 16
0
500
1000
1500
2000
2500
3000
3500
4000
0 2 4 6 8 10 12 14 160 2 4 6 8 10 12 14 160
500
1000
1500
2000
2500
3000
3500
0 2 4 6 8 10 12 14 16
Time (ms) Time (ms)
Time (ms) Time (ms)
Time (ms)
Time(ms)
accelerometer
High speed camera
Load-cell
accelerometer
High speed camera
Load-cell
accelerometer
High-speed camera
Load-cell
accelerometer accelerometer
Load-cell
Load-cell
High speed camera High speed camera
accelerometer
High speed camera
Load-cell
(a) (b) (c)
(d) (e) (f)
Fig. 4 Acceleration histories for fibre reinforced HLM obtained from various measuring devices. a 0.25 m drop; Vf = 0%, b 0.25 m
drop; Vf = 0.25%, c 0.25 m drop; Vf = 0.50%, d 0.50 m drop; Vf = 0%, e 0.50 m drop; Vf = 0.25% and f 0.50 m drop; Vf = 0.50%
1448 Materials and Structures (2010) 43:1445–1455
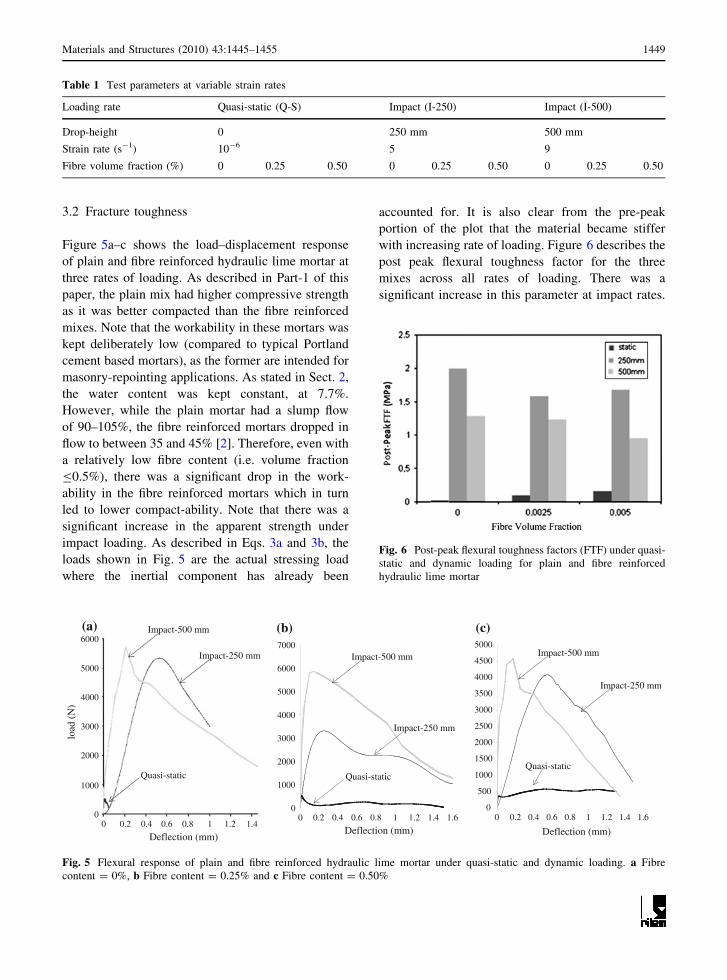
3.2 Fracture toughness
Figure 5a–c shows the load–displacement response
of plain and fibre reinforced hydraulic lime mortar at
three rates of loading. As described in Part-1 of this
paper, the plain mix had higher compressive strength
as it was better compacted than the fibre reinforced
mixes. Note that the workability in these mortars was
kept deliberately low (compared to typical Portland
cement based mortars), as the former are intended for
masonry-repointing applications. As stated in Sect. 2,
the water content was kept constant, at 7.7%.
However, while the plain mortar had a slump flow
of 90–105%, the fibre reinforced mortars dropped in
flow to between 35 and 45% [2]. Therefore, even with
a relatively low fibre content (i.e. volume fraction
B0.5%), there was a significant drop in the work-
ability in the fibre reinforced mortars which in turn
led to lower compact-ability. Note that there was a
significant increase in the apparent strength under
impact loading. As described in Eqs. 3a and 3b, the
loads shown in Fig. 5 are the actual stressing load
where the inertial component has already been
accounted for. It is also clear from the pre-peak
portion of the plot that the material became stiffer
with increasing rate of loading. Figure 6 describes the
post peak flexural toughness factor for the three
mixes across all rates of loading. There was a
significant increase in this parameter at impact rates.
Table 1 Test parameters at variable strain rates
Loading rate Quasi-static (Q-S) Impact (I-250) Impact (I-500)
Drop-height 0 250 mm 500 mm
Strain rate (s-1) 10-6 5 9
Fibre volume fraction (%) 0 0.25 0.50 0 0.25 0.50 0 0.25 0.50
0
1000
2000
3000
4000
5000
6000
0
1000
2000
3000
load
(N
)
4000
5000
60007000
0 0.2 0.4 0.6 0.8 1 1.2 1.40 0.2 0.4 0.6 0.8 1 1.2 1.4
1.60
500
1000
1500
2000
2500
3000
3500
4000
4500
5000
0 0.2 0.4 0.6 0.8 1 1.2 1.4 1.6
Quasi-static Quasi-staticQuasi-static
Impact-250 mm
Impact-250 mm
Impact-250 mm
Impact-500 mmImpact-500 mm
Impact-500 mm
Deflection (mm) Deflection (mm)Deflection (mm)
(a) (b) (c)
Fig. 5 Flexural response of plain and fibre reinforced hydraulic lime mortar under quasi-static and dynamic loading. a Fibre
content = 0%, b Fibre content = 0.25% and c Fibre content = 0.50%
Fig. 6 Post-peak flexural toughness factors (FTF) under quasi-
static and dynamic loading for plain and fibre reinforced
hydraulic lime mortar
Materials and Structures (2010) 43:1445–1455 1449

Similar improvement in the post-crack response was
noted previously in studies with fibre reinforced
concrete at high strain rates [14, 15]. However, there
was a subsequent drop in the post-peak FTF for all
the mixes when the drop height was raised from 250
to 500 mm. Thus, while the modulus of rupture
registered an increase with an increase in the strain
rate, the drop in the post-peak FTF at higher rates
indicates an embrittlement in the composite and a
limit to its energy absorbing capacity.
The fracture toughness of plain and fibre rein-
forced mortars were evaluated at three rates of
loading based on the flexural load–displacement plots
shown in Fig. 5a–c. The crack mouth opening
displacement (CMOD) is known to vary between
2D/3 to 4D/3, where D is the displacement of the
neutral axis at mid-span [16]. Thus, in order to
evaluate the fracture properties, the mid-span beam
deflection in Fig. 5 was assumed to be equal to the
crack mouth opening displacement at the notch.
These plots were analyzed to generate crack growth
resistance curves (Fig. 7a–c), where the crack growth
resistance is expressed as the stress intensity factor,
K, at the tip of the crack as it extends into the matrix
leading to an effective crack length, aeff. The
derivation is outlined in Appendix 1.
The peak value on the plots in Fig. 7, is noted as the
fracture toughness, KIC, which is a material property
(Table 2). It is clear from Fig. 8, that the fracture
toughness of plain hydraulic lime mortar increases
with an increase in the rate of loading. Similarly, note
that for the fibre reinforced mix containing 0.25%
fibres by volume, there was an increase in KIC at
higher rates of loading. However, for the mix with
0.50% Vf, there was a drop in the fracture toughness at
500 mm drop height. A comparison of R-curves from
the impact tests in Fig. 7c suggests that while the
stress intensity factor was higher initially from a
500 mm drop, it fell below that for the 250 mm drop
at increasing effective crack length, especially after
80 mm. Also, the addition of fibres did not necessarily
lead to an increase in the fracture toughness especially
Table 2 Mechanical properties of HLM under variable strain rates
Mix designation fr (kPa) FTF (kPa) KIC (MPa m-0.5)
Q-S I-250 I-500 Q-S I-250 I-500 Q-S I-250 I-500
Plain HLM 193 2123 2239 6 2040 1300 0.097 3.33 5.1
FR-HLM (0.25% Vf) 205 1435 2091 95 1600 1250 0.21 3.71 10
FR-HLM (0.50% Vf) 225 1620 2273 165 1720 960 0.25 5.83 4.9
0
1
2
3
4
5
6
7
8
9
10
0
1
2
3
4
5
6
0 20 40 60 80 100 0 20 40 60 80 100
aeff (mm) aeff (mm) aeff (mm)
Impact-500 mm
Impact-250 mm
Q-static
Impact-500 mm
Impact-250 mm
Q-Static
Q-Static
Impact-500 mm
Impact-250 mm
(a) (b) (c)
Fig. 7 Crack growth resistance in hydraulic lime mortar at different strain rates: a 0% Fibre content, b 0.25% Fibre content and c0.50% Fibre content
1450 Materials and Structures (2010) 43:1445–1455

at the higher drop height of 500 mm, as shown in
Fig. 8. This is likely due to a lack of proper dispersion
at higher fibre dosage, which led to a reduction in the
compressive strength of the fibre reinforced mixes.
While the polymer fibre-matrix bond is known to
increase significantly under higher loading rates, this
improvement may have been offset by the lower
compressive strength of the fibre reinforced mixes.
The post-peak FTF is therefore a better indicator of
the fibre efficiency.
3.3 Strain rate sensitivity
The modulus of rupture and fracture toughness are
plotted as a function of strain rate in Fig. 9a and b,
respectively. It is evident that hydraulic lime mortar
is a strain rate sensitive material such that both its
modulus of rupture and its fracture toughness depict a
time dependent response. The dynamic impact factors
as predicted by Eqs. 2a–2c from Malvar and Ross [6]
are shown alongside. Note that the firm lines in
Fig. 9a depict the response from regular concrete
(f 0c = 30 MPa) while the dotted lines were drawn for
hydraulic lime mortar to account for its much lower
compressive strength [Malvar–Ross (m)]. It is readily
seen that hydraulic lime mortar is more sensitive to
high strain rates than conventional concrete. More
significantly, when the compressive strength of the
material was taken into account via the correction
factor, d (Eq. 2c), the predicted dynamic response
was far greater than the actual experimental value.
Therefore, it is clear that while the constitutive laws
formulated for regular concrete underestimate the
strain rate effects for HLM, adopting the correction
factor for its low strength will lead to non-conserva-
tive estimates of its dynamic response. The Malvar–
Ross adaptation of the CEB formulation addresses
cement based composites as low as 10 MPa in
compression. Clearly, as more data is generated on
hydraulic lime mortars, the available models such as
that in Eqs. 1a–1c and 2a–2c may be extended to
describe rate effects in controlled low strength
building materials. In Fig. 9b, the fracture toughness,
KIC, was plotted alongside the expression for the DIF
of fracture energy of conventional concrete, as
suggested by Schuler et al. [5]. Assuming a propor-
tional relation between fracture toughness and frac-
ture energy for a given material, this expression
underestimates the dynamic fracture response of the
HLM mixes. As is evident from their respective
values of DIF, the fracture toughness of HLM was far
more sensitive to strain rates than the modulus of
rupture. This is in keeping with previous reports for
plain concrete [17, 18]. A comparison with fibre
reinforced Portland cement mortar and concrete is
Fig. 8 Mode I fracture toughness of plain and fibre reinforced
hydraulic lime mortar (Fibre volume fraction = 0%, 0.25%
and 0.50%)
Fig. 9 Strain rate
sensitivity of plain and fibre
reinforced hydraulic lime
mortar showing a Modulus
of rupture and b Mode I
fracture toughness
Materials and Structures (2010) 43:1445–1455 1451
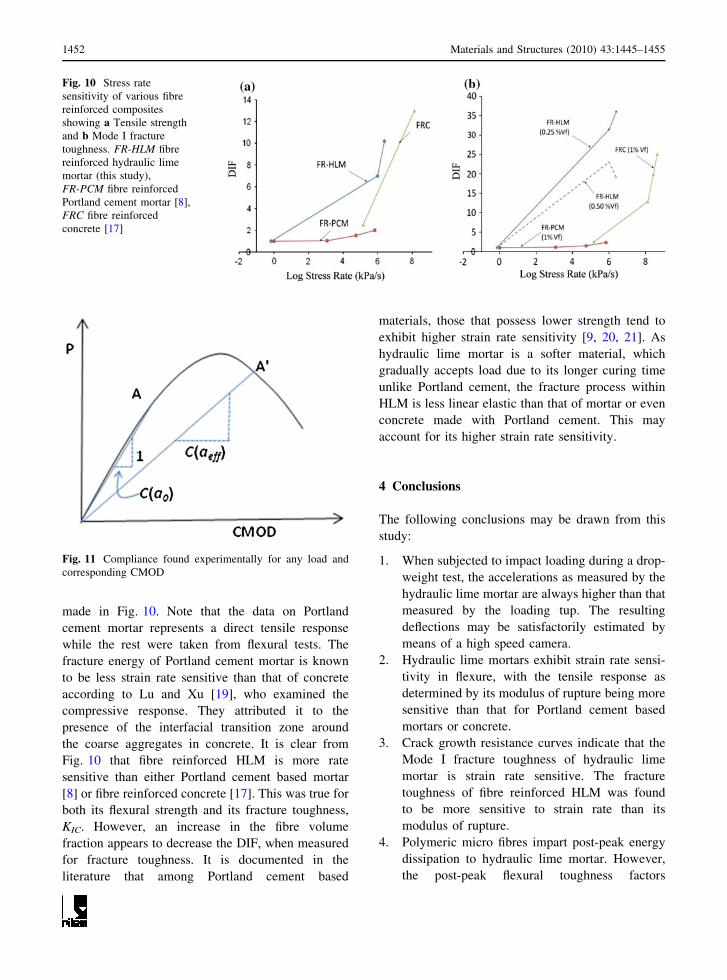
made in Fig. 10. Note that the data on Portland
cement mortar represents a direct tensile response
while the rest were taken from flexural tests. The
fracture energy of Portland cement mortar is known
to be less strain rate sensitive than that of concrete
according to Lu and Xu [19], who examined the
compressive response. They attributed it to the
presence of the interfacial transition zone around
the coarse aggregates in concrete. It is clear from
Fig. 10 that fibre reinforced HLM is more rate
sensitive than either Portland cement based mortar
[8] or fibre reinforced concrete [17]. This was true for
both its flexural strength and its fracture toughness,
KIC. However, an increase in the fibre volume
fraction appears to decrease the DIF, when measured
for fracture toughness. It is documented in the
literature that among Portland cement based
materials, those that possess lower strength tend to
exhibit higher strain rate sensitivity [9, 20, 21]. As
hydraulic lime mortar is a softer material, which
gradually accepts load due to its longer curing time
unlike Portland cement, the fracture process within
HLM is less linear elastic than that of mortar or even
concrete made with Portland cement. This may
account for its higher strain rate sensitivity.
4 Conclusions
The following conclusions may be drawn from this
study:
1. When subjected to impact loading during a drop-
weight test, the accelerations as measured by the
hydraulic lime mortar are always higher than that
measured by the loading tup. The resulting
deflections may be satisfactorily estimated by
means of a high speed camera.
2. Hydraulic lime mortars exhibit strain rate sensi-
tivity in flexure, with the tensile response as
determined by its modulus of rupture being more
sensitive than that for Portland cement based
mortars or concrete.
3. Crack growth resistance curves indicate that the
Mode I fracture toughness of hydraulic lime
mortar is strain rate sensitive. The fracture
toughness of fibre reinforced HLM was found
to be more sensitive to strain rate than its
modulus of rupture.
4. Polymeric micro fibres impart post-peak energy
dissipation to hydraulic lime mortar. However,
the post-peak flexural toughness factors
Fig. 10 Stress rate
sensitivity of various fibre
reinforced composites
showing a Tensile strength
and b Mode I fracture
toughness. FR-HLM fibre
reinforced hydraulic lime
mortar (this study),
FR-PCM fibre reinforced
Portland cement mortar [8],
FRC fibre reinforced
concrete [17]
Fig. 11 Compliance found experimentally for any load and
corresponding CMOD
1452 Materials and Structures (2010) 43:1445–1455
decreased with an increase in the rate of loading.
This implies embrittlement of the fibre reinforced
mortar at high strain rates.
5. Modified ‘Comite Euro-Beton’ (CEB) expres-
sions that describe the dynamic impact factors
for conventional concrete may not be directly
applied to hydraulic lime mortars. In particular,
accounting for the low strength of this material
leads to a significant overestimation of the
dynamic impact factors.
Acknowledgements The authors wish to thank the Network
of Centres of Excellence on Intelligent Systems for Innovative
Structures (ISIS-Canada) and the Natural Sciences and
Engineering Research Council (NSERC) Canada, for
financial support to this study. In addition, the authors are
grateful to the Masonry Contractors Association of Alberta
(Northern Region) and Public Works Canada, for their in-kind
contributions.
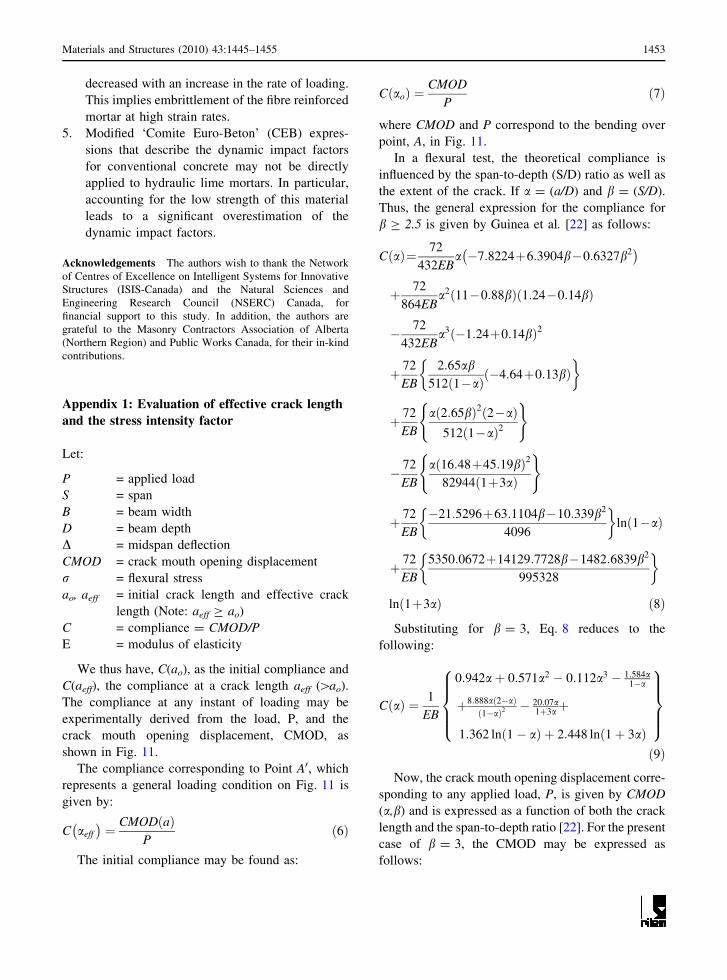
Appendix 1: Evaluation of effective crack length
and the stress intensity factor
Let:
P = applied load
S = span
B = beam width
D = beam depth
D = midspan deflection
CMOD = crack mouth opening displacement
r = flexural stress
ao, aeff = initial crack length and effective crack
length (Note: aeff C ao)
C = compliance = CMOD/P
E = modulus of elasticity
We thus have, C(ao), as the initial compliance and
C(aeff), the compliance at a crack length aeff ([ao).
The compliance at any instant of loading may be
experimentally derived from the load, P, and the
crack mouth opening displacement, CMOD, as
shown in Fig. 11.
The compliance corresponding to Point A0, which
represents a general loading condition on Fig. 11 is
given by:
C aeff
� �¼ CMOD að Þ
Pð6Þ
The initial compliance may be found as:
C aoð Þ ¼CMOD
Pð7Þ
where CMOD and P correspond to the bending over
point, A, in Fig. 11.
In a flexural test, the theoretical compliance is
influenced by the span-to-depth (S/D) ratio as well as
the extent of the crack. If a = (a/D) and b = (S/D).
Thus, the general expression for the compliance for
b C 2.5 is given by Guinea et al. [22] as follows:
C að Þ¼ 72
432EBa �7:8224þ6:3904b�0:6327b2� �
þ 72
864EBa2 11�0:88bð Þ 1:24�0:14bð Þ
� 72
432EBa3 �1:24þ0:14bð Þ2
þ 72
EB
2:65ab512 1�að Þ �4:64þ0:13bð Þ� �
þ 72
EB
a 2:65bð Þ2 2�að Þ512 1�að Þ2
( )
� 72
EB
a 16:48þ45:19bð Þ2
82944 1þ3að Þ
( )
þ 72
EB
�21:5296þ63:1104b�10:339b2
4096
� �ln 1�að Þ
þ 72
EB
5350:0672þ14129:7728b�1482:6839b2
995328
� �
ln 1þ3að Þ ð8Þ
Substituting for b = 3, Eq. 8 reduces to the
following:
C að Þ ¼ 1
EB
0:942aþ 0:571a2 � 0:112a3 � 1:584a1�a
þ8:888a 2�að Þ1�að Þ2 � 20:07a
1þ3aþ
1:362 ln 1� að Þ þ 2:448 ln 1þ 3að Þ
8>>><>>>:
9>>>=>>>;ð9Þ
Now, the crack mouth opening displacement corre-
sponding to any applied load, P, is given by CMOD
(a,b) and is expressed as a function of both the crack
length and the span-to-depth ratio [22]. For the present
case of b = 3, the CMOD may be expressed as
follows:
Materials and Structures (2010) 43:1445–1455 1453

CMODðaÞ ¼ 24P
EBffiffiffipp 0:0052� 1:12aþ 0:2456a2
� 0:176a3 þ 0:086a4 � 0:01148a5
� 0:227 ln(1 + aÞþ0:616 ln(1 + 3aÞ
� 0:879
1� aþ 0:8745
ð1� aÞ2
)ð10Þ
As mentioned earlier, for the impact tests, the
CMOD was measured using high speed cameras. On
the other hand, for the quasi-static tests, the mid-span
deflection, D, was taken to be equal to the CMOD.
This was justified on the basis of the observation by
Armelin and Banthia [16]. Upon relating the theo-
retical result of CMOD(a) for a given value of the
applied load, P, from Eq. 10 with the experimental
value, one obtains the corresponding value for the
modulus of elasticity, E. Since the elastic modulus
remains constant throughout the extension of the
crack, it is found from the bending over point,
corresponding to the initial crack length, ao. Substi-
tuting this value of E in Eq. 9, results in the
theoretical evaluation of the compliance correspond-
ing to P, at any instant. Equating the experimentally
found compliance at any point, A0, as given by Eq. 6,
with the corresponding theoretical value from Eq. 9,
we may determine the corresponding effective crack
length, aeff.
Finally, the compliance is related to the specific
energy release rate, G, and in turn to the stress
intensity factor, KI, as given by the well-known
relationships in Broek [23]:
G ¼ P2
2BD
dC að Þda
ð11Þ
K1 ¼ffiffiffiffiffiffiffiGEp
ð12ÞBased on the effective crack length, aeff, derived in
Eq. 10, the stress intensity factor for the three point
bend test was determined as follows [21]:
KIðaÞ ¼6M
D5=2
ffiffiffiap
ð1� aÞ3=2ð1þ 3aÞ
" #ð13Þ
p1ðaÞ þ4
3p4ðaÞ � p1ðaÞ½ �
� �ð14Þ
where
M ¼ PD
2; ð15Þ
p4ðaÞ ¼ 1:9þ 0:41aþ 0:51a2 � 0:17a3 ð16aÞ
and
p1ðaÞ ¼ 1:99þ 0:83a� 0:31a2 þ 0:14a3 ð16bÞ
References
1. Burnett S, Gilbert M, Molyneaux T, Tyas A, Hobbs B,
Beattle G (2007) The response of masonry joints to
dynamic tensile loading. Mater Struct 40:517–527
2. Chan R, Bindiganavile V (2010) Toughness of fibre rein-
forced hydraulic lime mortar. Part-1: Quasi-static response.
Mater Struct. doi:10.1617/s11527-010-9598-4
3. 446.4R-04 (2004) Report on the dynamic fracture of
concrete, Committee 446. American Concrete Institute
4. Comite Euro-International du Beton—Federation Interna-
tionale de la Precontrainte (1990) CEB-FIP Model Code
90. Redwood Books, Trowbridge, Wiltshire, UK
5. Schuler H, Mayrhofer C, Thoma K (2006) Spall experi-
ments for the measurement of the tensile strength and
fracture energy of concrete at high strain rates. Int J Impact
Eng 32:1635–1650
6. Malvar LJ, Ross CA (1998) Review of strain rate effects
for concrete in tension. ACI Mater J 95(6):735–739
7. Banthia N, Sheng J (1996) Fracture toughness of micro-fiber
reinforced cement composites. Cement Concr Compos 18(4):
251–269
8. Glinicki MA (1994) Toughness of fibre reinforced mortar
at high tensile loading rates. ACI Mater J 91(2):161–166
9. Bindiganavile V, Banthia N, Arup B (2002) Impact
response of an ultra high strength fibre reinforced cement
composite. ACI Mater J 99(6):543–548
10. Mindess S, Vondran G (1988) Properties of concrete
reinforced with fibrillated polypropylene fibres under
impact loading. Cement Concr Res 18(1):109–115
11. Bindiganavile V, Banthia N (2001) Polymer and steel fibre
reinforced cementitious composites under impact loading.
Part-2. Flexural toughness. ACI Mater J 98(1):17–24
12. Bindiganavile V, Banthia N (2005) Impact response of
the fibre-matrix bond in concrete. Can J Civil Eng 32(5):
924–933
13. Chen EP, Sih GC (1977) Transient response of cracks to
impact loads. In: Mechanics of fracture, vol 4: elastody-
namic crack problems, pp 1–58
14. Banthia NP, Mindess S, Bentur A, Pigeon M (1989) Impact
testing of concrete using a drop-weight impact machine.
Exp Mech 29(12):63–69
15. Shah SP (1987) Strain rate effects for concrete and fiber
reinforced concrete subjected to impact loading. Report
accession # ADA188659. Defence Technical Information
Center, 83 pp
16. Armelin HS, Banthia N (1997) Predicting the flexural
postcracking performance of steel fiber reinforced concrete
from the pullout of single fibers. ACI Mater J 94(1):18–31
1454 Materials and Structures (2010) 43:1445–1455

17. Bindiganavile V (2003) Dynamic fracture toughness of
fibre reinforced concrete. PhD thesis, University of British
Columbia, Vancouver, BC, Canada, p 258
18. Yon JH, Hawkins NM, Kobayashi AS (1991) Fracture
process zone in dynamically loaded crack-line wedge-
loaded, double-cantilever beam concrete specimens. ACI
Mater J 88(5):470–479
19. Lu Y, Xu K (2004) Modeling of dynamic behaviour of
concrete materials under blast loading. Int J Solids Struct
41:131–143
20. Krauthammer T, Elfahal MM, Lim J, Ohno T, Beppu M,
Markeset G (2003) Size effect for high-strength concrete
cylinders subjected to axial impact. Int J Impact Eng 28(9):
1001–1016
21. Elfahal MM, Krauthammer T, Ohno T, Beppu M, And
Mindess S (2005) Size effect for normal-strength concrete
cylinders subjected to axial impact. Int J Impact Eng 31(4):
461–481
22. Guinea GV, Pastor JY, Planas J, Elices M (1998) Stress
intensity factor, compliance and CMOD for a general
three-point-bend beam. Int J Fract 89:103–116
23. Broek D (1986) Elementary engineering fracture mechanics.
Kluwer Academic Publishers, Dordrecht, The Netherlands
Materials and Structures (2010) 43:1445–1455 1455


