Touching Lives - Welcome to ARPICO Richard Pieris & … · · 2015-09-21Annual Report 2011 / 2012...
136
Richard Pieris & Company PLC Annual Report 2011 / 2012 TOUCHING LIVES
Transcript of Touching Lives - Welcome to ARPICO Richard Pieris & … · · 2015-09-21Annual Report 2011 / 2012...

Richard Pieris & Company PLCAnnual Report 2011 / 2012
Touching Lives
Richard Pieris & Company PLC310, High Level Road, Nawinna, Maharagama, Sri Lanka.
www.arpico.com
Richard
Pieris &
Com
pany P
LC
| A
nnual Rep
ort 2011 / 2012
For 80 years, Richard Pieris and Company has been touching the lives of Sri Lankans all over the island. We have made an indelible mark in the industry and together with a team that is focused on success, have taken our business to new heights. This year, as we celebrate a myriad of achievements, we look back on the illustrious years that have bought us to where we are today; a company that has stood the test of time, growing and adapting with time to become an unmistakable part of local lives. This is our legacy and our contribution to a budding economy, embodying the spirit and optimism of a growing nation while creating value for all.
TouChing LiveS
Produced by Copyline (Pvt) Ltd Printed by Gunaratne Offset Ltd

2 Richard Pieris and Company PLC | Annual Report 2011/2012
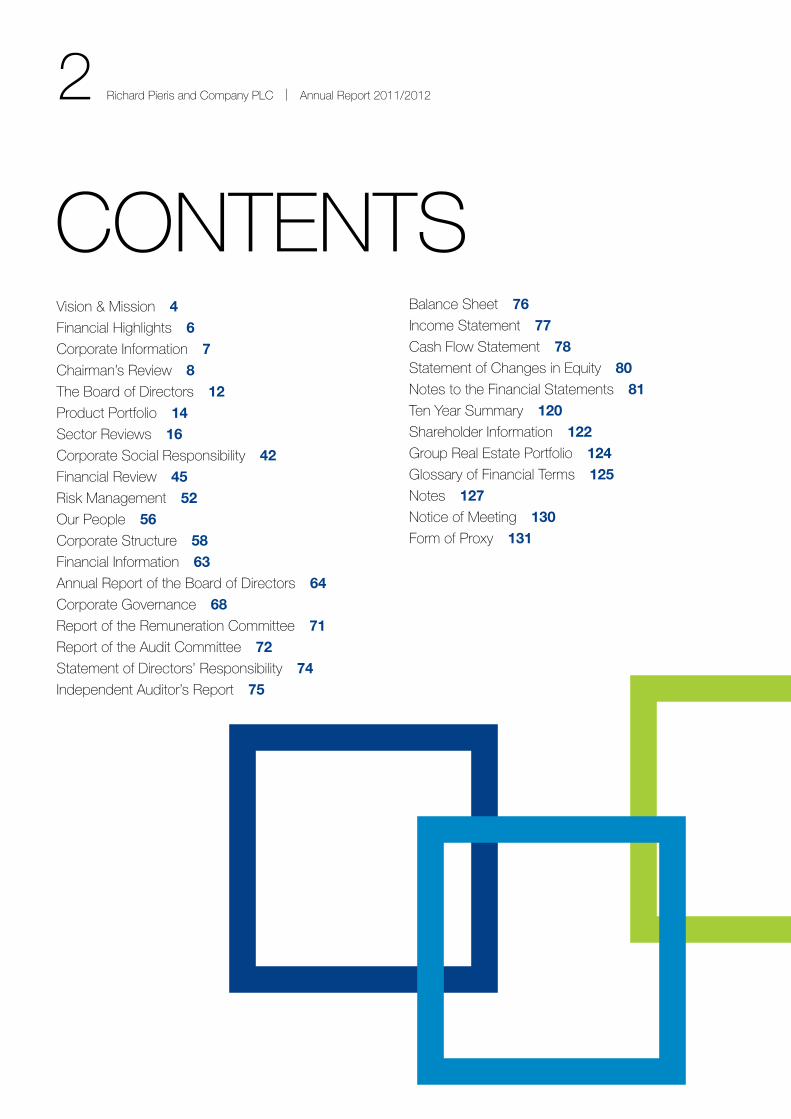
ContentsVision & Mission 4Financial Highlights 6Corporate Information 7Chairman’s Review 8the Board of Directors 12Product Portfolio 14sector Reviews 16Corporate social Responsibility 42Financial Review 45Risk Management 52our People 56Corporate structure 58Financial Information 63Annual Report of the Board of Directors 64Corporate Governance 68Report of the Remuneration Committee 71Report of the Audit Committee 72statement of Directors’ Responsibility 74Independent Auditor’s Report 75
Balance sheet 76Income statement 77Cash Flow statement 78statement of Changes in equity 80notes to the Financial statements 81ten Year summary 120shareholder Information 122Group Real estate Portfolio 124Glossary of Financial terms 125notes 127notice of Meeting 130Form of Proxy 131

3 Richard Pieris and Company PLC | Annual Report 2011/2012
4 Richard Pieris and Company PLC | Annual Report 2011/2012
Visionto be a market driven, technologically oriented diverse group.
We will organise and operate to continually focus on exceeding the expectations of our customers, whilst excelling in profitability and we will attract, develop and retain talented people to ensure the continued growth and viability of all our business ventures.
Missionto continually exceed the expectations of our customers.
to optimise the contribution from our employees by providing career and personal development opportunities, thereby creating an atmosphere that would motivate and internalise employee aspirations with corporate objectives.
to provide a satisfactory return to shareholders whilst retaining sufficient funds for reinvestment, thereby enhancing corporate wealth.
to ensure continuous growth by the planned expansion and diversification of business activities.
to continually strive for the upliftment of our community whilst adhering to high ethical standards in business.
VIsIon & MIssIon

5 Richard Pieris and Company PLC | Annual Report 2011/2012
VIsIon & MIssIon
6 Richard Pieris and Company PLC | Annual Report 2011/2012
2011/2012 2010/2011 Rs.’000 Rs.’000
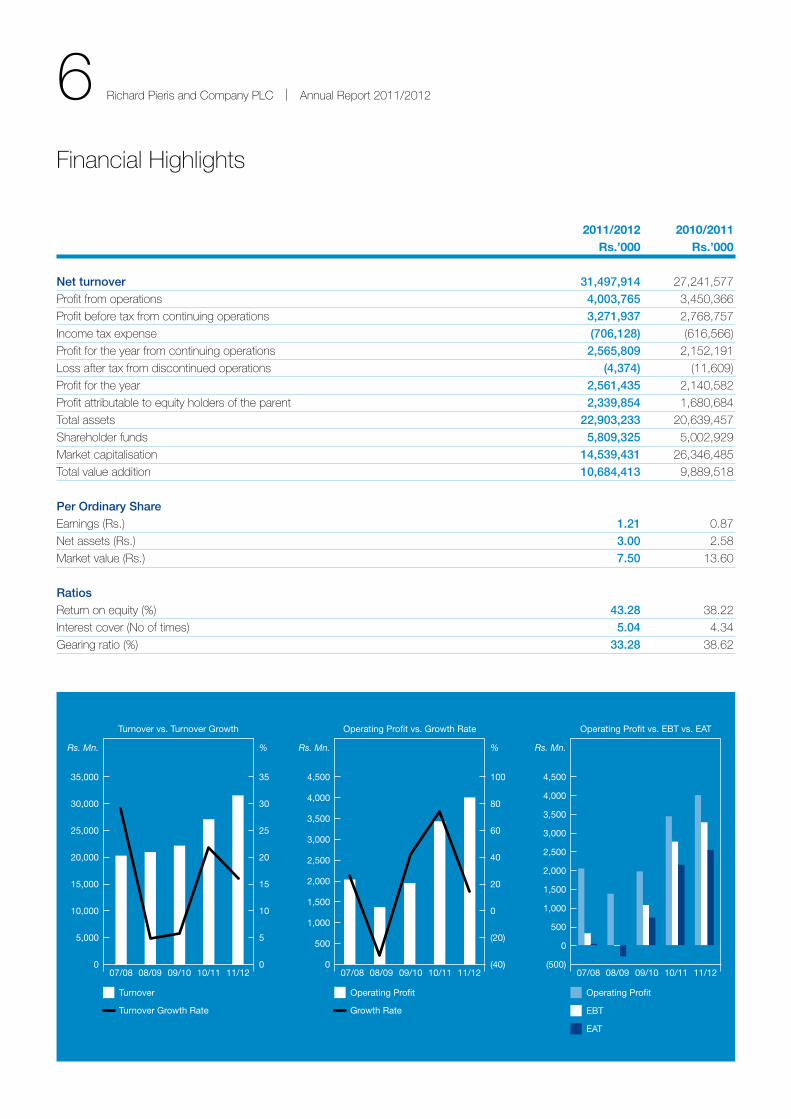
Net turnover 31,497,914 27,241,577
Profit from operations 4,003,765 3,450,366
Profit before tax from continuing operations 3,271,937 2,768,757
Income tax expense (706,128) (616,566)
Profit for the year from continuing operations 2,565,809 2,152,191
Loss after tax from discontinued operations (4,374) (11,609)
Profit for the year 2,561,435 2,140,582
Profit attributable to equity holders of the parent 2,339,854 1,680,684
total assets 22,903,233 20,639,457
shareholder funds 5,809,325 5,002,929
Market capitalisation 14,539,431 26,346,485
total value addition 10,684,413 9,889,518
Per Ordinary Share
earnings (Rs.) 1.21 0.87
net assets (Rs.) 3.00 2.58
Market value (Rs.) 7.50 13.60
Ratios
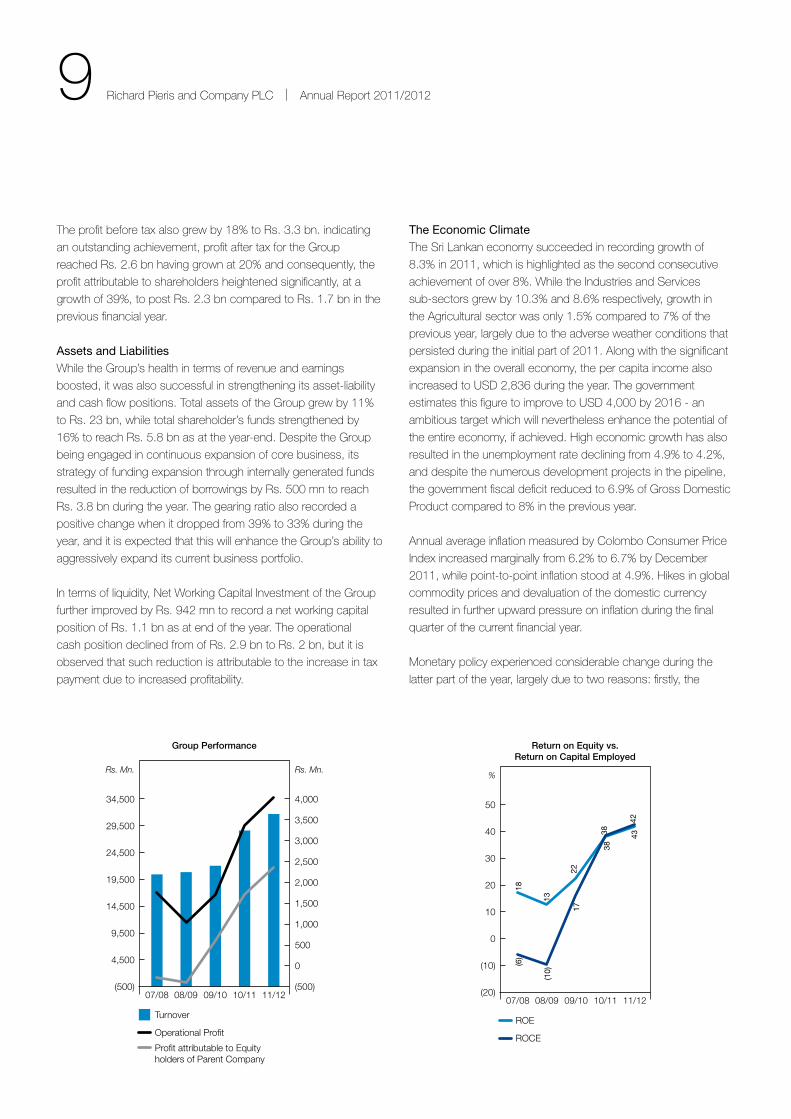
Return on equity (%) 43.28 38.22
Interest cover (no of times) 5.04 4.34
Gearing ratio (%) 33.28 38.62
Financial Highlights
Turnover vs. Turnover Growth
Turnover
Turnover Growth Rate
0
5,000
10,000
15,000
20,000
25,000
30,000
35,000
07/08 08/09 09/10 10/11 11/120
5
10
15
20
25
30
35
Rs. Mn. %
Operating Profit vs. Growth Rate
Operating Profit
Growth Rate
0
500
1,000
2,000
1,500
3,000
2,500
4,000
3,500
4,500
07/08 08/09 09/10 10/11 11/12(40)
(20)
0
20
40
60
80
100
Rs. Mn. %
EBT
Operating Profit vs. EBT vs. EAT
(500)
0
500
1,500
1,000
2,500
2,000
4,000
3,000
3,500
4,500
07/08 08/09 09/10 10/11 11/12
Operating Profit
EAT
Rs. Mn.
7 Richard Pieris and Company PLC | Annual Report 2011/2012
Name of the CompanyRichard Pieris and Company PLC
Legal FormA quoted public Company with limited liability, incorporated in
sri Lanka under the Companies ordinance no. 51 of 1938 on
11th May 1940. the Company registration number is
PQ 138.
Stock Exchange Listingthe ordinary shares of the Company are listed in the Colombo
stock exchange of sri Lanka.
Board of DirectorsDr. sena Yaddehige - Chairman/ Managing
Director/Ceo
Mr. J. H. Paul Ratnayeke - Director
Prof. Lakshman R. Watawala - Director
Prof. susantha D. Pathirana - Director
Mr. M. M. Udeshi - Director (Ceased to be a director
w.e.f. 30.06. 2011)
Mr. W. J. Viville. P. Perera - Director
Mr. s.s.G. Liyanage - Director (Appointed w.e.f.
27.01.2012)
Head/Registered Officeno. 310, High Level Road,
nawinna, Maharagama,
sri Lanka.
telephone : + (94) 114310500
Fax : + (94) 114310777
Website : www.arpico.com
e-mail : [email protected]
SecretariesRichard Pieris Group services (Private) Limited
no. 310, High Level Road,
nawinna, Maharagama,
sri Lanka.
Auditorsernst & Young
Chartered Accountants
no. 201, De saram Place,
Colombo 10,
sri Lanka.
BankersBank of Ceylon
Commercial Bank of Ceylon PLC
Deutsche Bank A G
DFCC Bank PLC
DFCC Vardhana Bank Limited
Hatton national Bank PLC
Hongkong & shanghai Banking Corporation PLC
Indian Bank
nations trust Bank PLC
nDB Bank PLC
PABC Bank PLC
People’s Bank
sampath Bank PLC
seylan Bank PLC
standard Chartered Bank
state Bank of India
Legal AdvisorsPaul Ratnayeke Associates
International Legal Consultants,
solicitors and Attorneys-at-Law,
no. 59, Gregory’s Road,
Colombo 7, sri Lanka.
nithya Partners
Attorneys-at-Law,
no. 97A, Galle Road, Colombo 3, sri Lanka.
Executive Management CommitteeDr. sena Yaddehige (Chairman)
Kumar Abeysinghe
Wasantha Abeysirigunawardena
Michael Andree
Jagath Dissanayake
thushara Hettithantrige
sunil Jayakoddy
Januka Jayanga
Ravi Liyanage
sunil Liyanage
Jayantha Perera
Viville Perera
Fabio Piccolo
sunil Poholiyadde
Pradeep samaratunge
niranjan Vithanage
Muditha Welihinda
Corporate Information
8 Richard Pieris and Company PLC | Annual Report 2011/2012
Chairman’s Review
It is my great honour to present to you the Annual Report and
Audited Financial statements of Richard Pieris and Company
PLC for the year ended 31st March 2012. As the Group steps in
to the 80th year of its existence, a fact that undoubtedly calls for
celebration, I am pleased to announce that during the financial
year under review the Group succeeded in achieving the highest
turnover and earnings in its history, giving us another reason to
celebrate.
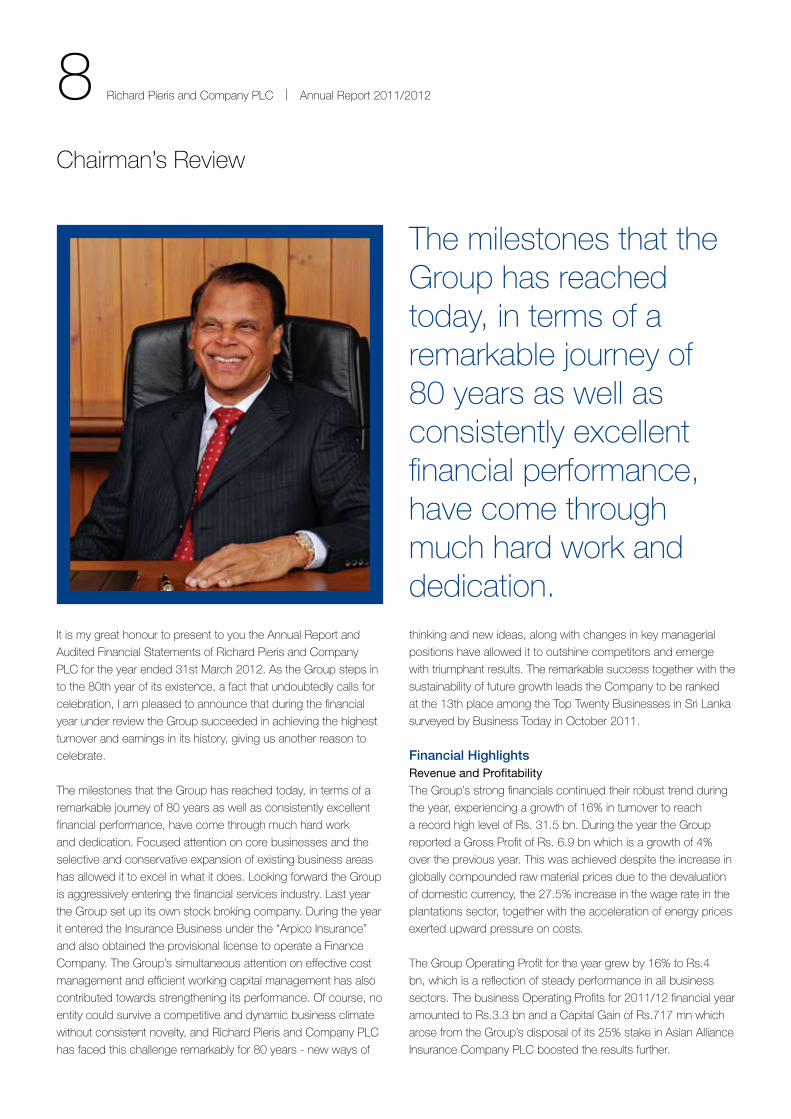
the milestones that the Group has reached today, in terms of a
remarkable journey of 80 years as well as consistently excellent
financial performance, have come through much hard work
and dedication. Focused attention on core businesses and the
selective and conservative expansion of existing business areas
has allowed it to excel in what it does. Looking forward the Group
is aggressively entering the financial services industry. Last year
the Group set up its own stock broking company. During the year
it entered the Insurance Business under the “Arpico Insurance”
and also obtained the provisional license to operate a Finance
Company. the Group’s simultaneous attention on effective cost
management and efficient working capital management has also
contributed towards strengthening its performance. of course, no
entity could survive a competitive and dynamic business climate
without consistent novelty, and Richard Pieris and Company PLC
has faced this challenge remarkably for 80 years - new ways of
thinking and new ideas, along with changes in key managerial
positions have allowed it to outshine competitors and emerge
with triumphant results. the remarkable success together with the
sustainability of future growth leads the Company to be ranked
at the 13th place among the top twenty Businesses in sri Lanka
surveyed by Business today in october 2011.
Financial HighlightsRevenue and Profitabilitythe Group’s strong financials continued their robust trend during
the year, experiencing a growth of 16% in turnover to reach
a record high level of Rs. 31.5 bn. During the year the Group
reported a Gross Profit of Rs. 6.9 bn which is a growth of 4%
over the previous year. this was achieved despite the increase in
globally compounded raw material prices due to the devaluation
of domestic currency, the 27.5% increase in the wage rate in the
plantations sector, together with the acceleration of energy prices
exerted upward pressure on costs.
the Group operating Profit for the year grew by 16% to Rs.4
bn, which is a reflection of steady performance in all business
sectors. the business operating Profits for 2011/12 financial year
amounted to Rs.3.3 bn and a Capital Gain of Rs.717 mn which
arose from the Group’s disposal of its 25% stake in Asian Alliance
Insurance Company PLC boosted the results further.
the milestones that the Group has reached today, in terms of a remarkable journey of 80 years as well as consistently excellent financial performance, have come through much hard work and dedication.
9 Richard Pieris and Company PLC | Annual Report 2011/2012
the profit before tax also grew by 18% to Rs. 3.3 bn. indicating
an outstanding achievement, profit after tax for the Group
reached Rs. 2.6 bn having grown at 20% and consequently, the
profit attributable to shareholders heightened significantly, at a
growth of 39%, to post Rs. 2.3 bn compared to Rs. 1.7 bn in the
previous financial year.
Assets and LiabilitiesWhile the Group’s health in terms of revenue and earnings
boosted, it was also successful in strengthening its asset-liability
and cash flow positions. total assets of the Group grew by 11%
to Rs. 23 bn, while total shareholder’s funds strengthened by
16% to reach Rs. 5.8 bn as at the year-end. Despite the Group
being engaged in continuous expansion of core business, its
strategy of funding expansion through internally generated funds
resulted in the reduction of borrowings by Rs. 500 mn to reach
Rs. 3.8 bn during the year. the gearing ratio also recorded a
positive change when it dropped from 39% to 33% during the
year, and it is expected that this will enhance the Group’s ability to
aggressively expand its current business portfolio.
In terms of liquidity, net Working Capital Investment of the Group
further improved by Rs. 942 mn to record a net working capital
position of Rs. 1.1 bn as at end of the year. the operational
cash position declined from of Rs. 2.9 bn to Rs. 2 bn, but it is
observed that such reduction is attributable to the increase in tax
payment due to increased profitability.
The Economic Climatethe sri Lankan economy succeeded in recording growth of
8.3% in 2011, which is highlighted as the second consecutive
achievement of over 8%. While the Industries and services
sub-sectors grew by 10.3% and 8.6% respectively, growth in
the Agricultural sector was only 1.5% compared to 7% of the
previous year, largely due to the adverse weather conditions that
persisted during the initial part of 2011. Along with the significant
expansion in the overall economy, the per capita income also
increased to UsD 2,836 during the year. the government
estimates this figure to improve to UsD 4,000 by 2016 - an
ambitious target which will nevertheless enhance the potential of
the entire economy, if achieved. High economic growth has also
resulted in the unemployment rate declining from 4.9% to 4.2%,
and despite the numerous development projects in the pipeline,
the government fiscal deficit reduced to 6.9% of Gross Domestic
Product compared to 8% in the previous year.
Annual average inflation measured by Colombo Consumer Price
Index increased marginally from 6.2% to 6.7% by December
2011, while point-to-point inflation stood at 4.9%. Hikes in global
commodity prices and devaluation of the domestic currency
resulted in further upward pressure on inflation during the final
quarter of the current financial year.
Monetary policy experienced considerable change during the
latter part of the year, largely due to two reasons: firstly, the
Return on Equity vs. Return on Capital Employed
ROE
ROCE
(20)
(10)
0
10
20
30
40
18(6
)
(10)
17
38
43
13
22
38
42
50
07/08 08/09 09/10 10/11 11/12
%
Group Performance
Turnover
Operational Profit
Profit attributable to Equityholders of Parent Company
(500)
4,500
9,500
14,500
19,500
24,500
29,500
34,500
07/08 08/09 09/10 10/11 11/12(500)
0
1,000
1,500
2,000
2,500
3,500
3,000
4,000
Rs. Mn. Rs. Mn.
500
10 Richard Pieris and Company PLC | Annual Report 2011/2012
Chairman’s Review Contd.
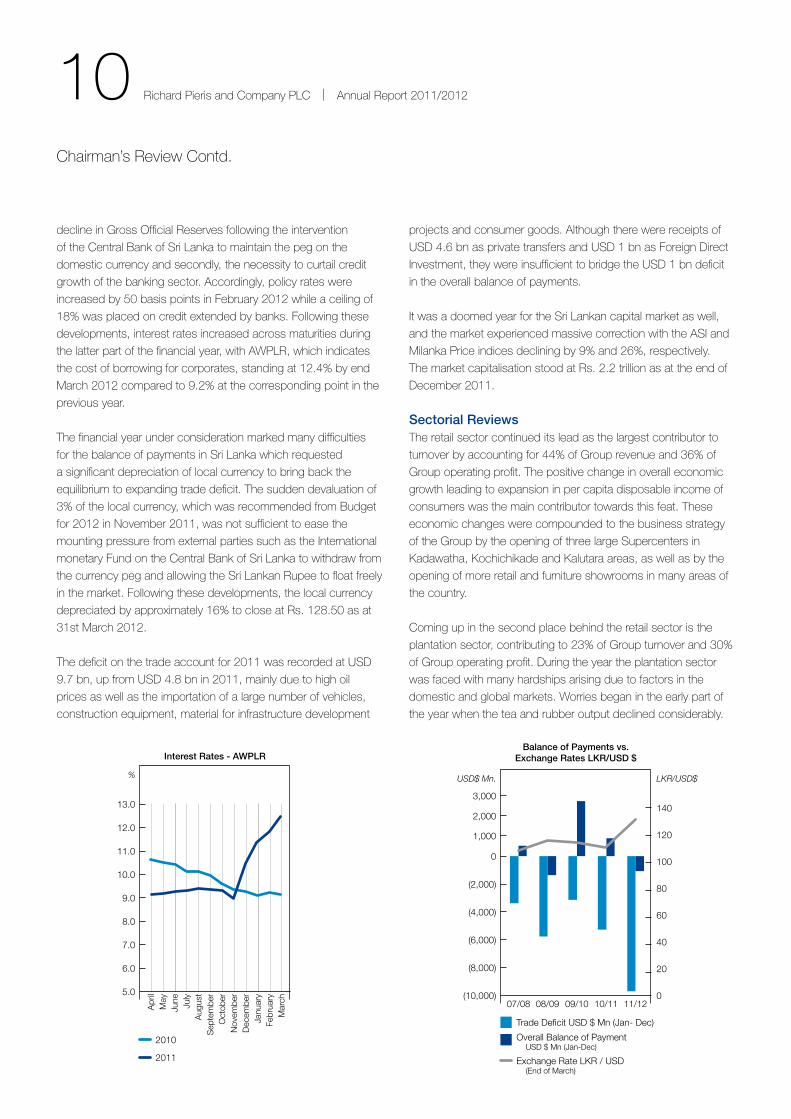
decline in Gross official Reserves following the intervention
of the Central Bank of sri Lanka to maintain the peg on the
domestic currency and secondly, the necessity to curtail credit
growth of the banking sector. Accordingly, policy rates were
increased by 50 basis points in February 2012 while a ceiling of
18% was placed on credit extended by banks. Following these
developments, interest rates increased across maturities during
the latter part of the financial year, with AWPLR, which indicates
the cost of borrowing for corporates, standing at 12.4% by end
March 2012 compared to 9.2% at the corresponding point in the
previous year.
the financial year under consideration marked many difficulties
for the balance of payments in sri Lanka which requested
a significant depreciation of local currency to bring back the
equilibrium to expanding trade deficit. the sudden devaluation of
3% of the local currency, which was recommended from Budget
for 2012 in november 2011, was not sufficient to ease the
mounting pressure from external parties such as the International
monetary Fund on the Central Bank of sri Lanka to withdraw from
the currency peg and allowing the sri Lankan Rupee to float freely
in the market. Following these developments, the local currency
depreciated by approximately 16% to close at Rs. 128.50 as at
31st March 2012.
the deficit on the trade account for 2011 was recorded at UsD
9.7 bn, up from UsD 4.8 bn in 2011, mainly due to high oil
prices as well as the importation of a large number of vehicles,
construction equipment, material for infrastructure development
projects and consumer goods. Although there were receipts of
UsD 4.6 bn as private transfers and UsD 1 bn as Foreign Direct
Investment, they were insufficient to bridge the UsD 1 bn deficit
in the overall balance of payments.
It was a doomed year for the sri Lankan capital market as well,
and the market experienced massive correction with the AsI and
Milanka Price indices declining by 9% and 26%, respectively.
the market capitalisation stood at Rs. 2.2 trillion as at the end of
December 2011.
Sectorial Reviewsthe retail sector continued its lead as the largest contributor to
turnover by accounting for 44% of Group revenue and 36% of
Group operating profit. the positive change in overall economic
growth leading to expansion in per capita disposable income of
consumers was the main contributor towards this feat. these
economic changes were compounded to the business strategy
of the Group by the opening of three large supercenters in
Kadawatha, Kochichikade and Kalutara areas, as well as by the
opening of more retail and furniture showrooms in many areas of
the country.
Coming up in the second place behind the retail sector is the
plantation sector, contributing to 23% of Group turnover and 30%
of Group operating profit. During the year the plantation sector
was faced with many hardships arising due to factors in the
domestic and global markets. Worries began in the early part of
the year when the tea and rubber output declined considerably.
Interest Rates - AWPLR
2010
2011
5.0
6.0
7.0
8.0
9.0
10.0
11.0
12.0
13.0
Apr
ilM
ayJu
neJu
lyA
ugus
tS
epte
mbe
rO
ctob
erN
ovem
ber
Dec
embe
rJa
nuar
yFe
brua
ryM
arch
%
Balance of Payments vs. Exchange Rates LKR/USD $
Trade Deficit USD $ Mn (Jan- Dec)
Overall Balance of Payment USD $ Mn (Jan-Dec)
Exchange Rate LKR / USD (End of March)
(10,000)
(8,000)
(6,000)
(4,000)
2,000
1,000
3,000
07/08 08/09 09/10 10/11 11/120
20
40
60
80
100
120
140
USD$ Mn. LKR/USD$
(2,000)
0
11 Richard Pieris and Company PLC | Annual Report 2011/2012
the wage hike of 27.5% following the collective agreement
led to high costs, which affected the bottom line of the Group
by approximately Rs. 247 mn due to the revision of gratuity
provision. In addition, the industry also had to face declining
demand from the Middle eastern countries due to political
uncertainties in their own economies, which resulted in lower
sales.
Meanwhile, contribution from the plastics sector was 16% and
17% of Group revenue and operating profit, respectively. this
sector was able to successfully record a turnover of Rs. 4.9 bn,
growing by 29% over the previous year’s revenue, largely
assisted by the booming construction industry, expansion in the
distribution network as well as the Group’s focus on new product
development, especially the formulation of the Green Gas
Concept.
the tyre sector remained consistent in its performance,
contributing to 9% of Group turnover and 7% of Group operating
profit. Further, the rubber sector, which accounted for 8% of
Group turnover, improved its profitability by 665% and contributed
to 3% of Group operating profit, due to the cumulative effects of
the depreciation of the local currency, lower rubber prices, new
market/product development and efficient cost management.
the services sector accounted for 6% of the Group’s operating
profit, mainly supported by the capital gains realized upon the
disposal of the Group’s stake in Asian Alliance Insurance PLC,
which accounted for Rs. 516 mn.
Special AchievementsAt this historic juncture of marking its 80th anniversary, the Group
invested in its latest business venture, life insurance, under the
name of Arpico Insurance Limited, which has performed well
above expectation during its short lifespan. the Group’s stock
broking arm and wealth management companies also blossomed
during the year as start-up companies.
Indicating yet another landmark in its endeavours, the Group
has already secured a provisional license to open a new finance
company, the operations of which will commence during the
financial year 2012/13. With this new advent, the Group will
strengthen its presence in the finance sector, and will be able to
provide all types of financial solutions to its customers.
Future OutlookAs a Group of companies with a marked presence in a diverse
range of businesses, we are optimistic of the future that the sri
Lankan economy holds. the direction of the economy and the
large scale infrastructure developments will enhance its potential,
yielding many benefits to all stakeholders, and we are geared to
reap such benefits.
As personal disposable income increases, we believe that our
retail sector will perform well; thus, we expect to allocate more
funds for the expansion of our retail sector in the coming years.
With the depreciation of the local currency and the smooth
recovery of Western economies, the plantation sector is likely to
benefit, although production costs would remain a main concern
for the tea sub-sector. We also recognise that there is potential
for renewable energy sources in sri Lanka, and we anticipate
securing the land and the permit necessary for a solar power
generation project.
We as a Group also envisage building profitable relationships
with foreign partners to expand our plantations sector to global
markets. With this purpose in mind, we have already commenced
dialogues with regulatory bodies of some countries, and we
remain optimistic of the outcome of such discussions.
DividendsDuring the year, the Group declared and paid an interim
dividend of Rs. 0.40 in December and Rs. 0.30 in March. these
aggregate to Rs. 0.70 for the financial year 2011/12, constituting
a dividend yield of 9% as at the year end.
Conclusionno achievement of the Group would have been possible if
not for the continued commitment and dedication of our many
stakeholders. My sincerest gratitude is therefore offered to
the management team, employees, suppliers, customers
and business partners who have all contributed in many ways
towards making this year victorious. My special thanks also go
out to Mr. M.M. Udeshi, my co-director, who resigned during the
year. I welcome to the Board our new director Mr. sunil Liyanage,
Managing Director of the plastic sector, who has worked for over
35 years in the Group.
together, we all will make the coming year more victorious than
the year that passed.
Dr. Sena YaddehigeChairman/CEO/MD
24th May 2012
12 Richard Pieris and Company PLC | Annual Report 2011/2012
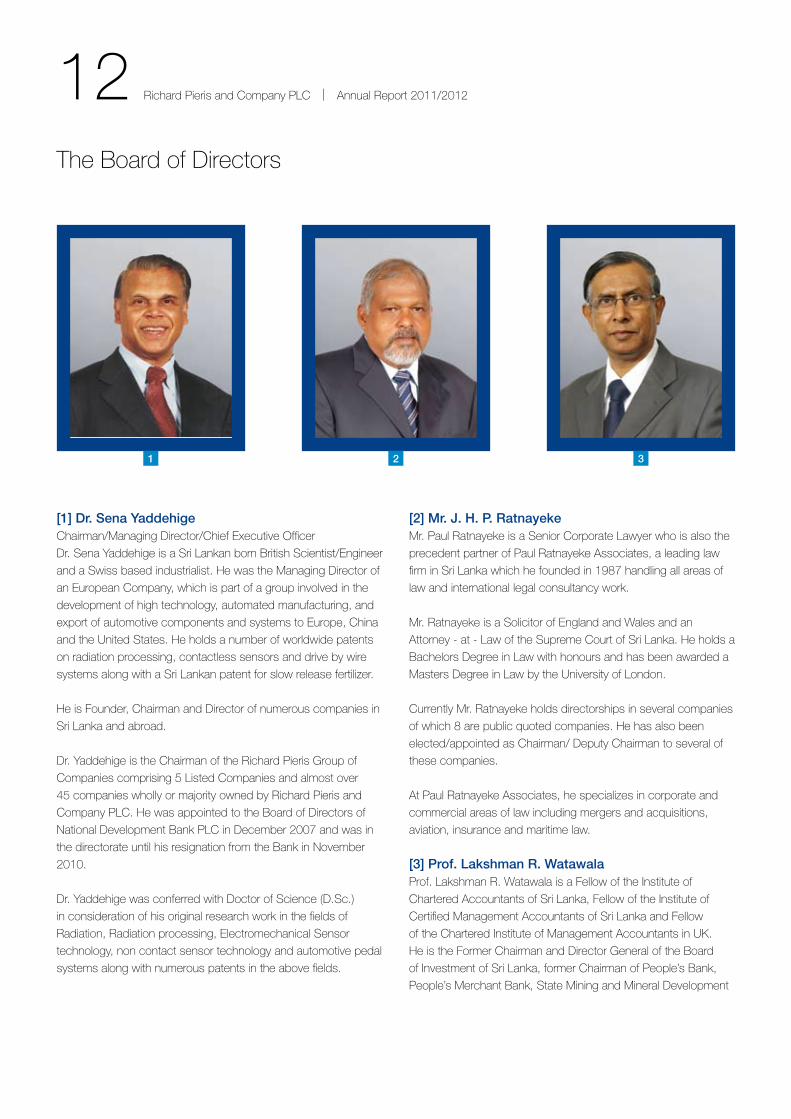
[1] Dr. Sena YaddehigeChairman/Managing Director/Chief executive officer
Dr. sena Yaddehige is a sri Lankan born British scientist/engineer
and a swiss based industrialist. He was the Managing Director of
an european Company, which is part of a group involved in the
development of high technology, automated manufacturing, and
export of automotive components and systems to europe, China
and the United states. He holds a number of worldwide patents
on radiation processing, contactless sensors and drive by wire
systems along with a sri Lankan patent for slow release fertilizer.
He is Founder, Chairman and Director of numerous companies in
sri Lanka and abroad.
Dr. Yaddehige is the Chairman of the Richard Pieris Group of
Companies comprising 5 Listed Companies and almost over
45 companies wholly or majority owned by Richard Pieris and
Company PLC. He was appointed to the Board of Directors of
national Development Bank PLC in December 2007 and was in
the directorate until his resignation from the Bank in november
2010.
Dr. Yaddehige was conferred with Doctor of science (D.sc.)
in consideration of his original research work in the fields of
Radiation, Radiation processing, electromechanical sensor
technology, non contact sensor technology and automotive pedal
systems along with numerous patents in the above fields.
the Board of Directors
[2] Mr. J. H. P. RatnayekeMr. Paul Ratnayeke is a senior Corporate Lawyer who is also the
precedent partner of Paul Ratnayeke Associates, a leading law
firm in sri Lanka which he founded in 1987 handling all areas of
law and international legal consultancy work.
Mr. Ratnayeke is a solicitor of england and Wales and an
Attorney - at - Law of the supreme Court of sri Lanka. He holds a
Bachelors Degree in Law with honours and has been awarded a
Masters Degree in Law by the University of London.
Currently Mr. Ratnayeke holds directorships in several companies
of which 8 are public quoted companies. He has also been
elected/appointed as Chairman/ Deputy Chairman to several of
these companies.
At Paul Ratnayeke Associates, he specializes in corporate and
commercial areas of law including mergers and acquisitions,
aviation, insurance and maritime law.
[3] Prof. Lakshman R. WatawalaProf. Lakshman R. Watawala is a Fellow of the Institute of
Chartered Accountants of sri Lanka, Fellow of the Institute of
Certified Management Accountants of sri Lanka and Fellow
of the Chartered Institute of Management Accountants in UK.
He is the Former Chairman and Director General of the Board
of Investment of sri Lanka, former Chairman of People’s Bank,
People’s Merchant Bank, state Mining and Mineral Development
1 2 3
13 Richard Pieris and Company PLC | Annual Report 2011/2012
Corporation and the Ceylon Leather Products Corporation,
currently a Committee Member of the Ceylon Chamber of
Commerce. He is also President of the Institute of Certified
Management Accountants-sri Lanka. Past President of the
Institute of Chartered Accountants of sri Lanka and south Asian
Federation of Accountants, Founder President of AAt sri Lanka
and Past President- organisation of Professional Associations
of sri Lanka. He also serves on the Board of Directors of several
public listed companies.
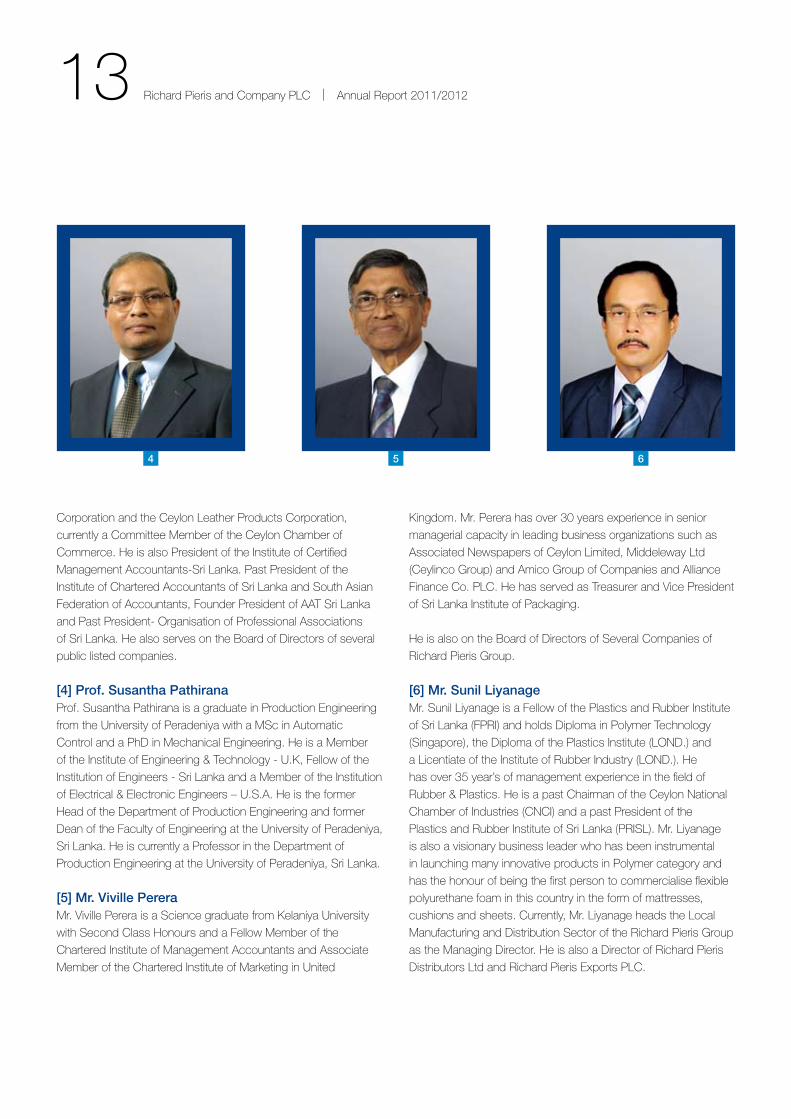
[4] Prof. Susantha PathiranaProf. susantha Pathirana is a graduate in Production engineering
from the University of Peradeniya with a Msc in Automatic
Control and a PhD in Mechanical engineering. He is a Member
of the Institute of engineering & technology - U.K, Fellow of the
Institution of engineers - sri Lanka and a Member of the Institution
of electrical & electronic engineers – U.s.A. He is the former
Head of the Department of Production engineering and former
Dean of the Faculty of engineering at the University of Peradeniya,
sri Lanka. He is currently a Professor in the Department of
Production engineering at the University of Peradeniya, sri Lanka.
[5] Mr. Viville Perera Mr. Viville Perera is a science graduate from Kelaniya University
with second Class Honours and a Fellow Member of the
Chartered Institute of Management Accountants and Associate
Member of the Chartered Institute of Marketing in United
Kingdom. Mr. Perera has over 30 years experience in senior
managerial capacity in leading business organizations such as
Associated newspapers of Ceylon Limited, Middeleway Ltd
(Ceylinco Group) and Amico Group of Companies and Alliance
Finance Co. PLC. He has served as treasurer and Vice President
of sri Lanka Institute of Packaging.
He is also on the Board of Directors of several Companies of
Richard Pieris Group.
[6] Mr. Sunil LiyanageMr. sunil Liyanage is a Fellow of the Plastics and Rubber Institute
of sri Lanka (FPRI) and holds Diploma in Polymer technology
(singapore), the Diploma of the Plastics Institute (LonD.) and
a Licentiate of the Institute of Rubber Industry (LonD.). He
has over 35 year’s of management experience in the field of
Rubber & Plastics. He is a past Chairman of the Ceylon national
Chamber of Industries (CnCI) and a past President of the
Plastics and Rubber Institute of sri Lanka (PRIsL). Mr. Liyanage
is also a visionary business leader who has been instrumental
in launching many innovative products in Polymer category and
has the honour of being the first person to commercialise flexible
polyurethane foam in this country in the form of mattresses,
cushions and sheets. Currently, Mr. Liyanage heads the Local
Manufacturing and Distribution sector of the Richard Pieris Group
as the Managing Director. He is also a Director of Richard Pieris
Distributors Ltd and Richard Pieris exports PLC.
4 5 6

14 Richard Pieris and Company PLC | Annual Report 2011/2012
RUBBER
PLANTATION
TYRE
oUR BUsIness
Product Portfolio

15 Richard Pieris and Company PLC | Annual Report 2011/2012
SERVICE AND OTHER
RETAIL
PLASTIC

16 Richard Pieris and Company PLC | Annual Report 2011/2012
sector Review - Retail
Retailthe Arpico Privilege Card customer base continued to grow with its membership increasing to approximately 210,000 by the end of the year.
The Product Portfolio: Fast Moving Consumer Goods including Food, Household Goods, Apparel, Furniture & electronics

17 Richard Pieris and Company PLC | Annual Report 2011/2012
18 Richard Pieris and Company PLC | Annual Report 2011/2012
the Retail sector operates the Arpico supercentres, superstores
and a network of showrooms including furniture outlets, and also
provides interior decorating solutions for institutions. During recent
times this sector has been a key growth oriented arm of the
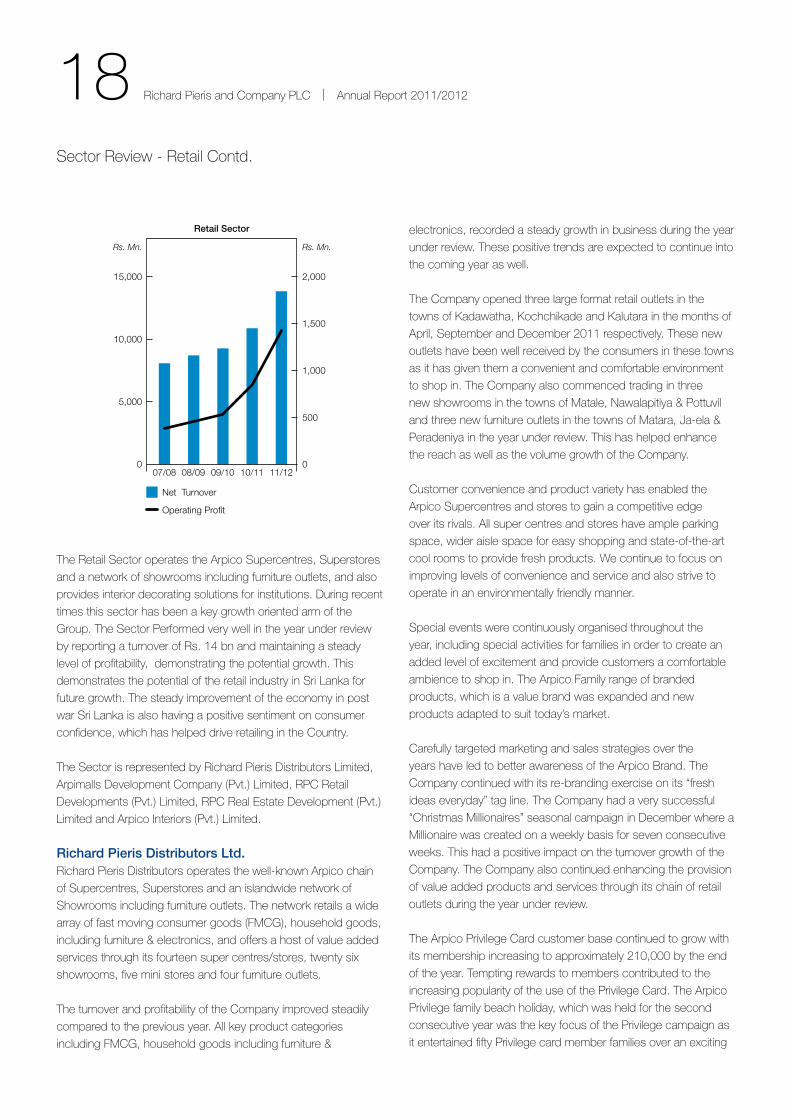
Group. the sector Performed very well in the year under review
by reporting a turnover of Rs. 14 bn and maintaining a steady
level of profitability, demonstrating the potential growth. this
demonstrates the potential of the retail industry in sri Lanka for
future growth. the steady improvement of the economy in post
war sri Lanka is also having a positive sentiment on consumer
confidence, which has helped drive retailing in the Country.
the sector is represented by Richard Pieris Distributors Limited,
Arpimalls Development Company (Pvt.) Limited, RPC Retail
Developments (Pvt.) Limited, RPC Real estate Development (Pvt.)
Limited and Arpico Interiors (Pvt.) Limited.
Richard Pieris Distributors Ltd.Richard Pieris Distributors operates the well-known Arpico chain
of supercentres, superstores and an islandwide network of
showrooms including furniture outlets. the network retails a wide
array of fast moving consumer goods (FMCG), household goods,
including furniture & electronics, and offers a host of value added
services through its fourteen super centres/stores, twenty six
showrooms, five mini stores and four furniture outlets.
the turnover and profitability of the Company improved steadily
compared to the previous year. All key product categories
including FMCG, household goods including furniture &
electronics, recorded a steady growth in business during the year
under review. these positive trends are expected to continue into
the coming year as well.
the Company opened three large format retail outlets in the
towns of Kadawatha, Kochchikade and Kalutara in the months of
April, september and December 2011 respectively. these new
outlets have been well received by the consumers in these towns
as it has given them a convenient and comfortable environment
to shop in. the Company also commenced trading in three
new showrooms in the towns of Matale, nawalapitiya & Pottuvil
and three new furniture outlets in the towns of Matara, Ja-ela &
Peradeniya in the year under review. this has helped enhance
the reach as well as the volume growth of the Company.
Customer convenience and product variety has enabled the
Arpico supercentres and stores to gain a competitive edge
over its rivals. All super centres and stores have ample parking
space, wider aisle space for easy shopping and state-of-the-art
cool rooms to provide fresh products. We continue to focus on
improving levels of convenience and service and also strive to
operate in an environmentally friendly manner.
special events were continuously organised throughout the
year, including special activities for families in order to create an
added level of excitement and provide customers a comfortable
ambience to shop in. the Arpico Family range of branded
products, which is a value brand was expanded and new
products adapted to suit today’s market.
Carefully targeted marketing and sales strategies over the
years have led to better awareness of the Arpico Brand. the
Company continued with its re-branding exercise on its “fresh
ideas everyday” tag line. the Company had a very successful
“Christmas Millionaires” seasonal campaign in December where a
Millionaire was created on a weekly basis for seven consecutive
weeks. this had a positive impact on the turnover growth of the
Company. the Company also continued enhancing the provision
of value added products and services through its chain of retail
outlets during the year under review.
the Arpico Privilege Card customer base continued to grow with
its membership increasing to approximately 210,000 by the end
of the year. tempting rewards to members contributed to the
increasing popularity of the use of the Privilege Card. the Arpico
Privilege family beach holiday, which was held for the second
consecutive year was the key focus of the Privilege campaign as
it entertained fifty Privilege card member families over an exciting
sector Review - Retail Contd.
Retail Sector
Net Turnover
Operating Profit
0
5,000
10,000
15,000
07/08 08/09 09/10 10/11 11/120
500
1,000
1,500
2,000
Rs. Mn. Rs. Mn.
19 Richard Pieris and Company PLC | Annual Report 2011/2012
weekend in a luxurious hotel. this was very well appreciated
by all participants thus enhancing the commitment towards the
loyalty programme.
the focus on cost management programmes has enabled the
retail operation to run efficiently keeping expenses well within
budgeted proportions while continuing to improve the quality of its
products and services. the constant development of the supply
chain has helped enhance the capability of selling a wide range
of high quality products at competitive prices.
the training academy at nawinna, which opened three years ago,
continued to provide training to all the employees thus improving
efficiency and customer service.
the selective expansion of its chain of supercentres/stores in
targeted areas of the country will continue, capitalising on the
post war economic boom that is expected in the ensuing years.
Arpimalls Development Company (Pvt.) Ltd.Arpimalls Development Company owns the two large Arpico
supercentres in Battaramulla and Dehiwela operated by Richard
Pieris Distributors Ltd. the company continued its profitable
record during the year under review.
RPC Retail Developments (Pvt.) Ltd.RPC Retail Developments owns the two large Arpico
supercentres in negombo and Kadawatha and has continued
recording profits in the year under review.
RPC Real Estate Development (Pvt.) Ltd.RPC Real estate Development owns the Arpico supercentre in
Kandy. the Company also continued its profit making record in
the year under review.
Arpico Interiors (Pvt) Ltd. Arpico Interiors provides institutional and corporate customers in
both the public and private sectors and the discerning individual
customers with comprehensive services in interior decorating
solutions. over the years, Arpico Interiors has built up a strong
reputation as a provider of interior décor solutions and supplier
of state of the art and purpose built furniture. It focuses on
projects for hotels, apartments, hospitals, factories and offices
and residences, from concept planning to complete turnkey
solutions. the products are of high quality, sourced from reputed
local manufacturers as well as those of personally handpicked
suppliers from U.s.A, europe, Dubai, China and Malaysia. Its
wide range of products, are on display at the Interior Décor
showroom at Hyde Park Corner. the Company continues to
maintain its market share despite the slow recovery from the
global economic slowdown which had a significant impact on
the construction industry and the institutional sector in particular.
the impact on its profitability was further compounded by the
increasing cost of import duties and taxes. Consequently, the
plans to introduce high-end items to its product portfolio have
now been successfully launched since market conditions have
become more favourable. Arpico Interiors, while continuing to
adopt a cautious approach during the coming year, is confident of
improving its profitability, with the recovery of economic activities.
the company has drawn up plans to meet the opportunities
of the coming year with increased offerings of a wider range of
products and services.

20 Richard Pieris and Company PLC | Annual Report 2011/2012
sector Review - Plantations
Plantationthe three Plantation Companies namely Kegalle, namunukula and Maskeliya Plantations, together produced 12.8 mn kg of tea, 5.5 mn kg of Rubber and 14.4 mn kg of oil Palm with a total revenue generation of Rs. 7.2 bn to the Group.
The Product Portfolio: Leasehold ownership & Management of tea, Rubber, oil Palm, Coconut Plantations and Branded tea
21 Richard Pieris and Company PLC | Annual Report 2011/2012
22 Richard Pieris and Company PLC | Annual Report 2011/2012
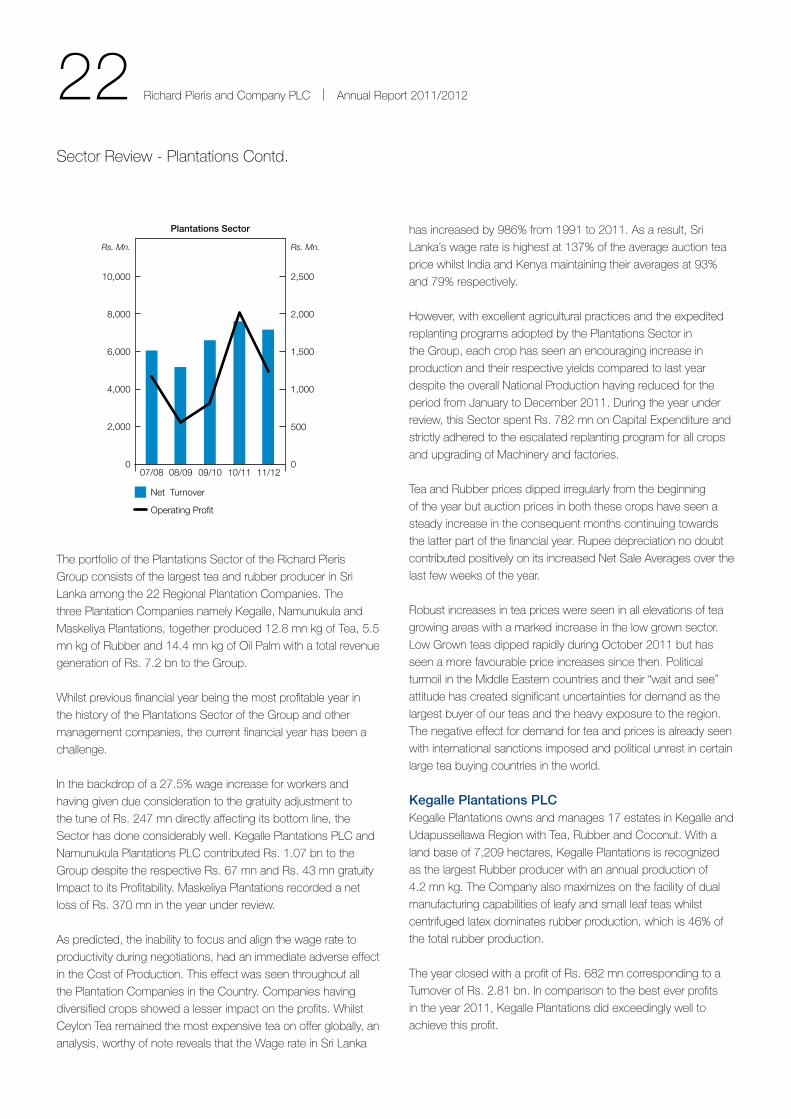
the portfolio of the Plantations sector of the Richard Pieris
Group consists of the largest tea and rubber producer in sri
Lanka among the 22 Regional Plantation Companies. the
three Plantation Companies namely Kegalle, namunukula and
Maskeliya Plantations, together produced 12.8 mn kg of tea, 5.5
mn kg of Rubber and 14.4 mn kg of oil Palm with a total revenue
generation of Rs. 7.2 bn to the Group.
Whilst previous financial year being the most profitable year in
the history of the Plantations sector of the Group and other
management companies, the current financial year has been a
challenge.
In the backdrop of a 27.5% wage increase for workers and
having given due consideration to the gratuity adjustment to
the tune of Rs. 247 mn directly affecting its bottom line, the
sector has done considerably well. Kegalle Plantations PLC and
namunukula Plantations PLC contributed Rs. 1.07 bn to the
Group despite the respective Rs. 67 mn and Rs. 43 mn gratuity
Impact to its Profitability. Maskeliya Plantations recorded a net
loss of Rs. 370 mn in the year under review.
As predicted, the inability to focus and align the wage rate to
productivity during negotiations, had an immediate adverse effect
in the Cost of Production. this effect was seen throughout all
the Plantation Companies in the Country. Companies having
diversified crops showed a lesser impact on the profits. Whilst
Ceylon tea remained the most expensive tea on offer globally, an
analysis, worthy of note reveals that the Wage rate in sri Lanka
has increased by 986% from 1991 to 2011. As a result, sri
Lanka’s wage rate is highest at 137% of the average auction tea
price whilst India and Kenya maintaining their averages at 93%
and 79% respectively.
However, with excellent agricultural practices and the expedited
replanting programs adopted by the Plantations sector in
the Group, each crop has seen an encouraging increase in
production and their respective yields compared to last year
despite the overall national Production having reduced for the
period from January to December 2011. During the year under
review, this sector spent Rs. 782 mn on Capital expenditure and
strictly adhered to the escalated replanting program for all crops
and upgrading of Machinery and factories.
tea and Rubber prices dipped irregularly from the beginning
of the year but auction prices in both these crops have seen a
steady increase in the consequent months continuing towards
the latter part of the financial year. Rupee depreciation no doubt
contributed positively on its increased net sale Averages over the
last few weeks of the year.
Robust increases in tea prices were seen in all elevations of tea
growing areas with a marked increase in the low grown sector.
Low Grown teas dipped rapidly during october 2011 but has
seen a more favourable price increases since then. Political
turmoil in the Middle eastern countries and their “wait and see”
attitude has created significant uncertainties for demand as the
largest buyer of our teas and the heavy exposure to the region.
the negative effect for demand for tea and prices is already seen
with international sanctions imposed and political unrest in certain
large tea buying countries in the world.
Kegalle Plantations PLCKegalle Plantations owns and manages 17 estates in Kegalle and
Udapussellawa Region with tea, Rubber and Coconut. With a
land base of 7,209 hectares, Kegalle Plantations is recognized
as the largest Rubber producer with an annual production of
4.2 mn kg. the Company also maximizes on the facility of dual
manufacturing capabilities of leafy and small leaf teas whilst
centrifuged latex dominates rubber production, which is 46% of
the total rubber production.
the year closed with a profit of Rs. 682 mn corresponding to a
turnover of Rs. 2.81 bn. In comparison to the best ever profits
in the year 2011, Kegalle Plantations did exceedingly well to
achieve this profit.
sector Review - Plantations Contd.
Plantations Sector
Net Turnover
Operating Profit
0
2,000
4,000
6,000
8,000
10,000
07/08 08/09 09/10 10/11 11/120
500
1,000
1,500
2,500
2,000
Rs. Mn. Rs. Mn.
23 Richard Pieris and Company PLC | Annual Report 2011/2012
Main crop being Rubber, the Company closed yet another
successful year with 4,155 kg in production and Rs. 1,865 mn in
terms of revenue. this denotes a 10% decrease in comparison
to that of the last year. tea profitability declined with its high cost
of production and inclement weather with a turnover of Rs. 783
mn mainly in the Udapussallawa region, corresponding 13.8%
decrease with that of the last year. Coconut production was
higher than the previous year and contributed Rs. 43 mn to the
Company’s turnover.
Kegalle Plantations invested Rs. 250 mn as capital expenditure
in the year under review 34 hectares of tea were replanted
at a cost of Rs. 43 mn, whilst 248 hectares of Rubber was
replanted expending Rs. 145 mn. Capital expenditure on factory
development for the year amounted to Rs. 19 mn. Affluent
water treatment plant was constructed in etana estate and rain
guarding in 739 hectares of Rubber were carried out during the
year under review.
Kegalle Plantations own 5,374 hectares of both mature and
immature Rubber plantations. out of which, 3,653 hectares
are in the mature fields with yields ranging from 1,000 kg/ha to
1,250 kg/ha. 248 hectares of high yielding clones of rubber were
replanted during the year, under the guidance of the Rubber
Research Institute whilst removing the unproductive and old
fields.
All five tea factories in the Company, Luckyland, Kirklees,
Gampaha, Doteloya and Yataderiya estates producing almost
3 mn kg obtained Iso 22000:2005 certification for Food safety
Management system during the year.
Udapussallawa region Luckyland, Gampaha and Kirklees estates
fetched 66 top tea prices for BoPsp, BoP, BoPF and oP
grades although tea growth and yields were hampered by the
drought, throughout the year. Dual Manufacturing systems in
this region aided the best manufacturing mix to maximize on the
demand patterns.
Namunukula Plantations PLCnamunukula Plantations PLC comprises of 13 estates with
Rubber, tea, oil Palm, Coconut and Cinnamon with a total extent
of 7,482 Hectares and is the most diversified Plantation Company
in the Group. out of the original extent of this Plantation, 115
hectares were acquired for the southern Highway construction.
this Plantation Company owns 2,365 hectares of Rubber, 497
hectares of tea, 1,442 hectares of oil Palm, and 522 hectares
for other crops.
the Company recorded a Rs. 1,863 mn turnover and a profit
of Rs. 331 mn, and in comparison to last year, corresponds to
a 10.22% and 7.8% decrease respectively. out of the Revenue

24 Richard Pieris and Company PLC | Annual Report 2011/2012
39% was generated from tea whilst 39.6%,19.5% & 1.9% were
contributed by Rubber, oil Palm and other Crops respectively.
As in the past, the Company efficiently managed the bought
leaf operation as 81% of the tea represents this segment. the
Company actively and rigorously pursued its endeavours to
enhance the bought leaf operation. However, its bought leaf
quantity decreased from 10 mn kg to 8.1 mn kg in comparison
to last financial year. Low Grown teas commenced the year with
uncertain and unsettled prices in comparison to the period in the
previous year. even during the July to september quarter, Low
grown prices continued to dip, plagued with the Wage increase
and continued to incur losses. erratic weather patterns not only
hampered the plucking rounds but also made the quality of the
tea irregular. However, by november, a clear escalation of low
grown prices was seen at the Colombo tea Auctions despite the
debt crisis in the european region.
Rubber being the second largest crop and next to oil Palm, saw
yet another successful year with high prices from the beginning of
April till the latter part of 2011.
During the year namunukula Plantations replanted 69 hectares
of Rubber new clearings. 123 hectares of oil palm were planted
according to the expedited capital program, which covered both
new and replanting schedules. Rs. 250 mn was spent on Capital
expenditure during the year under review. Baddegama estate
tea Factory was renovated and expanded to capture increased
quantities of bought leaf in the area and was fully operational by
April 2012. Rs. 52 mn was spent on this expansion.
out of the tea factories, whilst Baddegama Factory has already
obtained Iso 22000 Certification for Food and safety system,
5 more tea Factories namely Walpita, tennahena, Belmont,
Akuressa and Pelawatte are already in the process of obtaining
this certification and is expected to be finalized during 2012.
the Company’s oil Palm Processing joint venture, Aen Palm oil
Processing Limited continued to operate successfully thereby
securing high prices for the fresh fruit bunches for processing.
the Company is well positioned to reap the benefits of 1,442
hectares of cultivated oil palm out of which 1,106 hectares are in
bearing. expedited cultivation of this crop in the areas of Kalutara,
Galle and Matara areas will see yet another 199 hectares being
planted by the end of 2013 together with 23 hectares of Coconut
and 25 hectares of Cinnamon being planted during the year
under review.
Maskeliya Plantations PLCMaskeliya Plantations PLC is the only Plantation with only high
grown tea as their crop and situated in Western High elevation
in sri Lanka. the Company has, in its possession, 18 estates
with a total extent of 10,560 hectares at four different elevations.
this is after amalgamation of three estates to existing estates to
bring about economies of scale. World renowned for its exclusive
quality of tea, the Company went through a rough year with a loss
of Rs. 441 mn for the year under review. the main contributor to
this loss was the 27.5% wage hike, which plagued the Company
with a Rs. 136 mn Gratuity Impact, being in a labour intensive set
up such as this.
the year commenced with large quantities of tea on offer at the
Colombo tea Auctions. the momentum for High Grown teas
were maintained at reasonable levels in the wake of the pending
wage negotiations. the trend did not continue as seen in the
previous years when the euro crisis and Middle eastern unrest
continued to plague the high-end teas on offer.
Maskeliya Plantations PLC produced 9.2 mn kg of tea during the
year and is a marginal increase in comparison to last year despite
the fact that statistics show a national drop in tea production.
total revenue of the Company was Rs. 3.1 bn for the year, an
decrease of 6% from previous period. the Company maintained
its high standards to maintain its reputation as the best high
grown tea producer and fetched 139 top prices during the year
for Brunswick, Laxapana, Moray and Craig estates. Productivity
related parameters such as plucking norms were enhanced
at estate level to somewhat reduce the exorbitant cost of
production.
Gross sale Average price per kg was maintained at Rs. 339 per
kg which is a 6% decrease from the previous year.
the Company spent Rs. 296 mn on Capital expenditure
out of which Rs. 193 mn was spent on replanting. the Dual
Manufacturing systems, which enables both low grown and small
leaf manufacture were implemented in Poonagala, st. Clair’s,
Ampitikanda and Craig estates with expenditure on a capital
amounting to Rs. 61.2 mn, in the form of factory upgrading.
sector Review - Plantations Contd.
25 Richard Pieris and Company PLC | Annual Report 2011/2012
All fourteen factories of the Company continued their certification
on “ethical tea Partnership UK” and twelve of those have
obtained Iso 22000 (Food and safety system Certification). the
four estates with the Fair trade Labeling organisation Certificate
continued to maintain the status.
Maskeliya Tea Gardens Ceylon LtdMaskeliya tea Gardens’ flagship brand “st. Clair’s” yet again
posted an impressive growth, establishing record turnover and
profitability levels for the year under review, negating the previous
financial year’s poor performance, and showing a positive
revenue reserve at the close of the year under review. Marketing
top quality Pure Ceylon tea globally as well as locally, st. Clair’s
continued to offer a wide range of teas from orthodox black leafy
teas to flavoured teas in tea bags through to gift items. over the
years st. Clair’s products have established a reputation for their
outstanding quality, offering an uncompromising approach to
showcase quality and style.
Maskeliya tea Gardens focused its attention on strengthening
its presence in Russia by increasing st. Clair’s’ marketing and
promotional activities and broadening the product depth and
width, showcasing these at the Russian food and beverage
exposition in February 2012. new products and innovative
concepts have increased the brand visibility and a marked
increase in sales has strengthened the brand’s presence in
Russia.
Favourable market conditions in the Russian Federation and the
Central Asian Republics have opened up new possibilities in what
is otherwise very closed markets. negotiations are underway with
distributors in Belarus and Lithuania in establishing st. Clair’s in
those countries.
Posting a reasonable turnover, the st. Clair’s tea Center at
talawakelle continues to attract a wide range of local and foreign
tourists, offering them a very refreshing stop-over and a tantalizing
product range of tea items, bundled with service par-excellence
and old-world charm.
Maskeliya tea Gardens has taken upon itself an optimistic target
in terms of turnover for the next financial year and is confident that
with its aggressive push in both the export and local fields, these
large targets can be met.
26 Richard Pieris and Company PLC | Annual Report 2011/2012
sector Review - tyre
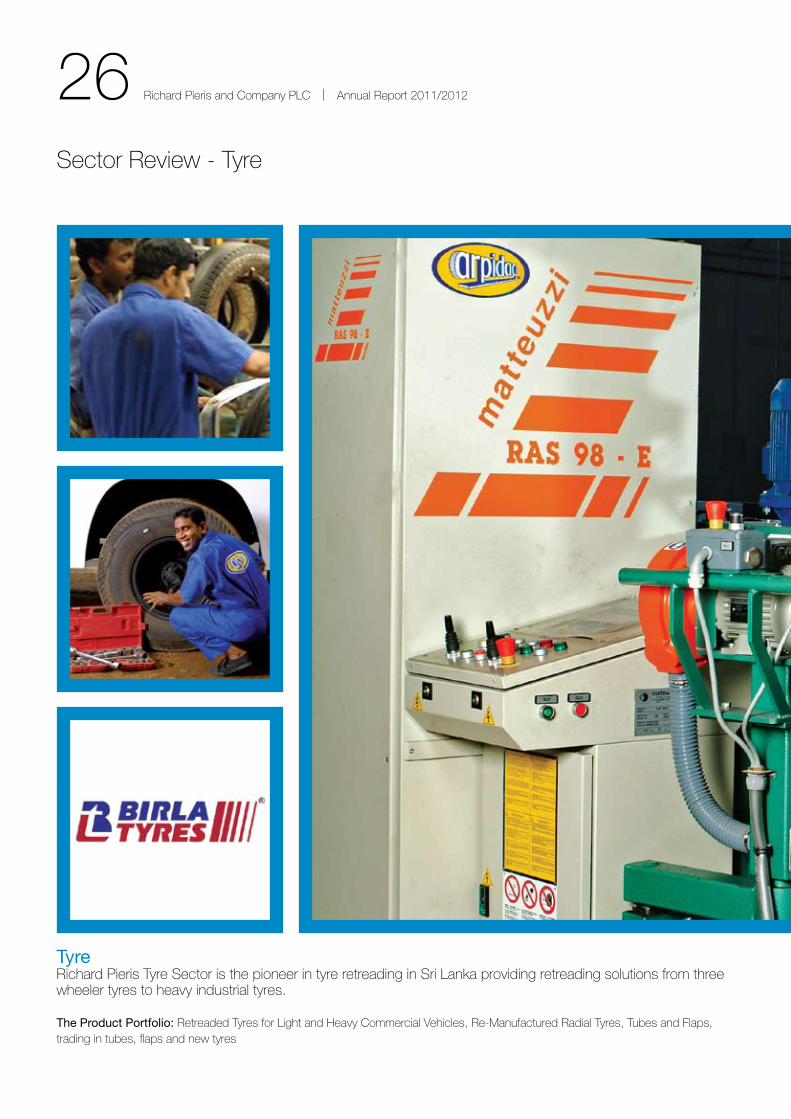
TyreRichard Pieris tyre sector is the pioneer in tyre retreading in sri Lanka providing retreading solutions from three wheeler tyres to heavy industrial tyres.
The Product Portfolio: Retreaded tyres for Light and Heavy Commercial Vehicles, Re-Manufactured Radial tyres, tubes and Flaps, trading in tubes, flaps and new tyres
27 Richard Pieris and Company PLC | Annual Report 2011/2012
28 Richard Pieris and Company PLC | Annual Report 2011/2012
Richard Pieris tyre sector is the pioneer in tyre retreading in sri
Lanka providing retreading solutions from three wheeler tyres
to heavy industrial tyres. Being the market leader for retreading
tyres the Company indirectly contributes to the national economy
by decreasing transport costs and outflow of foreign exchange
on imported tyres. this also immensely helps the reduction in
damage to the environment. the tyre sector comprises three
Companies, Richard Pieris tyre Co Ltd, Arpidag International (Pvt)
Ltd, and Richard Pieris Rubber Compounds Ltd.
Richard Pieris tyre Company is the established market leader
having the largest tyre distribution network in the Country. Arpidag
International (Pvt.) Ltd and Richard Pieris Rubber Compounds Ltd
are the supportive companies supplying pre-cured tread, cushion
gum, cement and other related materials and customised mixing
facilities to the tyre Company. Arpidag International also has
extended its services by supplying treads and consumables to
mini plants in the industry.
there was a need for upgraded products in the market place
during the year, which was largely driven by the development
in roads and other infrastructure that took place in the country.
Richard Pieris tyre Company being a continuous innovator
bridged this gap by improving consistent performance of its
product portfolio. Rubber prices during the year were volatile
where the sector took advantage of low rubber prices during the
mid year, but there was an escalation of rubber prices towards
the end of the financial year. Apart from this, the cost base was
adversely affected by high-energy costs, interest rates, fuel
prices and the devaluation of currency. Above factors contributed
towards a deterioration in margins, which leaves a huge challenge
for 2012/13 in terms of profitability. However, the sector is geared
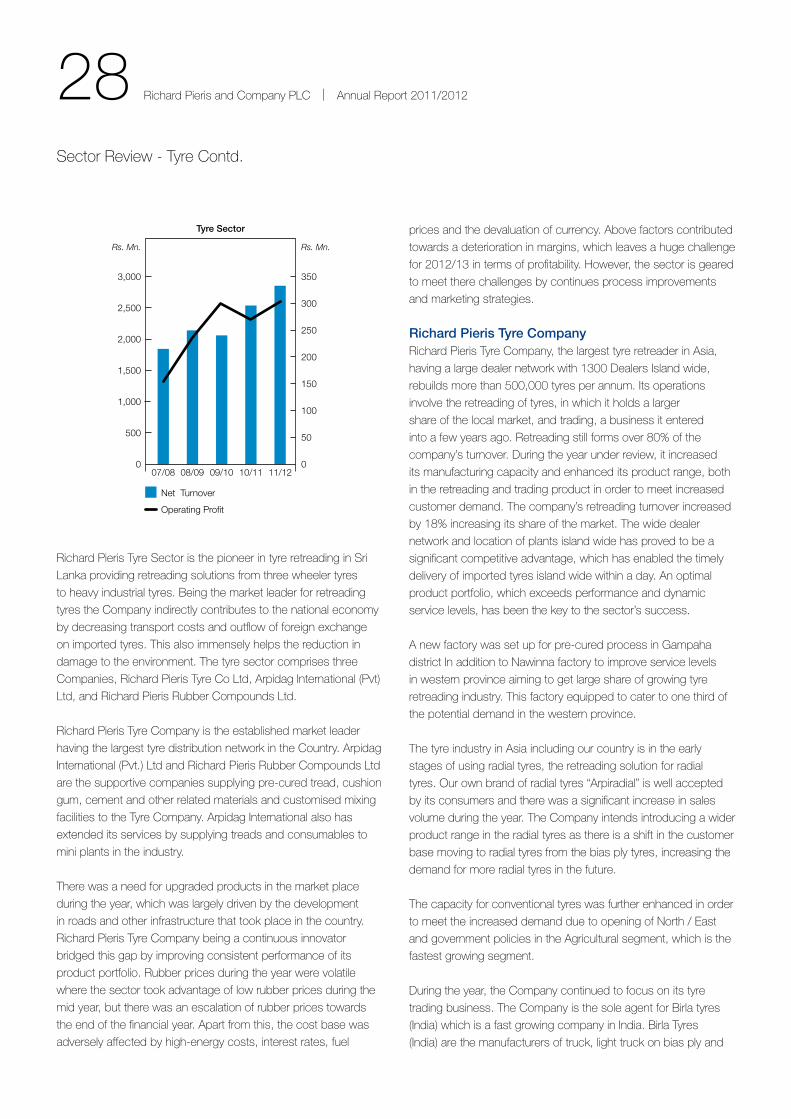
to meet there challenges by continues process improvements
and marketing strategies.
Richard Pieris Tyre Company Richard Pieris tyre Company, the largest tyre retreader in Asia,
having a large dealer network with 1300 Dealers Island wide,
rebuilds more than 500,000 tyres per annum. Its operations
involve the retreading of tyres, in which it holds a larger
share of the local market, and trading, a business it entered
into a few years ago. Retreading still forms over 80% of the
company’s turnover. During the year under review, it increased
its manufacturing capacity and enhanced its product range, both
in the retreading and trading product in order to meet increased
customer demand. the company’s retreading turnover increased
by 18% increasing its share of the market. the wide dealer
network and location of plants island wide has proved to be a
significant competitive advantage, which has enabled the timely
delivery of imported tyres island wide within a day. An optimal
product portfolio, which exceeds performance and dynamic
service levels, has been the key to the sector’s success.
A new factory was set up for pre-cured process in Gampaha
district In addition to nawinna factory to improve service levels
in western province aiming to get large share of growing tyre
retreading industry. this factory equipped to cater to one third of
the potential demand in the western province.
the tyre industry in Asia including our country is in the early
stages of using radial tyres, the retreading solution for radial
tyres. our own brand of radial tyres “Arpiradial” is well accepted
by its consumers and there was a significant increase in sales
volume during the year. the Company intends introducing a wider
product range in the radial tyres as there is a shift in the customer
base moving to radial tyres from the bias ply tyres, increasing the
demand for more radial tyres in the future.
the capacity for conventional tyres was further enhanced in order
to meet the increased demand due to opening of north / east
and government policies in the Agricultural segment, which is the
fastest growing segment.
During the year, the Company continued to focus on its tyre
trading business. the Company is the sole agent for Birla tyres
(India) which is a fast growing company in India. Birla tyres
(India) are the manufacturers of truck, light truck on bias ply and
sector Review - tyre Contd.
Tyre Sector
Operating Profit
Net Turnover
0
500
1,000
1,500
2,000
2,500
3,000
07/08 08/09 09/10 10/11 11/120
50
100
150
200
250
300
350
Rs. Mn. Rs. Mn.

29 Richard Pieris and Company PLC | Annual Report 2011/2012
radial ply, agricultural, industrial vehicles, two wheelers and three
wheelers. Birla radial truck tyres which were introduced recently
are performing well in the market and reaching premium product
category in the country.
the automotive battery “Altima” an Indian battery was introduced
to the market with a sri Lanka standard certification, and the
performance of the same proved to be successful. Birla two
wheel and three wheel tyres were added to the company’s
trading portfolio expecting a market share in this category, since
these tyres are up to the country’s standard with a competitive
price.
the sharp increase in the raw material prices and macro-
economic changes in later part of the period proved to be a
considerable challenge to the industry. steps have been taken to
increase efficiency and maintain productivity at the optimum level
for each plant.
Arpidag International (Pvt.) Ltd Arpidag International is a pioneer in supplying the pre- cured
treads to the tyre industry. It supplies pre-cured tread mainly to
the Richard Pieris tyre Company while it also supplies to external
customers through the AtM brand. the Company has been
awarded with the process quality certification of “Iso : 9001”
the Company’s profitability was affected by the high price of raw
material during the year. efficient management of costs however
enabled the company to maintain its profitability.
Richard Pieris Rubber Compounds Ltd.Richard Pieris Rubber Compounds provides mixing services to
Richard Pieris tyre Company, several other companies within
the Group, and various external customers. the company has
state-of-the-art machinery in its factory, which provides a high
level of quality. the company now also sells chemicals to local
manufacturers.
the Company was able to facilitate substantial volume for
external customers, 30% of its mixing volume are from external
customers, helps to improve its bottom line than expected at
the beginning of the year. It is continuing the improvements in
process for consistent quality and help the other two companies
in the sector to achieve a higher market share by providing an
excellent mixing service.
30 Richard Pieris and Company PLC | Annual Report 2011/2012
sector Review - Plastics
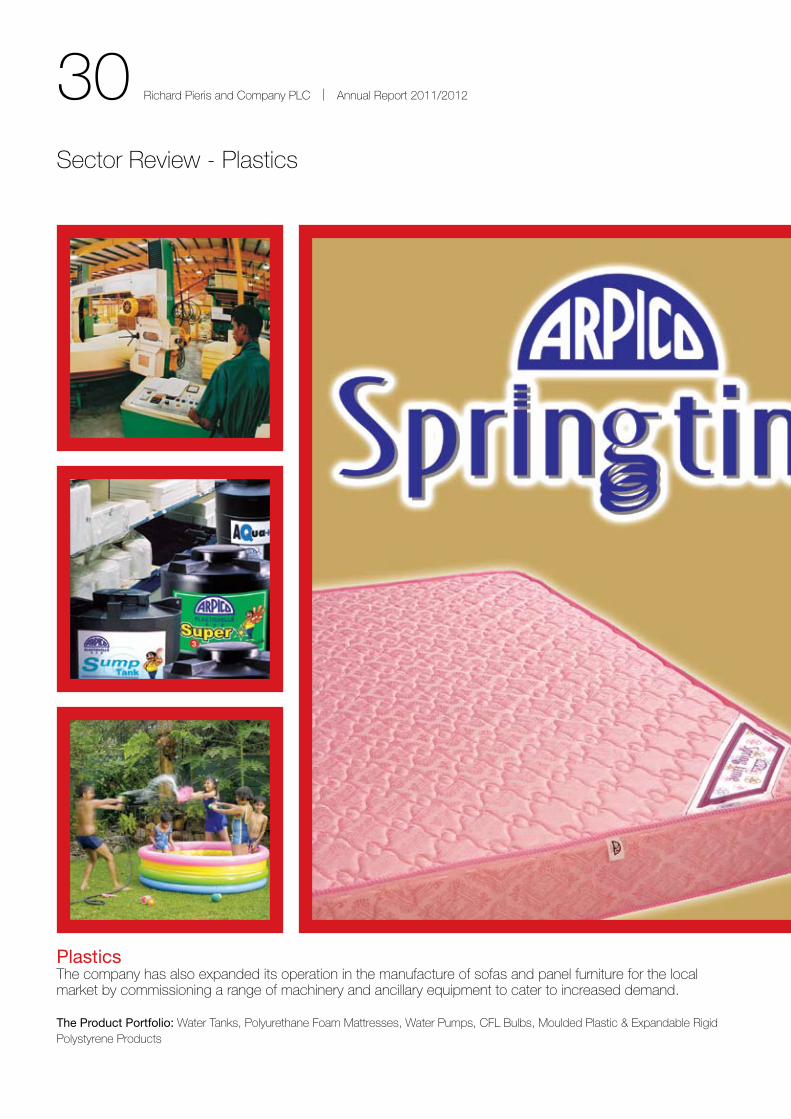
Plasticsthe company has also expanded its operation in the manufacture of sofas and panel furniture for the local market by commissioning a range of machinery and ancillary equipment to cater to increased demand.
The Product Portfolio: Water tanks, Polyurethane Foam Mattresses, Water Pumps, CFL Bulbs, Moulded Plastic & expandable Rigid Polystyrene Products

31 Richard Pieris and Company PLC | Annual Report 2011/2012
32 Richard Pieris and Company PLC | Annual Report 2011/2012
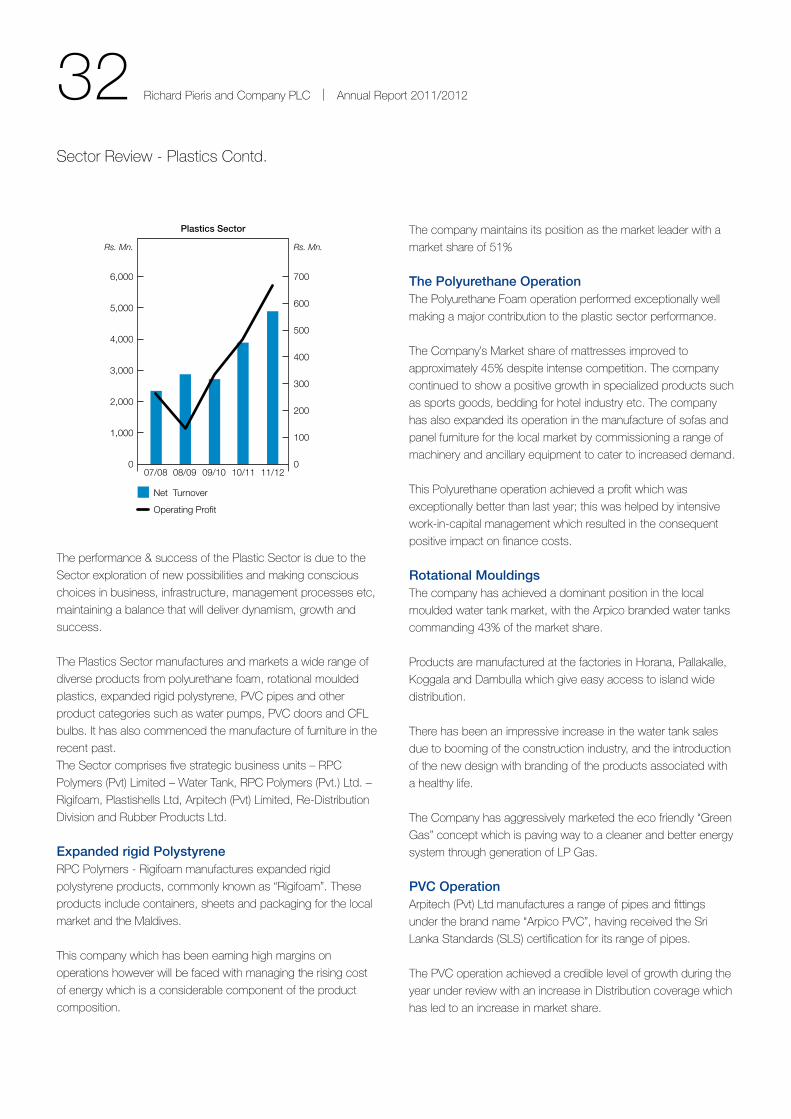
the performance & success of the Plastic sector is due to the
sector exploration of new possibilities and making conscious
choices in business, infrastructure, management processes etc,
maintaining a balance that will deliver dynamism, growth and
success.
the Plastics sector manufactures and markets a wide range of
diverse products from polyurethane foam, rotational moulded
plastics, expanded rigid polystyrene, PVC pipes and other
product categories such as water pumps, PVC doors and CFL
bulbs. It has also commenced the manufacture of furniture in the
recent past.
the sector comprises five strategic business units – RPC
Polymers (Pvt) Limited – Water tank, RPC Polymers (Pvt.) Ltd. –
Rigifoam, Plastishells Ltd, Arpitech (Pvt) Limited, Re-Distribution
Division and Rubber Products Ltd.
Expanded rigid PolystyreneRPC Polymers - Rigifoam manufactures expanded rigid
polystyrene products, commonly known as “Rigifoam”. these
products include containers, sheets and packaging for the local
market and the Maldives.
this company which has been earning high margins on
operations however will be faced with managing the rising cost
of energy which is a considerable component of the product
composition.
the company maintains its position as the market leader with a
market share of 51%
The Polyurethane Operationthe Polyurethane Foam operation performed exceptionally well
making a major contribution to the plastic sector performance.
the Company’s Market share of mattresses improved to
approximately 45% despite intense competition. the company
continued to show a positive growth in specialized products such
as sports goods, bedding for hotel industry etc. the company
has also expanded its operation in the manufacture of sofas and
panel furniture for the local market by commissioning a range of
machinery and ancillary equipment to cater to increased demand.
this Polyurethane operation achieved a profit which was
exceptionally better than last year; this was helped by intensive
work-in-capital management which resulted in the consequent
positive impact on finance costs.
Rotational Mouldingsthe company has achieved a dominant position in the local
moulded water tank market, with the Arpico branded water tanks
commanding 43% of the market share.
Products are manufactured at the factories in Horana, Pallakalle,
Koggala and Dambulla which give easy access to island wide
distribution.
there has been an impressive increase in the water tank sales
due to booming of the construction industry, and the introduction
of the new design with branding of the products associated with
a healthy life.
the Company has aggressively marketed the eco friendly “Green
Gas” concept which is paving way to a cleaner and better energy
system through generation of LP Gas.
PVC OperationArpitech (Pvt) Ltd manufactures a range of pipes and fittings
under the brand name “Arpico PVC”, having received the sri
Lanka standards (sLs) certification for its range of pipes.
the PVC operation achieved a credible level of growth during the
year under review with an increase in Distribution coverage which
has led to an increase in market share.
sector Review - Plastics Contd.
Plastics Sector
Operating Profit
Net Turnover
0
1,000
2,000
3,000
4,000
5,000
6,000
07/08 08/09 09/10 10/11 11/120
100
200
300
400
500
600
700
Rs. Mn. Rs. Mn.
33 Richard Pieris and Company PLC | Annual Report 2011/2012
the company has also commissioned machinery to commence
the manufacture of plastic garden hoses.
Re-Distribution Divisionthe Re-Distribution Division distributes products island-wide
through a network of distributors and dealers. the Group is
proud of this distribution channel, which is one of the largest in
the country, catering to over five thousand Hardware & Furniture
outlets island-wide.
this division showed a steady growth in sales of all product
lines, with all lines maintaining steady profitability levels whilst also
showing an upward trend in the cash position of the company.
Further, the division is focusing on continued diversification into
new areas of business.
the division also distributes the water pumps, which is currently
the market leader. this division has also expanded its transport
fleet and warehousing operations to cater to the growing market
with the goal of being a dominant player in the Hardware and
Furniture sectors.

34 Richard Pieris and Company PLC | Annual Report 2011/2012
sector Review - Rubber
Rubberthe Rubber sector achieved steady results during the year under review. the turnover and profitability of the sector improved steadily compared to the previous year.
The Product Portfolio: natural Latex Foam Mattresses, Pillows, Rubber Mats for Industrial and Domestic Use, Jar sealing Rings, small Moulded Products and other specialized Rubber Products

35 Richard Pieris and Company PLC | Annual Report 2011/2012
36 Richard Pieris and Company PLC | Annual Report 2011/2012
this sector is comprised of Richard Pieris exports, Richard Pieris
natural Foams, Arpitalian Compact soles, Micro Minerals, and
Richard Pieris Rubber Products.
the Rubber sector achieved steady results during the year under
review. the turnover and profitability of the sector improved
steadily compared to the previous year. the positive trends are
expected to continue in to the coming year as well.
the Group’s Rubber sector provides a wide range of value
added rubber products for export and local markets. this sector
has traditionally played a major role in the Group’s reputation
for providing products of high quality and dependability.
Manufacturing was well planned resulting in increased
productivity, and catered to market demand in terms of both
quality and quantity, while keeping in view the need of effective
controls on inventory levels. Continued focus on quality control
at all stages of the production process and the introduction of
innovative processes further strengthened the quality of products.
the whole rubber based industry including our sector went
through a challenging year due to the fluctuations of rubber prices
and significant increase in the energy cost during second half of
the year. However, even though the entire rubber industry was
affected by many challenges the sector was able to achieve a
substantial profit for the year due to the production and energy
efficiencies minimizing overhead cost coupled with aggressive
sales and marketing.
sector Review - Rubber Contd.
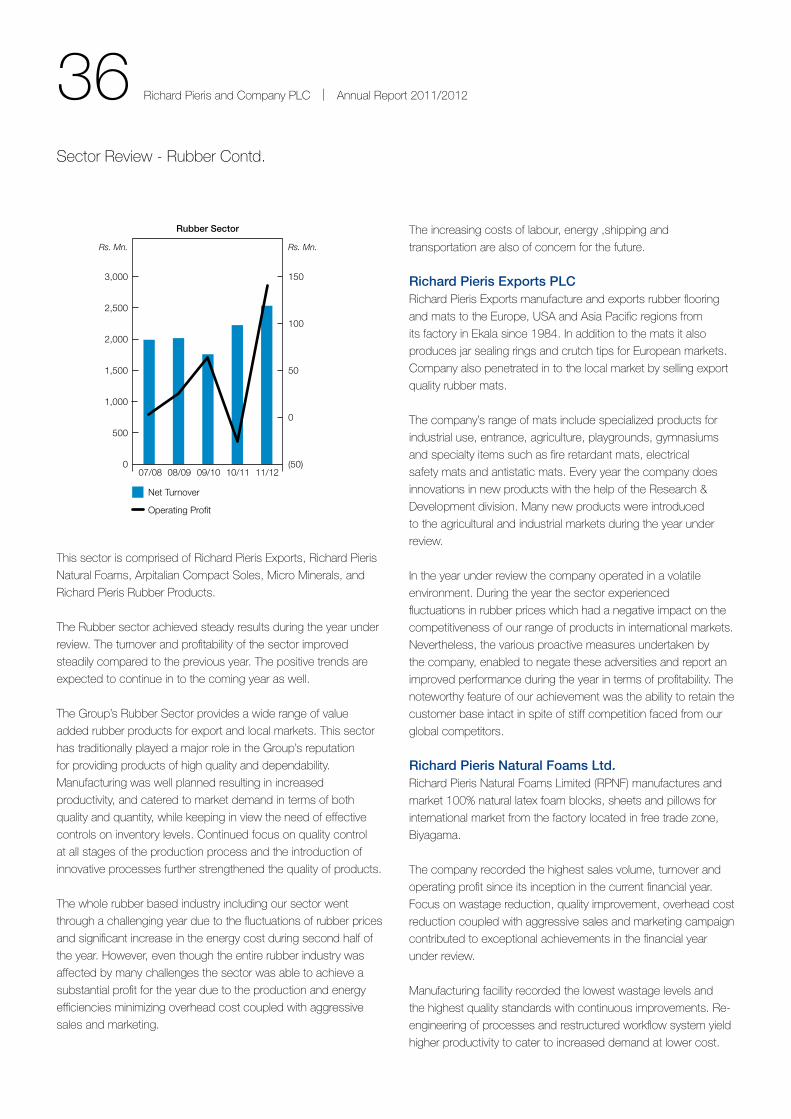
the increasing costs of labour, energy ,shipping and
transportation are also of concern for the future.
Richard Pieris Exports PLCRichard Pieris exports manufacture and exports rubber flooring
and mats to the europe, UsA and Asia Pacific regions from
its factory in ekala since 1984. In addition to the mats it also
produces jar sealing rings and crutch tips for european markets.
Company also penetrated in to the local market by selling export
quality rubber mats.
the company’s range of mats include specialized products for
industrial use, entrance, agriculture, playgrounds, gymnasiums
and specialty items such as fire retardant mats, electrical
safety mats and antistatic mats. every year the company does
innovations in new products with the help of the Research &
Development division. Many new products were introduced
to the agricultural and industrial markets during the year under
review.
In the year under review the company operated in a volatile
environment. During the year the sector experienced
fluctuations in rubber prices which had a negative impact on the
competitiveness of our range of products in international markets.
nevertheless, the various proactive measures undertaken by
the company, enabled to negate these adversities and report an
improved performance during the year in terms of profitability. the
noteworthy feature of our achievement was the ability to retain the
customer base intact in spite of stiff competition faced from our
global competitors.
Richard Pieris Natural Foams Ltd.Richard Pieris natural Foams Limited (RPnF) manufactures and
market 100% natural latex foam blocks, sheets and pillows for
international market from the factory located in free trade zone,
Biyagama.
the company recorded the highest sales volume, turnover and
operating profit since its inception in the current financial year.
Focus on wastage reduction, quality improvement, overhead cost
reduction coupled with aggressive sales and marketing campaign
contributed to exceptional achievements in the financial year
under review.
Manufacturing facility recorded the lowest wastage levels and
the highest quality standards with continuous improvements. Re-
engineering of processes and restructured workflow system yield
higher productivity to cater to increased demand at lower cost.
Rubber Sector
Net Turnover
Operating Profit
0
500
1,000
1,500
2,000
2,500
3,000
07/08 08/09 09/10 10/11 11/12(50)
0
50
100
150
Rs. Mn. Rs. Mn.
37 Richard Pieris and Company PLC | Annual Report 2011/2012
Reduced latex prices in the 2nd half of the year helped recovery
of reduced margins in the first half of the year. 4th quarter results
were pushed up with strategic sourcing of raw material (price vs
time) together with rupee devaluation during the period.
sound working capital management with recorded profitability
enabled RPnF to reduce borrowings by significant amount in the
current financial year.
Arpitalian Compact Soles (Pvt) LimitedArpitalian Compact soles manufactures shoe soling sheets for
the International shoe manufacturers. the Company is a joint
venture with Davos sPA, a globally reputed manufacturer for shoe
soles.
the company is in a continuous process of making new
compound and many initiatives were undertaken during the year
in the production process. A new range of products under the
brand name “Diamond” was launched during the year which uses
waste compound.
During the year “India” emerged as the main market and the
company has successfully implemented market segmentation
strategies. the company is beginning to reap the benefits of
such strategies and a 40% value growth is expected during
the 2012/13 financial year. Also the new developments of the
products continues with the full and extensive support of Davos -
Italy as per the design and fashion trends in the market.
the Company entered into new markets through DAVos such as
Brazil, Morocco, Lebanon, Hong Kong, China and targeting new
market such as Vietnam, Bangladesh and thailand. this will help
the company to establish itself in the market in the coming years.
With the focus of on new product development, the company
expects a marginal growth in the next financial year.
Micro Minerals (Pvt.) LtdMicro Minerals (Pvt.) Ltd produces mineral products which are
essential as a raw material for the polymer industry. this company
mainly supplies to the Richard Pieris Group of Companies. the
manufacturing plant of the Company is located in Bandaragama.
We are happy to note that in spite of various constraints the
company faced in its operations, it has achieved its budgeted
turnover and profits and shows further potential for growth.
Richard Pieris Rubber Products Ltd.Richard Pieris Rubber Products Ltd, the market leader in sri
Lankan Rubber Products Industry is the largest domestic door
mat manufacturer and the pioneers in manufacturing rubber
vehicle related carpeting applications.
the company has been introducing various types of new door
mat designs from Rubber for indoor and outdoor purposes.
the company has also expanded its operations in supplying
Printing Rollers and rubber based industrial applications, such as
large Industrial Rollers, Bridge Bearings and Conveyor Belts etc.
the company performed well during the year under review with
turnover growing by 22% and profits growing by42% compared
to the previous year.

38 Richard Pieris and Company PLC | Annual Report 2011/2012
sector Review - service and other
Services and OtherArpico Insurance Limited was established in June 2011 and commercial operations commenced in January 2012 under the theme “Insurance for the Living”.
The Product Portfolio: Real estate, Insurance, Freight Forwarding stock Broking and Financial services.

39 Richard Pieris and Company PLC | Annual Report 2011/2012

40 Richard Pieris and Company PLC | Annual Report 2011/2012
this sector includes the Group’s holding company, Richard
Pieris and Company PLC, and subsidiary companies in various
businesses outside the Group’s main sectors of Plantations,
Rubber, tyre, Retailing and Plastics. It includes companies
involved in Logistics, Insurance, Real estate and Financial
services.
Richard Pieris and Company PLCRichard Pieris and Company PLC is the holding company of
the Group and is responsible for the overall corporate policy
and direction of the Group. Richard Pieris and Company PLC
generates a proportion of its income by way of dividends from
its subsidiaries. It also owns and rents real estate, including the
Hyde Park Corner retailing complex and the nawinna complex
which houses the tyre factory, the head office and a super
Centre. the Group entered the insurance industry with its
own identity with the exit from its investment in Asian Alliance
Insurance Company PLC where the Group reported a Capital
Gain of Rs.717m. Commercial operations of Arpico Insurance
Limited commenced in January 2012. the period under review
also saw the commencement of business operations of RPC
Financial services (Pvt) Limited which focuses on Margin
trading Activities and is an ideal extention to the Group’s stock
broking firm “Richard Pieris securities (Pvt) Limited” which was
established last year. the company’s various divisions provide
support services to all companies in the Group. this includes
services relating to information and communication technology,
human resources and procurement.
the It Division has continued to provide systems integration,
managed services and “end-to-end” services and solutions for
both software and Hardware. this has enabled the Group to
generate more value through an innovative approach to business
processes, well-integrated supporting technologies and strategic
investments. the technical staff have an in-depth understanding
of company’s technological needs and businesses and a proven
track record of delivering results in many industrial sectors.
the division manages the data center, disaster recovery center
and central PABX. During the year under review, the internally
developed eRP solution, Marksys was expanded with several
other modules to cater to Financial sector and Insurance sector
and certain other services such as CCtV and surveillance
installations would be provided into the future.
the Group Human Resource Division is responsible for the
overall HR policy of the Group. It deals with the administrative
work relating to employees and coordinates training and staff
development. More details on its activities are to be found in the
report “our People” on page 56.
the Central Commercial Division handles the procurement of
raw materials and consumables, both domestic and imports. It
has been successful in passing on the low costs to our sBUs by
maintaining sound supplier relations and maximizing economies
of scale. During the year it was successful in negotiating several
dealerships to the Group which would be carried out by relevant
sBUs.
the Group treasury supports funding requirements of all the
businesses. It is also involved in negotiating bank facilities to the
Group and manages the Group’s foreign exchange exposure and
interest rate risks.
the Group Corporate Planning Unit coordinates the Group’s
overall strategic planning process. It provides expertise to all
sBUs to develop and monitor Key Performance Indicators. this
unit also analyses all new business ventures, develops business
plans and continuously monitors existing businesses in order to
ensure optimal allocation of resources.
the internal audit function which is centralized ensures that
internal control systems are adequate; procedures are up- to-
date and are adhered to by all group companies. Its activities are
based on the risks faced by the group in the different industries.
sector Review - service and other Contd.
Service and Other Sector
Net Turnover
Operating Profit
0
50
100
150
200
250
300
07/08 08/09 09/10 10/11 11/120
100
400
500
Rs. Mn. Rs. Mn.
200
300
41 Richard Pieris and Company PLC | Annual Report 2011/2012
R P C Logistics Ltd.R P C Logistics is primarily engaged in international freight
forwarding and customs broking. At present, two thirds of the
Company’s revenue is generated from its freight forwarding
and customs broking activities. the Company’s portfolio of
services includes airfreight, sea freight, sea freight consolidation,
customs brokerage and transshipment. the Company’s services
include door-to-door cargo services with the assistance of the
Company’s overseas agents and a variety of other connected
services.
the main focus of the Company was to service the needs of
other entities within the Richard Pieris Group. the Company is
presently looking forward in obtaining agencies for Machinery and
equipment used by the Plantation and other sBUs. During the
year under review, the agency for Colour sorter Machines from
Anhui Zhonke optic – electronic Colour sorter Company China,
was secured.
Richard Pieris Securities (Pvt.) Ltd.the Group re-entered the financial services industry with the
formation of its fully owned subsidiary RP securities (Pvt) Ltd.
With a modern office with all facilities, the company, which
commenced operations in January 2011, has attracted the
best of professionals in the industry to form the nucleus of this
operation. From the outset the performance has been good with
a decent client base and positive results. the Group intends
to be a dominant player in the financial services market domain
by taking full advantage of its brand equity and infrastructure
throughout the country.
Arpico Insurance Limitedto further strengthen the financial services sector of the Group
as well as to harness the opportunities of the post conflict era,
Group has launched Arpico Insurance Ltd just within 2 ½ months
of obtaining licence from the Insurance Board of sri Lanka on
11th January 2012 redefining the life insurance category as well
as to give the category a new meaning by creating a new market
space “Insurance for the Living”. the initial response from the
public was overwhelming with extremely positive participation
by the target consumers. “Insurance for the Living” denotes the
power of positive thinking that will and can change the attitude
towards insurance and clearly differentiate from its competition.
the initial distribution thrust will be focused on the Western
Zone due to the fact that it generates a significant portion of the
GDP of the country and swift expansion in to the other areas of
the island based on its potential will follow through. Plans are
also underway to extend services to “Arpico Retail Customers”
where foot fall exceeds 700,000 on a monthly basis. since life
insurance is often sold and not bought one of the key success
factors for any life insurance company would be its sales force
and sales management. the company has a unique approach
already mapped out with “key result areas for measurement with
its optimum frequency”. Performance management being an
integral part of a sales led business model, the company has also
strengthened it’s training and development function to address
probable performance gaps.
Arpico Insurance is proud to be associated with Munich Re
the no 01 reinsurer in the world to share its risk towards the
business. Munich Re with its global presence in over 30
countries and with premium income of € 46 bn (2010) shares its
expertise with Arpico Insurance risk portfolio and is a testimony of
prudent financial management irrespective of being a new entrant
to the market.
services of an ICt led, fully integrated financial services model
is well in place to manage all interfaces of the business which
includes Customer Relationship Management to provide an
unmatched customer service to policyholders capturing all
policyholder touch points.
Completion of a fully fledged business model to commence
operation within just two and half months of obtaining license
from the Insurance Board of sri Lanka shows the determination,
dedication and commitment of Richard Pieris Group to provide
financial security to the sri Lankan public in a new market space.
the icon “tree of life” is a visual identity that symbolizes the
wisdom, protection, strength and stability of the Richard Pieris
Group which is in the backdrop of the brand. the stretched out
tree, is a very powerful symbol to represent the Group’s 80 years
of deep rooted heritage, continuous growth and diversification
because a tree is the only living thing that continues to grow
throughout its life-time. the colour scheme of the entire logo is
a mixture of blue, signifying strength and stability with orange
depicting warmth, energy, expansiveness, loyalty and confidence.
White is universally accepted as representing purity thus
establishing the company’s integrity. “to make it contemporary
and for visual appeal we have introduced a stylized tree.”
42 Richard Pieris and Company PLC | Annual Report 2011/2012
the challenges our world faces nowadays go far beyond the
financial statements. We believe at Arpico that every business
we handle has an obligation, to address issues that impact the
society as a whole.
our Group is underpinned by a proud heritage and driven by
strong principles, like quality, value, and integrity at the heart of
our business strategy. the Group is one of the largest and the
oldest diversified conglomerates in sri Lanka with a large number
of stakeholders, which engages in a number of economic, social,
and environmental support initiatives thereby contributing towards
its responsibilities to all stakeholders.
We have a proud history of running our business in a socially
responsible manner and making a difference in the communities
we serve. our commitment to corporate social responsibility
continues to develop and strengthen year by year, where we
have learned that looking at our customers from a sustainability
perspective opens the world of new opportunities.
We aim to engage positively with all stakeholders, responding
to them swiftly and efficiently while continuing to welcome their
views.
Customersour greatest pride and our primary strength lies in our vast
customer base and the strong and lasting relationships we
have forged with them. the Group mobilises its competencies,
energy, and resources to build a higher performing service to its
customers, treating their needs and wants as the main priority.
All companies in the Group guarantee the highest quality in their
products and services. Many companies have international and
national certifications and strive to provide the maximum level of
convenience, service, and value for money to its customers.
Food SafetyBeing a leading retail chain in sri Lanka, one of our key priorities
is food safety. We have outclassed other entities by providing
the best products to the customers with the theme “fresh ideas
everyday”. the Arpico supercentres maintain stringent policies on
food safety and quality. More than 150,000 Customers a week
pass through our doors, and our colleagues across the business
work hard each day to deliver great service to them.
the continued investment in local sourcing and maintenance of
long term loyal relationships with shoppers and suppliers have
not only benefited the local community but have ensured long
term sustainability of the business. Food safety is also a key
requirement in the plantation sector. several of our tea factories
have obtained certifications from Fair-trade Labeling organization
and the ethical tea Partnership, whose members are leading
retailers in the U.K.
Fair and Competitive Trading Practicesour policy is to be fair and honest, being accessible and forthright
in our dealings and to always deliver what we promise.
EmployeesEmployees’ Health and Safetythe Richard Pieris Group is one of the largest private sector
employers in the country considering the employees as key
stakeholders whose contribution is vital for the continued success
of the company and the country.
the health and safety of our employees is a key priority which
is ensured in all factories and other workplaces by providing
equipment that will ensure high safety standards. training
programmes are conducted to educate employees on health and
safety measures in the workplace. Medical facilities are provided
to all employees.
Community & Countrythe Richard Pieris Group carries out a wide range of diverse
activities across all provinces in sri Lanka contributing towards
the goodwill of the entire country, which has enabled us to have a
long held reputation of being a responsible corporate body.
Its initiatives reach out across the island from small villages to
urban centres thereby touching the life of every sri Lankan across
the island. the Group also provides employment for more than
28,000 people in the country. We have always promoted a
positive attitude towards age diversity, believing that a blend of
youth and maturity will benefit both the Company and employees
at the same time.
CSR InitiativesWelfare ActivitiesRPC Polymers (Pvt) Ltd., provided a complete water storage
solution to the Madhu church in Mannar district, with the objective
to benefit 700,000 Catholic worshippers and devotees who visit
the Madhu festival each year. the water storage solution was
assembled utilizing Arpico water tanks, pipes, and fittings etc.
Further, the Company donated traffic cones to the nugegoda
Police Division Headquarters.
Corporate social Responsibility

43 Richard Pieris and Company PLC | Annual Report 2011/2012
Children’s day programs were conducted in our estates by the
staff welfare societies of the estates. In these programs children
of the resident workers and in some instances, children of the
villagers participated.
Volley ball courts were built at strathspey & Moray estate to
encourage sports activities among the residents of that estate.
Concrete roads were developed at some of our estates of
Maskeliya Plantation. Further, Re roofing was done for 94 housing
units in the regions of Hatton and Badulla.
Supporting Health Carethe Privilege Club of Richard Pieris Distributors, was able to
support a child in the school for the Deaf with a brand new
hearing aid. We will also be launching “Hear the sleighbells”
appeal during the month of December by having a till at all
supercentres for this purpose. the customers will be able to
again donate their Privilege Points to this very worthwhile cause.
Arpico supercentres joined hands with Mortein for dengue
awareness and prevention campaign. the project also gave
shoppers the opportunity to donate funds towards this dengue
prevention campaign that benefited several children’s homes in
our country.
the 4th consecutive Annual Medical Camp of Uva range was
successfully held, where more than 2,000 patients were treated
by a team of qualified physicians.
During the year, Maskeliya Plantation PLC built 165 Latrines in
the Hatton region and 10 in Badulla region with the objective
of serving the employees and the local community to meet the
basic needs of day to day life.
Assisting EducationArpico Gold Medal honour was awarded to the best performer in
the special degree program in Information and Communication
technology, Faculty of Applied sciences at Rajarata University.
Financial assistance was given to all estate employees’ children
who qualified for University education, as done in the prior years.
SuppliersBuilding lasting partnerships with our suppliersIntegration with the supply chain has enabled the group to
purchase high quality input at its best price. By thoroughly
understanding the supply chains in which we and our customers
operate, we were able to promote sustainable development
within those chains, which enabled us, to deepen the relationship
with our customers and to build new and innovative partnerships.
We therefore aim to be a loyal customer to our suppliers. Arpico
has a large number of suppliers from different parts of the world.
Year after year, the group strives to develop partnerships with
small and Medium sized enterprises in sri Lanka and supports
small producers in sri Lanka by providing them with guidance, in
the use of appropriate technology for manufacture and channel
to market.
Our Commitment towards the Environment the Group recognises environmental management as an
important aspect of our business and strives to conduct
operations in an environmentally sound manner. this is achieved
by, reducing our carbon footprint, saving energy, increasing
transport efficiency, preventing waste, and increasing recycling.
the introduction of degradable loyalty card, “eco Privilege” in the
sri Lankan retail market was a fresh experience to the market
and further encouraged the use of recyclable bags. each of our
stores is designed individually, built with style and character that
are ideal to the locations in which they are situated. the integral
store’s design enables the natural / sky light to spill through the
building, eliminating the need for artificial light, which immensely
contributes towards high energy saving. the new supercenters
are opened with the concept of “Go Green” by using initiatives
such as water treatment plants.
44 Richard Pieris and Company PLC | Annual Report 2011/2012
Arpico’s locally manufactured products were awarded the best
locally manufactured product stall at the InCo 2011. the local
innovation and introduction of environmental concepts like the
Arpico Green Gas Unit contributed towards the achievement
of this award. the Arpico Green Gas Unit won the Presidential
award for innovative products in the year 2010. this product
enables households, hotels, restaurants, etc to produce Biogas
through organic waste. the users could additionally benefit from
the active 100% liquid compost fertilizer, which is a by-product of
the system which could be used for agricultural and gardening
purposes. Arpico has a range of industrial garbage bins and
compost bins to better manage the domestic waste. Further, it’s
essential to highlight that the Arpico Plastishells Water tank is the
only water tank to be Iso 9001: 2008 certified.
sri Lanka’s first nano technological air purification CFL bulb was
introduced during the year by Arpico. the Arpilight CFL bulb
enhances the quality of life by purifying and eliminating germs /
bacteria. Further, this product saves 80 % of the electricity and
is perfect for areas with persistent odours such as restaurants,
factories, etc. the Arpilight CFL bulbs won the best new product
award at recently concluded CHeMeX 2011exhibition held at
Colombo commemorating the United nations “International year
of Chemistry”. the product was rated as a highly environmental
friendly CFL bulb. this was certified as a five star product by the
sri Lankan sustainable energy Authority.
As a Group that is engaged in plantations, we are intensely
involved in forest conservation. the Group obtains environmental
certifications from global and local environmental authorities,
wherever applicable. this includes Iso 2000 certificate and
certifications from the Forest stewardship Council, the Central
environmental Authority.
the energy efficient machinery with the use of trucco energy
efficient heater, in Kirklees estate in Kegalle Plantation, has helped
to bring down fuel consumption substantially by way of higher
thermal and optimum heat transfer. the effluent treatment plants
constructed in our rubber factories has helped to treat toxic
waste before it leaves our estate boundaries.
the Group inculcates environmental friendly practices in
every employee in their work habits and their personal lives by
encouraging them to, use energy conservation measures and
recycle waste and by –products.
Corporate social Responsibility Contd.

45 Richard Pieris and Company PLC | Annual Report 2011/2012
Financial Review
Overall Group PerformanceDuring the financial year 2011/12, the Group recorded turnover
of Rs. 31,498 mn at a remarkable growth of 16% over the
previous financial year. In line with the turnover however, Cost
of sales also increased and this led to the Gross Profit growing
only marginally by 4%. nevertheless, positive changes in other
operating Income worked towards boosting profits of the Group
and accordingly, the net Profit improved by 20% to Rs. 2,561 mn
by the year end.
Turnover AnalysisGroup turnover for the year increased from Rs. 27,242 mn in
the financial year 2010/11 to Rs. 31,498 mn in the financial year
2011/12, recording growth of 16%.
A key factor that drove turnover during the year was the increase
in disposable income of consumers which was facilitated by the
momentous growth of the sri Lankan economy by 8.3%. the
effects of this development were compounded to the Group’s
business operations by the expansion of its chain of retail outlets.
Another macro-economic development that affected turnover
was the depreciation of the local currency, which raised the
value of turnover in the export sector, specifically because
of higher sales volume in the face of lower prices in terms of
foreign currency. Further, the turnover of the plastic sector
also experienced high growth, particularly supported by the
boom in the construction industry, and the sector’s expanded
distributor coverage, continuous product development and
mass promotional campaigns ensured that the Group reaped full
benefits of the opportunities offered by the macro-economy.
Retail Sectorthe retail sector emerged as the most significant contributor
to Group turnover for yet another year, accounting for 44% as
opposed to the 40% contribution made in the previous financial
year. total turnover for the sector improved by 27% to Rs.
13,862 mn, enabling it to become the sector with the second
best rate of growth. the superlative performance of the sector
was largely assisted by the opening of three super centers in
Kadawatha, Kochchikade and Kalutara, which in turn expanded
the total network of large format retail outlets to 14. throughout
the year, the sector continued to be the value driver of the Group,
attracting a larger portion of its risk weighted capital.
Plastic Sectorthe plastic sector performed victoriously during the year by
recording the highest growth rate among all revenue generating
sectors at 29%. Accordingly, turnover of the sector increased
from Rs. 3,809 mn to Rs. 4,930 mn, accounting for 16% of
Group turnover.
the drivers behind this growth are manifold. the boom in the
construction industry in post-war optimistic sri Lanka is one such
key macro-economic factor. In addition, the sector’s efforts to
improve its performance, such as the expansion of its distribution
coverage and the conducting of large scale promotional activities,
also yielded results. simultaneously, the sector focused on
continuously introducing new products to penetrate the market
and to maintain its dominant position, while continuing to invest
in the expansion of factory/warehouse operations, transport fleet
and product differentiation, to meet the increasing demand arising
from the expansion in aggregate economic activity.
Plantation Sectorthe plantation sector ended the year by being the second
highest contributor to Group turnover by contributing 23%.
However, its relative weight in aggregate turnover declined due
to the bulky growth in other sectors such as retail and plastic. In
absolute terms, the turnover for the sector was recorded at Rs.
7,226 mn, down by 6% from Rs. 7,699 mn in the previous year.
this was due to a drop in tea production and the lower prices
prevailed for tea and rubber during the early half of the year under
review.
Despite 9% decline in the national tea production during the
period under review, the Group tea sector only declined by 4% to
12.8 mn Kg. this drop was due to inclement weather conditions
which prevailed during the same period. simultaneously there
also existed a negative pressure exerted by the reduction in tea
prices, especially high grown and medium grown tea, due to the
contracted level of demand from main buyers such as Iran, Iraq
and syria, which were experiencing political instability. the tea
segment turnover was adversely affected by these two factors
during the period.
Despite the production increasing by 5% to 5.5 mn kg from
5.2 mn kg, revenue derived from the rubber segment also
experienced a decline of 7%. this was the result of the drop in
prices, on average, by 11% during the first half of the year which,
gradually recovered latter part of the year giving some positive
outlook for the particular segment in the coming year. on the
other hand, demand for rubber was also adversely affected
by the decline in the production of automobiles following the
tsunami in Japan and the financial crisis experienced by the
european Region.

46 Richard Pieris and Company PLC | Annual Report 2011/2012
on a positive note, Revenue from the palm oil segment increased
by 30% and is identified as the best performing crop for the year.
For the palm oil segment, total Revenue increased from Rs. 282
mn to Rs. 366 mn, while the total crop increased from 12.1 mn
kg to 14.4 mn kg. the price of palm oil also experienced an
upward revision when it rose from Rs. 23 per kg to Rs. 25 per kg,
due to hikes in global crude oil prices and the increased use of
palm oil as edible oil, which fuelled its demand.
Rubber Sectorthe rubber sector continued its growth momentum during the
year with its’ turnover growing by 15%, and its contribution to
overall Revenue remained the same as the previous year at 8%.
Within the sector, the natural latex segment recorded its highest
ever growth since inception when it successfully achieved 26%
growth, mainly due to the increase in prices and also supported
by the growth in volume. Ardent efforts on new product develop-
ment, aggressive marketing and improvements in quality also
facilitated this segment’s boom.
However, the year was not so successful for the ‘Flooring Rubber
and Mats’ segment and ‘shoe soles Manufacturing’ segment.
the ‘Flooring Rubber and Mats’ segment recorded negative
growth both in volume and revenue, dropping by 11% and 2%,
respectively, primarily affected by the economic crisis in the
european Union to which a large proportion of the produce from
this segment is exported. this drop however was somewhat
compensated by the 9% improvement of average container value
due to the depreciation of the domestic currency.
For the ‘shoe soles Manufacturing’ segment, turnover increased
by 15% to Rs. 522 mn, but the margins declined drastically due
to the rising cost of imported raw material on which more than
75% of its cost depends. the volume of this segment increased
marginally, by 2%, while average container value grew by 13%,
again due to the depreciation of the local currency.
Tyre Sectorturnover for the tyre segment reached Rs. 2,834 mn in the
financial year 2011/12, growing by 12%, and succeeded in
maintaining its share of Group turnover at 9%. the average
value per unit grew by 20%, and this growth is attributable to
the revision of selling prices in line with the increase in imported
material and energy costs. However this segment was adversely
affected by the rising competition from upcoming Radial tyres
which offer a lower cost per kilo meter, and the volume resultantly
dropped by 3%. Meanwhile, the trading segment posted a
marginal growth of 2% during the year.
Service Sectorthe service sector consists of the newly added business arm
of the Group, Life Insurance, stock Broking, Margin trading and
Assets Management. Consolidation effect of these segments,
caused the sector to record 67% growth in Revenue. Despite
the sector’s turnover growing from Rs. 62 mn to Rs. 104 mn
however, it was the least contributor to Group turnover.
Financial Review Contd.
Geographical Turnover Composition
USA Europe Other
0
20
40
60
80
100
13 13
39 38
48 49
11/1210/11
%
Expenses Analysis 2010/2011
Cost of sales 76%
Operational Expenses 13%
Finance Cost 3%
Tax 2%
Segmental Turnover Composition
2010/2011
2011/2012
0
10
20
30
40
50
28
1
40
14
9 8
23
0
44
16
9 8
Ser
vice
s
Pla
ntat
ions
Ret
ail
Rub
ber
Pla
stic
Tyre
%
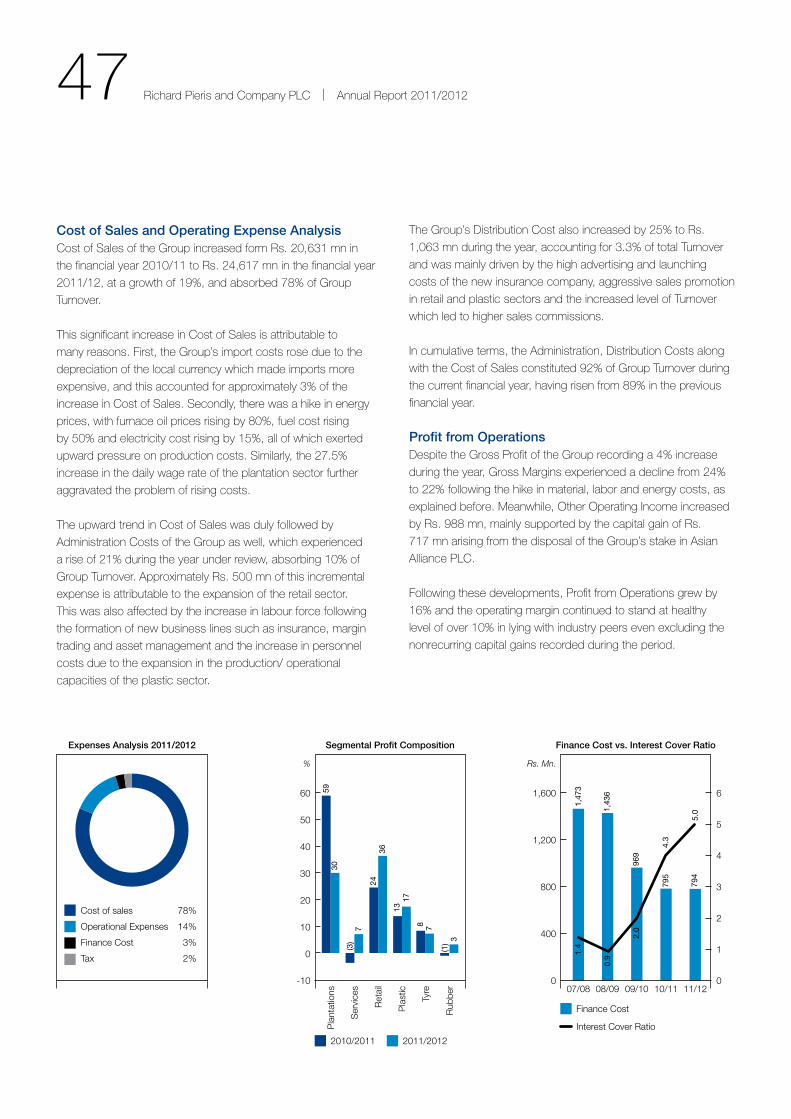
47 Richard Pieris and Company PLC | Annual Report 2011/2012
Cost of Sales and Operating Expense AnalysisCost of sales of the Group increased form Rs. 20,631 mn in
the financial year 2010/11 to Rs. 24,617 mn in the financial year
2011/12, at a growth of 19%, and absorbed 78% of Group
turnover.
this significant increase in Cost of sales is attributable to
many reasons. First, the Group’s import costs rose due to the
depreciation of the local currency which made imports more
expensive, and this accounted for approximately 3% of the
increase in Cost of sales. secondly, there was a hike in energy
prices, with furnace oil prices rising by 80%, fuel cost rising
by 50% and electricity cost rising by 15%, all of which exerted
upward pressure on production costs. similarly, the 27.5%
increase in the daily wage rate of the plantation sector further
aggravated the problem of rising costs.
the upward trend in Cost of sales was duly followed by
Administration Costs of the Group as well, which experienced
a rise of 21% during the year under review, absorbing 10% of
Group turnover. Approximately Rs. 500 mn of this incremental
expense is attributable to the expansion of the retail sector.
this was also affected by the increase in labour force following
the formation of new business lines such as insurance, margin
trading and asset management and the increase in personnel
costs due to the expansion in the production/ operational
capacities of the plastic sector.
the Group’s Distribution Cost also increased by 25% to Rs.
1,063 mn during the year, accounting for 3.3% of total turnover
and was mainly driven by the high advertising and launching
costs of the new insurance company, aggressive sales promotion
in retail and plastic sectors and the increased level of turnover
which led to higher sales commissions.
In cumulative terms, the Administration, Distribution Costs along
with the Cost of sales constituted 92% of Group turnover during
the current financial year, having risen from 89% in the previous
financial year.
Profit from OperationsDespite the Gross Profit of the Group recording a 4% increase
during the year, Gross Margins experienced a decline from 24%
to 22% following the hike in material, labor and energy costs, as
explained before. Meanwhile, other operating Income increased
by Rs. 988 mn, mainly supported by the capital gain of Rs.
717 mn arising from the disposal of the Group’s stake in Asian
Alliance PLC.
Following these developments, Profit from operations grew by
16% and the operating margin continued to stand at healthy
level of over 10% in lying with industry peers even excluding the
nonrecurring capital gains recorded during the period.
Expenses Analysis 2011/2012
Cost of sales 78%
Operational Expenses 14%
Finance Cost 3%
Tax 2%
1,47
3
1,43
6
969
795
794
Finance Cost vs. Interest Cover Ratio
Finance Cost
Interest Cover Ratio
0
400
800
1,200
1,600
07/08 08/09 09/10 10/11 11/120
1
2
3
5
4
6
Rs. Mn.
1.4
0.9
2.0
4.3
5.0
Segmental Profit Composition
2010/2011
-10
10
20
30
40
60
50
59
(3)
24
13
8
(1)
30
7
36
17
7
3
Ser
vice
s
Pla
ntat
ions
Ret
ail
Rub
ber
2011/2012
Pla
stic
Tyre
%
0
48 Richard Pieris and Company PLC | Annual Report 2011/2012
Financial Review Contd.
Retail Sectorthe retail sector was the highest contributor to Group Profits,
accounting for 36%, which is an impressive performance
considering its’ contribution was merely 24% last year. With its
high profitability, the sector was able to emerge victorious by
beating the plantation sector, which was the highest contributor
to Group Profit in the previous financial year.
In absolute terms, the operating Profit of the retail sector was
recorded at Rs. 1,438 mn, having grown by 74%, which included
a part of capital gain arising from the Group disposal of its stakes
in Asian Alliance Insurance PLC. the sector’s concentrated
efforts towards maintaining the proper balance within the product
mix (FMCG, GM and Furniture) was another crucial factor that
contributed towards this victory.
Plantation Sectorthe plantation sector, which had been crowned as the best
performing sector in the previous financial year, experienced a dip
in profitability of 40% to Rs. 1,217 mn during the financial year
under review, and accounted only for 30% of Group operating
Profit. the primary reason behind such dip was the hike in labour
wage rates following a collective agreement, which had an impact
of approximately Rs. 247 mn on sector profits, as non-recurring
gratuity provision.
Plastic Sectorthe plastic sector accounted for 17% of total Profit and emerged
as the third largest contributor of all segments. Its operating Profit
grew by 44% during the year, while operating Profit Margins
improved from 12% in the financial year 2010/11 to 13.4% in
the financial year 2011/12. Its impressive performance resulted
primarily from the synergetic effects of the merger between
the sector’s mattress production and PVC pipe production
companies, while cost efficient production methods, efficient
procurement and better working capital management also made
a considerable positive impact.
Tyre Sectorthe Group’s tyre sector recorded growth of 14% in terms of
its Profits over the year and reached Rs. 300 mn, although the
increase in energy prices together with the currency devaluation
slowed its growth of profitability.
Rubber SectorDuring the financial year 2011/12, the rubber sector emerged as
the best sector in terms of growth, with its operating Profit rising
by over 665%. this growth meant that the sector was successful
in converting its loss of Rs. 25 mn in the financial year 2010/11
to a profit of Rs. 139 mn during the financial year 2011/12. the
sector’s performance exceeded expectations in spite of the
crises looming over the western world, and was mainly supported
by the low prices of raw material, the devaluation of the local
currency and the conversion towards the use of efficient energy
sources. the cumulative effect of these developments was the
improvement of the sector’s Profit Margin from -1% to 6%.
Finance Costthe decision of the Central Bank of sri Lanka to tighten its hold
on the monetary policy following the significant decline in Gross
official Reserve due to its continuous intervention to maintain
the currency peg, resulted in policy rates being increased by 50
basis points in February 2012 while a ceiling of 18% was placed
on the credit growth of the banking sector. these developments
resulted in interest rates increasing across all maturities during
the year, with AWPLR, which indicates the cost of borrowing
for corporates, standing at 12.4% as at end of March 2012
compared to 9.2% in the previous year.
Due to such changes in policy measures, the Finance Cost
reported on the face of Income statement of the Group remains
largely unchanged from the previous year at Rs. 794Mn, despite
the debt of the Group being reduced by almost Rs. 500 mn. this
high Finance Cost was also affected by the Group’s decision
to categorise Finance Income under other operating Income
instead of setting it off against the Finance Cost.
Finance Income of the Group was recorded at Rs. 275 mn for
the year, while the same was recorded at Rs. 134 mn in the
previous year. the 105% growth of Finance Income was mainly
due to an increase in the cash balance from Rs. 2,564 mn to
Rs.3,446 mn. Meanwhile the net Finance Cost declined from
Rs. 661 mn in 2010/11 to Rs. 519 mn in 2011/12, at a negative
growth of 21%.
For the year, the interest cover for the Group improved from 5
times to 8 times based on net Finance Cost, while based on
Finance Cost reported on the face of the Income statement the
interest cover improved from 4 times to 5 times. eBItDA for the
current year is 3 times of the Group’s net Debt serviceable within
a year, signaling the strong position of the Group in terms of
liquidity and solvency.
Share of Associatesthe associate’s share of the Group comprised of the 25%
stake in Asian Alliance Insurance PLC which was disposed in
49 Richard Pieris and Company PLC | Annual Report 2011/2012
september 2011, and the 19% stake in Aen Palm oil Limited.
Accordingly, the share of profits of associates for the Group stood
at Rs. 62 mn compared to Rs. 113 mn in the previous year.
Profits/Loss on Discontinued Operationsthe loss from discontinued operations for the Group reduced
from Rs.12 mn to Rs.4.4 mn during the year, due to the reduction
in fixed costs.
Minority Interestsince the losses compounded by lower tea prices, labour wage
revisions and lower crop due to adverse weather conditions
depleted the sound profit posted by the rubber and palm oil
segments in the plantation sector, the Minority Interest also
reduced from Rs. 460 mn to Rs.222 mn during the year,
recording a significant drop of 52%.
Investments/Acquisitions and Disposalthe most significant disposal made by the Group during the year
was its disposal of the 25% stake in Asian Alliance Insurance
PLC, which was made for a consideration of Rs. 1,125 mn,
yielding a capital gain of Rs. 717 mn.
several important investments were also made by the Group
during the year. Accordingly, to strengthen the Group’s identity
in the financial services industry, the Group invested Rs. 500 mn
in a life insurance business under the name of Arpico Insurance
Limited. the expected economic boom, increase in per capita
income and the low level of penetration in life insurance business
in sri Lanka has made the Group optimistic about the future
outlook of this investment.
the Group also invested Rs. 35 mn in its stock broking company
to strength their capital base and liquidity position. Richard
Pieris securities has successfully completed their first year of
operations with satisfactory level of profits despite the setback
experienced in the capital market, especially during the latter
part of the financial year. With the expected economic growth
and the expected foreign participation in direct investment, the
Group is highly confident that the company will reach superlative
performance levels in the near future.
In addition to above investments, the Group continued to invest
in its most lucrative sector, retail. Accordingly, the year witnessed
the opening of three new large format retail outlets and a few
more showrooms. Further, despite the losses of the tea segment,
the plantation sector also continued its investments in replanting,
with a view to improve the yield as well as the production.
Group Financial Position and LiquidityNon Current Assetsthe non-current assets of the Group increased from Rs. 11,585
mn to Rs.11,936 mn at a growth of 3% during the year and
represents 58% of total assets. Key contributors to this growth
were the retail sector, at Rs. 538 mn, due to expansion in
retail outlets and the plantation sector, at Rs. 576 mn, due to
replanting. the rise is also attributable to the Group’s continued
investments in property, plant and equipment, which grew by 7%
and accordingly accounted for 47% of total assets by the year
end.
While the Group’s investments in associates declined by Rs.
382 mn following the disposal of its 25% stake in Asian Alliance
Insurance PLC, the market value of the Group’s real estate rose
by Rs. 812 mn to reach Rs. 10,530, details of which are given on
page 124.
Working CapitalDuring the year, the current assets of the Group increased
by 21% to reach Rs. 10,967 mn, while an 11% increase was
observed in current liabilities, which reached Rs. 9,839 mn.
Inventory increased by Rs. 267 mn, more than adequately off-
setting the increase in trade payables of Rs.947 mn. the trade
receivable balance also increased to Rs.3,675 mn, following
the hefty growth in turnover and the expansion of Group’s
operations. Accordingly, by the year-end, the total current assets
of the Group accounted for 48% of its total assets while total
current liabilities accounted for 43% of total assets.
the Group’s timely and forward looking strategies in terms of
efficient working capital management, maintenance of strong
cash profits, divestment of investments and selective expansion
led cash and cash equivalents to increase to Rs. 3,446 mn by
the year-end, while the net working capital investment stood
at Rs. 1,128 mn, growing by 508% compared to the previous
financial year. Although the current ratio from of the Group
improved from 1.02 to 1.11 and the acid test ratio improved
from 0.64 to 0.75, both were below the targets of 2 and 1,
respectively. nevertheless, the management is determined to
achieve these targets by the end of next financial year.
Cash FlowsWhile the cash profit after working capital movement stood
at Rs. 3,774 mn, the rise in the tax payment of the Group
by approximately 100% due to higher dividend payment and
increased level of profits led to a 30% decline in the cash flow
from operating activities.
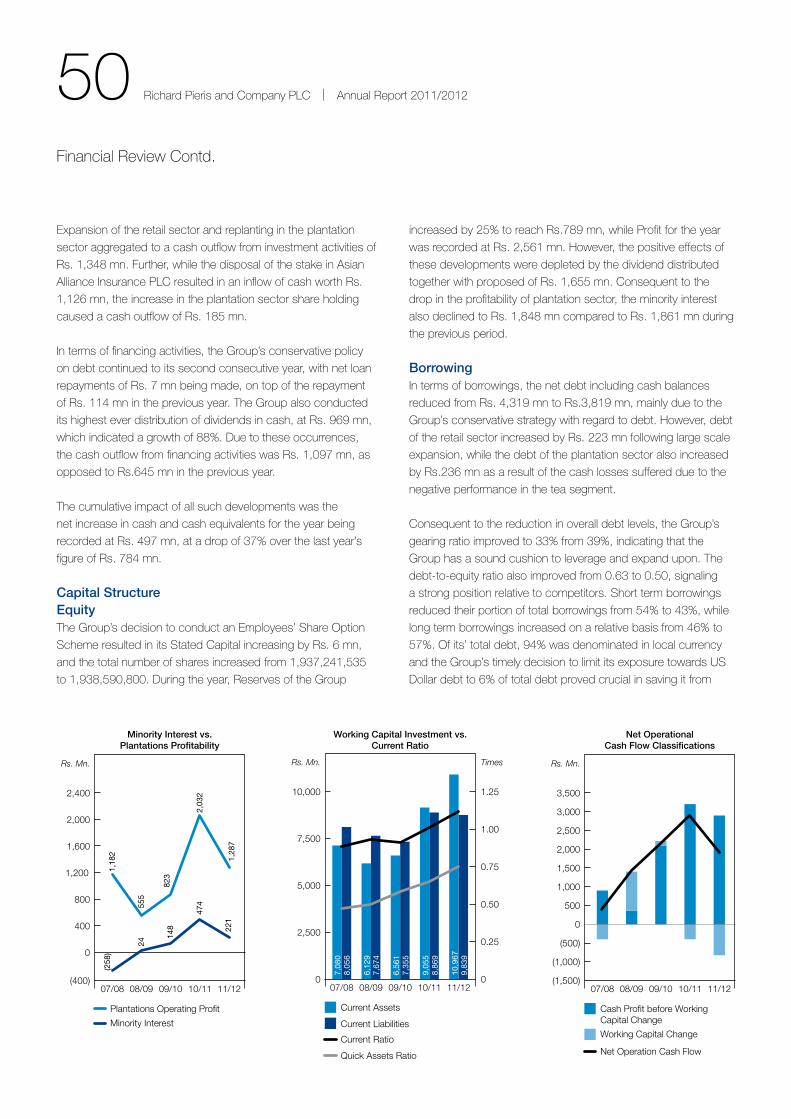
50 Richard Pieris and Company PLC | Annual Report 2011/2012
Financial Review Contd.
expansion of the retail sector and replanting in the plantation
sector aggregated to a cash outflow from investment activities of
Rs. 1,348 mn. Further, while the disposal of the stake in Asian
Alliance Insurance PLC resulted in an inflow of cash worth Rs.
1,126 mn, the increase in the plantation sector share holding
caused a cash outflow of Rs. 185 mn.
In terms of financing activities, the Group’s conservative policy
on debt continued to its second consecutive year, with net loan
repayments of Rs. 7 mn being made, on top of the repayment
of Rs. 114 mn in the previous year. the Group also conducted
its highest ever distribution of dividends in cash, at Rs. 969 mn,
which indicated a growth of 88%. Due to these occurrences,
the cash outflow from financing activities was Rs. 1,097 mn, as
opposed to Rs.645 mn in the previous year.
the cumulative impact of all such developments was the
net increase in cash and cash equivalents for the year being
recorded at Rs. 497 mn, at a drop of 37% over the last year’s
figure of Rs. 784 mn.
Capital StructureEquitythe Group’s decision to conduct an employees’ share option
scheme resulted in its stated Capital increasing by Rs. 6 mn,
and the total number of shares increased from 1,937,241,535
to 1,938,590,800. During the year, Reserves of the Group
increased by 25% to reach Rs.789 mn, while Profit for the year
was recorded at Rs. 2,561 mn. However, the positive effects of
these developments were depleted by the dividend distributed
together with proposed of Rs. 1,655 mn. Consequent to the
drop in the profitability of plantation sector, the minority interest
also declined to Rs. 1,848 mn compared to Rs. 1,861 mn during
the previous period.
BorrowingIn terms of borrowings, the net debt including cash balances
reduced from Rs. 4,319 mn to Rs.3,819 mn, mainly due to the
Group’s conservative strategy with regard to debt. However, debt
of the retail sector increased by Rs. 223 mn following large scale
expansion, while the debt of the plantation sector also increased
by Rs.236 mn as a result of the cash losses suffered due to the
negative performance in the tea segment.
Consequent to the reduction in overall debt levels, the Group’s
gearing ratio improved to 33% from 39%, indicating that the
Group has a sound cushion to leverage and expand upon. the
debt-to-equity ratio also improved from 0.63 to 0.50, signaling
a strong position relative to competitors. short term borrowings
reduced their portion of total borrowings from 54% to 43%, while
long term borrowings increased on a relative basis from 46% to
57%. of its’ total debt, 94% was denominated in local currency
and the Group’s timely decision to limit its exposure towards Us
Dollar debt to 6% of total debt proved crucial in saving it from
1,18
2(2
58)
555
24
823
148
2,03
247
4
1,28
722
1
Minority Interest vs. Plantations Profitability
Plantations Operating Profit
Minority Interest
(400)
800
1,200
400
0
1,600
2,000
2,400
07/08 08/09 09/10 10/11 11/12
Rs. Mn.
Working Capital Investment vs. Current Ratio
Current Assets
Current Liabilities
Current Ratio
Quick Assets Ratio
0
2,500
5,000
7,500
10,000
07/08 08/09 09/10 10/11 11/120
0.25
0.50
0.75
1.00
1.25
Rs. Mn. Times
7,08
0
6,12
9
6,56
1
9,05
5
10,9
67
8,05
6
7,67
4
7,35
5
8,86
9
9,83
9
Net Operational Cash Flow Classifications
Cash Profit before Working Capital Change
Working Capital Change
Net Operation Cash Flow
(1,500)
(1,000)
(500)
0
500
1,000
1,500
2,000
2,500
3,000
3,500
07/08 08/09 09/10 10/11 11/12
Rs. Mn.
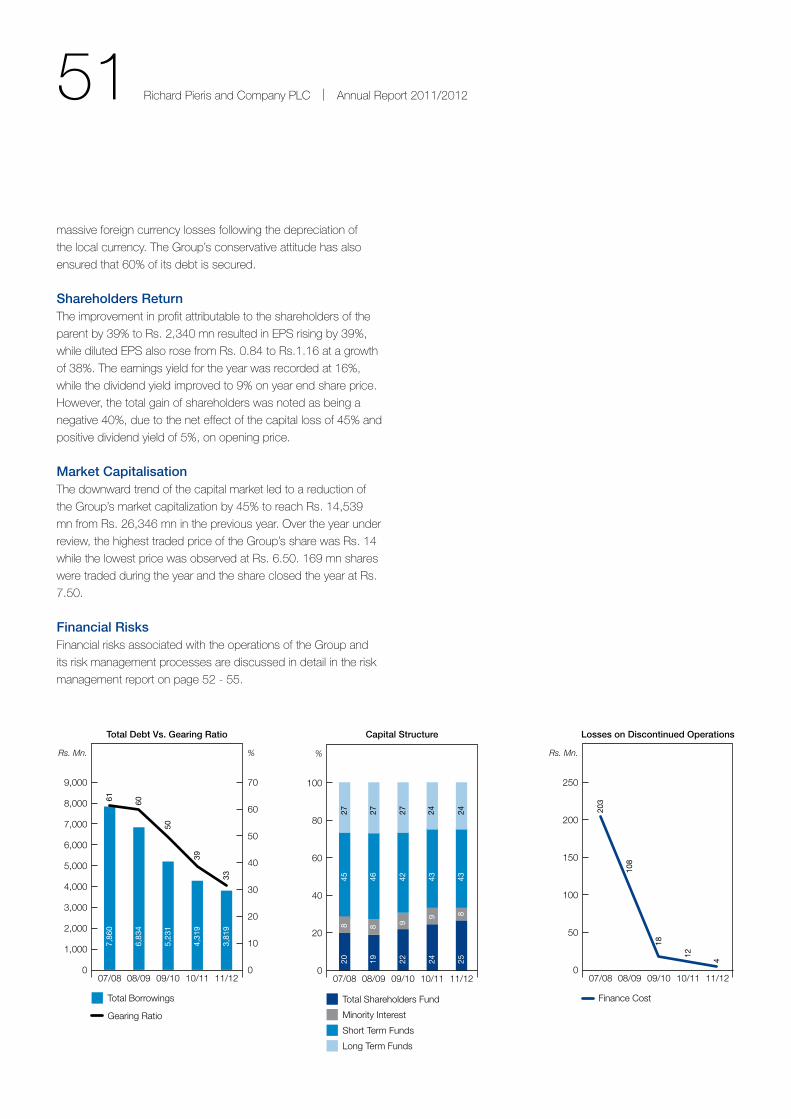
51 Richard Pieris and Company PLC | Annual Report 2011/2012
massive foreign currency losses following the depreciation of
the local currency. the Group’s conservative attitude has also
ensured that 60% of its debt is secured.
Shareholders Returnthe improvement in profit attributable to the shareholders of the
parent by 39% to Rs. 2,340 mn resulted in ePs rising by 39%,
while diluted ePs also rose from Rs. 0.84 to Rs.1.16 at a growth
of 38%. the earnings yield for the year was recorded at 16%,
while the dividend yield improved to 9% on year end share price.
However, the total gain of shareholders was noted as being a
negative 40%, due to the net effect of the capital loss of 45% and
positive dividend yield of 5%, on opening price.
Market Capitalisationthe downward trend of the capital market led to a reduction of
the Group’s market capitalization by 45% to reach Rs. 14,539
mn from Rs. 26,346 mn in the previous year. over the year under
review, the highest traded price of the Group’s share was Rs. 14
while the lowest price was observed at Rs. 6.50. 169 mn shares
were traded during the year and the share closed the year at Rs.
7.50.
Financial RisksFinancial risks associated with the operations of the Group and
its risk management processes are discussed in detail in the risk
management report on page 52 - 55.
7,86
0
6,83
4
5,23
1
4,31
9
Total Debt Vs. Gearing Ratio
Total Borrowings
Gearing Ratio
0
2,000
1,000
3,000
5,000
7,000
8,000
4,000
6,000
9,000
07/08 08/09 09/10 10/11 11/120
10
20
30
50
40
70
Rs. Mn. %
60
3,81
9
61 60
50
39
33
Capital Structure
Total Shareholders Fund
Minority Interest
Short Term Funds
Long Term Funds
0
20
40
60
80
100
07/08 08/09 09/10 10/11 11/12
%
20 19 22 24 25
8 8 9
9 8
45 46 42 43 43
27 27 27 24 24 203
108
18
12
4
Losses on Discontinued Operations
Finance Cost
0
100
50
150
200
250
07/08 08/09 09/10 10/11 11/12
Rs. Mn.
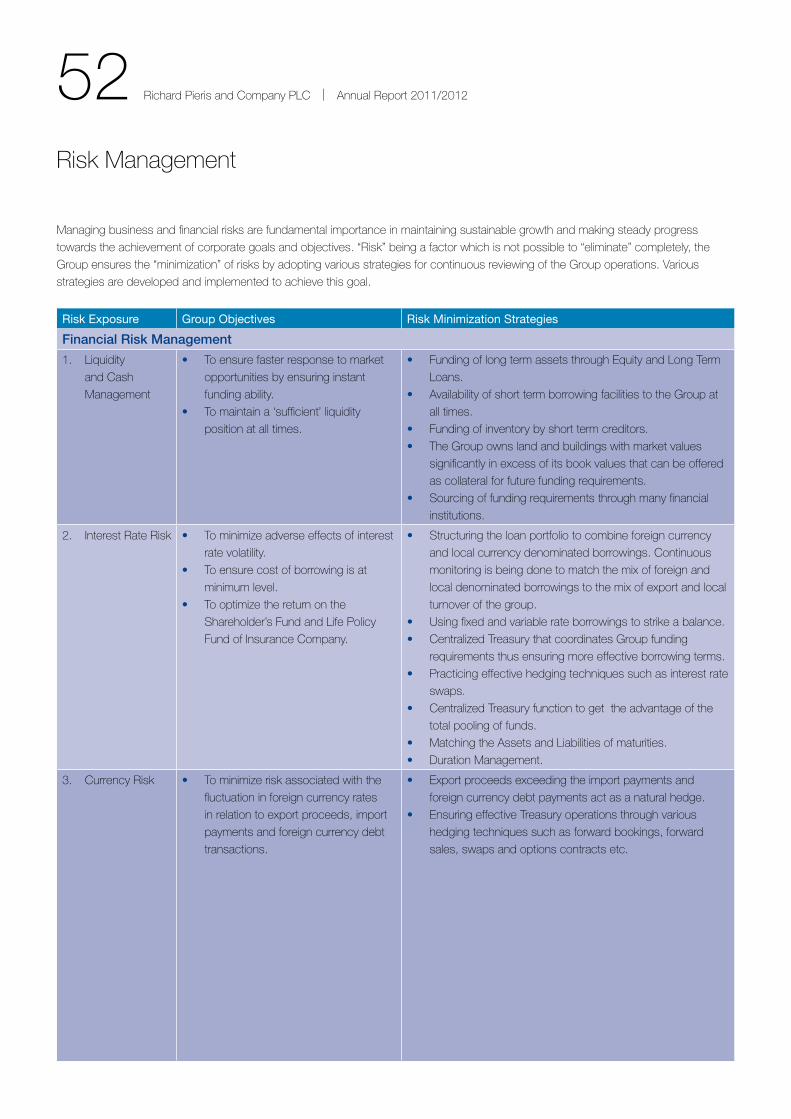
52 Richard Pieris and Company PLC | Annual Report 2011/2012
Managing business and financial risks are fundamental importance in maintaining sustainable growth and making steady progress
towards the achievement of corporate goals and objectives. “Risk” being a factor which is not possible to “eliminate” completely, the
Group ensures the “minimization” of risks by adopting various strategies for continuous reviewing of the Group operations. Various
strategies are developed and implemented to achieve this goal.
Risk Exposure Group Objectives Risk Minimization Strategies
Financial Risk Management
1. Liquidity
and Cash
Management
• to ensure faster response to market
opportunities by ensuring instant
funding ability.
• to maintain a ‘sufficient’ liquidity
position at all times.
• Funding of long term assets through equity and Long term
Loans.
• Availability of short term borrowing facilities to the Group at
all times.
• Funding of inventory by short term creditors.
• the Group owns land and buildings with market values
significantly in excess of its book values that can be offered
as collateral for future funding requirements.
• sourcing of funding requirements through many financial
institutions.
2. Interest Rate Risk • to minimize adverse effects of interest
rate volatility.
• to ensure cost of borrowing is at
minimum level.
• to optimize the return on the
shareholder’s Fund and Life Policy
Fund of Insurance Company.
• structuring the loan portfolio to combine foreign currency
and local currency denominated borrowings. Continuous
monitoring is being done to match the mix of foreign and
local denominated borrowings to the mix of export and local
turnover of the group.
• Using fixed and variable rate borrowings to strike a balance.
• Centralized treasury that coordinates Group funding
requirements thus ensuring more effective borrowing terms.
• Practicing effective hedging techniques such as interest rate
swaps.
• Centralized treasury function to get the advantage of the
total pooling of funds.
• Matching the Assets and Liabilities of maturities.
• Duration Management.
3. Currency Risk • to minimize risk associated with the
fluctuation in foreign currency rates
in relation to export proceeds, import
payments and foreign currency debt
transactions.
• export proceeds exceeding the import payments and
foreign currency debt payments act as a natural hedge.
• ensuring effective treasury operations through various
hedging techniques such as forward bookings, forward
sales, swaps and options contracts etc.
Risk Management
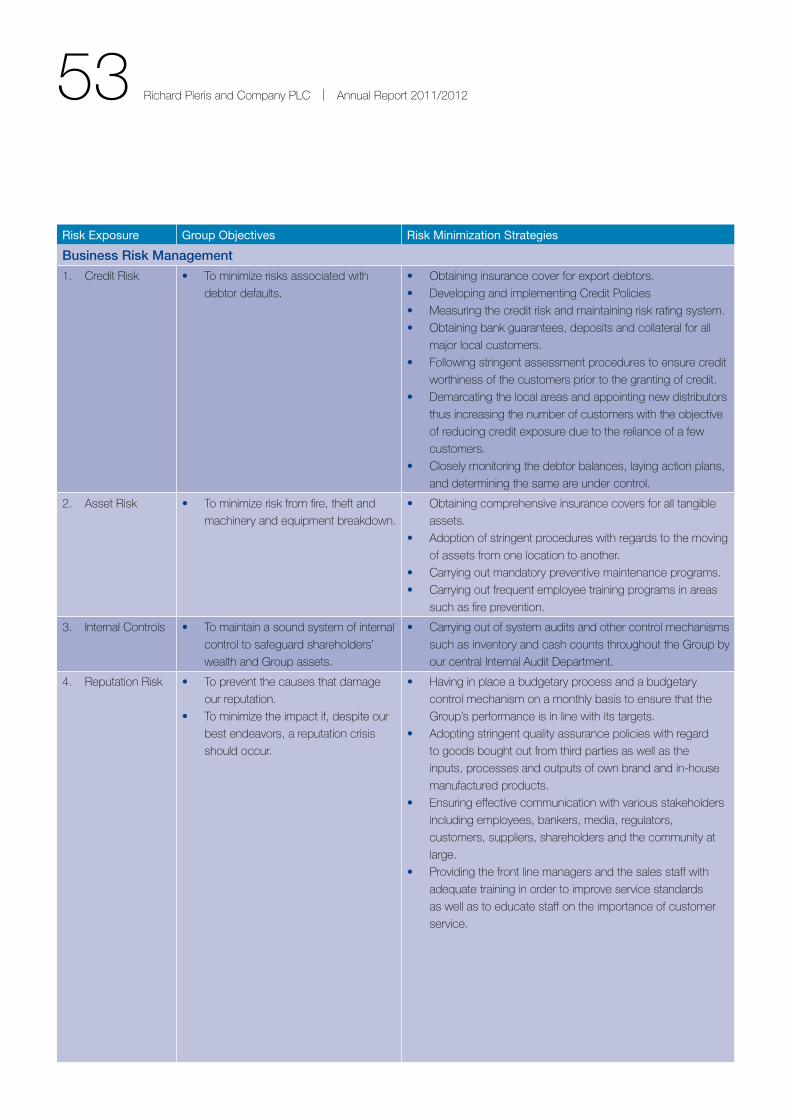
53 Richard Pieris and Company PLC | Annual Report 2011/2012
Risk Exposure Group Objectives Risk Minimization Strategies
Business Risk Management
1. Credit Risk • to minimize risks associated with
debtor defaults.
• obtaining insurance cover for export debtors.
• Developing and implementing Credit Policies
• Measuring the credit risk and maintaining risk rating system.
• obtaining bank guarantees, deposits and collateral for all
major local customers.
• Following stringent assessment procedures to ensure credit
worthiness of the customers prior to the granting of credit.
• Demarcating the local areas and appointing new distributors
thus increasing the number of customers with the objective
of reducing credit exposure due to the reliance of a few
customers.
• Closely monitoring the debtor balances, laying action plans,
and determining the same are under control.
2. Asset Risk • to minimize risk from fire, theft and
machinery and equipment breakdown.
• obtaining comprehensive insurance covers for all tangible
assets.
• Adoption of stringent procedures with regards to the moving
of assets from one location to another.
• Carrying out mandatory preventive maintenance programs.
• Carrying out frequent employee training programs in areas
such as fire prevention.
3. Internal Controls • to maintain a sound system of internal
control to safeguard shareholders’
wealth and Group assets.
• Carrying out of system audits and other control mechanisms
such as inventory and cash counts throughout the Group by
our central Internal Audit Department.
4. Reputation Risk • to prevent the causes that damage
our reputation.
• to minimize the impact if, despite our
best endeavors, a reputation crisis
should occur.
• Having in place a budgetary process and a budgetary
control mechanism on a monthly basis to ensure that the
Group’s performance is in line with its targets.
• Adopting stringent quality assurance policies with regard
to goods bought out from third parties as well as the
inputs, processes and outputs of own brand and in-house
manufactured products.
• ensuring effective communication with various stakeholders
including employees, bankers, media, regulators,
customers, suppliers, shareholders and the community at
large.
• Providing the front line managers and the sales staff with
adequate training in order to improve service standards
as well as to educate staff on the importance of customer
service.
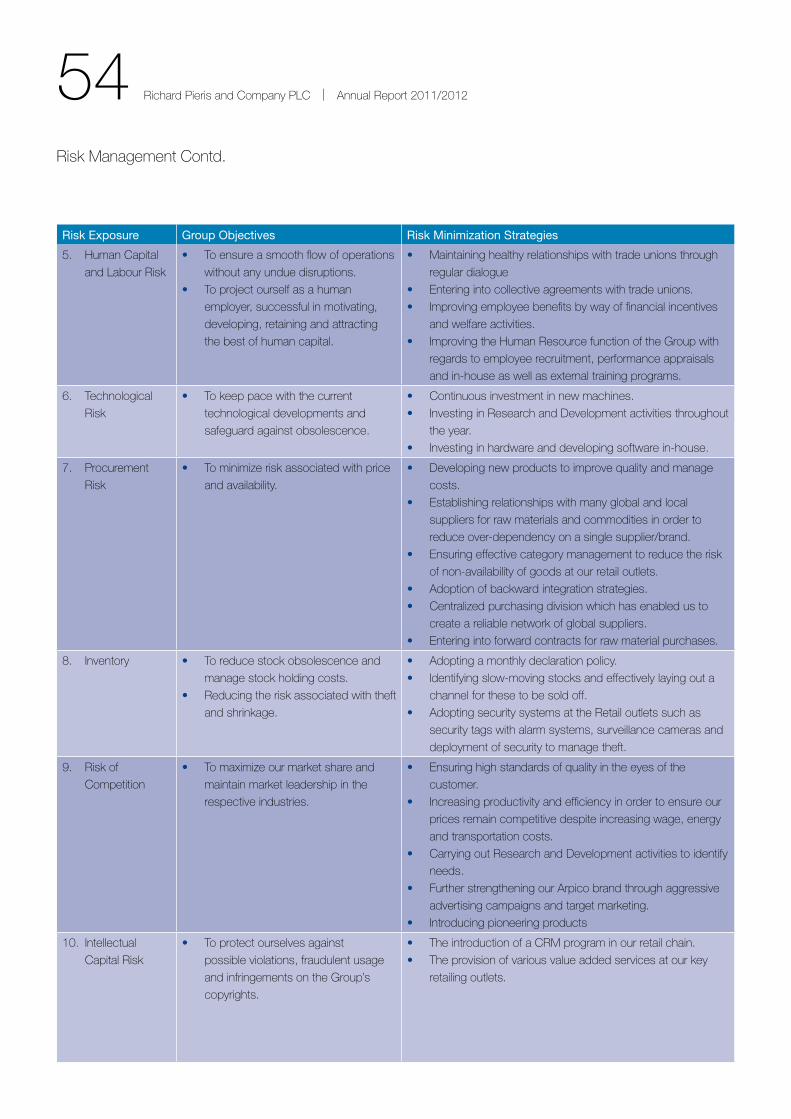
54 Richard Pieris and Company PLC | Annual Report 2011/2012
Risk Exposure Group Objectives Risk Minimization Strategies
5. Human Capital
and Labour Risk
• to ensure a smooth flow of operations
without any undue disruptions.
• to project ourself as a human
employer, successful in motivating,
developing, retaining and attracting
the best of human capital.
• Maintaining healthy relationships with trade unions through
regular dialogue
• entering into collective agreements with trade unions.
• Improving employee benefits by way of financial incentives
and welfare activities.
• Improving the Human Resource function of the Group with
regards to employee recruitment, performance appraisals
and in-house as well as external training programs.
6. technological
Risk
• to keep pace with the current
technological developments and
safeguard against obsolescence.
• Continuous investment in new machines.
• Investing in Research and Development activities throughout
the year.
• Investing in hardware and developing software in-house.
7. Procurement
Risk
• to minimize risk associated with price
and availability.
• Developing new products to improve quality and manage
costs.
• establishing relationships with many global and local
suppliers for raw materials and commodities in order to
reduce over-dependency on a single supplier/brand.
• ensuring effective category management to reduce the risk
of non-availability of goods at our retail outlets.
• Adoption of backward integration strategies.
• Centralized purchasing division which has enabled us to
create a reliable network of global suppliers.
• entering into forward contracts for raw material purchases.
8. Inventory • to reduce stock obsolescence and
manage stock holding costs.
• Reducing the risk associated with theft
and shrinkage.
• Adopting a monthly declaration policy.
• Identifying slow-moving stocks and effectively laying out a
channel for these to be sold off.
• Adopting security systems at the Retail outlets such as
security tags with alarm systems, surveillance cameras and
deployment of security to manage theft.
9. Risk of
Competition
• to maximize our market share and
maintain market leadership in the
respective industries.
• ensuring high standards of quality in the eyes of the
customer.
• Increasing productivity and efficiency in order to ensure our
prices remain competitive despite increasing wage, energy
and transportation costs.
• Carrying out Research and Development activities to identify
needs.
• Further strengthening our Arpico brand through aggressive
advertising campaigns and target marketing.
• Introducing pioneering products
10. Intellectual
Capital Risk
• to protect ourselves against
possible violations, fraudulent usage
and infringements on the Group’s
copyrights.
• the introduction of a CRM program in our retail chain.
• the provision of various value added services at our key
retailing outlets.
Risk Management Contd.

55 Richard Pieris and Company PLC | Annual Report 2011/2012
Risk Exposure Group Objectives Risk Minimization Strategies
11. Capital
Investments Risk
• to minimize risk of not meeting profit
expectations.
• Registering our brands and trade marks.
• successfully obtaining patents for manufactured radial tyres.
• Furthering our Arpico brand image through promotions and
advertising.
• Adopting a stringent approval procedure for Capital
expenditure based on the level of investment and the
expected pay back.
• Carrying out extensive feasibility studies for large scale
investments. external expertise is obtained wherever
required.
12. Information
systems Risk
• to minimize risk associated with
Data security, Hardware and
Communication and software.
• Maintaining of spare servers.
• Mirroring of hard disks with critical data.
• Data back-ups stored in off-site locations.
• Vendor agreements for support service and maintenance.
• Regular upgrading of Virus scanners, Firewalls etc.
• Compliance with statutory requirements for environmental
preservations.
• Carrying out Application Control Audits.
13. environmental,
Political and
Regulatory Risk
• to minimize the negative impact
from the changes in the external
environment which are beyond our
control.
• to Comply with the Regulatory
Requirements.
• Compliance with statutory requirements for all tax and other
payments.
• Prioritize the It requirements for reporting
• set up internal dead-lines for each criterion
• Meet the dead line for statutory Returns and review all
returns by Group Finance before the submission.
• Continuous dialogue with statutory bodies to get the
updated reporting requirements.
14. Underwriting Risk • to Minimize the Claims and to ensure
proper pricing.
• Assessing the risk exposed by accepting the policy and
carrying out proper ratings and loadings before underwriting
any policy.
• Adhering to the guide lines provided by reinsurer
• Referring any complicated matters to the reinsurer before
accepting the risk.
• Checking validity and accuracy of all the proofs given by the
client before accepting the risk.

56 Richard Pieris and Company PLC | Annual Report 2011/2012
the Group, whilst being proud to be in the elite league of
conglomerates that employ more than 28,000 employees,
firmly believes that the greatest strength that it possesses is its
people and their attributes, expertise, innovative and creative
thinking, challenging perspectives, boundless skills and collective
experience. thus attracting and retaining the best talent and
training and developing them in a free and delightful family
atmosphere has always been the utmost priority at Richard Pieris
Group. With the Group’s anti-discriminatory policy, it is committed
to build an exclusive work environment in which all employees
regardless of their nationality, race, religion, gender or age can
achieve their professional and personal commitments whilst
contributing to the success of the Group.
Training & Developmenttraining and Development of staff at all levels is an integral part
of Human Resource Management of the Group and it considers
that any spending on such training and development, in inherent
terms, as ‘investment’ in ‘human capital’.
Whilst training and development improves individual talents it
further helps retention of most treasured human talents within
the Group. the Group possesses a planned, methodical
structure and mechanism in identifying training needs of staff and
training & developing them across all companies and sectors.
Predominantly it focuses on delivering the training company wise
which then expands to sectors, based on the essential needs
of its employees and the Companies at different levels. the
training focuses on developing technical skills, soft skills, personal
development, and leadership qualities of staff. the Group also
carries out common programmes focusing fundamental attributes
across sectors with a mixed representation of companies to
enlighten and encourage the interaction among staff and share
experiences to develop synergies that benefit the Group.
the Human Resource Management policy focuses on grooming
internal talents to satisfy the increasing human resource
requirements at different levels prompted by the expanding
operations and diversifications. training provides a base to
facilitate this as well as internal promotions in line with structured
succession plan of the individual companies and the Group.
During the year, the Group has arranged an array of training
programs both locally and overseas conducted by acclaimed
trainers.
the Group continued to strengthen and enhance the training and
facilities at the RPC training school which primarily focuses on
the training of the retail sector staff that continuously carries out
skills and leadership training to operational staff of the business.
Performance Based Rewardsthe Group acknowledges that the employees have played
a pivotal role in the successes and achievements that it had
accomplished in its 80 year old history. thus, the strategic
human resource management policy of the Group embraces the
importance of recognising, appreciating and valuing employees
for their sincere contribution. the transparent and comprehensive
Performance Management system (PMs) which is in existence
in the Group for staff is aimed at enhancing performance
of employees and procuring the best of their abilities whilst
rewarding them accordingly.
the PMs is carried out with a top down approach across the
Group and we firmly believe that it increases performance,
productivity, quality, innovations, decision making process
which in return enables Richard Pieris Group to succeed in its
endeavours on a day to day basis. the Group continuously
thrives towards building and maintaining a high-performance
culture in all aspects whilst encouraging a work life balance
to employees through its integrated rewards and recognition
scheme applied for different sectors to appreciate the
contribution of the employees at different levels. the process
begins with a predetermined but dynamic set of Goals, objectives
and targets agreed between the leader and the team member
(Appraiser and the Appraisee) beginning of each financial year
with subsequent evaluations agreed at the beginning of the year.
Employees Recreational Activitiesthe company recognizes the significance of maintaining a steady
balance between work and personal life since a relaxed mind
enhances performance of employees whilst promoting innovative
ideas. this induces the Group to plan, organize and carry out
recreational activities in every possible way not disturbing the on
going operations but facilitating an increase in the satisfaction of
employees and delighting them with opportunities and benefits
whilst extending the same to their immediate families too. such
activities include staff outings, musical shows, sporting events
and festivals, competitions, employee’s trade exhibitions,
organising staff health camps as ongoing projects to sustain the
staff momentum of belonging to a balanced culture.
Industrial RelationsMaintenance of harmonious and peaceful relationship with
employees of all levels is critically significant to sustain a rapid
our People
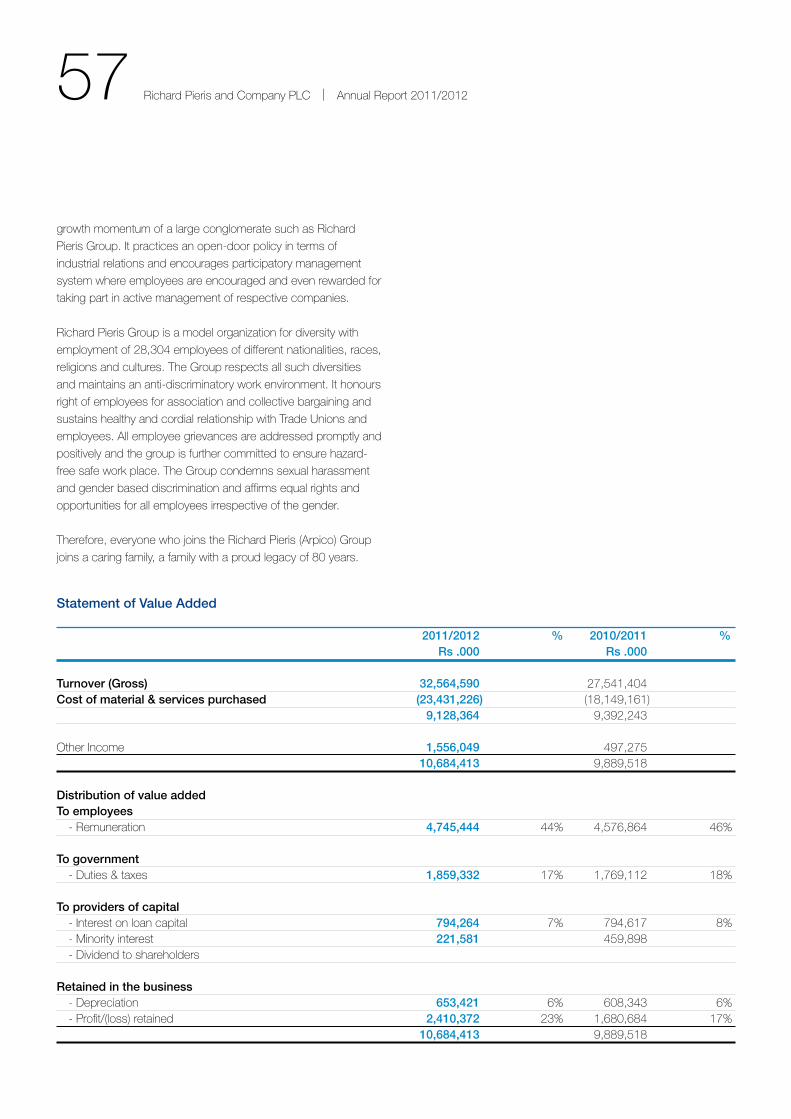
57 Richard Pieris and Company PLC | Annual Report 2011/2012
growth momentum of a large conglomerate such as Richard
Pieris Group. It practices an open-door policy in terms of
industrial relations and encourages participatory management
system where employees are encouraged and even rewarded for
taking part in active management of respective companies.
Richard Pieris Group is a model organization for diversity with
employment of 28,304 employees of different nationalities, races,
religions and cultures. the Group respects all such diversities
and maintains an anti-discriminatory work environment. It honours
right of employees for association and collective bargaining and
sustains healthy and cordial relationship with trade Unions and
employees. All employee grievances are addressed promptly and
positively and the group is further committed to ensure hazard-
free safe work place. the Group condemns sexual harassment
and gender based discrimination and affirms equal rights and
opportunities for all employees irrespective of the gender.
therefore, everyone who joins the Richard Pieris (Arpico) Group
joins a caring family, a family with a proud legacy of 80 years.
Statement of Value Added
2011/2012 % 2010/2011 % Rs .000 Rs .000
Turnover (Gross) 32,564,590 27,541,404Cost of material & services purchased (23,431,226) (18,149,161) 9,128,364 9,392,243
other Income 1,556,049 497,275 10,684,413 9,889,518
Distribution of value addedTo employees - Remuneration 4,745,444 44% 4,576,864 46%
To government - Duties & taxes 1,859,332 17% 1,769,112 18%
To providers of capital - Interest on loan capital 794,264 7% 794,617 8% - Minority interest 221,581 459,898 - Dividend to shareholders
Retained in the business - Depreciation 653,421 6% 608,343 6% - Profit/(loss) retained 2,410,372 23% 1,680,684 17% 10,684,413 9,889,518
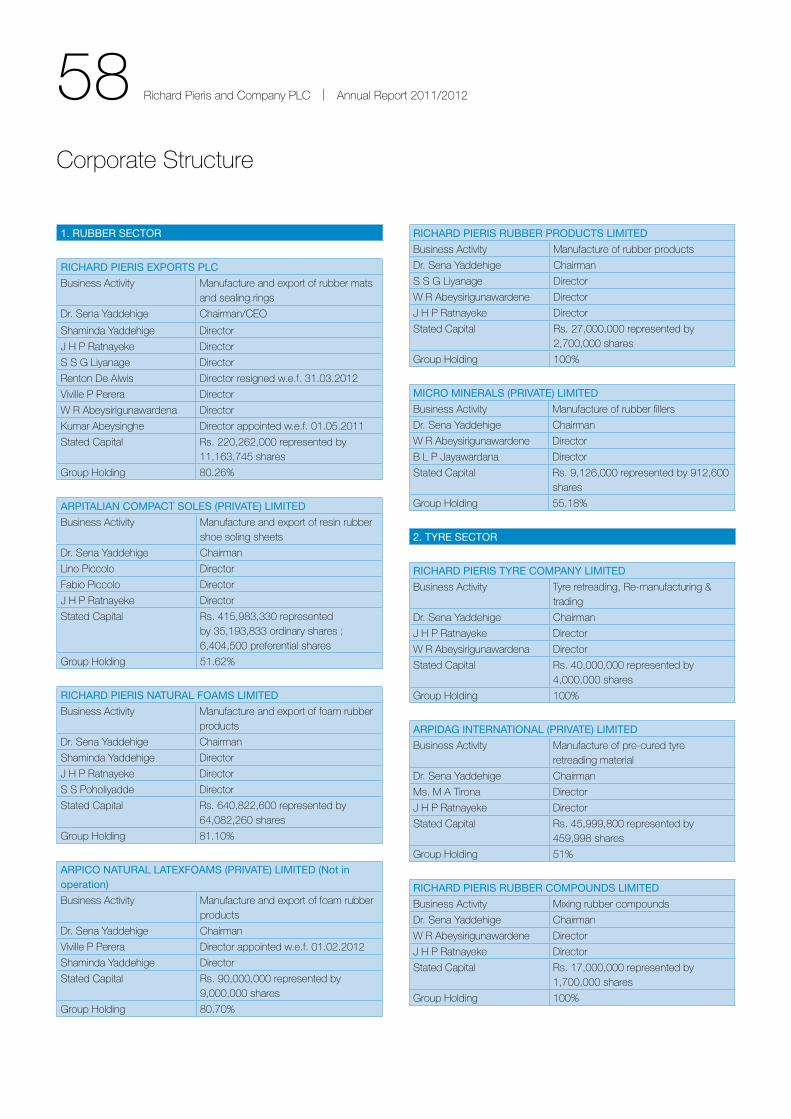
58 Richard Pieris and Company PLC | Annual Report 2011/2012
Corporate structure
1. RUBBER SECTOR
RICHARD PIERIS EXPORTS PLC
Business Activity Manufacture and export of rubber mats and sealing rings
Dr. sena Yaddehige Chairman/Ceo
shaminda Yaddehige Director
J H P Ratnayeke Director
s s G Liyanage Director
Renton De Alwis Director resigned w.e.f. 31.03.2012
Viville P Perera Director
W R Abeysirigunawardena Director
Kumar Abeysinghe Director appointed w.e.f. 01.05.2011
stated Capital Rs. 220,262,000 represented by 11,163,745 shares
Group Holding 80.26%
ARPITALIAN COMPACT SOLES (PRIVATE) LIMITED
Business Activity Manufacture and export of resin rubber shoe soling sheets
Dr. sena Yaddehige Chairman
Lino Piccolo Director
Fabio Piccolo Director
J H P Ratnayeke Director
stated Capital Rs. 415,983,330 represented by 35,193,833 ordinary shares ; 6,404,500 preferential shares
Group Holding 51.62%
RICHARD PIERIS NATURAL FOAMS LIMITED
Business Activity Manufacture and export of foam rubber products
Dr. sena Yaddehige Chairman
shaminda Yaddehige Director
J H P Ratnayeke Director
s s Poholiyadde Director
stated Capital Rs. 640,822,600 represented by 64,082,260 shares
Group Holding 81.10%
ARPICO NATURAL LATEXFOAMS (PRIVATE) LIMITED (Not in operation)
Business Activity Manufacture and export of foam rubber products
Dr. sena Yaddehige Chairman
Viville P Perera Director appointed w.e.f. 01.02.2012
shaminda Yaddehige Director
stated Capital Rs. 90,000,000 represented by 9,000,000 shares
Group Holding 80.70%
RICHARD PIERIS RUBBER PRODUCTS LIMITED
Business Activity Manufacture of rubber products
Dr. sena Yaddehige Chairman
s s G Liyanage Director
W R Abeysirigunawardene Director
J H P Ratnayeke Director
stated Capital Rs. 27,000,000 represented by 2,700,000 shares
Group Holding 100%
MICRO MINERALS (PRIVATE) LIMITED
Business Activity Manufacture of rubber fillers
Dr. sena Yaddehige Chairman
W R Abeysirigunawardene Director
B L P Jayawardana Director
stated Capital Rs. 9,126,000 represented by 912,600 shares
Group Holding 55.18%
2. TYRE SECTOR
RICHARD PIERIS TYRE COMPANY LIMITED
Business Activity tyre retreading, Re-manufacturing & trading
Dr. sena Yaddehige Chairman
J H P Ratnayeke Director
W R Abeysirigunawardena Director
stated Capital Rs. 40,000,000 represented by 4,000,000 shares
Group Holding 100%
ARPIDAG INTERNATIONAL (PRIVATE) LIMITED
Business Activity Manufacture of pre-cured tyre retreading material
Dr. sena Yaddehige Chairman
Ms. M A tirona Director
J H P Ratnayeke Director
stated Capital Rs. 45,999,800 represented by 459,998 shares
Group Holding 51%
RICHARD PIERIS RUBBER COMPOUNDS LIMITED
Business Activity Mixing rubber compounds
Dr. sena Yaddehige Chairman
W R Abeysirigunawardene Director
J H P Ratnayeke Director
stated Capital Rs. 17,000,000 represented by 1,700,000 shares
Group Holding 100%
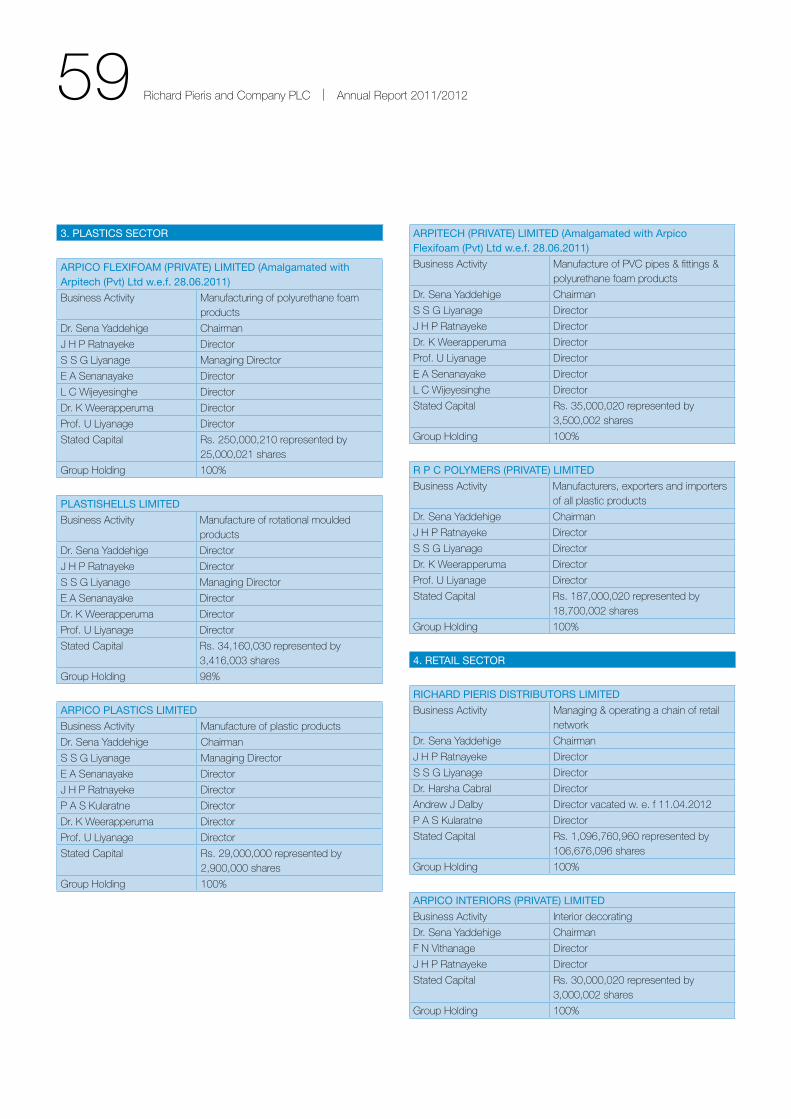
59 Richard Pieris and Company PLC | Annual Report 2011/2012
3. PLASTICS SECTOR
ARPICO FLEXIFOAM (PRIVATE) LIMITED (Amalgamated with Arpitech (Pvt) Ltd w.e.f. 28.06.2011)
Business Activity Manufacturing of polyurethane foam products
Dr. sena Yaddehige Chairman
J H P Ratnayeke Director
s s G Liyanage Managing Director
e A senanayake Director
L C Wijeyesinghe Director
Dr. K Weerapperuma Director
Prof. U Liyanage Director
stated Capital Rs. 250,000,210 represented by 25,000,021 shares
Group Holding 100%
PLASTISHELLS LIMITED
Business Activity Manufacture of rotational moulded products
Dr. sena Yaddehige Director
J H P Ratnayeke Director
s s G Liyanage Managing Director
e A senanayake Director
Dr. K Weerapperuma Director
Prof. U Liyanage Director
stated Capital Rs. 34,160,030 represented by 3,416,003 shares
Group Holding 98%
ARPICO PLASTICS LIMITED
Business Activity Manufacture of plastic products
Dr. sena Yaddehige Chairman
s s G Liyanage Managing Director
e A senanayake Director
J H P Ratnayeke Director
P A s Kularatne Director
Dr. K Weerapperuma Director
Prof. U Liyanage Director
stated Capital Rs. 29,000,000 represented by 2,900,000 shares
Group Holding 100%
ARPITECH (PRIVATE) LIMITED (Amalgamated with Arpico Flexifoam (Pvt) Ltd w.e.f. 28.06.2011)
Business Activity Manufacture of PVC pipes & fittings & polyurethane foam products
Dr. sena Yaddehige Chairman
s s G Liyanage Director
J H P Ratnayeke Director
Dr. K Weerapperuma Director
Prof. U Liyanage Director
e A senanayake Director
L C Wijeyesinghe Director
stated Capital Rs. 35,000,020 represented by 3,500,002 shares
Group Holding 100%
R P C POLYMERS (PRIVATE) LIMITED
Business Activity Manufacturers, exporters and importers of all plastic products
Dr. sena Yaddehige Chairman
J H P Ratnayeke Director
s s G Liyanage Director
Dr. K Weerapperuma Director
Prof. U Liyanage Director
stated Capital Rs. 187,000,020 represented by 18,700,002 shares
Group Holding 100%
4. RETAIL SECTOR
RICHARD PIERIS DISTRIBUTORS LIMITED
Business Activity Managing & operating a chain of retail network
Dr. sena Yaddehige Chairman
J H P Ratnayeke Director
s s G Liyanage Director
Dr. Harsha Cabral Director
Andrew J Dalby Director vacated w. e. f 11.04.2012
P A s Kularatne Director
stated Capital Rs. 1,096,760,960 represented by 106,676,096 shares
Group Holding 100%
ARPICO INTERIORS (PRIVATE) LIMITED
Business Activity Interior decorating
Dr. sena Yaddehige Chairman
F n Vithanage Director
J H P Ratnayeke Director
stated Capital Rs. 30,000,020 represented by 3,000,002 shares
Group Holding 100%
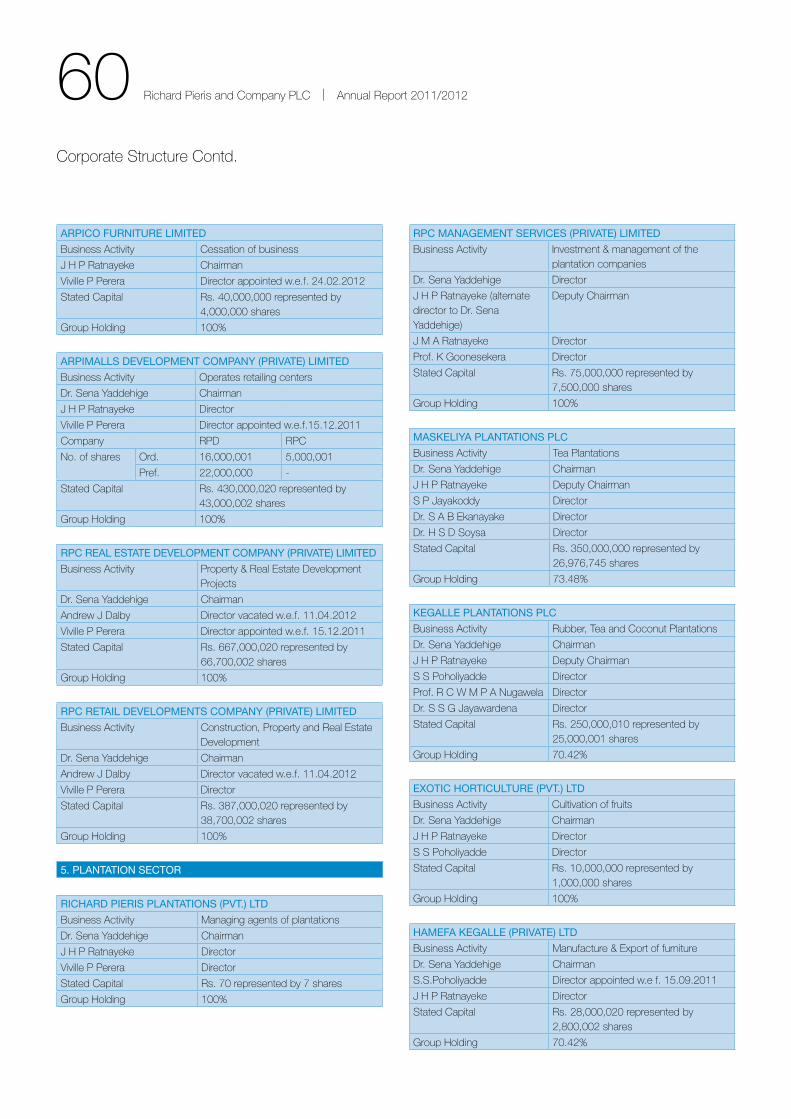
60 Richard Pieris and Company PLC | Annual Report 2011/2012
Corporate structure Contd.
ARPICO FURNITURE LIMITED
Business Activity Cessation of business
J H P Ratnayeke Chairman
Viville P Perera Director appointed w.e.f. 24.02.2012
stated Capital Rs. 40,000,000 represented by 4,000,000 shares
Group Holding 100%
ARPIMALLS DEVELOPMENT COMPANY (PRIVATE) LIMITED
Business Activity operates retailing centers
Dr. sena Yaddehige Chairman
J H P Ratnayeke Director
Viville P Perera Director appointed w.e.f.15.12.2011
Company RPD RPC
no. of shares ord. 16,000,001 5,000,001
Pref. 22,000,000 -
stated Capital Rs. 430,000,020 represented by 43,000,002 shares
Group Holding 100%
RPC REAL ESTATE DEVELOPMENT COMPANY (PRIVATE) LIMITED
Business Activity Property & Real estate Development Projects
Dr. sena Yaddehige Chairman
Andrew J Dalby Director vacated w.e.f. 11.04.2012
Viville P Perera Director appointed w.e.f. 15.12.2011
stated Capital Rs. 667,000,020 represented by 66,700,002 shares
Group Holding 100%
RPC RETAIL DEVELOPMENTS COMPANY (PRIVATE) LIMITED
Business Activity Construction, Property and Real estate Development
Dr. sena Yaddehige Chairman
Andrew J Dalby Director vacated w.e.f. 11.04.2012
Viville P Perera Director
stated Capital Rs. 387,000,020 represented by 38,700,002 shares
Group Holding 100%
5. PLANTATION SECTOR
RICHARD PIERIS PLANTATIONS (PVT.) LTD
Business Activity Managing agents of plantations
Dr. sena Yaddehige Chairman
J H P Ratnayeke Director
Viville P Perera Director
stated Capital Rs. 70 represented by 7 shares
Group Holding 100%
RPC MANAGEMENT SERVICES (PRIVATE) LIMITED
Business Activity Investment & management of the plantation companies
Dr. sena Yaddehige Director
J H P Ratnayeke (alternate director to Dr. sena Yaddehige)
Deputy Chairman
J M A Ratnayeke Director
Prof. K Goonesekera Director
stated Capital Rs. 75,000,000 represented by 7,500,000 shares
Group Holding 100%
MASKELIYA PLANTATIONS PLC
Business Activity tea Plantations
Dr. sena Yaddehige Chairman
J H P Ratnayeke Deputy Chairman
s P Jayakoddy Director
Dr. s A B ekanayake Director
Dr. H s D soysa Director
stated Capital Rs. 350,000,000 represented by 26,976,745 shares
Group Holding 73.48%
KEGALLE PLANTATIONS PLC
Business Activity Rubber, tea and Coconut Plantations
Dr. sena Yaddehige Chairman
J H P Ratnayeke Deputy Chairman
s s Poholiyadde Director
Prof. R C W M P A nugawela Director
Dr. s s G Jayawardena Director
stated Capital Rs. 250,000,010 represented by 25,000,001 shares
Group Holding 70.42%
EXOTIC HORTICULTURE (PVT.) LTD
Business Activity Cultivation of fruits
Dr. sena Yaddehige Chairman
J H P Ratnayeke Director
s s Poholiyadde Director
stated Capital Rs. 10,000,000 represented by 1,000,000 shares
Group Holding 100%
HAMEFA KEGALLE (PRIVATE) LTD
Business Activity Manufacture & export of furniture
Dr. sena Yaddehige Chairman
s.s.Poholiyadde Director appointed w.e f. 15.09.2011
J H P Ratnayeke Director
stated Capital Rs. 28,000,020 represented by 2,800,002 shares
Group Holding 70.42%
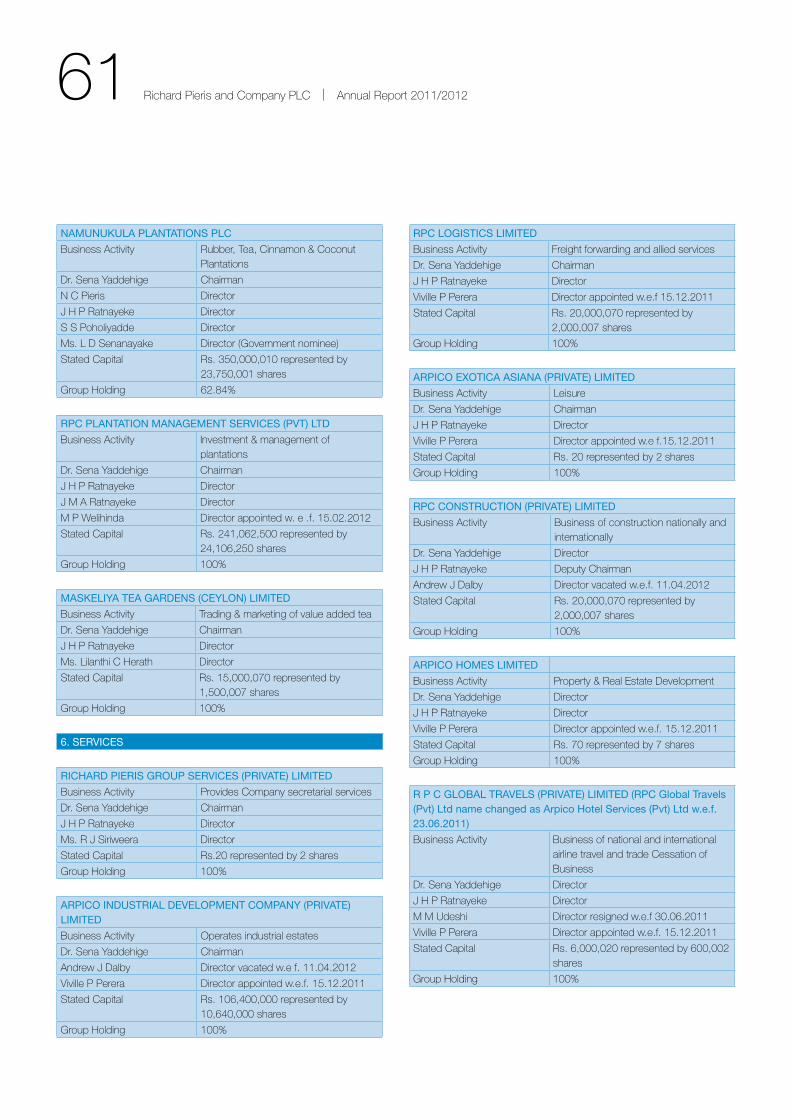
61 Richard Pieris and Company PLC | Annual Report 2011/2012
NAMUNUKULA PLANTATIONS PLC
Business Activity Rubber, tea, Cinnamon & Coconut Plantations
Dr. sena Yaddehige Chairman
n C Pieris Director
J H P Ratnayeke Director
s s Poholiyadde Director
Ms. L D senanayake Director (Government nominee)
stated Capital Rs. 350,000,010 represented by 23,750,001 shares
Group Holding 62.84%
RPC PLANTATION MANAGEMENT SERVICES (PVT) LTD
Business Activity Investment & management of plantations
Dr. sena Yaddehige Chairman
J H P Ratnayeke Director
J M A Ratnayeke Director
M P Welihinda Director appointed w. e .f. 15.02.2012
stated Capital Rs. 241,062,500 represented by 24,106,250 shares
Group Holding 100%
MASKELIYA TEA GARDENS (CEYLON) LIMITED
Business Activity trading & marketing of value added tea
Dr. sena Yaddehige Chairman
J H P Ratnayeke Director
Ms. Lilanthi C Herath Director
stated Capital Rs. 15,000,070 represented by 1,500,007 shares
Group Holding 100%
6. SERVICES
RICHARD PIERIS GROUP SERVICES (PRIVATE) LIMITED
Business Activity Provides Company secretarial services
Dr. sena Yaddehige Chairman
J H P Ratnayeke Director
Ms. R J siriweera Director
stated Capital Rs.20 represented by 2 shares
Group Holding 100%
ARPICO INDUSTRIAL DEVELOPMENT COMPANY (PRIVATE) LIMITED
Business Activity operates industrial estates
Dr. sena Yaddehige Chairman
Andrew J Dalby Director vacated w.e f. 11.04.2012
Viville P Perera Director appointed w.e.f. 15.12.2011
stated Capital Rs. 106,400,000 represented by 10,640,000 shares
Group Holding 100%
RPC LOGISTICS LIMITED
Business Activity Freight forwarding and allied services
Dr. sena Yaddehige Chairman
J H P Ratnayeke Director
Viville P Perera Director appointed w.e.f 15.12.2011
stated Capital Rs. 20,000,070 represented by 2,000,007 shares
Group Holding 100%
ARPICO EXOTICA ASIANA (PRIVATE) LIMITED
Business Activity Leisure
Dr. sena Yaddehige Chairman
J H P Ratnayeke Director
Viville P Perera Director appointed w.e f.15.12.2011
stated Capital Rs. 20 represented by 2 shares
Group Holding 100%
RPC CONSTRUCTION (PRIVATE) LIMITED
Business Activity Business of construction nationally and internationally
Dr. sena Yaddehige Director
J H P Ratnayeke Deputy Chairman
Andrew J Dalby Director vacated w.e.f. 11.04.2012
stated Capital Rs. 20,000,070 represented by 2,000,007 shares
Group Holding 100%
ARPICO HOMES LIMITED
Business Activity Property & Real estate Development
Dr. sena Yaddehige Director
J H P Ratnayeke Director
Viville P Perera Director appointed w.e.f. 15.12.2011
stated Capital Rs. 70 represented by 7 shares
Group Holding 100%
R P C GLOBAL TRAVELS (PRIVATE) LIMITED (RPC Global Travels (Pvt) Ltd name changed as Arpico Hotel Services (Pvt) Ltd w.e.f. 23.06.2011)
Business Activity Business of national and international airline travel and trade Cessation of Business
Dr. sena Yaddehige Director
J H P Ratnayeke Director
M M Udeshi Director resigned w.e.f 30.06.2011
Viville P Perera Director appointed w.e.f. 15.12.2011
stated Capital Rs. 6,000,020 represented by 600,002 shares
Group Holding 100%

62 Richard Pieris and Company PLC | Annual Report 2011/2012
Corporate structure Contd.
MARKRAY SYSTEMS (PRIVATE) LIMITED
Business Activity
Dr. sena Yaddehige Chairman
Viville P Perera Director appointed w.e.f. 15.12.2011
s Kalugala Director
stated Capital Rs. 20 represented by 2 shares
Group Holding 100%
RICHARD PIERIS SECURITIES (PRIVATE) LIMITED
Business Activity Carrying on the business of a stock-broker
Dr. sena Yaddehige Chairman
Andrew J Dalby Director vacated w.e.f. 11.04.2012
H J C Perera Director
n J K Disanayaka Director appointed w.e.f. 15.11.2011
Prof. Lakshman R Watawala Director resigned w.e.f. 01.06.2011
stated Capital Rs. 100,000,000 represented by 10,000,000 shares
Group Holding 100%
RICHARD PIERIS FINANCIAL SERVICES (PRIVATE) LIMITED
Business Activity Acting as margin providers
Dr. sena Yaddehige Chairman
Andrew J Dlaby Director vacated w.e.f. 11.04.2012
Viville P Perera Director
stated Capital Rs. 35,000,000 shares represented by 3,500,000 shares
Group Holding 100%
ARPICO INSURANCE (PRIVATE) LIMITED
Business Activity Life Insurance
Viville P Perera Director
n J K Disanayaka Director appointed w.e.f. 25.02.2012
stated Capital Rs. 503,000,000 represented by 50,300,000 shares
Group Holding 86.50%
63 Richard Pieris and Company PLC | Annual Report 2011/2012
Financial Information
Annual Report of the Board of Directors 64Corporate Governance 68Report of the Remuneration Committee 71Report of the Audit Committee 72Statement of Directors’ Responsibility 74Auditor’s Report 75Balance Sheet 76Income Statement 77Cash Flow Statement 78Statement of Changes in Equity 80Notes to the Financial Statements 81
64 Richard Pieris and Company PLC | Annual Report 2011/2012
Annual Report of the Board of Directors
the Directors of Richard Pieris and Company PLC are pleased
to present to their members the Annual Report together with the
audited financial statements of its Group and the Company, for
the year ended 31 March 2012.
the Directors approved the financial statements on 24th May
2012.
Principal Activities & Operational Review Richard Pieris and Company PLC is the holding company
that owns, directly and indirectly, investments in a number of
companies constituting the Richard Pieris Group. the principal
activities of the Group are described under the Group structure
on pages 58 - 62 of the report.
A review of the Group’s business and its performance during
the year, with comments on financial results and future
developments, is contained in the Chairman’s Review, sector
Reviews and the Financial Review of this Annual Report. the
measures taken by the Company to manage its risks are detailed
in the report titled Risk Management on pages 52 - 55 of this
report.
Future Developments the Group intends to continue to pursue a strategy of focusing
on its core business activities. In order to achieve this, the Group
will concentrate on enhancing the performance of it’s retail,
plantation, tyre, rubber and plastics business sectors. Further
information on future developments is provided in the Chairman’s
Review and sector Review of this report.
Group Revenue the turnover of the Group was Rs. 31.5 bn. A detailed analysis
of the Group’s turnover identifying the contributions from different
sectors is given in note 21 to the Financial statements. the
Group’s exports from sri Lanka were Rs. 2.8 bn. trade between
Group companies is conducted at fair market prices.
Results & Dividends Details relating to the Group profits are given in the table on Page
65. the Group reported a Profit after tax amounting to Rs. 2.56
bn.
Group InvestmentsInvestments made by the Group during the year is disclosed in
notes 5 and 8 to the Financial statements.
Property, Plant & Equipment Capital expenditure on property, plant, equipment and work-
in-progress incurred during the year under review amounted
to Rs. 1.46 bn. Information relating to this is given in note 3
to the Financial statements. Land is included as described
in Accounting Policies in the Financial statements. Capital
expenditure approved and contracted for after the year-end
is given in note 32 to the Financial statements. the value of
property stated in the Financial statements is not in excess of its
current market values.
Freehold PropertyA description of the property owned by the Group is shown
under the Group Real estate portfolio on page 124.
Stated Capital the stated capital of the Company as at 31 March 2012 was Rs.
1.63 bn. the details of the stated capital is given in note 9 to the
Financial statements.
Reserves total Group Reserves as at 31st March 2012 amount to Rs. 4.2
bn. (Rs. 3.4 bn as at 31 March 2011). the details of which are
given in notes 10, 11 and 12 to the Financial statements.
Corporate Donations Donations made by the Company and Group to charitable
organisations amounted to Rs. 0.2 mn and Rs. 2.95 mn
respectively.
Taxationthe general corporate income tax rate in effect during the year
was 28%. the rate of tax on qualified export profits was 12%.
Agricultural profits were taxed at 10%. Companies that enjoy tax
holiday status and other concessionary rates are listed in note 27
to the Financial statements.
In computing the Group’s tax liability, the maximum relief available
to investors under the provisions of the Inland Revenue Act has
been claimed.
It is the Group’s policy to provide for deferred taxation on all
known temporary differences, on the liability method.
Details on the Group’s exposure to taxation are disclosed in note
27 to the Financial statements.
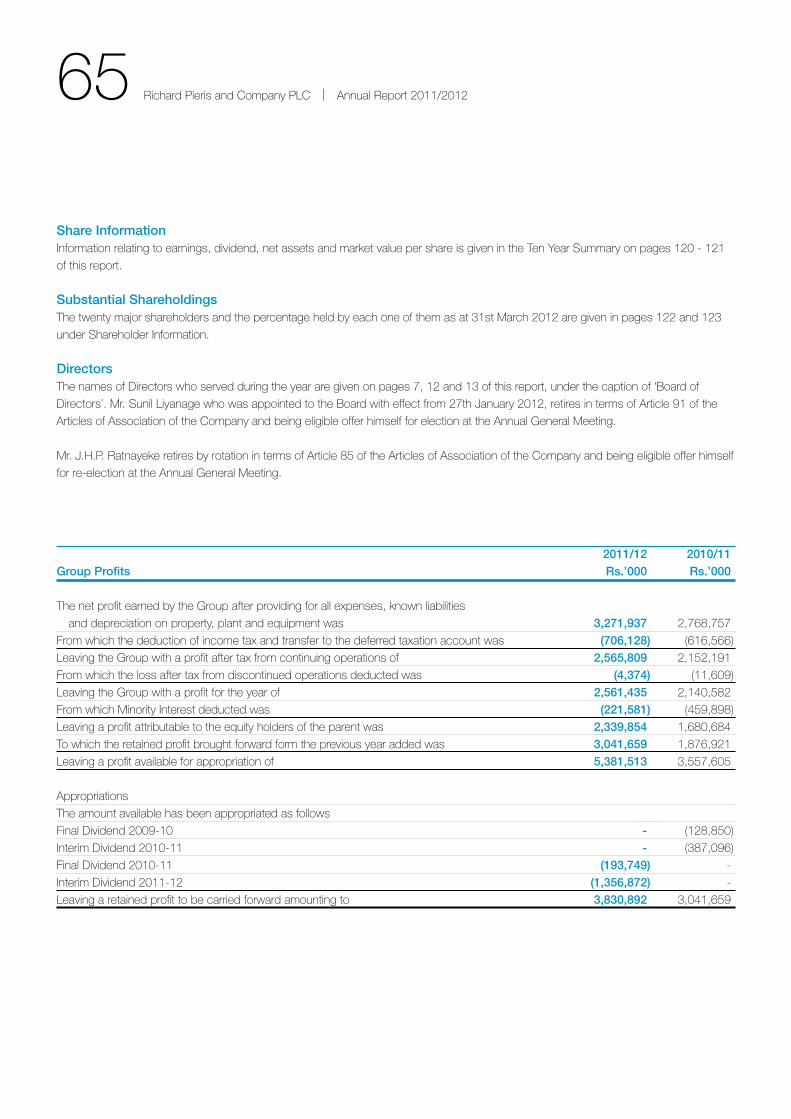
65 Richard Pieris and Company PLC | Annual Report 2011/2012
Share Information Information relating to earnings, dividend, net assets and market value per share is given in the ten Year summary on pages 120 - 121
of this report.
Substantial Shareholdings the twenty major shareholders and the percentage held by each one of them as at 31st March 2012 are given in pages 122 and 123
under shareholder Information.
Directors the names of Directors who served during the year are given on pages 7, 12 and 13 of this report, under the caption of ‘Board of
Directors’. Mr. sunil Liyanage who was appointed to the Board with effect from 27th January 2012, retires in terms of Article 91 of the
Articles of Association of the Company and being eligible offer himself for election at the Annual General Meeting.
Mr. J.H.P. Ratnayeke retires by rotation in terms of Article 85 of the Articles of Association of the Company and being eligible offer himself
for re-election at the Annual General Meeting.
2011/12 2010/11 Group Profits Rs.’000 Rs.’000
the net profit earned by the Group after providing for all expenses, known liabilities
and depreciation on property, plant and equipment was 3,271,937 2,768,757
From which the deduction of income tax and transfer to the deferred taxation account was (706,128) (616,566)
Leaving the Group with a profit after tax from continuing operations of 2,565,809 2,152,191
From which the loss after tax from discontinued operations deducted was (4,374) (11,609)
Leaving the Group with a profit for the year of 2,561,435 2,140,582
From which Minority Interest deducted was (221,581) (459,898)
Leaving a profit attributable to the equity holders of the parent was 2,339,854 1,680,684
to which the retained profit brought forward form the previous year added was 3,041,659 1,876,921
Leaving a profit available for appropriation of 5,381,513 3,557,605
Appropriations
the amount available has been appropriated as follows
Final Dividend 2009-10 - (128,850)
Interim Dividend 2010-11 - (387,096)
Final Dividend 2010-11 (193,749) -
Interim Dividend 2011-12 (1,356,872) -
Leaving a retained profit to be carried forward amounting to 3,830,892 3,041,659

66 Richard Pieris and Company PLC | Annual Report 2011/2012
Annual Report of the Board of Directors Contd.
Directors’ Interest in Contracts with the Company and the Interest RegisterDirectors’ interests in contracts or proposed contracts with the Company both direct and indirect are disclosed on page 66, 118 and
119. these interests have been declared at the meetings of directors. the directors have no direct or indirect interest in any other
contract or proposed contract of the Company. the Company maintains an interest register as required by the Companies’ Act no.
07 of 2007. Information pertaining to directors’ interest in contracts, their remuneration and their share ownership are disclosed in the
interest register.
Transactions with related undertakings Name of Position Transaction 2011/2012 2010/2011 Director Details Rs.mn Rs.mn Group Asia siyaka Commodities (Pvt) Ltd Mr. J.H.P. Ratnayeke Director Packing Materials 7.45 11.76
the list of Directors at each of the subsidiary and associate Companies have been disclosed in the group structure on page 58 to 62.
Directors’ ShareholdingDirectors’ shareholding in Richard Pieris and Company PLC is
stated in page 123.
Directors’ Interest in ContractsDirectors’ Interest in Contracts in relation to transactions with
related entities, transactions with Key Management Personnel
and other related disclosures are stated in note 35 (Related party
disclosures) to the financial statements. In addition, the Company
carried out transactions in the ordinary course of business with
the following entities having one or more directors in common
which is summarised above.
Directors’ RemunerationDirectors’ fees and emoluments, in respect of the Group and
the Company for the financial year ended 31st March 2012 are
disclosed in note 35.2 to the Financial statements.
Vision & Long Term Goals the Group’s Vision and Long term Goals are given in page 4 of
this report.
Environmental Protection the Company has not engaged in any activities detrimental to
the environment. the Group’s efforts in relation to environmental
protection are set out in the Corporate social Responsibility
Report in pages 42 - 44.
Employment Policies Group employment policies are based on recruiting the best
people, providing them training to enhance their skills, recognition
of innate skills and competencies of each individual while offering
equal career opportunities regardless of gender, race or religion
and to retain them with the Group as long as possible. the health
and safety of the employees has always received priority in the
HR agenda. the number of persons employed by the company
and its subsidiaries at the year end was 28,304.
Statutory Payments the Directors, to the best of their knowledge and belief are
satisfied that all statutory payments due to the Government and in
relation to employees have been made up to date.
Events Subsequent To the Balance Sheet Date there have not been any material events that occurred
subsequent to the Balance sheet Date that require disclosure
or adjustments to the Financial statements, other than those
disclosed if any, in note 34 to the Financial statements.
Board Committees the Board has appointed two sub-committees namely, the Audit
Committee and the Remuneration Committee. their compositions
and functions are given in pages 71 - 73 of the report.
Corporate Governance / Internal Control the Directors acknowledge their responsibility for the Group’s
corporate governance and the system of internal control. the
practices carried out by the Company in relation to corporate
governance and internal controls are explained in pages 68 - 70
of this report. the Board is satisfied with the effectiveness of the
system of internal control for the period up to the date of signing
the Financial statements.
67 Richard Pieris and Company PLC | Annual Report 2011/2012
Directors’ Responsibility for Financial Reporting the statement of Directors’ Responsibility for financial reporting of
the Company and the Group is set out in page 74 of this report.
Compliance with Other Laws & Regulationsthe Directors, to the best of their knowledge and belief, confirm
that the Group has not engaged in any activities that contravene
the laws and regulations applicable in sri Lanka. Financial
statements are published quarterly in line with the listing rules of
the Colombo stock exchange.
the Group will be adopting the new sri Lanka Accounting
standards (new sLAs) comprising LKAs and sLFRs applicable
for financial periods commencing from 01 April 2012 as issued
by the Institute of Chartered Accountants of sri Lanka. the Group
has commenced reviewing its accounting policies and financial
reporting in readiness for the transition. training activities were
conducted in house and members in finance divisions of Group
Companies have attended seminars conducted by the leading
accounting bodies in sri Lanka.
Annual General Meetingthe Annual General Meeting will be held at the Registered
office of the Company, no. 310, High Level Road, nawinna,
Maharagama, on 29th June 2012. the notice of the Annual
General Meeting is on page 130 of this report.
Auditors the Financial statements for the year have been audited by
Messrs. ernst & Young, Chartered Accountants.
In accordance with the Companies Act no. 7 of 2007, a
resolution proposing the re-appointment of Messrs. ernst &
Young, Chartered Accountants, as Auditors to the Company and
authorizing the Directors to fix their remuneration will be proposed
at the Annual General Meeting.
By order of the Board
W J Viville Perera J H P RatnayekeDirector Director
Richard Pieris Group Services (Pvt) LimitedSecretaries
no. 310, High Level Road,
nawinna, Maharagama.
24th May 2012

68 Richard Pieris and Company PLC | Annual Report 2011/2012
Corporate Governance
the Board of Directors of Richard Pieris and Company PLC
is committed and takes responsibility to maintain the highest
standards of Corporate Governance.
Richard Pieris’ has designed its Corporate Governance policies
and practices to ensure that the Company is focused on its
responsibilities to its stakeholders and on creating long term
shareholder value. the Company recognizes the interests of all
its stakeholders including shareholders, employees, customers,
suppliers, consumers and the other communities in which it
operates. the Group complies with the rules on Corporate
Governance, included in the Listing Rules of the Colombo stock
exchange, and is guided by the principles included in the Code
of Best Practice on Corporate Governance issued jointly by
the securities and exchange Commission of sri Lanka and the
Institute of Chartered Accountants of sri Lanka. this statement
sets out the Corporate Governance policies, practices and
processes adopted by the Board.
The Board and its Operationsthe Company is governed by its Board of Directors, who directs
and supervises the business and affairs of the Company on
behalf of the shareholders.
the Board comprises six Directors, of which four are executive
Directors whilst two are non-executive Directors who are
Independent, ensuring an independent outlook to temper the
expediency of the experts. Brief profiles of the Directors are
set out on pages 12 and 13. the Board has assessed the
independence of the non-executive Directors.
During the year the Board met on 5 occasions. Prior to each
meeting, the Directors are provided with all relevant management
information and background material relevant to the agenda
to enable informed decisions. Board Papers are submitted
in advance on group performance, new investments, capital
projects and other issues which require specific Board approval.
A separate information memorandum is provided on statutory
payments at each Board Meeting.
the Chairman, who is also the Chief executive officer, is
responsible for matters relating to policy, maintaining regular
contact with the other Directors, shareholders and external
stakeholders of the Company. He is responsible for all aspects
of the Group’s overall commercial, operational and strategic
development and assisted by the Group Director operations
and an executive Management Committee comprising executive
Directors and Heads of Companies of the strategic Business
Units (sBU). the Finance function devolves on the Group Chief
Financial officer, who is present by invitation at board meetings
when financial matters are discussed. the Board of Directors has
access to independent professional advice as and when deemed
necessary for decision making.
the main functions of the Board are to:
• Directthebusinessandaffairsofthecompany.
• Formulateshortandlongtermstrategies,asabasis
for the operational plans of the company and monitor
implementation.
• Reportontheirstewardshiptoshareholders.
• Identifytheprincipalrisksofthebusinessandensure
adequate risk management systems in place.
• Ensureinternalcontrolsareadequateandeffective.
• Approvetheannualcapitalandoperatingbudgetsand
review performance against budgets.
• Approvetheinterimandfinalfinancialstatementsofthe
group.
• Determineandrecommendinterimandfinaldividendsfor
the approval of shareholders.
• Ensurecompliancewithlawsandregulations.
• Sanctionallmaterialcontracts,acquisitionsordisposalof
assets and approve capital projects.
All non-executive Directors are independent with no direct or
indirect material relationship with the Company. their wide range
of expertise and significant experience in commercial, corporate
and financial activities bring an independent view and judgment to
the Board.
Sub Committees of the Boardthe Board is responsible for the establishment and functioning
of all Board Committees, the appointment of members to these
committees and their compensation. the Board has delegated
responsibilities to two Board sub Committees which operate
within clearly defined terms of reference.
Audit Committeethe Audit Committee is composed of two Independent non-
executive Directors namely Prof. Lakshman R. Watawala,
Chairman and Prof. susantha Pathirana. the Chief executive
officer, Group Director operations, Group Chief Financial officer,
Internal Audit Manager and functional heads of subsidiaries
attend meetings by invitation.
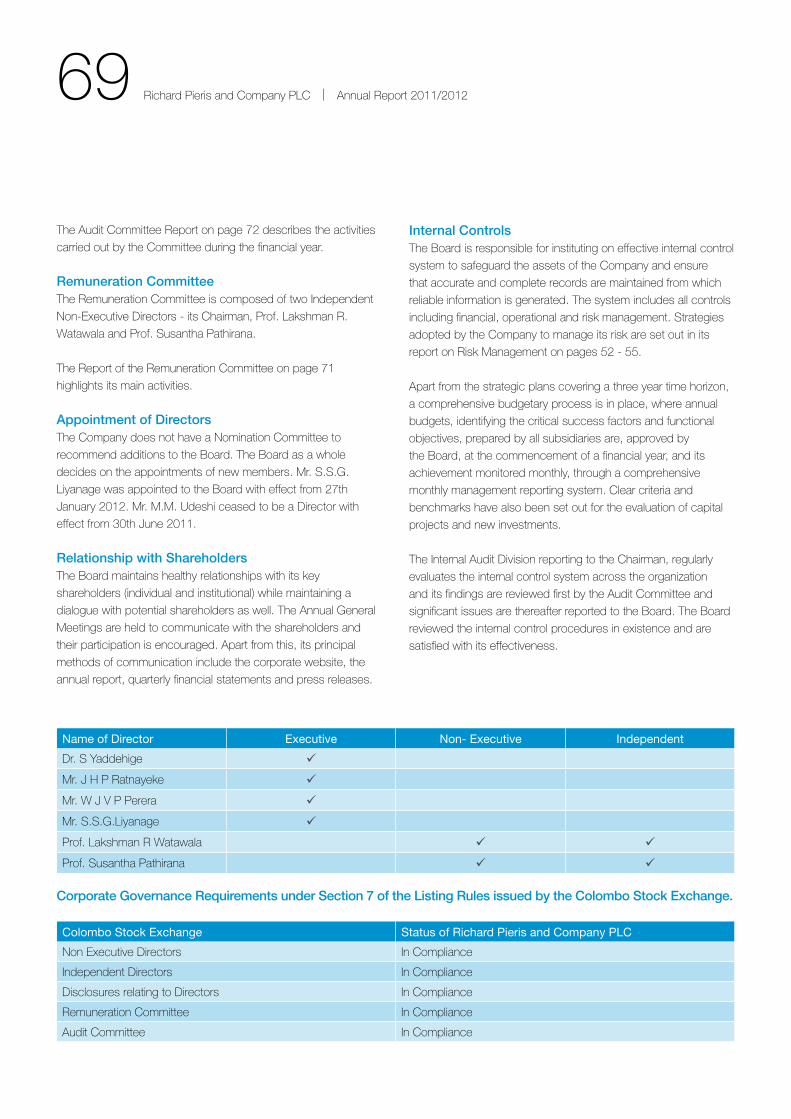
69 Richard Pieris and Company PLC | Annual Report 2011/2012
the Audit Committee Report on page 72 describes the activities
carried out by the Committee during the financial year.
Remuneration Committeethe Remuneration Committee is composed of two Independent
non-executive Directors - its Chairman, Prof. Lakshman R.
Watawala and Prof. susantha Pathirana.
the Report of the Remuneration Committee on page 71
highlights its main activities.
Appointment of Directorsthe Company does not have a nomination Committee to
recommend additions to the Board. the Board as a whole
decides on the appointments of new members. Mr. s.s.G.
Liyanage was appointed to the Board with effect from 27th
January 2012. Mr. M.M. Udeshi ceased to be a Director with
effect from 30th June 2011.
Relationship with Shareholdersthe Board maintains healthy relationships with its key
shareholders (individual and institutional) while maintaining a
dialogue with potential shareholders as well. the Annual General
Meetings are held to communicate with the shareholders and
their participation is encouraged. Apart from this, its principal
methods of communication include the corporate website, the
annual report, quarterly financial statements and press releases.
Internal Controlsthe Board is responsible for instituting on effective internal control
system to safeguard the assets of the Company and ensure
that accurate and complete records are maintained from which
reliable information is generated. the system includes all controls
including financial, operational and risk management. strategies
adopted by the Company to manage its risk are set out in its
report on Risk Management on pages 52 - 55.
Apart from the strategic plans covering a three year time horizon,
a comprehensive budgetary process is in place, where annual
budgets, identifying the critical success factors and functional
objectives, prepared by all subsidiaries are, approved by
the Board, at the commencement of a financial year, and its
achievement monitored monthly, through a comprehensive
monthly management reporting system. Clear criteria and
benchmarks have also been set out for the evaluation of capital
projects and new investments.
the Internal Audit Division reporting to the Chairman, regularly
evaluates the internal control system across the organization
and its findings are reviewed first by the Audit Committee and
significant issues are thereafter reported to the Board. the Board
reviewed the internal control procedures in existence and are
satisfied with its effectiveness.
Name of Director Executive Non- Executive Independent
Dr. s Yaddehige
Mr. J H P Ratnayeke
Mr. W J V P Perera
Mr. s.s.G.Liyanage
Prof. Lakshman R Watawala
Prof. susantha Pathirana
Corporate Governance Requirements under Section 7 of the Listing Rules issued by the Colombo Stock Exchange.
Colombo Stock Exchange Status of Richard Pieris and Company PLC
non executive Directors In Compliance
Independent Directors In Compliance
Disclosures relating to Directors In Compliance
Remuneration Committee In Compliance
Audit Committee In Compliance
70 Richard Pieris and Company PLC | Annual Report 2011/2012
Relationship with Other Stakeholdersthe Board identifies the importance of maintaining a healthy
relationship with its key stakeholders and ensures the Group as
a whole inculcates this practice. Internal communication is mainly
conducted through the quarterly newsletter, e-mails, memos and
circulars.
the Board also ensures that the Group policies and practices are
in line with the Company’s values and its social responsibilities.
the group promotes protection of the environment, health
and safety standards of its employees and others within the
organization. the relevant measures taken are given in detail in
the Corporate social Responsibility report on pages 42 - 44.
Compliancethe Board places significant emphasis on strong internal
compliance procedures. the Financial statements of the Group
are prepared in strict compliance with the guidelines of the sri
Lanka Accounting standards and other statutory regulations.
Financial statements are published quarterly in line with the
Listing Rules of the Colombo stock exchange through which all
significant developments are reported to shareholders quarterly.
the Board of Directors, to the best of their knowledge and belief,
are satisfied that all statutory payments have been made to date.
Going Concernthe Directors have continued to use the ‘Going Concern’ basis
in the preparation of the Financial statements, after careful
review of the financial position and cash flow status of the Group.
the Board of Directors believes that the Group has adequate
resources to continue its operation for the foreseeable future.
Corporate Governance Contd.
71 Richard Pieris and Company PLC | Annual Report 2011/2012
Report of the Remuneration Committee
the Remuneration Committee, appointed by and responsible
to the Board of Directors, consists of two Independent non-
executive Directors Prof. Lakshman R Watawala and Prof.
susantha Pathirana. the Committee is chaired by Prof.
Lakshman R Watawala.the Committee met on several occasions
during the financial year.
the Remuneration Committee has reviewed and recommended
the following to the Board of Directors:
1. Policy on remuneration of the executive staff
2. specific remuneration package for the executive Directors
In a highly competitive environment attracting and retaining high
caliber executives is a key challenge faced by the Group. In this
context, the Committee took into account, competition, market
information and business performance in declaring the overall
remuneration policy of the Group.
Prof. Lakshman R WatawalaChairman
24th May 2012
72 Richard Pieris and Company PLC | Annual Report 2011/2012
Report of the Audit Committee
the Audit Committee Charter, approved by the Board of Directors
defines the purpose, authority, composition, meeting, and
responsibilities of the Committee.
the purpose of the Audit Committee is to:
1. Assist the Board of Directors in fulfilling its overall
responsibilities for the financial reporting process
2. Review the system of internal control and risk management
3. Monitor the effectiveness of the internal audit function
4. Review the Company’s process for monitoring compliance
with laws and regulations.
5. Review the independence and performance of the external
auditors
6. to make recommendations to the board on the appointment
of external auditors and recommend their remuneration and
terms of engagement
the Audit Committee consisted of two Independent and non-
executive Directors, namely Prof. Lakshman R. Watawala and
Prof. susantha Pathirana. the Chairman of the Committee is a
senior Chartered Accountant. the Company secretary functions
as secretary to the Audit Committee.
the principal activities of the Committee are detailed below.
Meetingsthe Audit Committee held 4 meetings during the year under
review.
the Group Chief Financial officer, Group Internal Audit Manager
and functional heads of the strategic Business Units (sBUs) were
invited if deemed necessary for audit committee meetings.
Meetings were held with the external auditors regarding the
scope and the conduct of the annual audits.
Internal Audit and Risk Managementthe Internal Audit Programme was reviewed by the Committee to
ensure that it covered the major business units of the Group.
the Chief Internal Auditor was invited to be present at all Audit
Committee deliberations. He presented a summary of the salient
findings of all internal audits and investigations carried out by his
department for the period. the responses from the Managing
Directors of the sBUs to the internal audit findings were reviewed
and where necessary corrective action was recommended and
implementation monitored.
the Committee also had the responsibility to review the loss
making sBU’s of the Group and strategies for turning round these
Companies and recommending suitable corrective action.
Internal ControlsDuring its meetings, the Committee reviewed the adequacy
and effectiveness of the internal control systems and the
Group’s approach to its exposure to the business and financial
risks. Processes are in place to safeguard the assets of the
organisation and to ensure that the financial reporting system can
be relied upon in the preparation and presentation of financial
statements. A comprehensive Management Report and Accounts
are produced at month end highlighting all key performance
criteria pertaining to the Company’s sBUs which is reviewed by
the senior Management on a monthly basis.
sBU Boards review performance on a quarterly basis.
Financial Statementsthe Committee reviewed the Group’s Quarterly Financial
statements, the Annual Report and Accounts for reliability,
consistency and compliance with the sri Lanka Accounting
standards and other statutory requirements, including the
Companies Act, no 7 of 2007, prior to issuance. It also reviewed
the adequacy of disclosure in published financial statements.
the Group will be adopting the new sri Lanka Accounting
standards (new sLAs) comprising LKAs and sLFRs applicable
for financial periods commencing from 01 April 2012 as issued
by the Institute of Chartered Accountants of sri Lanka. the Group
has commenced reviewing its accounting policies and financial
reporting in readiness for the transition. training activities were
conducted in house and members in finance divisions of Group
Companies have attended seminars conducted by the leading
accounting bodies in sri Lanka.
73 Richard Pieris and Company PLC | Annual Report 2011/2012
External Auditorsthe Audit Committee has reviewed the other services
provided by the external Auditors to the group to ensure their
independence as Auditors has not been compromised.
the Committee reviewed the Management Letters issued by the
external Auditors, the Management response thereto and also
attended to matters specifically addressed to them. the external
auditors kept the Audit Committee informed on an ongoing basis
of all matters of significance. the committee met with the auditors
and discussed issues arising from the audit and corrective action
taken where necessary.
the Audit Committee has recommended to the Board of
Directors that Messrs ernst & Young be re-appointed as Auditors
for the financial year ending 31st March, 2013 subject to the
approval of the shareholders at the next Annual General Meeting.
Conclusionthe Audit Committee is satisfied that the control environment
prevailing in the organisation provides reasonable assurance
regarding the reliability of the financial reporting of the Group, the
assets are safeguarded and that the Listing Rules of the Colombo
stock exchange have been met.
Prof. Lakshman R WatawalaChairman
24th May 2012
74 Richard Pieris and Company PLC | Annual Report 2011/2012
statement of Directors’ Responsibility
In keeping with the provisions under the Companies Act no.
7 of 2007, the Directors of Richard Pieris and Company PLC,
acknowledge their responsibility in relation to financial reporting of
both, the Company and that of its Group. these responsibilities
differ from those of its Auditors, M/s. ernst & Young, which are
set out in their report, appearing on page 75 of this report.
the financial statements of the Company and its subsidiaries
for the year ended 31st March 2012 included in this report,
have been prepared and presented in accordance with the sri
Lanka Accounting standards, and they provide the information
as required by the Companies Act no. 7 of 2007, sri Lanka
Accounting standards and the Listing Rules of the Colombo
stock exchange. the Directors confirm that suitable accounting
policies have been used and applied consistently, and that all
applicable accounting standards have been followed in the
preparation of the financial statements exhibited on pages from
76 to 119 inclusive. All material deviations from these standards
if any have been disclosed and explained. the judgments and
estimates made in the preparation of these financial statements
are reasonable and prudent.
the Directors confirm their responsibility for ensuring that all
companies within the Group maintain accounting records, which
are sufficient to prepare financial statements that disclose with
reasonable accuracy, the financial position of the Company and
its Group. they also confirm their responsibility towards ensuring
that the financial statements presented in the Annual Report give
a true and fair view of the state of affairs of the Company and its
Group as at 31st March 2012, and that of the profit for the year
then ended.
the overall responsibility for the Company’s internal control
systems lies with the Directors. Whilst recognizing the fact that
there is no single system of internal control that could provide
absolute assurance against material misstatements and fraud,
the Directors confirm that the prevalent internal control systems
instituted by them and which comprise internal checks, internal
audit and financial and other controls are so designed that, there
is reasonable assurance that all assets are safeguarded and
transactions properly authorized and recorded, so that material
misstatements and irregularities are either prevented or detected
within a reasonable period of time.
the Directors’ are of the view that the Company and its
Group have adequate resources to continue operations in the
foreseeable future and have continued to use the going- concern
basis in the preparation of these financial statements.
the Directors’ have provided the Auditors M/s. ernst & Young
Chartered Accountants with every opportunity to carry out
reviews and tests that they consider appropriate and necessary
for the performance of their responsibilities. the Auditors have
examined the financial statements together with all financial
records and related data and express their opinion which appears
as reported by them on page 75 of this report.
By order of the Board,
Richard Pieris Group Services (Pvt) LimitedSecretaries
310, High Level Road, nawinna, Maharagama
24th May 2012
75 Richard Pieris and Company PLC | Annual Report 2011/2012
Independent Auditor’s Report
SPF/BVP
TO THE SHAREHOLDERS OF RICHARD PIERIS AND COMPANY PLC
Report on the Financial StatementsWe have audited the accompanying Financial statements of Richard Pieris and Company PLC (“Company”), the consolidated Financial statements of the Company and its subsidiaries (together “Group”) which comprise the balance sheets as at 31 March 2012, and the Income statements, statements of changes in equity and cash flow statements for the year then ended, and a summary of significant accounting policies and other explanatory notes.
Management’s Responsibility for the Financial StatementsManagement is responsible for the preparation and fair presentation of these Financial statements in accordance with sri Lanka Accounting standards. this responsibility includes: designing, implementing and maintaining internal control relevant to the preparation and fair presentation of Financial statements that are free from material misstatement, whether due to fraud or error; selecting and applying appropriate accounting policies; and making accounting estimates that are reasonable in the circumstances.
Scope of Audit and Basis of Opinionour responsibility is to express an opinion on these Financial statements based on our audit. We conducted our audit in accordance with sri Lanka Auditing standards. those standards require that we plan and perform the audit to obtain reasonable assurance whether the Financial statements are free from material misstatement.
An audit includes examining, on a test basis, evidence supporting the amounts and disclosures in the Financial statements. An audit also includes assessing the accounting policies used and
significant estimates made by management, as well as evaluating the overall Financial statement presentation.
We have obtained all the information and explanations which to the best of our knowledge and belief were necessary for the purposes of our audit. We therefore believe that our audit provides a reasonable basis for our opinion.
OpinionIn our opinion, so far as appears from our examination, Company maintained proper accounting records for the year ended 31 March 2012 and the Financial statements give a true and fair view of the Company’s state of affairs as at 31 March 2012 and its profit and cash flows for the year then ended in accordance with sri Lanka Accounting standards.
In our opinion, the consolidated Financial statements give a true and fair view of the state of affairs as at 31 March 2012 and the profit and cash flows for the year then ended, in accordance with sri Lanka Accounting standards, of the Company and its subsidiaries dealt with thereby, so far as concerns the shareholders of the Company.
Report on Other Legal and Regulatory RequirementsIn our opinion, these Financial statements also comply with the requirements of sections 151(2) and 153(2) to 153(7) of the Companies Act no. 07 of 2007.
(sgd.)Ernst & YoungChartered Accountants
24th May 2012Colombo

76 Richard Pieris and Company PLC | Annual Report 2011/2012
Group Company 2012 2011 2012 2011 As at March 31 Note Rs. ‘000 Rs. ‘000 Rs. ‘000 Rs. ‘000
AssetsNon-current assetsProperty, plant and equipment 3 10,731,588 10,001,325 36,121 46,404Leasehold properties 3 582,270 605,934 - -Investment properties 3 - - 688,458 691,393Intangible assets 4 542,758 497,279 - -Investments in subsidiaries 5 - - 2,696,013 2,560,917Investments in associates 5 74,143 456,186 - 159,756other investments 5 5,625 24,000 71,375 89,750Deferred tax assets 16 - - 36,953 36,953 11,936,384 11,584,724 3,528,920 3,585,173
Current assetsInventories 6 3,609,378 3,341,884 - -trade and other receivables 7 3,675,232 2,908,800 39,955 52,706tax receivables 184,309 180,650 - -Amounts due from subsidiaries - - 1,761,629 984,541short term investments 8 51,942 59,540 51,942 59,540Cash at bank and in hand 20 3,445,988 2,563,859 25,210 63,349 10,966,849 9,054,733 1,878,736 1,160,136Total assets 22,903,233 20,639,457 5,407,656 4,745,309
Equity and liabilitiesEquity attributable to equity holders of the parentstated capital 9 1,633,853 1,627,612 1,633,853 1,627,612Capital reserves 10 126,901 126,901 10,574 10,574Revenue reserves 11 4,010,335 3,221,102 560,011 617,905Foreign currency translation 12 38,236 27,314 - - 5,809,325 5,002,929 2,204,438 2,256,091
Minority interest 1,847,746 1,860,693 - -Total equity 7,657,071 6,863,622 2,204,438 2,256,091
Non-current liabilitiesInsurance provisions 9,390 - - -Interest bearing borrowings 13 2,177,814 1,998,291 220,000 149,084net liability to the lessor payable 14 638,237 650,980 - -Deferred income 15 577,609 584,763 - -Deferred tax liabilities 16 63,692 10,589 - -employee benefit liabilities 17 1,940,629 1,662,131 59,674 48,578 5,407,371 4,906,754 279,674 197,662
Current liabilitiestrade and other payables 18 4,600,058 3,653,146 873,129 258,991Current portion of interest bearing borrowings 13 893,957 1,075,241 209,083 275,000Current portion of net liability to the lessor 14 12,398 21,978 - -Deposits 2,482 2,838 2,482 2,838Amounts due to subsidiaries - - 322,008 177,515Current tax liabilities 138,593 309,944 9,654 5,880short term borrowings 19 4,191,303 3,805,934 1,507,188 1,571,332 9,838,791 8,869,081 2,923,544 2,291,556Total liabilities 15,246,162 13,775,835 3,203,218 2,489,218Total equity and liabilities 22,903,233 20,639,457 5,407,656 4,745,309
I certify that the financial statements comply with the requirements of the Companies Act no. 7 of 2007.
Jagath DissanayakeGroup Chief Financial Officer
the Board of Directors is responsible for the preparation and presentation of these financial statements.
W J Viville Perera J H P RatnayekeDirector Director
the accounting policies and notes from pages 81 to 119 form an integral part of these financial statements.
24th May 2012
Balance sheet
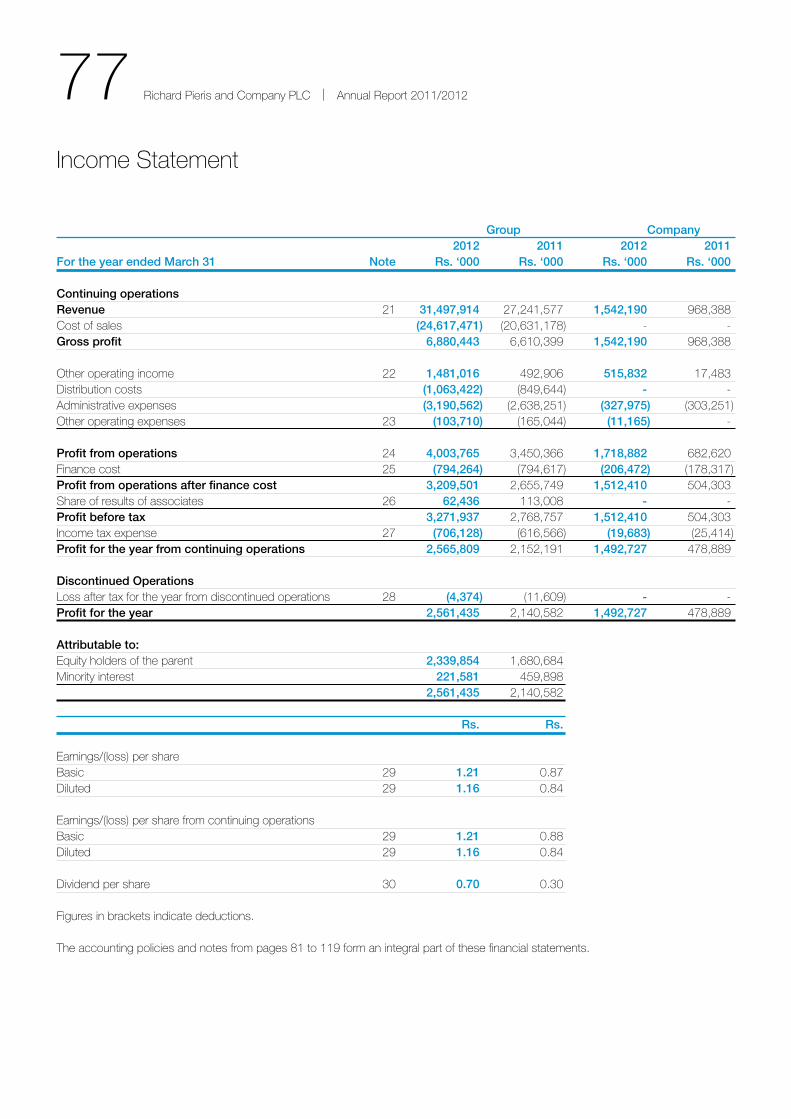
77 Richard Pieris and Company PLC | Annual Report 2011/2012
Group Company 2012 2011 2012 2011 For the year ended March 31 Note Rs. ‘000 Rs. ‘000 Rs. ‘000 Rs. ‘000
Continuing operationsRevenue 21 31,497,914 27,241,577 1,542,190 968,388Cost of sales (24,617,471) (20,631,178) - -Gross profit 6,880,443 6,610,399 1,542,190 968,388
other operating income 22 1,481,016 492,906 515,832 17,483Distribution costs (1,063,422) (849,644) - -Administrative expenses (3,190,562) (2,638,251) (327,975) (303,251)other operating expenses 23 (103,710) (165,044) (11,165) -
Profit from operations 24 4,003,765 3,450,366 1,718,882 682,620Finance cost 25 (794,264) (794,617) (206,472) (178,317)Profit from operations after finance cost 3,209,501 2,655,749 1,512,410 504,303share of results of associates 26 62,436 113,008 - -Profit before tax 3,271,937 2,768,757 1,512,410 504,303Income tax expense 27 (706,128) (616,566) (19,683) (25,414)Profit for the year from continuing operations 2,565,809 2,152,191 1,492,727 478,889
Discontinued OperationsLoss after tax for the year from discontinued operations 28 (4,374) (11,609) - -Profit for the year 2,561,435 2,140,582 1,492,727 478,889
Attributable to:equity holders of the parent 2,339,854 1,680,684Minority interest 221,581 459,898 2,561,435 2,140,582
Rs. Rs.
earnings/(loss) per shareBasic 29 1.21 0.87Diluted 29 1.16 0.84
earnings/(loss) per share from continuing operationsBasic 29 1.21 0.88Diluted 29 1.16 0.84
Dividend per share 30 0.70 0.30
Figures in brackets indicate deductions.
the accounting policies and notes from pages 81 to 119 form an integral part of these financial statements.
Income statement
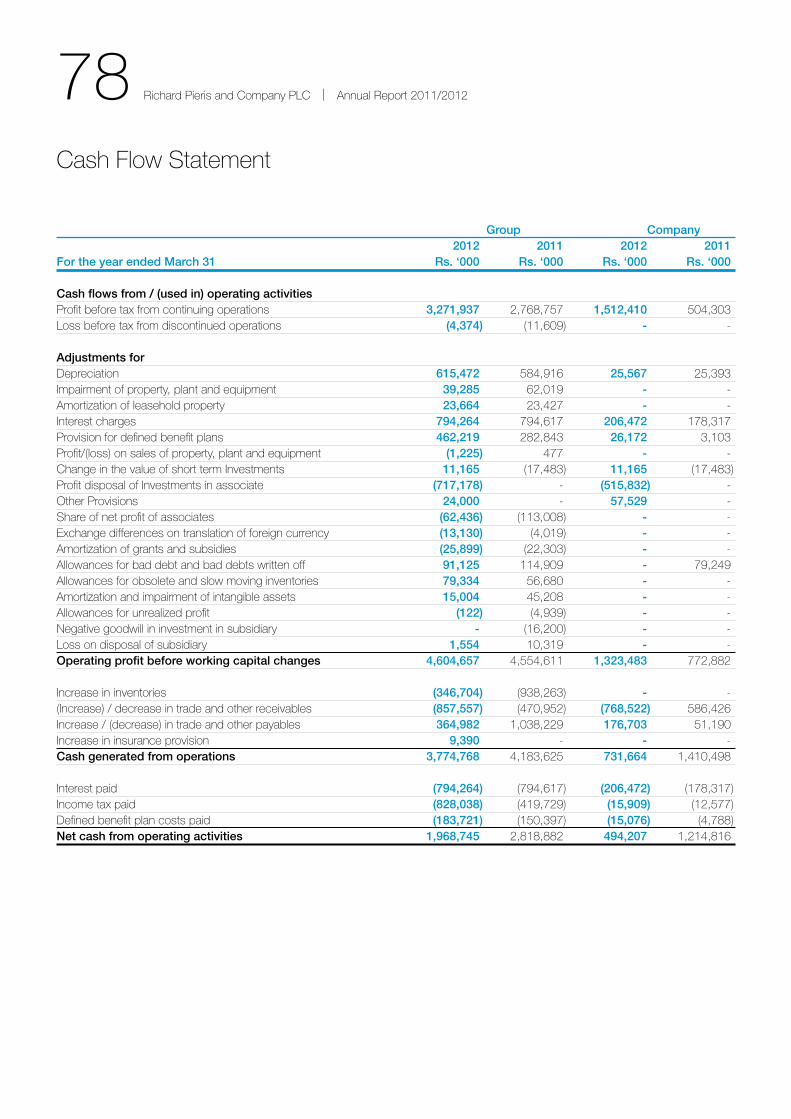
78 Richard Pieris and Company PLC | Annual Report 2011/2012
Group Company 2012 2011 2012 2011 For the year ended March 31 Rs. ‘000 Rs. ‘000 Rs. ‘000 Rs. ‘000
Cash flows from / (used in) operating activitiesProfit before tax from continuing operations 3,271,937 2,768,757 1,512,410 504,303Loss before tax from discontinued operations (4,374) (11,609) - -
Adjustments forDepreciation 615,472 584,916 25,567 25,393Impairment of property, plant and equipment 39,285 62,019 - -Amortization of leasehold property 23,664 23,427 - -Interest charges 794,264 794,617 206,472 178,317Provision for defined benefit plans 462,219 282,843 26,172 3,103Profit/(loss) on sales of property, plant and equipment (1,225) 477 - -Change in the value of short term Investments 11,165 (17,483) 11,165 (17,483)Profit disposal of Investments in associate (717,178) - (515,832) -other Provisions 24,000 - 57,529 -share of net profit of associates (62,436) (113,008) - -exchange differences on translation of foreign currency (13,130) (4,019) - -Amortization of grants and subsidies (25,899) (22,303) - -Allowances for bad debt and bad debts written off 91,125 114,909 - 79,249Allowances for obsolete and slow moving inventories 79,334 56,680 - -Amortization and impairment of intangible assets 15,004 45,208 - -Allowances for unrealized profit (122) (4,939) - -negative goodwill in investment in subsidiary - (16,200) - -Loss on disposal of subsidiary 1,554 10,319 - -Operating profit before working capital changes 4,604,657 4,554,611 1,323,483 772,882
Increase in inventories (346,704) (938,263) - -(Increase) / decrease in trade and other receivables (857,557) (470,952) (768,522) 586,426Increase / (decrease) in trade and other payables 364,982 1,038,229 176,703 51,190Increase in insurance provision 9,390 - - -Cash generated from operations 3,774,768 4,183,625 731,664 1,410,498
Interest paid (794,264) (794,617) (206,472) (178,317)Income tax paid (828,038) (419,729) (15,909) (12,577)Defined benefit plan costs paid (183,721) (150,397) (15,076) (4,788)Net cash from operating activities 1,968,745 2,818,882 494,207 1,214,816
Cash Flow statement
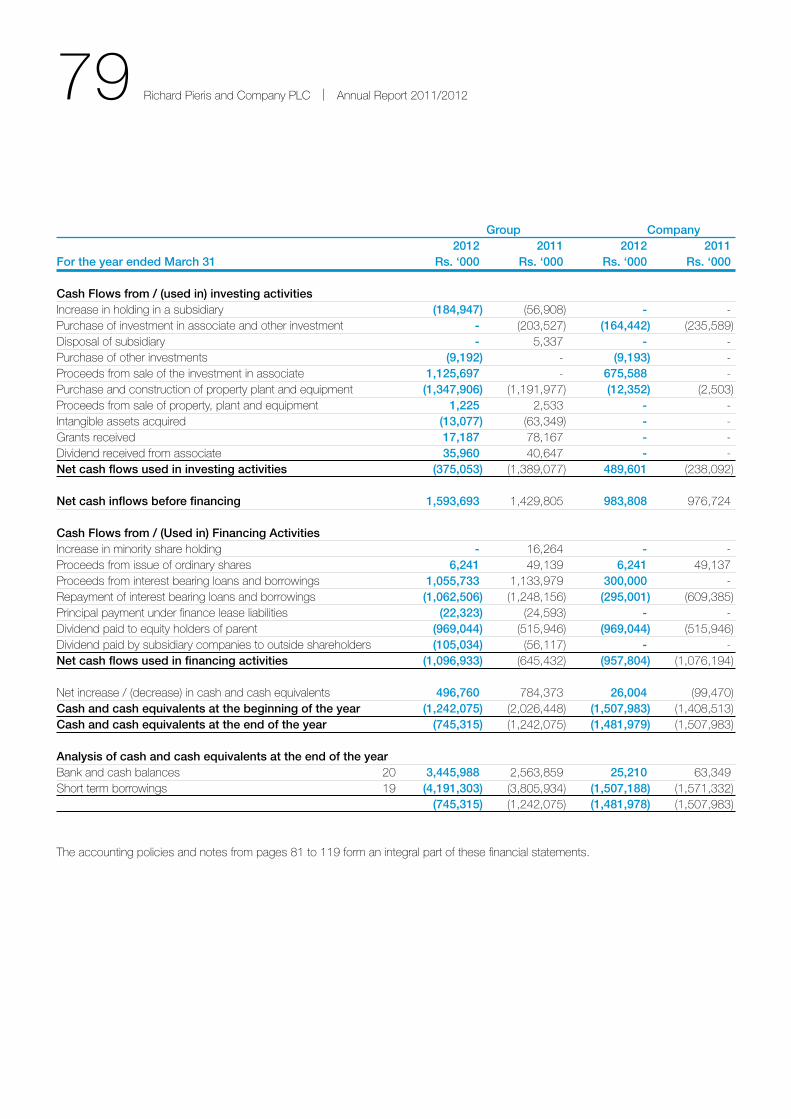
79 Richard Pieris and Company PLC | Annual Report 2011/2012
Group Company 2012 2011 2012 2011 For the year ended March 31 Rs. ‘000 Rs. ‘000 Rs. ‘000 Rs. ‘000
Cash Flows from / (used in) investing activitiesIncrease in holding in a subsidiary (184,947) (56,908) - -Purchase of investment in associate and other investment - (203,527) (164,442) (235,589)Disposal of subsidiary - 5,337 - -Purchase of other investments (9,192) - (9,193) -Proceeds from sale of the investment in associate 1,125,697 - 675,588 -Purchase and construction of property plant and equipment (1,347,906) (1,191,977) (12,352) (2,503)Proceeds from sale of property, plant and equipment 1,225 2,533 - -Intangible assets acquired (13,077) (63,349) - -Grants received 17,187 78,167 - -Dividend received from associate 35,960 40,647 - -Net cash flows used in investing activities (375,053) (1,389,077) 489,601 (238,092)
Net cash inflows before financing 1,593,693 1,429,805 983,808 976,724
Cash Flows from / (Used in) Financing ActivitiesIncrease in minority share holding - 16,264 - -Proceeds from issue of ordinary shares 6,241 49,139 6,241 49,137Proceeds from interest bearing loans and borrowings 1,055,733 1,133,979 300,000 -Repayment of interest bearing loans and borrowings (1,062,506) (1,248,156) (295,001) (609,385)Principal payment under finance lease liabilities (22,323) (24,593) - -Dividend paid to equity holders of parent (969,044) (515,946) (969,044) (515,946)Dividend paid by subsidiary companies to outside shareholders (105,034) (56,117) - -Net cash flows used in financing activities (1,096,933) (645,432) (957,804) (1,076,194)
net increase / (decrease) in cash and cash equivalents 496,760 784,373 26,004 (99,470)Cash and cash equivalents at the beginning of the year (1,242,075) (2,026,448) (1,507,983) (1,408,513)Cash and cash equivalents at the end of the year (745,315) (1,242,075) (1,481,979) (1,507,983)
Analysis of cash and cash equivalents at the end of the yearBank and cash balances 20 3,445,988 2,563,859 25,210 63,349short term borrowings 19 (4,191,303) (3,805,934) (1,507,188) (1,571,332) (745,315) (1,242,075) (1,481,978) (1,507,983)
the accounting policies and notes from pages 81 to 119 form an integral part of these financial statements.

80 Richard Pieris and Company PLC | Annual Report 2011/2012
Attributable to equity holders of the parent
Stated Capital Revenue Retained Foreign Total Minority Total
capital reserves reserves profit currency interest equity
translation
Rs. ‘000 Rs. ‘000 Rs. ‘000 Rs. ‘000 Rs. ‘000 Rs. ‘000 Rs. ‘000 Rs. ‘000
Group
Balance as at 31st March 2010 1,578,475 126,901 179,443 1,876,921 31,152 3,792,892 1,503,071 5,295,963
net profit for the period - - - 1,680,684 - 1,680,684 459,898 2,140,582
Dividends - - - (515,946) - (515,946) - (515,946)
Issue of share capital 49,137 - - - - 49,137 - 49,137
Adjustment due to changes in holding - - - - - - 12,217 12,217
Acquisition of minority interest - - - - - - (56,908) (56,908)
subsidiary dividend to minority shareholders - - - - - - (56,117) (56,117)
effect of foreign currency translation - - - - (3,838) (3,838) (1,468) (5,306)
Balance as at 31st March 2011 1,627,612 126,901 179,443 3,041,659 27,314 5,002,929 1,860,693 6,863,622
Balance as at 31st March 2011 1,627,612 126,901 179,443 3,041,659 27,314 5,002,929 1,860,693 6,863,622
net profit for the period - - - 2,339,854 - 2,339,854 221,581 2,561,435
Dividends - - - (1,550,621) - (1,550,621) - (1,550,621)
Issue of share capital 6,241 - - - - 6,241 - 6,241
Acquisition of minority interest - - - - - - (141,151) (141,151)
subsidiary dividend to minority shareholders - - - - - - (105,034) (105,034)
effect of foreign currency translation - - - - 10,922 10,922 11,657 22,579
Balance as at 31st March 2012 1,633,853 126,901 179,443 3,830,892 38,236 5,809,325 1,847,746 7,657,071
Company
Balance as at 1st April 2010 1,578,475 10,574 - 654,962 - 2,244,011 - 2,244,011
net profit for the period - - - 478,889 - 478,889 - 478,889
Issue of share capital 49,137 - - - - 49,137 - 49,137
Dividends - - - (515,946) - (515,946) - (515,946)
Balance as at 31st March 2011 1,627,612 10,574 - 617,905 - 2,256,091 - 2,256,091
Balance as at 31st March 2011 1,627,612 10,574 - 617,905 - 2,256,091 - 2,256,091
net profit for the period - - - 1,492,727 - 1,492,727 - 1,492,727
Issue of share capital 6,241 - - - - 6,241 - 6,241
Dividends - - - (1,550,621) - (1,550,621) - (1,550,621)
Balance as at 31st March 2012 1,633,853 10,574 - 560,011 - 2,204,438 - 2,204,438
the accounting policies and notes from pages 81 to 119 form an integral part of these financial statements.
statement of Changes in equity

81 Richard Pieris and Company PLC | Annual Report 2011/2012
1. CORPORATE INFORMATIONRichard Pieris and Company PLC is a public limited liability
company incorporated and domiciled in sri Lanka and listed on
the Colombo stock exchange. the registered office and principal
place of business of the company is located at 310, High Level
Road, nawinna, Maharagama.
In the Annual Report of the Board of Directors and in the financial
statements, “the company” refers to Richard Pieris and Company
PLC as the holding company and “the Group” refers to the
companies whose accounts have been consolidated therein. the
financial statements for the year ended 31st March 2012 were
authorized for issue by the Directors on 24th May 2012.
the principal activities of the Group are stated in the Annual
Report of the Board of Directors.
All values presented in the financial statements are in sri Lanka
rupees thousands (Rs.’000s) unless otherwise indicated. the
significant accounting policies are discussed below.
1.1 GENERAL POLICIES1.1.1 Statement of compliancethe Balance sheet, Income statement, statement of Changes
in equity and the Cash Flow statement, together with the
accounting policies and notes (the “financial statements”) have
been prepared in compliance with the sri Lanka Accounting
standards (sLAs) issued by the Institute of Chartered
Accountants of sri Lanka.
1.1.2 Basis of preparationthe financial statements, presented in sri Lankan Rupees, have
been prepared on an accrual basis and under the historical
cost convention unless stated otherwise. the preparation and
presentation of these financial statements is in compliance with
the Companies Act no. 07 of 2007.
1.1.3 Changes in accounting policiesthe accounting policies adopted are consistent with those of the
previous financial year.
1.1.4 Comparative informationthe accounting policies applied by the group are consistent
with those used in the previous year. Previous year’s figures and
phrases have been re-arranged, wherever necessary, to conform
to the current year’s presentation.
notes to the Financial statements
1.1.5 Events after the balance sheet dateAll material post balance sheet events have been considered and
appropriate adjustments or disclosures have been made in the
respective notes to the financial statements.
1.2 CONSOLIDATION POLICY1.2.1 Basis of consolidationthe consolidated financial statements include the financial
statements of the company, its subsidiaries and other companies
over which it has control.
the Group’s Financial statements comprise the consolidated
financial statements of the company and the group which have
been prepared in compliance with the group’s accounting
policies.
All intra-group balances, income and expenses and profits and
losses resulting from intra-group transactions are eliminated in full.
1.2.2 Acquisitions and divestmentsAcquisitions of subsidiaries are accounted for using the purchase
method of accounting. the results of subsidiaries, joint ventures
and associates acquired or incorporated during the year have
been included from the date of acquisition, or incorporation while
results of subsidiaries, joint ventures and associates disposed
have been included up to the date of disposal.
1.2.3 Subsidiariessubsidiaries are those enterprises controlled by the parent.
Control exists when the parent holds more than 50% of the voting
rights or otherwise has a controlling interest.
subsidiaries are consolidated from the date the parent obtains
control until the date that control ceases.
subsidiaries consolidated have been listed in the Group
structure.
the total profits and losses for the period, of the Company and
of its subsidiaries included in consolidation and all assets and
liabilities of the Company and of its subsidiaries included in
consolidation are shown in the Consolidated Income statement
and Balance sheet respectively.
Minority interests, which represents the portion of profit or
loss and net assets not held by the group, are shown as a
component of profit for the period in the Income statement and
82 Richard Pieris and Company PLC | Annual Report 2011/2012
as a component of equity in the Consolidated Balance sheet,
separately from parent shareholders’ equity.
the Consolidated Cash Flow statement includes the cash flows
of the Company and its subsidiaries.
1.2.4 AssociatesAssociates are those investments over which the Group has
significant influence and holds 20% to 50% of the equity and
which are neither subsidiaries nor joint ventures of the Group.
All associates are incorporated in sri Lanka.
the investments in associates are carried in the Balance sheet
at cost plus post acquisition changes in the Group’s share of
net assets of the associates. Goodwill relating to an associate
is included in the carrying amount of the investment. After
application of the equity method, the Group determines whether
it is necessary to recognize any additional impairment loss with
respect to the Group’s net investment in the associate. the
Income statement reflects the share of the results of operations
of the associate. Where there has been a change recognized
directly in the equity of the associate, the Group recognizes its
share of any changes in the statement of Changes in equity.
When the Group’s share of losses in an associate equals or
exceeds the interest in the undertaking, the Group does not
recognize further losses unless it has incurred obligations or
made payments on behalf of the entity.
the Group ceases to use the equity method of accounting on
the date from which it no longer has significant influence in the
associate.
the accounting policies of associate companies conform to
those used for similar transactions of the Group.
1.2.5 GoodwillGoodwill acquired in a business combination is initially measured
at cost being the excess of the cost of the business combination
over the Group’s interest in the net fair value of the identifiable
assets, liabilities and contingent liabilities. Following initial
recognition, goodwill is measured at cost less any accumulated
impairment losses. Goodwill is reviewed for impairment, annually
or more frequently if events or changes in circumstances indicate
that the carrying value may be impaired.
For the purpose of impairment testing, goodwill acquired in a
business combination is, from the acquisition date, allocated to
groups of cash-generating units that are expected to benefit from
the synergies of the combination.
Impairment is determined by assessing the recoverable amount
of the cash-generating unit to which goodwill relates. Where
the recoverable amount of the cash generating unit is less than
the carrying amount, an impairment loss is recognized. the
impairment loss is allocated first to reduce the carrying amount
of any goodwill allocated to the unit and then to the other assets
pro-rata to the carrying amount of each asset in the unit.
Goodwill and fair value adjustments arising on the acquisition of a
foreign operation are treated as assets and liabilities of the foreign
operation and translated at the closing rate.
Where goodwill forms part of a cash-generating unit and part
of the operation within that unit is disposed of, the goodwill
associated with the operation disposed of is included in the
carrying amount of the operation when determining the gain or
loss on disposal of the operation.
1.2.6 Financial yearResults of all subsidiaries and associates (except for Asian
Alliance Insurance PLC) are drawn for the twelve months period
up to 31st March, which is their year end.
the result of Asian Alliance Insurance PLC is drawn for the twelve
month period up to 31st December, which is their year end.
2.1 SIGNIFICANT ACCOUNTING JUDGMENTS, ESTIMATES AND ASSUMPTIONS2.1.1 JudgmentsIn the process of applying the Group’s accounting policies,
management has made the following judgments, apart from
those involving estimations, which has the most significant effect
on the amounts recognized in the Financial statements.
Going ConcernWhen preparing financial statements, management has made
assessment of the ability of the constituents of the Group to
continue as a going concern, taking into account all available
information about the future, including intentions of curtailment of
businesses, as decided by the Board, as disclosed in note 28 to
the Financial statements.
notes to the Financial statements Contd.
83 Richard Pieris and Company PLC | Annual Report 2011/2012
Deferred tax assetsDeferred tax assets are recognized for all unused tax losses to
the extent that it is probable that taxable profit will be available
against which the losses can be utilized. significant management
judgment is required to determine the amount of deferred tax
assets that can be recognized, based upon the likely timing and
level of future taxable profits together with future tax planning
strategies. Further details are given in note 16.
Allowance for doubtful debtsthe Group reviews at each balance sheet date all receivables to
assess whether an allowance should be recorded in the Income
statement. the management uses judgment in estimating such
amounts in the light of the duration of, outstanding and any other
factors management is aware of that indicates uncertainty in
recovery.
2.1.2 Estimates and assumptionsthe key assumptions concerning the future and other key
sources of estimation uncertainty at the Balance sheet date,
that have a significant risk of causing material adjustments to the
carrying amounts of assets and liabilities within the next financial
year are discussed below. the respective carrying amounts of
assets and liabilities are given in related notes to the financial
statements.
Defined benefit plansthe cost of defined benefit plans- gratuity is determined using
actuarial valuations. the actuarial valuation involves making
assumptions about discount rates, expected rates of return on
assets, future salary increases, mortality rates and future pension
increases. Due to the long term nature of these plans, such
estimates are subject to significant uncertainty. Further details are
given in note 17.
Intangible assetsFor the purposes of impairment testing, goodwill is allocated
to cash generating units when cash generating units to which
goodwill has been allocated are tested for impairment annually,
using Value in Use method. the calculation of value in use for the
cash generating unit is most sensitive to the assumptions of sales
growth, discount rates and cost increases due to inflation. Further
details are given in note 4.
Inventory valuation - Produce inventorythe Group has valued part of unsold produce inventory at since
realized prices. the balance unsold inventory remained as at the
balance sheet date valued at an estimated selling price based on
the most recent selling prices available subsequent to the year
end.
2.2 FOREIGN CURRENCY TRANSLATION2.2.1 Foreign currency transactionsthe consolidated financial statements are presented in sri Lanka
rupees, which is the company’s functional and presentation
currency.
the functional currency is the currency of the primary economic
environment in which the entities of the group operate.
All foreign exchange transactions are converted to sri Lanka
rupees, at the rates of exchange prevailing at the time the
transactions are effected.
Monetary assets and liabilities denominated in foreign currency
are retranslated to sri Lankan Rupee equivalents at the exchange
rate prevailing at the Balance sheet date. non-monetary assets
and liabilities are translated using exchange rates that existed
when the values were determined. the resulting gains and losses
are accounted for in the Income statement.
2.2.2 Foreign operationsthe Balance sheet and Income statement of subsidiaries which
are deemed to be foreign operations are translated to sri Lankan
Rupees at the rate of exchange prevailing as at the Balance
sheet date and at the average annual rate of exchange for the
period respectively.
Arpitalian Compact soles (Private) Limited use Us dollars as its
functional currency as it conducts the majority of its business in
Us dollars and is entitled to the benefits provided to companies
approved by the Board of Investment of sri Lanka. Arpitalian
Compact soles (Private) Limited adopted Us dollars as its
measurement and functional currency in line with sLAs 21 which
deals with “effects of Changes in Foreign exchange Rates” and
has been translated to the presentation currency of the group, sri
Lankan Rupees, for consolidation purpose.
the exchange differences arising on the translation are taken
directly to a separate component of equity. on disposal of a
foreign entity, the deferred cumulative amount recognized in
equity relating to that particular foreign operation is recognized in
the Income statement.
84 Richard Pieris and Company PLC | Annual Report 2011/2012
2.3 TAX2.3.1 Current taxProvision for income tax is based on the elements of income
and expenditure as reported in the financial statements and is
computed in accordance with the provisions of the relevant tax
statutes.
2.3.2 Deferred taxDeferred taxation is the tax attributable to the temporary
differences that arise when taxation authorities recognize and
measure assets and liabilities with rules that differ from those of
the consolidated financial statements.
Deferred tax is provided using the liability method on temporary
differences at the balance sheet date between the tax bases
of assets and liabilities and their carrying amounts for financial
reporting purposes.
Deferred tax assets are recognized for all deductible temporary
differences, carry-forward of unused tax credits and unused tax
losses, to the extent that it is probable that taxable profit will be
available against which the deductible temporary differences, and
the carry-forward of unused tax credits and unused tax losses
can be utilized.
the carrying amount of deferred tax assets is reviewed at each
Balance sheet date and reduced to the extent that it is no longer
probable that sufficient taxable profit will be available to allow
all or part of the deferred tax asset to be utilized. Unrecognized
deferred tax assets are reassessed at each balance sheet date
and are recognized to the extent that it has become probable
that future taxable profit will allow the deferred tax asset to be
recovered.
Deferred tax assets and liabilities are measured at tax rates that
are expected to apply to the year when the asset is realized or
liability is settled, based on the tax rates and tax laws that have
been enacted or substantively enacted as at the balance sheet
date.
Deferred tax assets and deferred tax liabilities are offset, if a
legally enforceable right exists to set off current tax assets against
current tax liabilities and when the deferred taxes relate to the
same taxable entity and the same taxation authority.
Deferred tax relating to items recognized directly in equity is
recognized in equity.
2.4 VALUATION OF ASSETS AND THEIR BASES OF MEASUREMENT2.4.1 Property, plant and equipment
a) Cost and valuationProperty, plant and equipment is stated at cost or fair value less
accumulated depreciation and any accumulated impairment in
value.
the carrying values of property plant and equipment are reviewed
for impairment when events or changes in circumstances
indicate that the carrying value may not be recoverable. All items
of property, plant and equipment are initially recorded at cost.
Where items of property, plant and equipment are subsequently
revalued, the entire class of such assets is revalued at fair value.
When an asset is revalued, any increase in the carrying amount is
credited directly to a revaluation reserve, except to the extent that
it reverses a revaluation decrease of the same asset previously
recognized in the Income statement, in which case the increase
is recognized in the Income statement. Any revaluation deficit
that offsets a previous surplus in the same asset is directly offset
against the surplus in the revaluation reserve and any excess
recognized as an expense. Upon disposal, any revaluation
reserve relating to the asset sold is transferred to retained
earnings.
Items of property, plant and equipment are de-recognized upon
replacement, disposal or when no future economic benefits are
expected from its use. Any gain or loss arising on de-recognition
of the asset is included in the Income statement in the year the
asset is de-recognized.
Immature and mature plantationsthe cost of replanting and new planting are classified as
immature plantations up to the time of harvesting the crop.
Further the general charges incurred on the plantation are
apportioned based on the labour days spent on respective
replanting and new planting, and capitalized on the immature
areas. the remaining portion of the general charges is expensed
in the accounting period in which it is incurred. the cost of areas
coming in to bearing are transferred to mature plantations and
depreciated over their useful life period.
Infilling costWhere infilling results in an increase in the economic life of
the relevant field beyond its previously assessed standard of
performance, the costs are capitalized in accordance with sri
notes to the Financial statements Contd.
85 Richard Pieris and Company PLC | Annual Report 2011/2012
Lanka Accounting standard 32 “Plantations” and depreciated
over the useful life as rates applicable to mature plantations.
Infilling costs that are not capitalized have been charged to the
Income statement in the year in which they are incurred.
b) DepreciationProvision for depreciation is calculated by using a straight
line method on the cost or valuation of all property, plant and
equipment, other than freehold land, in order to write off such
amounts over the estimated useful economic life of such assets.
the estimated useful lives of assets are as follows:
Buildings 20-60 years
Plant, machinery tools and electrical installations 5-10 years
Furniture, fixtures and fittings 4-10 years
office and other equipment 5-10 years
Computers 3-10 years
Motor vehicles 4-10 years
Land improvements 20 years
Replanting and new planting
- tea 33 years
- Rubber 20 years
- Coconut 50 years
the useful life and residual value of assets are reviewed, and
adjusted if required, at the end of each financial year.
c) Finance leasesProperty, plant and equipment on finance leases, which
effectively transfer to the group substantially all the risk and
benefits incidental to ownership of the leased items, are
capitalized and disclosed as finance leases at their cash price
and depreciated over the period the group is expected to benefit
from the use of the leased assets.
the corresponding principal amount payable to the lessor is
shown as a liability. Lease payments are apportioned between
the finance charges and reduction of the lease liability so as to
achieve a constant rate of interest on the outstanding balance
of the liability. the interest payable over the period of the lease
is transferred to an interest in suspense account. the interest
element of the rental obligations pertaining to each financial year
is charged to the Income statement over the period of lease.
the cost of improvements to leasehold property is capitalized,
disclosed as leasehold improvements, and depreciated over the
unexpired period of the lease or the estimated useful life of the
improvements, whichever is shorter.
d) Operating leasesLeases, where the lessor effectively retains substantially all of the
risks and benefits of ownership over the term of the lease, are
classified as operating leases.
Lease payments are recognized as an expense in the Income
statement over the term of the lease.
2.4.2 Leasehold propertyLeasehold property is stated at recorded carrying values as at
the effective date - sri Lanka Accounting standard 19 - Leases.
such carrying amounts are amortized over the remaining lease
term or useful life of the leased property whichever in shorter. no
further revaluations of these leasehold properties will be carried
out.
the leasehold rights are being amortized in equal amounts over
the following periods:
Bare land 53 years
Mature plantations 30 years
Leasehold buildings 25 years
Machinery 15 years
Land improvements 30 years
2.4.3 Investment propertyProperties held to earn rental income, and properties held for
capital appreciation have been classified as investment property.
Investment properties are measured initially at cost, including
transaction costs. the carrying amount includes the cost of
replacing part of an existing investment property at the time that
cost is incurred if the recognition criteria are met; and excludes
the costs of day to day servicing of an investment property.
After initial recognition the company measures all of its
investment property using the cost model in accordance with
the requirements in sLAs 18 (Revised 2005) Property, Plant and
equipment other than those that meet the criteria to be classified
as held for sale.
Investment properties are de-recognized when disposed, or
permanently withdrawn from use because no future economic
benefits are expected. Any gains or losses on retirement or
disposal are recognized in the Income statement in the year of
retirement or disposal.
86 Richard Pieris and Company PLC | Annual Report 2011/2012
transfers are made to investment property, when there is a
change in use, evidenced by ending of owner occupation,
commencement of an operating lease to another party or
ending of construction or development. transfers are made from
investment property, when there is a change in use, evidenced
by commencement of owner-occupation or commencement of
development with a view to sale.
Where group companies occupy a significant portion of the
investment property of a subsidiary, such investment properties
are treated as property, plant and equipment in the consolidated
financial statements, and accounted for as per sLAs 18 (revised
2005) Property, Plant and equipment.
2.4.4 Intangible assetsAn intangible asset is initially recognized at cost, if it is probable
that future economic benefit will flow to the enterprise, and the
cost of the asset can be measured reliably.
Following initial recognition, intangible assets are carried at
cost less any accumulated amortization and any accumulated
impairment losses.
Intangible assets with finite lives are amortized over the useful
economic life and assessed for impairment whenever there is
an indication that the intangible asset may be impaired. the
amortization period and the amortization method for an intangible
asset with a finite useful life is reviewed at least at each financial
year end.
Intangible assets with indefinite useful lives are tested for
impairment annually either individually or at the cash generating
unit level.
2.4.5 InvestmentsAll quoted and un-quoted securities, which are held as non-
current investments, are valued at cost. the cost of the
investment is the cost of acquisition inclusive of brokerage
and costs of transaction. the carrying amounts of long term
investments are reduced to recognize a decline which is
considered other than temporary, in the value of investments,
determined on an individual investment basis.
In the company’s financial statements, investments in subsidiaries
and associate companies have been accounted for at cost,
net of any impairment losses which are charged to the Income
statement. Incomes from these investments are recognized only
to the extent of dividends received.
short term investments are carried at market value.
2.4.6 Impairment of assetsthe group assesses at each reporting date whether there is an
indication that an asset may be impaired. If any such indication
exists, or when annual impairment testing for an asset is required,
the Group makes an estimate of the asset’s recoverable amount.
An asset’s recoverable amount is the higher of an asset’s or
cash generating unit’s fair value less costs to sell and its value in
use and is determined for an individual asset, unless the asset
does not generate cash inflows that are largely independent of
those from other assets or groups of assets. Where the carrying
amount of an asset exceeds its recoverable amount, the asset
is considered impaired and is written down to its recoverable
amount. In assessing value in use, the estimated future cash
flows are discounted to their present value using a pre-tax
discount rate that reflects current market assessments of the time
value of money and the risks specific to the asset.
Impairment losses are recognized in the income statement
except for impairment losses in respect of property, plant and
equipment which are recognized against the revaluation reserve
to the extent that it reverses a previous revaluation surplus.
An assessment is made at each reporting date as to whether
there is any indication that previously recognized impairment
losses may no longer exist or may have decreased. Previously
recognized impairment losses other than in respect of goodwill,
are reversed only if there has been an increase in the recoverable
amount of the asset. such increase is recognized to the extent of
the carrying amount had no impairment losses been recognized
previously.
2.4.7 InventoriesInventories other than produce inventories are valued at the lower
of cost and net realizable value after making due allowances
for obsolete and slow moving items. net realizable value is the
estimated selling price less estimated costs of completion and
the estimated costs necessary to make the sale.
the costs incurred in bringing inventories to its present location
and condition, are accounted for as follows:
a) Raw materialsAt actual cost on first-in first-out basis and weighted average cost
notes to the Financial statements Contd.
87 Richard Pieris and Company PLC | Annual Report 2011/2012
b) Work-in- progressAt the cost of direct materials, direct labour and an appropriate
proportion of production overheads based on normal operating
capacity.
c) Finished goodsAt purchase cost and /or cost of direct materials, direct labour
and an appropriate proportion of production overheads based on
normal operating capacity.
d) Goods in transitAt actual cost
e) Produce inventoriesAt estimated selling prices or since realized price
f) Growing Crop NurseriesAt the cost of direct materials, direct Labour and an appropriate
proportion of directly attributable overheads.
f) Input MaterialAt average cost
g) Consumables and SparesAt Actual cost
2.4.8 Trade and other receivablestrade and other receivables are stated at the amounts they are
estimated to realize, net of allowances for bad and doubtful
receivables.
Allowances have been made for bad and doubtful debts. Bad
debts are written off when identified.
2.4.9 Cash and cash equivalentsCash and cash equivalents in the cash flow statement comprise
cash at bank and in hand and short term deposits with a maturity
of 3 months or less, net of outstanding bank overdrafts and short
term borrowings.
2.5 LIABILITIES AND PROVISIONS2.5.1 Employee Benefit Liabilities a) Defined benefit plan - Gratuitythe Group measures the present value of the promised
retirement benefits of gratuity, which is a defined benefit plan
using Projected Unit Credit method (PUC).
the service of a qualified actuary is obtained to determine the
valuation once in every 2 years for plantation companies and
every 3 years for other companies in the Group.
Actuarial gains and losses are recognized as income or expenses
immediately.
this item is stated under employee Benefit Liabilities in the
Balance sheet.
the basis of payment of retiring gratuity as follows:
Length of No. of months service salary for each (years) completed year of service
00-04 005-10 ½11-20 ¾21-30 1over 30 1 ¼
the basis of payment of retiring Gratuity was revised for
employees recruited on or after 1st August 2011 to be in line with
the provisions of the Gratuity Act no.12 of 1983.
b) Defined contribution plans - Employees’ Provident Fund and Employees’ Trust Fundemployees are eligible for Arpico employees’ Provident Fund
Contributions / employees’ Provident Fund Contributions and
employees’ trust Fund Contributions in line with the respective
statutes and Regulations. the Companies contribute 12% and
3% of gross emoluments of employees to the Arpico employees’
Provident Fund / employees’ Provident Fund and employees’
trust Fund respectively.
2.5.2 Grants and subsidiesGrants are recognized where there is reasonable assurance
that the grant will be received and all attaching conditions will
be complied with. When the grant relates to an expense item,
it is recognized as income over the period necessary to match
the grant on a systematic basis to the costs that it is intended
to compensate. Where the grant relates to an asset, it is set up
as deferred income. Where the group receives non-monetary
grants, the asset and that grant are recorded at nominal amounts
and is released to the Income statement over the expected
useful life of the relevant asset by equal annual installments.
88 Richard Pieris and Company PLC | Annual Report 2011/2012
2.5.3 Provisions, contingent assets and contingent liabilitiesProvisions are made for all obligations existing as at the Balance
sheet date when it is probable that such an obligation will result
in an outflow of resources and a reliable estimate can be made of
the quantum of the outflow.
All contingent liabilities are disclosed as a note to the financial
statements unless the outflow of resources is remote.
Contingent assets are disclosed, where inflow of economic
benefit is probable.
2.6 INCOME STATEMENT2.6.1 Revenue recognitionRevenue is recognized to the extent that it is probable that the
economic benefits will flow to the group, and the revenue and
associated costs incurred or to be incurred can be reliably
measured. Revenue is measured at the fair value of the
consideration received or receivable, net of trade discounts and
value added taxes, after eliminating sales within the group.
the following specific criteria are used for recognition of revenue:
a) Sale of goodsRevenue from the sale of goods is recognized when the
significant risk and rewards of ownership of the goods have
passed to the buyer with the group retaining neither a continuing
managerial involvement to the degree usually associated with
ownership, nor an effective control over the goods sold.
b) Rendering of servicesRevenue from rendering of services is recognized in the
accounting period in which the services are rendered or
performed.
c) Construction revenueConstruction revenue is recognized by reference to the stage
of completion, determined by taking into accounts the labour
hours incurred to date as a percentage of total estimated labour
hours for each contract. Where the contract outcome cannot
be measured reliably, revenue is recognized only to the extent of
expenses incurred that are recoverable.
d) Plantation companiesIn keeping with the practice in the Plantation Industry revenue or
profit or loss on Perennial Crops are recognized in the financial
period of harvesting. Revenue is recorded at invoice value net
of brokerage, public sale expenses and other levies related to
turnover.
e) Turnover based taxesturnover based taxes include Value Added tax, economic
service Charge, turnover tax and nation Building tax.
Companies in the group pay such taxes in accordance with the
respective statutes.
2.6.2 DividendDividend income is recognized when the shareholders’ right to
receive the payment is established.
2.6.3 Rental incomeRental income is recognized on an accrual basis over the term of
the lease.
2.6.4 RoyaltiesRoyalties are recognized on an accrual basis in accordance with
the substance of the relevant agreement.
2.6.5 Interest incomeInterest income is recognized as and when the interest accrues.
2.6.6 Gains and lossesnet gains and losses of a revenue nature arising from the
disposal of property, plant and equipment and other non-current
assets, including investments, are accounted for in the Income
statement, after deducting from the proceeds on disposal, the
carrying amount of such assets and the related selling expenses.
Gains and losses arising from activities incidental to the main
revenue generating activities and those arising from a group
of similar transactions which are not material, are aggregated,
reported and presented on a net basis.
2.6.7 Other incomeother income is recognized on an accrual basis.
2.6.8 Borrowing costsBorrowing costs are recognized as an expense in the period in
which they are incurred except to the extent where borrowing
costs that are directly attributable to the acquisition, construction
or production of assets that takes a substantial period of time to
get ready for its intended use or sale, is capitalized.
notes to the Financial statements Contd.
89 Richard Pieris and Company PLC | Annual Report 2011/2012
2.7 SIGNIFICANT ACCOUNTING POLICIES THAT ARE SPECIFIC TO THE BUSINESS OF INSURANCE COMPANIES
2.7.1 Actuarial Valuations of the Insurance Provisions the valuation of Long term Insurance Provision was carried out
by Messrs. Actuarial and Management Consultants (Pvt) Ltd and
the directors agree to the long term nature of insurance business
provisions on the recommendation of the said actuary.
the actuarial valuation takes into account all liabilities including
contingent liabilities and is based on assumptions recommended
by the independent external actuary. the liability for life insurance
contracts is based on current assumptions or on assumptions
established at inception of the contract, incorporating regulator
recommended minimum requirements.
the main assumptions used relate to mortality, morbidity,
investment returns and discount rates. Industry and company
experience on mortality and morbidity is considered, adjusted
when appropriate to reflect the product characteristics, target
markets and own claims severity and frequency experiences.
Discount rates are based on current and historical rates, adjusted
for regulator recommended basis.
2.7.2 Life Insurance Business – Gross Written PremiumPremiums from traditional long term insurance contacts, including
participating contacts and annuity policies with life contingencies,
are recognized as revenue when cash is received from the
policyholder. the “single Premium” contracts are also recognized
as income when cash received.
2.8 SEGMENT INFORMATION2.8.1 Reporting segmentsthe activities of the segments are described in the segmental
Review of operations. segmentation has been determined
based on primary format and secondary format. Primary format
represents the business segments, identified based on the
differences in the products and services produced which has
a similar nature of process, risk and return while the secondary
format is on the basis of geographical areas in which the
products or services are sold. the operating results of the
segments are described in note 21 to the financial statements.
the geographical analysis is by the location of the customer.
since the manufacturing and marketing service as well as the
assets and liabilities are located in sri Lanka, only the turnover
has been analyzed into the geographical location.
2.8.2 Segment informationsegment information has been prepared in conformity with the
accounting policies adopted for preparing and presenting the
consolidated financial statements of the Group.
2.9 Sri Lanka Accounting Standards effective from 01 January 2012the Group will be adopting the new sri Lanka Accounting
standards (new sLAs) comprising LKAs and sLFRs applicable
for financial periods commencing from 01 April 2012 as issued
by the Institute of Chartered Accountants of sri Lanka. the Group
has commenced reviewing its accounting policies and financial
reporting in readiness for the transition. set out below are the key
areas where accounting policies will change and may have an
impact on the financial statements of the Group. the Group is in
the process of quantifying the impact on the financial statements
arising from such changes in accounting policies.
(a) sLFRs 1 - First time Adoption of sri Lanka Accounting
standards requires the Group to prepare and present
opening new sLFRs financial statements at the date of
transition to new sLAs. the Group shall use the same
accounting policies in its opening new sLAs financial
statements and throughout all comparable periods
presented in its first new sLAs financial statements.
LKAs 1 - Presentation of Financial statements requires
an entity to present, in a statement of changes in equity,
all owner changes in equity. All non owner changes in
equity are required to be presented in one statement of
comprehensive income or in two statements (a separate
income statement and a statement of comprehensive
income). Components of comprehensive income are not
permitted to be presented in the statement of changes in
equity. this standard also requires the Group to disclose
information that enables users of its financial statements to
evaluate the entity’s objectives, policies and processes for
managing capital.
(b) LKAs 16 – Property Plant and equipment requires a
company to initially measure an item of property plant
and equipment at cost, using the cash price equivalent
at the recognition date. If payment is deferred beyond
normal credit terms, the difference between the cash price
equivalent and the total payment is recognized as interest
over the period, unless such interest is capitalized in
accordance with LKAs 23 Borrowing Costs.

90 Richard Pieris and Company PLC | Annual Report 2011/2012
All site restoration costs including other environmental
restoration and similar costs must be estimated and
capitalised at initial recognition, in order that such costs can
be depreciated over the useful life of the asset.
this standard requires depreciation of assets over their
useful lives, where the residual value of assets is deducted
to arrive at the depreciable value. It also requires that
significant components of an asset be evaluated separately
for depreciation.
(c) LKAs 32 – Financial Instruments: Presentation, LKAs 39 –
Financial Instruments: Recognition and Measurement and
sLFRs 7 – Disclosures will result in changes to the current
method of recognizing financial assets, financial liabilities
and equity instruments. these standards will require
measurement of financial assets and financial liabilities at fair
value at initial measurement. the subsequent measurement
of financial assets classified as fair value through profit and
loss and available for sale will be at fair value, with the gains
and losses routed through the statements of comprehensive
income and other comprehensive income respectively.
Financial assets classified as held to maturity and loans and
receivables will be measured subsequently at amortized
cost. these assets will need to be assessed for any
objective evidence of impairment as a result of one or more
events that occurred after the initial recognition of the asset
(a ‘loss event’) coupled with a reliable estimate of the loss
event (or events) impact on the estimated future cash flows
of the financial asset or group of financial assets . As such
the current method of assessing for impairment will have
to be changed to meet the requirements of these new
standards.
Financial liabilities will be either classified as fair value
through profit or loss or at amortized cost. At present, the
company/group does not identify, categorize and measure
financial assets and liabilities as per the requirements of
the standard and also does not recognize certain derivative
instruments on the balance sheet.
(d) sLFRs 2 – share Based Payments, will require the
company to reflect in its profit or loss and financial position
the effects of share based payment transactions, including
expenses associated with share options granted to
employees. An entity is required to recognize share based
payment transactions when goods are received or services
obtained based on the fair value of goods or services or the
fair value of equity instruments granted. Hence the company
will be required to determine the fair value of options issued
to employees as remuneration and recognize an expense in
the statement of financial performance. this standard is not
limited to options and extends to all forms of equity based
remuneration and payments.
(e) sLFRs 3 – Business combinations will require the company
to apply this standard to transactions and other events that
meet the new definition of a business i.e. an integrated
set of assets (inputs) and activities( processes) which are
capable of being conducted and managed to provide a
return, as opposed to a mere asset acquisition. Under
the new acquisition method of accounting, in addition to
recognizing and measuring in its financial statements the
identifiable assets acquired and liabilities assumed the
standard also requires recognition and measurement of any
non-controlling interest in the acquiree and re-measuring to
fair value any previously held interests which could have an
impact on the recognition of goodwill. subsequent to the
acquisition of control any acquisitions or disposals of non-
controlling interest without loss of control will be accounted
for as equity transactions and cannot be recognized as
profit/loss on disposal of investments in the statement of
financial performance.
(f) LKAs 23 – Borrowing Cost, the company/group must
capitalize borrowing costs in relation to a qualifying asset.
[if applicable] since the current policy is to expense all
borrowing costs, this will result in a change in accounting
policy.
(g) LKAs 12 – Income tax requires deferred tax to be provided
in respect of temporary differences which will arise as a
result of adjustments made to comply with the new sLAs.
(h) LKAs 18 – Revenue requires the company to measure
revenue at fair value of the consideration received or
receivable. It also specifies recognition criteria for revenue,
and the company/Group needs to apply such recognition
criteria to the separately identifiable components of a
single transaction in order to reflect the substance of the
transaction.
notes to the Financial statements Contd.
91 Richard Pieris and Company PLC | Annual Report 2011/2012
(i) sLFRs 4 -Insurance Contacts has scoped in only products
which fall within the definition of insurance contracts
or financial instruments issued with a discretionary
participation features as defined in sLFRs 4. For the
purpose of identifying the contracts that can be scoped in,
the company is at present performing a detailed product
analysis. Any contract which is recorded at present as an
insurance contract but does not meet the definitions of
sLFRs 4 is required to be measured and accounted as
financial instruments which will impact the recognition of
Gross Written Premium and deferred acquisition costs.
(j) IFRIC 15 Agreements for Construction of Real estate -
this interpretation clarifies whether LKAs 18, ‘Revenue’
or LKAs 11 ‘Construction contracts’ should be applied to
particular transactions. It also explains the point at which
revenue and related expenses from a sale of real estate
unit should be recognized, if an agreement between a
developer and a buyer is reached before the construction of
the real estate unit is completed. the company’s/ Group’s
current accounting policy for all residential property sales
is to recognize revenue on the percentage completion of
construction, which practice is most likely to be changed
by the application of IFRIC 15. As per this interpretation,
contracts which do not fall within the definition of
construction contracts in accordance with LKAs 11, can
only be accounted for under the percentage of completion
method if the company/Group continuously transfer to
the buyer control and the significant risks and rewards of
ownership of the work in progress in its current state of
construction progresses.
the Institute of Chartered Accountants of sri Lanka has
resolved an amendment to sri Lanka Accounting standard
10, whereby the provision contained in paragraphs 30
and 31 of sLAs 10 – Accounting Policies, Changes in
Accounting estimates and errors, would not be applicable
for financial statements prepared in respect of financial
periods commencing before 1 January 2012 and hence the
impact of this transition is not required to be disclosed in
these financial statements.
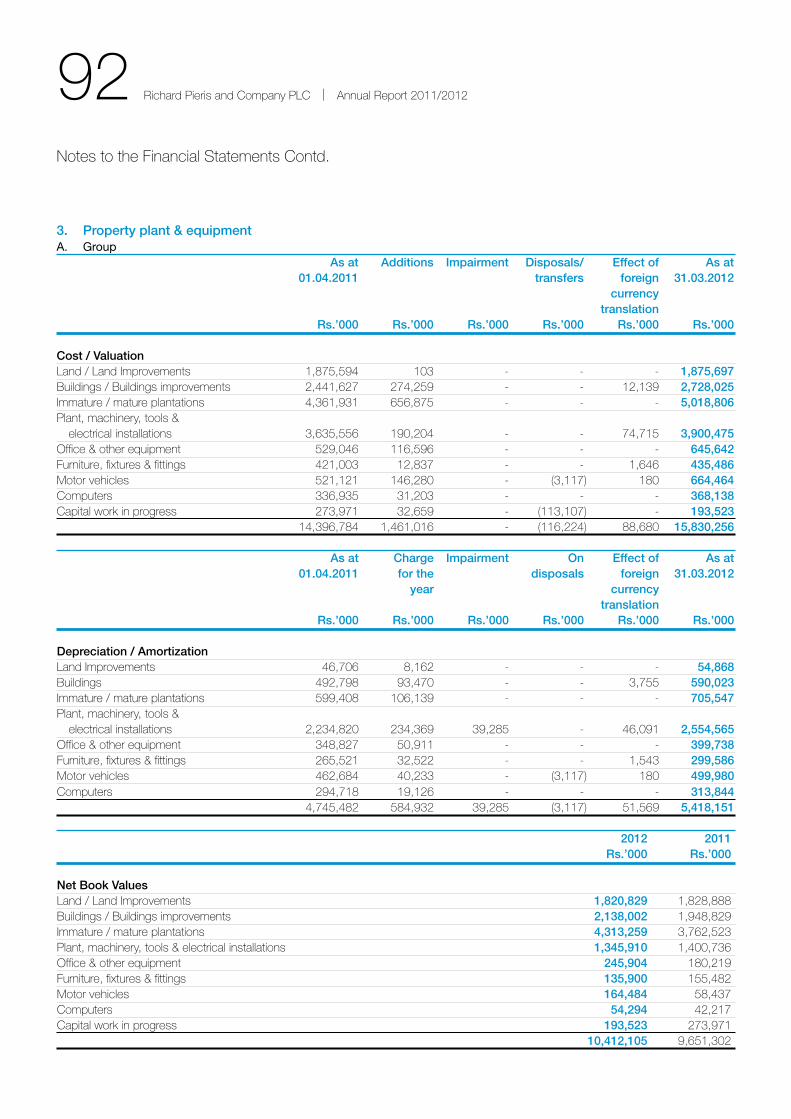
92 Richard Pieris and Company PLC | Annual Report 2011/2012
3. Property plant & equipmentA. Group As at Additions Impairment Disposals/ Effect of As at 01.04.2011 transfers foreign 31.03.2012 currency translation Rs.’000 Rs.’000 Rs.’000 Rs.’000 Rs.’000 Rs.’000
Cost / ValuationLand / Land Improvements 1,875,594 103 - - - 1,875,697Buildings / Buildings improvements 2,441,627 274,259 - - 12,139 2,728,025Immature / mature plantations 4,361,931 656,875 - - - 5,018,806Plant, machinery, tools & electrical installations 3,635,556 190,204 - - 74,715 3,900,475office & other equipment 529,046 116,596 - - - 645,642Furniture, fixtures & fittings 421,003 12,837 - - 1,646 435,486Motor vehicles 521,121 146,280 - (3,117) 180 664,464Computers 336,935 31,203 - - - 368,138Capital work in progress 273,971 32,659 - (113,107) - 193,523 14,396,784 1,461,016 - (116,224) 88,680 15,830,256
As at Charge Impairment On Effect of As at 01.04.2011 for the disposals foreign 31.03.2012 year currency translation Rs.’000 Rs.’000 Rs.’000 Rs.’000 Rs.’000 Rs.’000
Depreciation / AmortizationLand Improvements 46,706 8,162 - - - 54,868Buildings 492,798 93,470 - - 3,755 590,023Immature / mature plantations 599,408 106,139 - - - 705,547Plant, machinery, tools & electrical installations 2,234,820 234,369 39,285 - 46,091 2,554,565office & other equipment 348,827 50,911 - - - 399,738Furniture, fixtures & fittings 265,521 32,522 - - 1,543 299,586Motor vehicles 462,684 40,233 - (3,117) 180 499,980Computers 294,718 19,126 - - - 313,844 4,745,482 584,932 39,285 (3,117) 51,569 5,418,151
2012 2011 Rs.’000 Rs.’000
Net Book ValuesLand / Land Improvements 1,820,829 1,828,888Buildings / Buildings improvements 2,138,002 1,948,829Immature / mature plantations 4,313,259 3,762,523Plant, machinery, tools & electrical installations 1,345,910 1,400,736office & other equipment 245,904 180,219Furniture, fixtures & fittings 135,900 155,482Motor vehicles 164,484 58,437Computers 54,294 42,217Capital work in progress 193,523 273,971 10,412,105 9,651,302
notes to the Financial statements Contd.
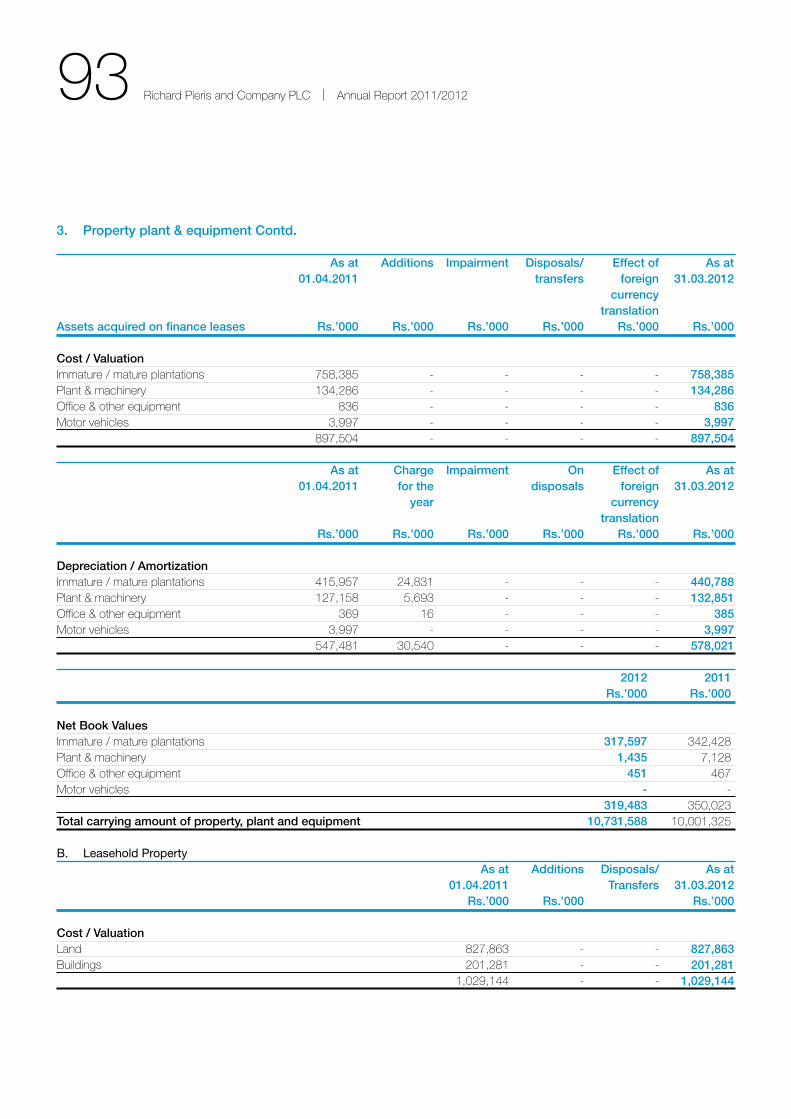
93 Richard Pieris and Company PLC | Annual Report 2011/2012
3. Property plant & equipment Contd.
As at Additions Impairment Disposals/ Effect of As at 01.04.2011 transfers foreign 31.03.2012 currency translation Assets acquired on finance leases Rs.’000 Rs.’000 Rs.’000 Rs.’000 Rs.’000 Rs.’000
Cost / ValuationImmature / mature plantations 758,385 - - - - 758,385Plant & machinery 134,286 - - - - 134,286office & other equipment 836 - - - - 836Motor vehicles 3,997 - - - - 3,997 897,504 - - - - 897,504
As at Charge Impairment On Effect of As at 01.04.2011 for the disposals foreign 31.03.2012 year currency translation Rs.’000 Rs.’000 Rs.’000 Rs.’000 Rs.’000 Rs.’000
Depreciation / AmortizationImmature / mature plantations 415,957 24,831 - - - 440,788Plant & machinery 127,158 5,693 - - - 132,851office & other equipment 369 16 - - - 385Motor vehicles 3,997 - - - - 3,997 547,481 30,540 - - - 578,021
2012 2011 Rs.’000 Rs.’000
Net Book ValuesImmature / mature plantations 317,597 342,428Plant & machinery 1,435 7,128office & other equipment 451 467Motor vehicles - - 319,483 350,023Total carrying amount of property, plant and equipment 10,731,588 10,001,325
B. Leasehold Property As at Additions Disposals/ As at 01.04.2011 Transfers 31.03.2012 Rs.’000 Rs.’000 Rs.’000
Cost / ValuationLand 827,863 - - 827,863Buildings 201,281 - - 201,281 1,029,144 - - 1,029,144
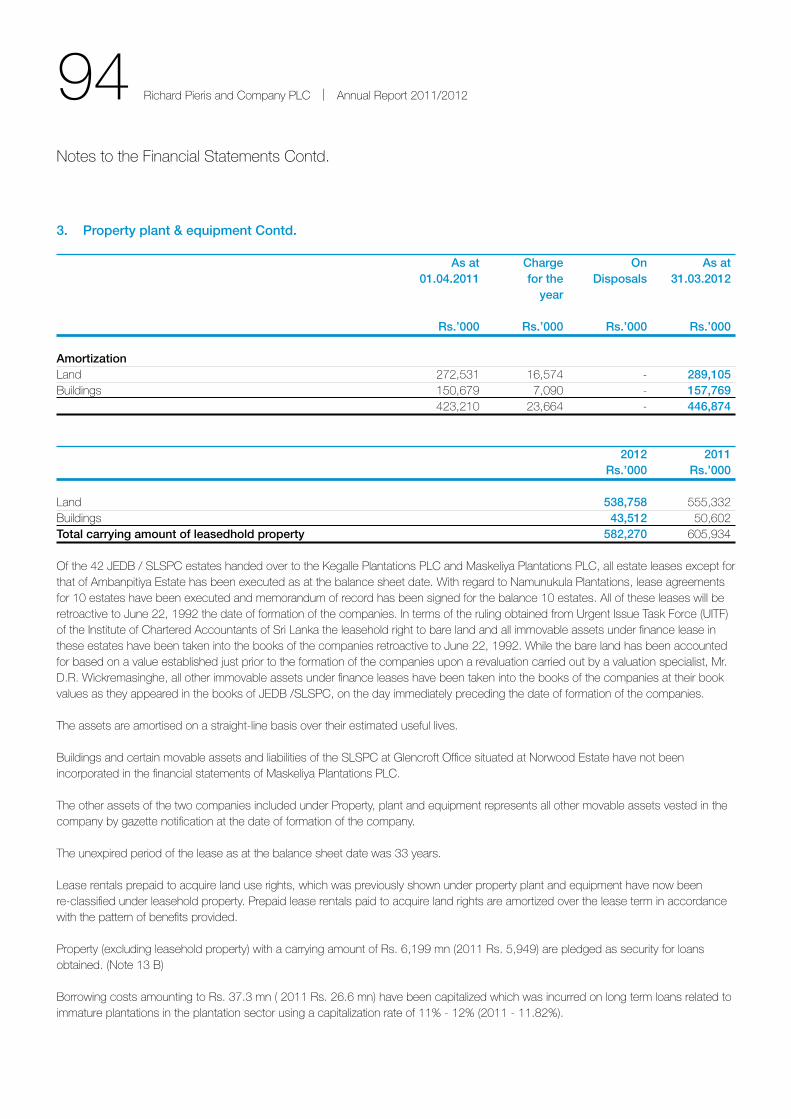
94 Richard Pieris and Company PLC | Annual Report 2011/2012
3. Property plant & equipment Contd.
As at Charge On As at 01.04.2011 for the Disposals 31.03.2012 year Rs.’000 Rs.’000 Rs.’000 Rs.’000
AmortizationLand 272,531 16,574 - 289,105Buildings 150,679 7,090 - 157,769 423,210 23,664 - 446,874
2012 2011 Rs.’000 Rs.’000
Land 538,758 555,332Buildings 43,512 50,602Total carrying amount of leasedhold property 582,270 605,934
of the 42 JeDB / sLsPC estates handed over to the Kegalle Plantations PLC and Maskeliya Plantations PLC, all estate leases except for that of Ambanpitiya estate has been executed as at the balance sheet date. With regard to namunukula Plantations, lease agreements for 10 estates have been executed and memorandum of record has been signed for the balance 10 estates. All of these leases will be retroactive to June 22, 1992 the date of formation of the companies. In terms of the ruling obtained from Urgent Issue task Force (UItF) of the Institute of Chartered Accountants of sri Lanka the leasehold right to bare land and all immovable assets under finance lease in these estates have been taken into the books of the companies retroactive to June 22, 1992. While the bare land has been accounted for based on a value established just prior to the formation of the companies upon a revaluation carried out by a valuation specialist, Mr. D.R. Wickremasinghe, all other immovable assets under finance leases have been taken into the books of the companies at their book values as they appeared in the books of JeDB /sLsPC, on the day immediately preceding the date of formation of the companies.
the assets are amortised on a straight-line basis over their estimated useful lives.
Buildings and certain movable assets and liabilities of the sLsPC at Glencroft office situated at norwood estate have not been incorporated in the financial statements of Maskeliya Plantations PLC.
the other assets of the two companies included under Property, plant and equipment represents all other movable assets vested in the company by gazette notification at the date of formation of the company.
the unexpired period of the lease as at the balance sheet date was 33 years.
Lease rentals prepaid to acquire land use rights, which was previously shown under property plant and equipment have now been re-classified under leasehold property. Prepaid lease rentals paid to acquire land rights are amortized over the lease term in accordance with the pattern of benefits provided.
Property (excluding leasehold property) with a carrying amount of Rs. 6,199 mn (2011 Rs. 5,949) are pledged as security for loans obtained. (note 13 B)
Borrowing costs amounting to Rs. 37.3 mn ( 2011 Rs. 26.6 mn) have been capitalized which was incurred on long term loans related to immature plantations in the plantation sector using a capitalization rate of 11% - 12% (2011 - 11.82%).
notes to the Financial statements Contd.
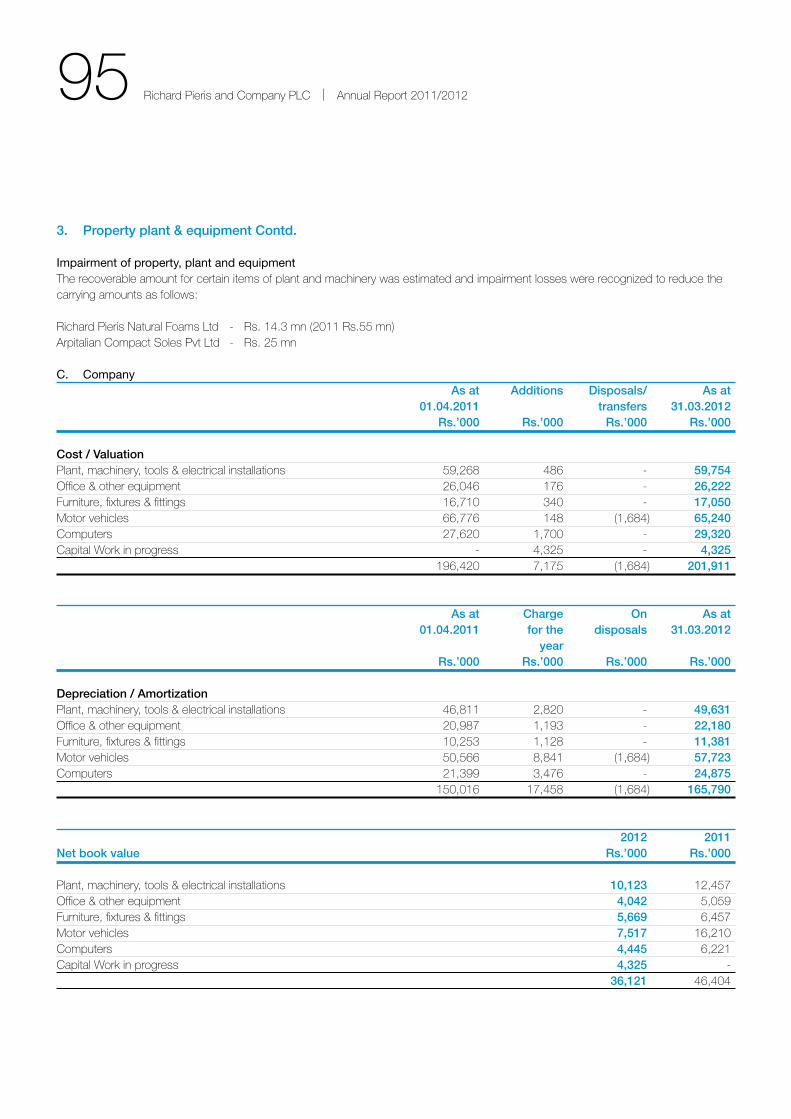
95 Richard Pieris and Company PLC | Annual Report 2011/2012
3. Property plant & equipment Contd.
Impairment of property, plant and equipmentthe recoverable amount for certain items of plant and machinery was estimated and impairment losses were recognized to reduce the carrying amounts as follows:
Richard Pieris natural Foams Ltd - Rs. 14.3 mn (2011 Rs.55 mn)Arpitalian Compact soles Pvt Ltd - Rs. 25 mn
C. Company As at Additions Disposals/ As at 01.04.2011 transfers 31.03.2012 Rs.’000 Rs.’000 Rs.’000 Rs.’000
Cost / ValuationPlant, machinery, tools & electrical installations 59,268 486 - 59,754office & other equipment 26,046 176 - 26,222Furniture, fixtures & fittings 16,710 340 - 17,050Motor vehicles 66,776 148 (1,684) 65,240Computers 27,620 1,700 - 29,320Capital Work in progress - 4,325 - 4,325 196,420 7,175 (1,684) 201,911
As at Charge On As at 01.04.2011 for the disposals 31.03.2012 year Rs.’000 Rs.’000 Rs.’000 Rs.’000
Depreciation / AmortizationPlant, machinery, tools & electrical installations 46,811 2,820 - 49,631office & other equipment 20,987 1,193 - 22,180Furniture, fixtures & fittings 10,253 1,128 - 11,381Motor vehicles 50,566 8,841 (1,684) 57,723Computers 21,399 3,476 - 24,875 150,016 17,458 (1,684) 165,790
2012 2011 Net book value Rs.’000 Rs.’000
Plant, machinery, tools & electrical installations 10,123 12,457office & other equipment 4,042 5,059Furniture, fixtures & fittings 5,669 6,457Motor vehicles 7,517 16,210Computers 4,445 6,221Capital Work in progress 4,325 - 36,121 46,404
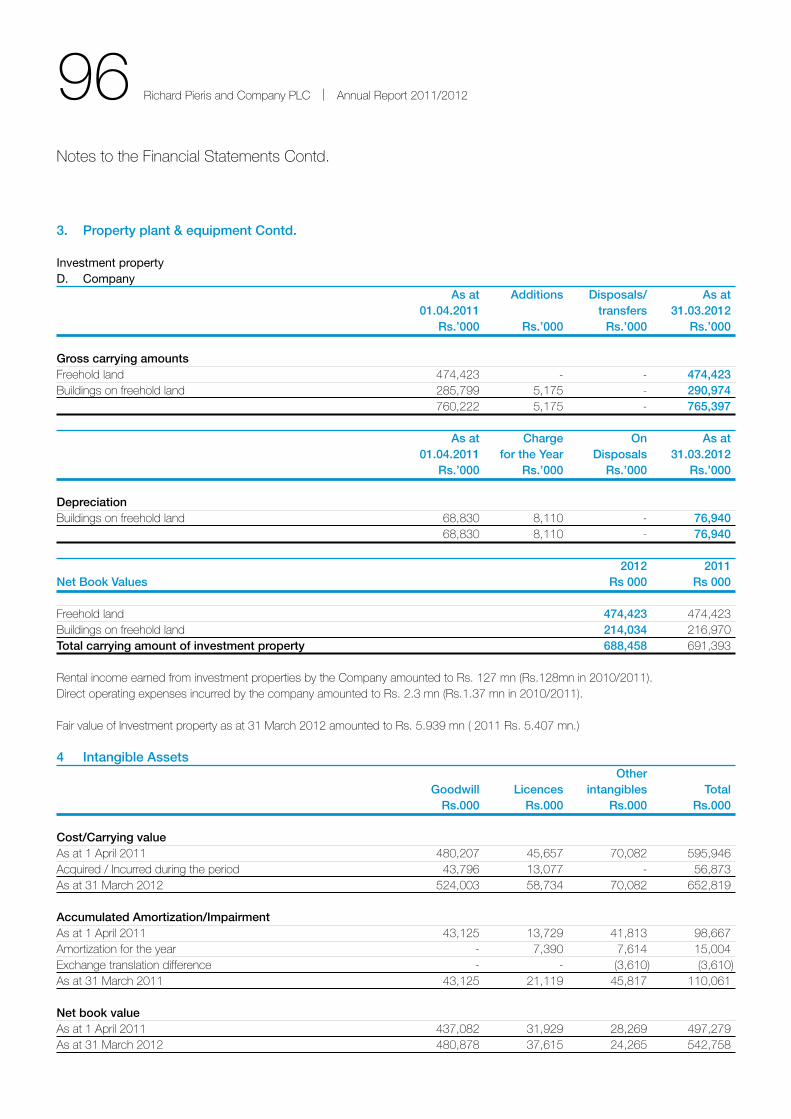
96 Richard Pieris and Company PLC | Annual Report 2011/2012
3. Property plant & equipment Contd.
Investment propertyD. Company As at Additions Disposals/ As at 01.04.2011 transfers 31.03.2012 Rs.’000 Rs.’000 Rs.’000 Rs.’000
Gross carrying amountsFreehold land 474,423 - - 474,423Buildings on freehold land 285,799 5,175 - 290,974 760,222 5,175 - 765,397
As at Charge On As at 01.04.2011 for the Year Disposals 31.03.2012 Rs.’000 Rs.’000 Rs.’000 Rs.’000
DepreciationBuildings on freehold land 68,830 8,110 - 76,940 68,830 8,110 - 76,940
2012 2011 Net Book Values Rs 000 Rs 000
Freehold land 474,423 474,423Buildings on freehold land 214,034 216,970Total carrying amount of investment property 688,458 691,393
Rental income earned from investment properties by the Company amounted to Rs. 127 mn (Rs.128mn in 2010/2011).Direct operating expenses incurred by the company amounted to Rs. 2.3 mn (Rs.1.37 mn in 2010/2011).
Fair value of Investment property as at 31 March 2012 amounted to Rs. 5.939 mn ( 2011 Rs. 5.407 mn.)
4 Intangible Assets Other Goodwill Licences intangibles Total Rs.000 Rs.000 Rs.000 Rs.000
Cost/Carrying value As at 1 April 2011 480,207 45,657 70,082 595,946Acquired / Incurred during the period 43,796 13,077 - 56,873As at 31 March 2012 524,003 58,734 70,082 652,819
Accumulated Amortization/ImpairmentAs at 1 April 2011 43,125 13,729 41,813 98,667Amortization for the year - 7,390 7,614 15,004exchange translation difference - - (3,610) (3,610)As at 31 March 2011 43,125 21,119 45,817 110,061
Net book valueAs at 1 April 2011 437,082 31,929 28,269 497,279As at 31 March 2012 480,878 37,615 24,265 542,758
notes to the Financial statements Contd.

97 Richard Pieris and Company PLC | Annual Report 2011/2012
(a) GoodwillGoodwill represents the excess of an acquisition over the Group interest in the net fair value of the identifiable assets, liabilities and contingent liabilities at the date of acquisition, and is carried at cost less accumulated impairment losses. the group Goodwill has been allocated to four cash-generating units, for impairment testing as follows;
1. Kegalle Plantations PLC2. namunukula Plantations PLC3. Maskeliya Plantations PLC4. Arpico super centre in Kandy (which is under the purview of Richard Pieris Distributors Ltd)
Goodwill is not amortised, but is reviewed for impairment annually and whether there is an indication that goodwill may be impaired. For the purpose of testing goodwill for impairment, goodwill is allocated to the operating entity level, which is the lowest level at which the goodwill is monitored for internal management purpose.
During the year the group marginally increased its stake in Kegalle Plantations PLC, namunukula Plantations PLC and Maskeliya Plantations PLC which resulted in a goodwill of Rs. 43.7 mn.
the recoverable amount of the goodwill is determined based on a value in use calculation using cash flow projections based on financial budgets approved by senior management for one year, and forecast for the four years thereafter, covering a five year period.
(b) LicensesLicenses include separately acquired five operating licenses stated at cost less accumulated amortizations and impairment losses. Licences acquired during the year have been amortized evenly over the validity period of the licence.
During the year Richard Pieris Distributors Limited obtained licenses to sell alcoholic beverages at a cost of Rs.13 mn.
(c) Other intangible assetsother intangible assets represents the value of services provided by a foreign collaborator on engineering assembly know-how training, technological assistance and works management to Arpitalian Compact soles (Private) Limited. this is amortized over a period of fifteen years commencing from the financial year 2000/2001.
the recoverable amount of the know-how is determined based on a value in use calculation using cash flow projections based on financial budgets approved by senior management for one year, and forecast for the four years thereafter, covering a five year period.
Key assumptions used in Value in Use calculationsVolume growth - Volume growth is based on past performance, the approved budget and expected performance of such CGU based on the actual performance and to evaluate future investment proposals.
Discount rates - Discount rates reflect management’s estimate of the risk specific to the unit. this is the benchmark used by management to assess operating performance and to evaluate future investment proposals.
Cost increase due to inflation - expected inflationary levels over the next five years based on management judgement were used to estimate the increase in costs over similar periods.
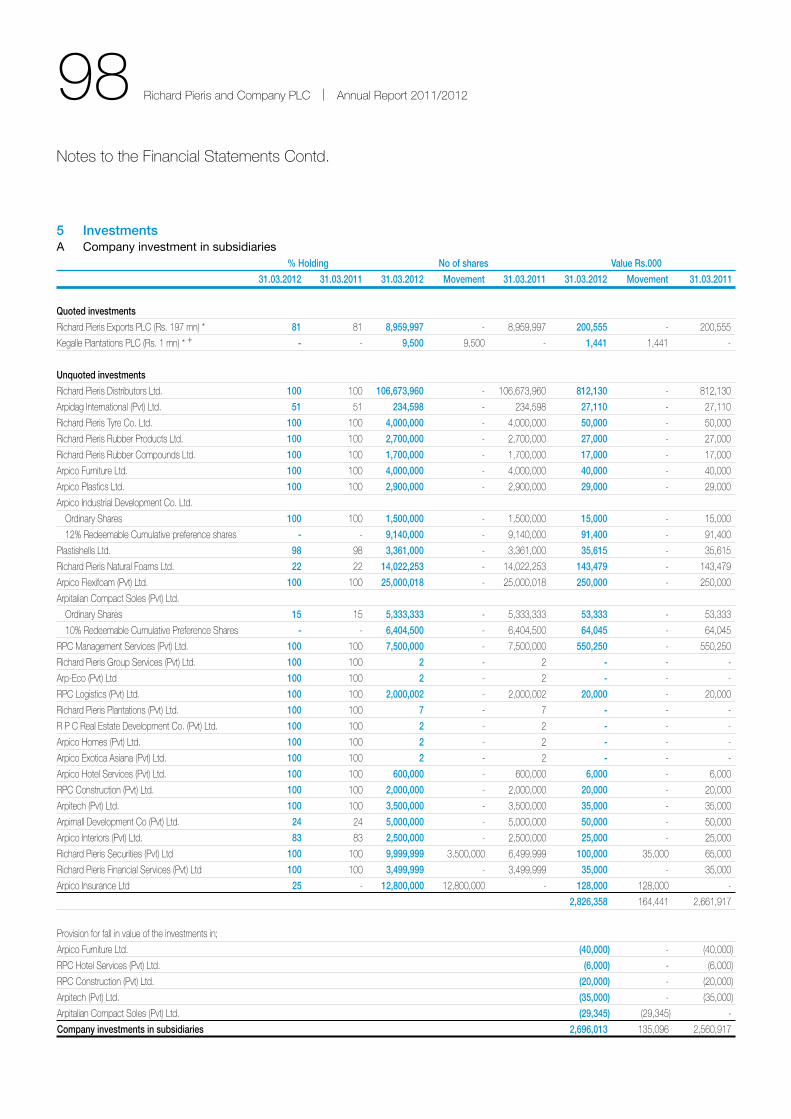
98 Richard Pieris and Company PLC | Annual Report 2011/2012
5 InvestmentsA Company investment in subsidiaries % Holding No of shares Value Rs.000
31.03.2012 31.03.2011 31.03.2012 Movement 31.03.2011 31.03.2012 Movement 31.03.2011
Quoted investments
Richard Pieris exports PLC (Rs. 197 mn) * 81 81 8,959,997 - 8,959,997 200,555 - 200,555
Kegalle Plantations PLC (Rs. 1 mn) * + - - 9,500 9,500 - 1,441 1,441 -
Unquoted investments
Richard Pieris Distributors Ltd. 100 100 106,673,960 - 106,673,960 812,130 - 812,130
Arpidag International (Pvt) Ltd. 51 51 234,598 - 234,598 27,110 - 27,110
Richard Pieris tyre Co. Ltd. 100 100 4,000,000 - 4,000,000 50,000 - 50,000
Richard Pieris Rubber Products Ltd. 100 100 2,700,000 - 2,700,000 27,000 - 27,000
Richard Pieris Rubber Compounds Ltd. 100 100 1,700,000 - 1,700,000 17,000 - 17,000
Arpico Furniture Ltd. 100 100 4,000,000 - 4,000,000 40,000 - 40,000
Arpico Plastics Ltd. 100 100 2,900,000 - 2,900,000 29,000 - 29,000
Arpico Industrial Development Co. Ltd.
ordinary shares 100 100 1,500,000 - 1,500,000 15,000 - 15,000
12% Redeemable Cumulative preference shares - - 9,140,000 - 9,140,000 91,400 - 91,400
Plastishells Ltd. 98 98 3,361,000 - 3,361,000 35,615 - 35,615
Richard Pieris natural Foams Ltd. 22 22 14,022,253 - 14,022,253 143,479 - 143,479
Arpico Flexifoam (Pvt) Ltd. 100 100 25,000,018 - 25,000,018 250,000 - 250,000
Arpitalian Compact soles (Pvt) Ltd.
ordinary shares 15 15 5,333,333 - 5,333,333 53,333 - 53,333
10% Redeemable Cumulative Preference shares - - 6,404,500 - 6,404,500 64,045 - 64,045
RPC Management services (Pvt) Ltd. 100 100 7,500,000 - 7,500,000 550,250 - 550,250
Richard Pieris Group services (Pvt) Ltd. 100 100 2 - 2 - - -
Arp-eco (Pvt) Ltd 100 100 2 - 2 - - -
RPC Logistics (Pvt) Ltd. 100 100 2,000,002 - 2,000,002 20,000 - 20,000
Richard Pieris Plantations (Pvt) Ltd. 100 100 7 - 7 - - -
R P C Real estate Development Co. (Pvt) Ltd. 100 100 2 - 2 - - -
Arpico Homes (Pvt) Ltd. 100 100 2 - 2 - - -
Arpico exotica Asiana (Pvt) Ltd. 100 100 2 - 2 - - -
Arpico Hotel services (Pvt) Ltd. 100 100 600,000 - 600,000 6,000 - 6,000
RPC Construction (Pvt) Ltd. 100 100 2,000,000 - 2,000,000 20,000 - 20,000
Arpitech (Pvt) Ltd. 100 100 3,500,000 - 3,500,000 35,000 - 35,000
Arpimall Development Co (Pvt) Ltd. 24 24 5,000,000 - 5,000,000 50,000 - 50,000
Arpico Interiors (Pvt) Ltd. 83 83 2,500,000 - 2,500,000 25,000 - 25,000
Richard Pieris securities (Pvt) Ltd 100 100 9,999,999 3,500,000 6,499,999 100,000 35,000 65,000
Richard Pieris Financial services (Pvt) Ltd 100 100 3,499,999 - 3,499,999 35,000 - 35,000
Arpico Insurance Ltd 25 - 12,800,000 12,800,000 - 128,000 128,000 -
2,826,358 164,441 2,661,917
Provision for fall in value of the investments in;
Arpico Furniture Ltd. (40,000) - (40,000)
RPC Hotel services (Pvt) Ltd. (6,000) - (6,000)
RPC Construction (Pvt) Ltd. (20,000) - (20,000)
Arpitech (Pvt) Ltd. (35,000) - (35,000)
Arpitalian Compact soles (Pvt) Ltd. (29,345) (29,345) -
Company investments in subsidiaries 2,696,013 135,096 2,560,917
notes to the Financial statements Contd.
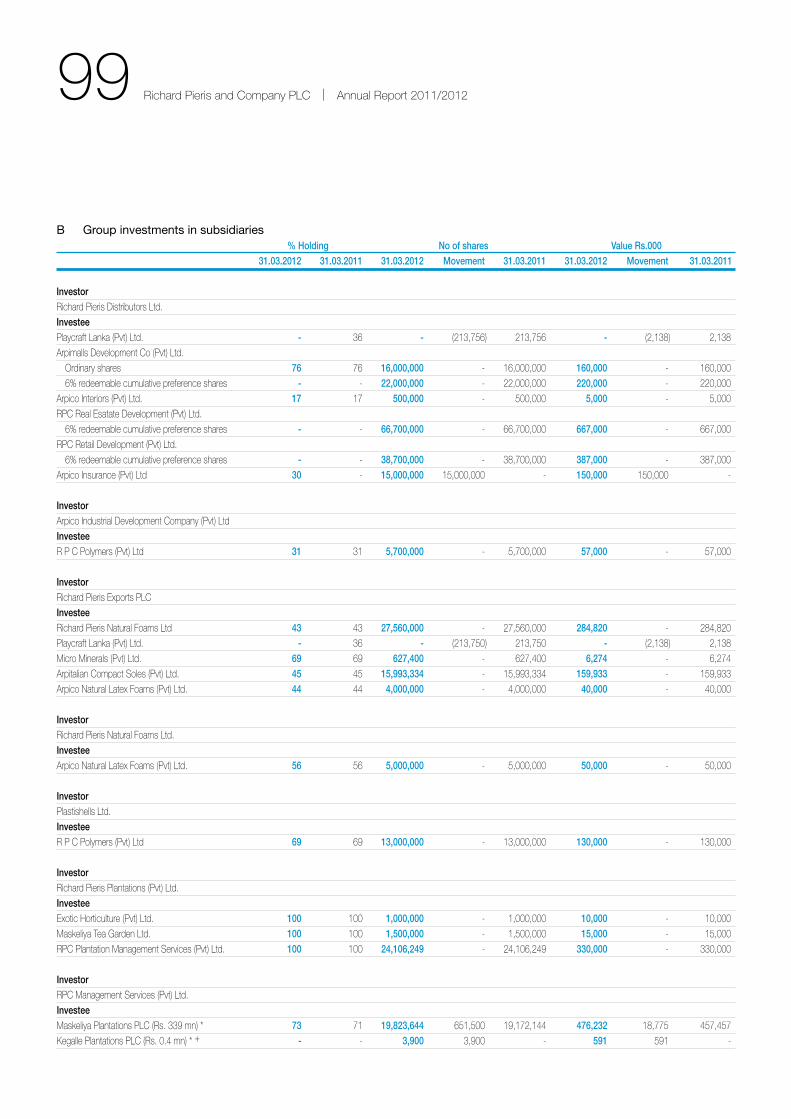
99 Richard Pieris and Company PLC | Annual Report 2011/2012
B Group investments in subsidiaries % Holding No of shares Value Rs.000 31.03.2012 31.03.2011 31.03.2012 Movement 31.03.2011 31.03.2012 Movement 31.03.2011
InvestorRichard Pieris Distributors Ltd.
InvesteePlaycraft Lanka (Pvt) Ltd. - 36 - (213,756) 213,756 - (2,138) 2,138
Arpimalls Development Co (Pvt) Ltd.
ordinary shares 76 76 16,000,000 - 16,000,000 160,000 - 160,000
6% redeemable cumulative preference shares - - 22,000,000 - 22,000,000 220,000 - 220,000
Arpico Interiors (Pvt) Ltd. 17 17 500,000 - 500,000 5,000 - 5,000
RPC Real esatate Development (Pvt) Ltd.
6% redeemable cumulative preference shares - - 66,700,000 - 66,700,000 667,000 - 667,000
RPC Retail Development (Pvt) Ltd.
6% redeemable cumulative preference shares - - 38,700,000 - 38,700,000 387,000 - 387,000
Arpico Insurance (Pvt) Ltd 30 - 15,000,000 15,000,000 - 150,000 150,000 -
InvestorArpico Industrial Development Company (Pvt) Ltd
InvesteeR P C Polymers (Pvt) Ltd 31 31 5,700,000 - 5,700,000 57,000 - 57,000
InvestorRichard Pieris exports PLC
InvesteeRichard Pieris natural Foams Ltd 43 43 27,560,000 - 27,560,000 284,820 - 284,820
Playcraft Lanka (Pvt) Ltd. - 36 - (213,750) 213,750 - (2,138) 2,138
Micro Minerals (Pvt) Ltd. 69 69 627,400 - 627,400 6,274 - 6,274
Arpitalian Compact soles (Pvt) Ltd. 45 45 15,993,334 - 15,993,334 159,933 - 159,933
Arpico natural Latex Foams (Pvt) Ltd. 44 44 4,000,000 - 4,000,000 40,000 - 40,000
InvestorRichard Pieris natural Foams Ltd.
InvesteeArpico natural Latex Foams (Pvt) Ltd. 56 56 5,000,000 - 5,000,000 50,000 - 50,000
InvestorPlastishells Ltd.
InvesteeR P C Polymers (Pvt) Ltd 69 69 13,000,000 - 13,000,000 130,000 - 130,000
InvestorRichard Pieris Plantations (Pvt) Ltd.
Investeeexotic Horticulture (Pvt) Ltd. 100 100 1,000,000 - 1,000,000 10,000 - 10,000
Maskeliya tea Garden Ltd. 100 100 1,500,000 - 1,500,000 15,000 - 15,000
RPC Plantation Management services (Pvt) Ltd. 100 100 24,106,249 - 24,106,249 330,000 - 330,000
InvestorRPC Management services (Pvt) Ltd.
InvesteeMaskeliya Plantations PLC (Rs. 339 mn) * 73 71 19,823,644 651,500 19,172,144 476,232 18,775 457,457
Kegalle Plantations PLC (Rs. 0.4 mn) * + - - 3,900 3,900 - 591 591 -
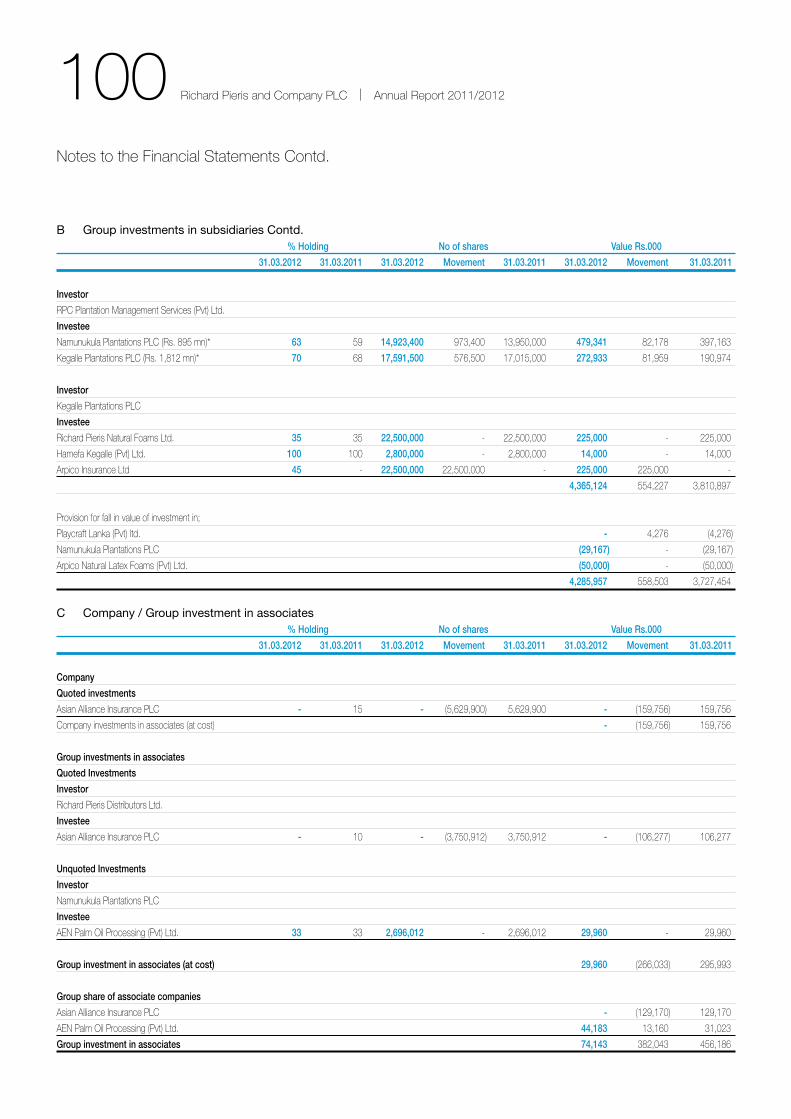
100 Richard Pieris and Company PLC | Annual Report 2011/2012
B Group investments in subsidiaries Contd. % Holding No of shares Value Rs.000
31.03.2012 31.03.2011 31.03.2012 Movement 31.03.2011 31.03.2012 Movement 31.03.2011
Investor
RPC Plantation Management services (Pvt) Ltd.
Investee
namunukula Plantations PLC (Rs. 895 mn)* 63 59 14,923,400 973,400 13,950,000 479,341 82,178 397,163
Kegalle Plantations PLC (Rs. 1,812 mn)* 70 68 17,591,500 576,500 17,015,000 272,933 81,959 190,974
Investor
Kegalle Plantations PLC
Investee
Richard Pieris natural Foams Ltd. 35 35 22,500,000 - 22,500,000 225,000 - 225,000
Hamefa Kegalle (Pvt) Ltd. 100 100 2,800,000 - 2,800,000 14,000 - 14,000
Arpico Insurance Ltd 45 - 22,500,000 22,500,000 - 225,000 225,000 -
4,365,124 554,227 3,810,897
Provision for fall in value of investment in;
Playcraft Lanka (Pvt) ltd. - 4,276 (4,276)
namunukula Plantations PLC (29,167) - (29,167)
Arpico natural Latex Foams (Pvt) Ltd. (50,000) - (50,000)
4,285,957 558,503 3,727,454
C Company / Group investment in associates % Holding No of shares Value Rs.000
31.03.2012 31.03.2011 31.03.2012 Movement 31.03.2011 31.03.2012 Movement 31.03.2011
Company
Quoted investments
Asian Alliance Insurance PLC - 15 - (5,629,900) 5,629,900 - (159,756) 159,756
Company investments in associates (at cost) - (159,756) 159,756
Group investments in associates
Quoted Investments
Investor
Richard Pieris Distributors Ltd.
Investee
Asian Alliance Insurance PLC - 10 - (3,750,912) 3,750,912 - (106,277) 106,277
Unquoted Investments
Investor
namunukula Plantations PLC
Investee
Aen Palm oil Processing (Pvt) Ltd. 33 33 2,696,012 - 2,696,012 29,960 - 29,960
Group investment in associates (at cost) 29,960 (266,033) 295,993
Group share of associate companies
Asian Alliance Insurance PLC - (129,170) 129,170
Aen Palm oil Processing (Pvt) Ltd. 44,183 13,160 31,023
Group investment in associates 74,143 382,043 456,186
notes to the Financial statements Contd.

101 Richard Pieris and Company PLC | Annual Report 2011/2012
D Other investments Value Rs.’000 Investor Investment 31.03.2012 Movement 31.03.2011
Richard Pieris and Company PLC Un-quoted investments Richard Pieris Plantations (Pvt.) Ltd. - Debentures 65,750 - 65,750 RPC timberline Ltd - Debentures 55,000 - 55,000 RPC timberline Ltd - equity shares 12,985 - 12,985 Wealth trust Corporation 5,625 5,625 - 139,360 5,625 133,735Provision for value of investment in timberline Ltd (67,985) (24,000) (43,985)other investment by the company 71,375 (18,375) 89,750Reversal of intra-group debentures / adjustments (65,750) - (65,750)other investment by the Group 5,625 (18,375) 24,000
* Amounts stated within brackets correspond to market values as at 31st March 2012 In the opinion of the Directors any reduction in market value below cost is considered to be of temporary nature.
+ the holding stake of these investments are less than 1%.
the value of un-quoted investments based on net assets amounted to Rs. 6,340 mn (Rs. 5,000 mn in 2010/2011)
6 Inventories Group Company 2011/2012 2010/2011 2011/2012 2010/2011 Rs. ‘000 Rs. ‘000 Rs. ‘000 Rs. ‘000
Raw materials 726,136 722,599 - -Growing crop-nurseries 33,224 27,283 - -Work-in-progress 147,389 144,349 - -Finished goods 2,056,872 1,610,543 - -Produce inventories 611,854 798,321 - -other inventories 41,275 46,074 - -Goods in transit 6,818 7,028 - - 3,623,568 3,356,197 - -Provision for unrealized profit (14,190) (14,313) - - 3,609,378 3,341,884 - -
Inventories are net of allowances for slow moving and obsolete inventories.
the amount of write-down of inventories recognized as an expense is Rs. 79 mn (2011 Rs. 57mn) which is recognized under administration expenses.
Inventories carried at net realisable value as at 31st March 2012 amounted Rs. 736 mn (2011 Rs. 886 mn) which is recognized in cost of sales and administrative expenses.
Inventories with a carrying amount of Rs. 1,129 mn (2011 Rs. 1,250 mn) are pledged as security for loans obtained, details of which are disclosed in note 13 to the financial statements.

102 Richard Pieris and Company PLC | Annual Report 2011/2012
7 Trade and other receivables Group Company 2011/2012 2010/2011 2011/2012 2010/2011 Rs. ‘000 Rs. ‘000 Rs. ‘000 Rs. ‘000
trade debtors 2,866,922 2,330,762 - -Less: Allowances for bad and doubtful debts (261,672) (421,008) - - 2,605,250 1,909,754 - -Advances, deposits and prepayments 458,833 370,638 -Loans to employees 9,576 10,189 2,530 1,472other debtors 601,573 618,219 37,425 51,234 3,675,232 2,908,800 39,955 52,706
8 Short term investments Group / Company 2011/2012 2010/2011 2011/2012 2010/2011 Market Market Cost No. of No. of value Cost value Quoted investments shares shares Rs. ‘000 Rs. ‘000 Rs. ‘000 Rs. ‘000
Commercial Bank of Ceylon PLC 78 - 8 2 - -John Keells Holdings PLC 78 54 16 6 26 6Asian Hotel Properties PLC 639,400 319,700 49,314 17,721 59,399 17,721nDB Bank PLC 20,800 - 2,526 3,567 - -Dialog Axiata PLC 11,110 10,100 78 192 115 192 51,942 21,488 59,540 17,919Appreciation / (provision) for fall in value of investment - 30,454 - 41,621 51,942 51,942 59,540 59,540
9 Stated capital 2011/2012 2010/2011 Number of Value of Number of Value of shares shares shares shares in ‘000 Rs. ‘000 in ‘000 Rs. ‘000
Fully paid ordinary shares at the beginning of the year 1,937,241 1,627,612 1,923,765 1,578,475share options exercised during the year 1,349 6,241 13,476 49,137Balance at the end of the year 1,938,590 1,633,853 1,937,241 1,627,612
9.1 the Company exercised a sub division of shares in the proportion of 15 shares for every 1 share held on 4th october 2010, the impact of which has been adjusted for the comparative column.
10 Capital reserves Group Company 2011/2012 2010/2011 2011/2012 2010/2011 Rs. ‘000 Rs. ‘000 Rs. ‘000 Rs. ‘000
Capital reserve 124,526 124,526 8,199 8,199Revaluation reserve 2,375 2,375 2,375 2,375 126,901 126,901 10,574 10,574
10.1 Capital Reserves compromise surplus arising from revaluations and other statutory reserves.
notes to the Financial statements Contd.

103 Richard Pieris and Company PLC | Annual Report 2011/2012
11 Revenue reserves Group Company 2011/2012 2010/2011 2011/2012 2010/2011 Rs. ‘000 Rs. ‘000 Rs. ‘000 Rs. ‘000
A. General reserve 179,443 179,443 - - 179,443 179,443 - -
B. Retained profit 3,830,892 3,041,659 560,011 617,905 4,010,335 3,221,102 560,011 617,905
11.1 General reserves represent amounts set aside from time to time by the directors for general application. these have been appropriated by the board complying with the articles of association which provides for such amounts being set aside for future use and utilized based on board approval.
12 Foreign currency translation Group Company 2011/2012 2010/2011 2011/2012 2010/2011 Rs. ‘000 Rs. ‘000 Rs. ‘000 Rs. ‘000
At the beginning of the year 27,314 31,152 - -exchange translation difference for the year 10,922 (3,838) - -At the end of the year 38,236 27,314 - -
Foreign currency translation relates to the resulting exchange difference on translation of financial statements of Arpitalian Compact soles (Pvt) Ltd maintained in Us dollars, into sri Lankan rupees.
13 Interest bearing loans and borrowing Group Company 2011/2012 2010/2011 2011/2012 2010/2011 Rs.’000 Rs.’000 Rs.’000 Rs.’000
At beginning of the year 3,073,532 3,197,229 424,084 1,033,469effect of foreign currency translation 5,012 (8,433) - -Disposal of subsidiary - (1,087) - -new Loans obtained 1,055,733 1,133,979 300,000 - 4,134,277 4,321,688 724,084 1,033,469Repayments (1,062,506) (1,248,156) (295,001) (609,385) 3,071,771 3,073,532 429,083 424,084transferred to current Liabilities (893,957) (1,075,241) (209,083) (275,000)At the end of the year 2,177,814 1,998,291 220,000 149,084
Total Interest Bearing Loans & BorrowingsRepayable within one year 893,957 1,075,241 209,083 275,000Repayable after one year 2,177,814 1,998,291 220,000 149,084 3,071,771 3,073,532 429,083 424,084

104 Richard Pieris and Company PLC | Annual Report 2011/2012
B. Interest bearing loans and borrowings repayable after one yearCompany
Lender
2011/2012 31.03.2012
Rs.'000
2010/2011 31.03.2011
Rs.'000
Repayment
Security
Richard Pieris and Company PLC Commercial Bank of Ceylon PLC 76,000 234,800 Rs. 42 mn per quarter Mortgage over Land and Building at Kandy & Battaramulla.
Commercial Bank of Ceylon PLC - 9,200 Rs. 7.5 mn per quarter Mortgage over shares of namunukula Plantations PLC
DFCC Bank PLC 29,332 61,333 Rs. 2.67 mn per month Mortgage over Machinery
Indian Bank 43,750 118,750 Rs. 6.25 mn per month Mortgage over Land & Building at Mattegoda
Hatton national Bank PLC 280,000 - Rs. 5mn per month Mortgage over Land and Buildings at Union Place, Colombo 02
Richard Pieris Distributors Limited Commercial Bank of Ceylon PLC 521,800 570,400 W.e.f. August 2011 Monthly Repayment
Credit Card receivables at Hyde Park Corner & Battaramulla super Center state Bank of India 97,900 170,000 W.e.f. August 2011 Monthly Repayment
nDB AVIVA Fund Management - 14,979 W.e.f. August 2011 Monthly Repayment
national Development Bank PLC 259,600 259,600 W.e.f February 2013
national Development Bank PLC 150,000 195,000 Rs. 15 mn per quarter Clean Basis
Arpitech (Pvt) Limited Pan Asia Bank PLC - 28,496 Rs. 1.25 mn per month Mortgage over Land, Plant & Machinery at Mattegoda
RPC Retail Development
Company Limited
LoLC PLC 118,562 163,562 Rs. 3.75 mn per month Mortgage over Land and Building at negambo
Richard Pieris Exports PLC Hatton national Bank PLC 29,327 76,760 Us $ 125,000 per quarter Mortgage over Land and Buildings at Union Place, Colombo 02
state Bank of India - 68,994 Us $ 62,500 per month Mortgage over stocks, Debtors, Plant & Machinery and Land & Building at ekala .
RPC Management Services (Pvt)
Limited
DFCC Bank PLC 82,987 128,245 Rs. 3.772 mn per month Mortgage over shares of Maskeliya Plantations PLC
RPC Plantations Management
Services (Pvt) Limited
Hatton national Bank PLC 14,572 27,076 Rs. 1mn per month Promissory note
Maskeliya Plantations PLC ADB/ national Development Bank PLC - 1,942 Rs. 0.28mn per monthPrimary mortgage over leasehold rights of Brunswick, strathspey, Laxapana and Moray estates.
ADB/ national Development Bank PLC 883 3,000 Rs. 0.18mn per month
ADB/ national Development Bank PLC 348 1,738 Rs. 0.16mn per month
ADB/ national Development Bank PLC 6,203 10,337 Rs. 0.35mn per month secondary mortgage over leasehold rights of Brunswick, strathspey, Laxapana and Moray estates.Primary mortgage over leasehold rights of talawakelle estate.
ADB/ national Development Bank PLC 8,616 13,786 Rs. 0.43mn per month
ADB/ national Development Bank PLC 2,490 4,063 Rs. 0.13mn per month
ADB/ national Development Bank PLC 10,454 16,427 Rs. 0.50mn per month tertiary mortgage over leasehold rights of Brunswick, strathspey, Laxapana and Moray estates. secondary mortgage over leasehold rights of talawakelle estate.
ADB/ national Development Bank PLC 8,972 14,099 Rs. 0.43mn per month
ADB/ national Development Bank PLC 2,935 4,612 Rs. 0.14mn per month
ADB/seylan Bank PLC 14,798 19,128 Rs. 0.36mn per month
Primary mortgage over leasehold rights of Mousakelle estates.
ADB/seylan Bank PLC 13,889 17,954 Rs. 0.34mn per month
ADB/seylan Bank PLC 2,740 3,441 Rs. 0.06mn per month
DFCC Bank PLC 5,105 9,189 Rs. 0.34mn per monthCorporate Guarantee given by RPC Management services (Pvt) Ltd
Hatton national Bank PLC 563 4,313 Rs. 0.31mn per month
Hatton national Bank PLC 320,800 - Rs. 5.8mn per month Primary mortgage over leasehold rights of Ampitittiakande & Craig estates.
national Development Bank PLC-
e-Friend Loan
13,874 23,128 Rs. 0.77mn per month
national Development Bank PLC-
Government Relief Package
- 27,000 As per monthly trust Paperssecuritization of future tea receivables
nDB Investment Bank - 112,600 As per monthly trust Papers securitization of future tea receivables
national Development Bank PLC 119,000 119,000 W.e.f.April 2012 Rs.1.4mn per month Primary mortgage over leasehold rights of Brunswick, strathspy, Laxapana, Moray
estates and thalawakelle estate
Kegalle Plantations PLC ADB/ national Development Bank PLC - 4,133 Rs. 0.46mn per month Corporate guarantee by Richard Pieris and Company PLC for Rs 33mn and Primary and secondary mortgage over leasehold rights of Atale, Pallegama, Parambe, Weniwella and Yatederiya estates
ADB/ national Development Bank PLC 8,883 14,709 Rs. 0.49mn per month
ADB/ national Development Bank PLC 11,315 17,649 Rs. 0.53mn per month
ADB/ seylan Bank PLC 19,111 24,681 Rs. 0.46mn per month Primary mortgage over leasehold rights of eadella estates
Hatton national Bank PLC - e friend
Loan 7,384 10,540 Rs. 0.26mn per month
Primary floating mortgage over leasehold property at Luckyland estate, Udupussellawa,
Badulla estates
ADB/ national Development Bank PLC 50,811 56,313 Rs. 0.63mn per month Primary Mortgage over leased hold rights of Atale, etana, Doteloya, Kirkless and
secondary mortgage over Pallegama, Parambe, Weniwella and Yataderiya estates. ADB/ national Development Bank PLC 26,906 29,352 Rs. 0.407mn per month
notes to the Financial statements Contd.
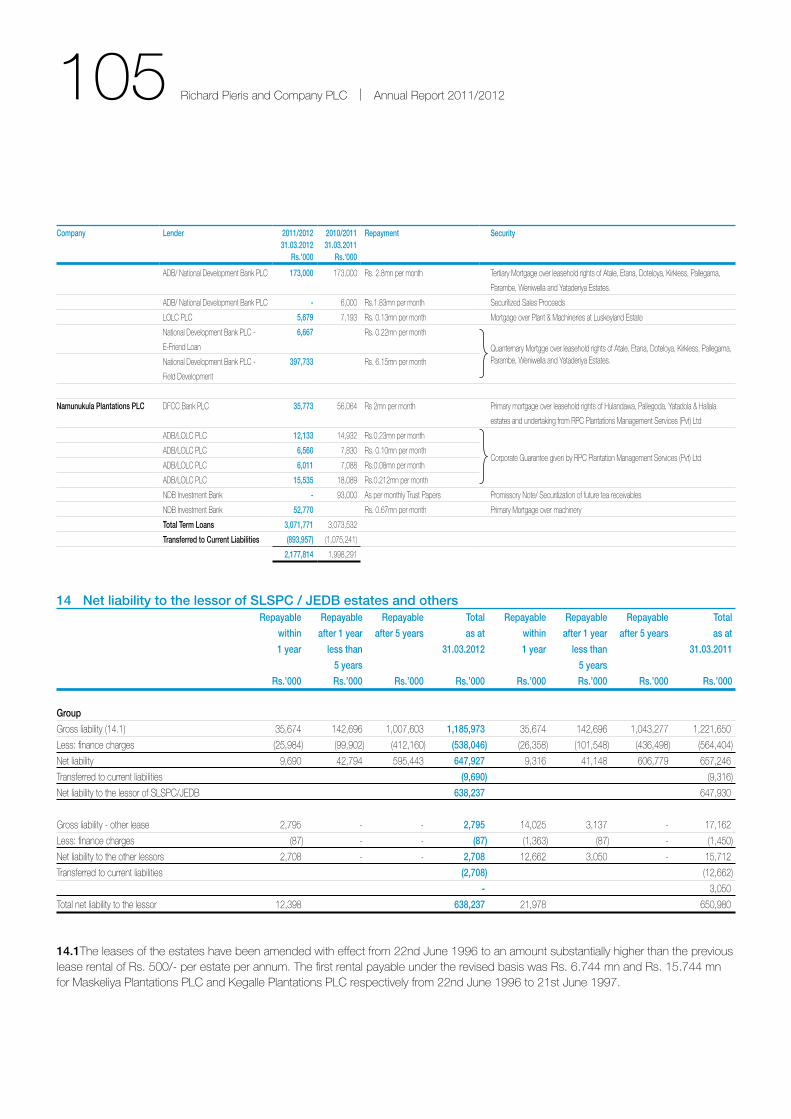
105 Richard Pieris and Company PLC | Annual Report 2011/2012
Company
Lender
2011/2012 31.03.2012
Rs.'000
2010/2011 31.03.2011
Rs.'000
Repayment
Security
ADB/ national Development Bank PLC 173,000 173,000 Rs. 2.8mn per month tertiary Mortgage over leasehold rights of Atale, etana, Doteloya, Kirkless, Pallegama,
Parambe, Weniwella and Yataderiya estates.
ADB/ national Development Bank PLC - 6,000 Rs.1.83mn per month securitized sales Proceeds
LoLC PLC 5,679 7,193 Rs. 0.13mn per month Mortgage over Plant & Machineries at Luskeyland estate
national Development Bank PLC -
e-Friend Loan
6,667
Rs. 0.22mn per month
Quanternary Mortgge over leasehold rights of Atale, etana, Doteloya, Kirkless, Pallegama, Parambe, Weniwella and Yataderiya estates. national Development Bank PLC -
Field Development
397,733 Rs. 6.15mn per month
Namunukula Plantations PLC
DFCC Bank PLC 35,773 56,064 Rs 2mn per month Primary mortgage over leasehold rights of Hulandawa, Pallegoda, Yatadola & Hallala
estates and undertaking from RPC Plantations Management services (Pvt) Ltd
ADB/LoLC PLC 12,133 14,932 Rs.0.23mn per month
Corporate Guarantee given by RPC Plantation Management services (Pvt) Ltd ADB/LoLC PLC 6,560 7,830 Rs. 0.10mn per month
ADB/LoLC PLC 6,011 7,088 Rs.0.08mn per month
ADB/LoLC PLC 15,535 18,089 Rs.0.212mn per month
nDB Investment Bank - 93,000 As per monthly trust Papers Promissory note/ securitization of future tea receivables
nDB Investment Bank 52,770 Rs. 0.67mn per month Primary Mortgage over machinery
Total Term Loans 3,071,771 3,073,532
Transferred to Current Liabilities (893,957) (1,075,241)
2,177,814 1,998,291
14 Net liability to the lessor of SLSPC / JEDB estates and others Repayable Repayable Repayable Total Repayable Repayable Repayable Total
within after 1 year after 5 years as at within after 1 year after 5 years as at
1 year less than 31.03.2012 1 year less than 31.03.2011
5 years 5 years
Rs.’000 Rs.’000 Rs.’000 Rs.’000 Rs.’000 Rs.’000 Rs.’000 Rs.’000
Group
Gross liability (14.1) 35,674 142,696 1,007,603 1,185,973 35,674 142,696 1,043,277 1,221,650
Less: finance charges (25,984) (99,902) (412,160) (538,046) (26,358) (101,548) (436,498) (564,404)
net liability 9,690 42,794 595,443 647,927 9,316 41,148 606,779 657,246
transferred to current liabilities (9,690) (9,316)
net liability to the lessor of sLsPC/JeDB 638,237 647,930
Gross liability - other lease 2,795 - - 2,795 14,025 3,137 - 17,162
Less: finance charges (87) - - (87) (1,363) (87) - (1,450)
net liability to the other lessors 2,708 - - 2,708 12,662 3,050 - 15,712
transferred to current liabilities (2,708) (12,662)
- 3,050
total net liability to the lessor 12,398 638,237 21,978 650,980
14.1 the leases of the estates have been amended with effect from 22nd June 1996 to an amount substantially higher than the previous lease rental of Rs. 500/- per estate per annum. the first rental payable under the revised basis was Rs. 6.744 mn and Rs. 15.744 mn for Maskeliya Plantations PLC and Kegalle Plantations PLC respectively from 22nd June 1996 to 21st June 1997.
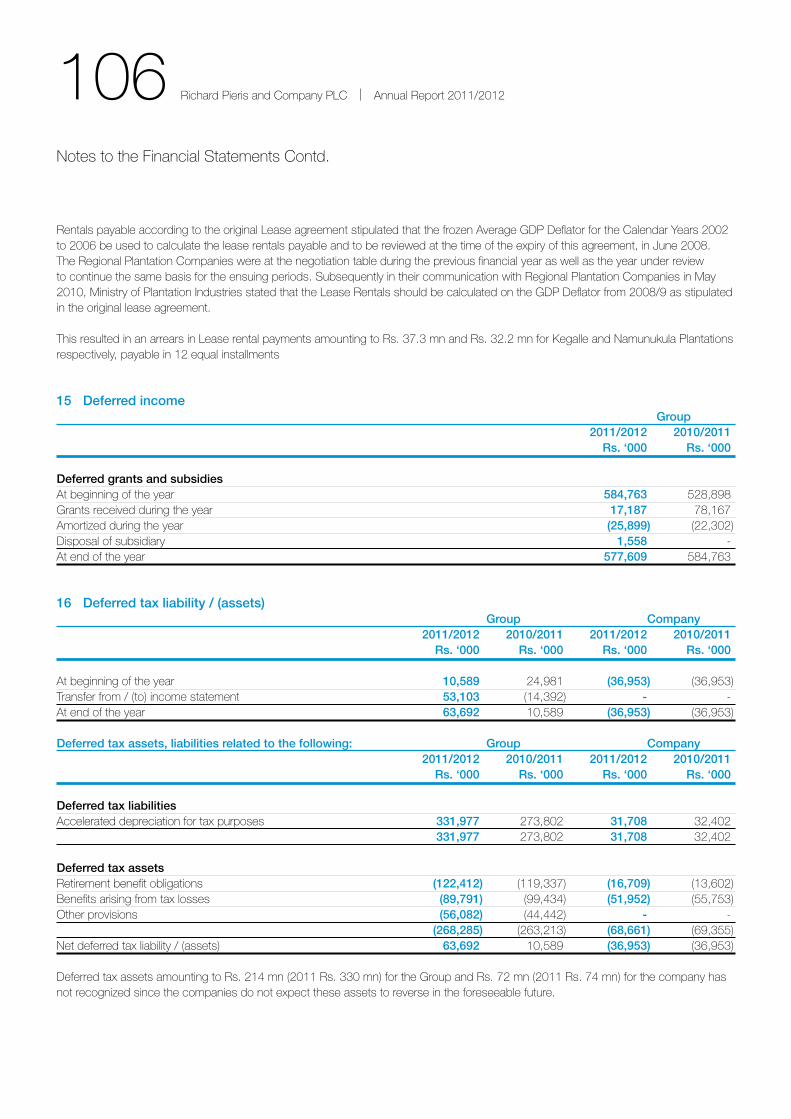
106 Richard Pieris and Company PLC | Annual Report 2011/2012
Rentals payable according to the original Lease agreement stipulated that the frozen Average GDP Deflator for the Calendar Years 2002 to 2006 be used to calculate the lease rentals payable and to be reviewed at the time of the expiry of this agreement, in June 2008. the Regional Plantation Companies were at the negotiation table during the previous financial year as well as the year under review to continue the same basis for the ensuing periods. subsequently in their communication with Regional Plantation Companies in May 2010, Ministry of Plantation Industries stated that the Lease Rentals should be calculated on the GDP Deflator from 2008/9 as stipulated in the original lease agreement.
this resulted in an arrears in Lease rental payments amounting to Rs. 37.3 mn and Rs. 32.2 mn for Kegalle and namunukula Plantations respectively, payable in 12 equal installments
15 Deferred income Group 2011/2012 2010/2011 Rs. ‘000 Rs. ‘000
Deferred grants and subsidiesAt beginning of the year 584,763 528,898Grants received during the year 17,187 78,167Amortized during the year (25,899) (22,302)Disposal of subsidiary 1,558 -At end of the year 577,609 584,763
16 Deferred tax liability / (assets) Group Company 2011/2012 2010/2011 2011/2012 2010/2011 Rs. ‘000 Rs. ‘000 Rs. ‘000 Rs. ‘000
At beginning of the year 10,589 24,981 (36,953) (36,953)transfer from / (to) income statement 53,103 (14,392) - -At end of the year 63,692 10,589 (36,953) (36,953)
Deferred tax assets, liabilities related to the following: Group Company 2011/2012 2010/2011 2011/2012 2010/2011 Rs. ‘000 Rs. ‘000 Rs. ‘000 Rs. ‘000
Deferred tax liabilitiesAccelerated depreciation for tax purposes 331,977 273,802 31,708 32,402 331,977 273,802 31,708 32,402
Deferred tax assetsRetirement benefit obligations (122,412) (119,337) (16,709) (13,602)Benefits arising from tax losses (89,791) (99,434) (51,952) (55,753)other provisions (56,082) (44,442) - - (268,285) (263,213) (68,661) (69,355)net deferred tax liability / (assets) 63,692 10,589 (36,953) (36,953)
Deferred tax assets amounting to Rs. 214 mn (2011 Rs. 330 mn) for the Group and Rs. 72 mn (2011 Rs. 74 mn) for the company has not recognized since the companies do not expect these assets to reverse in the foreseeable future.
notes to the Financial statements Contd.

107 Richard Pieris and Company PLC | Annual Report 2011/2012
17 Employee benefit liabilities Group Company 2011/2012 2010/2011 2011/2012 2010/2011 Rs. ‘000 Rs. ‘000 Rs. ‘000 Rs. ‘000
Provision for retiring gratuityAt beginning of the year 1,662,131 1,529,685 48,578 50,141Provision for the year 462,219 282,843 26,172 3,103Payments (183,721) (150,397) (15,076) (4,788)transfers - - - 122At end of the year 1,940,629 1,662,131 59,674 48,578
Actuarial valuation of the defined benefit plan / gratuity was carried out on 31st March 2012 by Messrs. Actuarial & Management Consultants (Pvt) Ltd. Appropriate and compatible assumptions were used in determining the cost of retirement benefits. the principal assumptions used are as follows: Assumptions 2011/2012 2010/2011
a) Demographic assumptionsRetiring age:executives 55-60 years 55-60 yearsnon executives 55 years 55 years
In respect of plantation companies,Retiring age:Workers (male and female) 60 years 60 yearsother categories of staff (male and female) 55-58 years 55-58 years
b) Financial assumptionsRate of interest net of tax per annum 11% 10.5%Rate of salary increment 9% 9%Rate of discount 11% 10.5%
In respect of plantation companies,Rate of interest net of tax per annum 11% 11%Rate of salary increment: Workers 16% every two years 16% every two yearsstaff employees 10% per year 10% per yearRate of discount 11% 11%
18 Trade and other payables Group Company 2011/2012 2010/2011 2011/2012 2010/2011 Rs. ‘000 Rs. ‘000 Rs. ‘000 Rs. ‘000
trade payables 2,285,882 1,925,213 - -Accrued expenses 908,467 945,938 - -others 1,405,709 781,995 873,129 258,991 4,600,058 3,653,146 873,129 258,991

108 Richard Pieris and Company PLC | Annual Report 2011/2012
19 Short term borrowings Group Company 2011/2012 2010/2011 2011/2012 2010/2011 Rs. ‘000 Rs. ‘000 Rs. ‘000 Rs. ‘000
Commercial papers (a) 291,466 125,853 291,466 125,853Import loans (b) 108,207 78,611 - -other short term borrowings (c) 1,048,824 1,799,678 650,000 1,400,000Bank overdrafts (d) 2,742,806 1,801,792 565,722 45,479 4,191,303 3,805,934 1,507,188 1,571,332
(a) Repayment of commercial papers will be less than three months.
(b) Import loans have been obtained for the purpose of operations and is repayable within thirty to ninety days.
(c ) short term borrowings mainly consist of money market borrowings and will be repayable at maturity within seven to ninety days.
(d) Bank overdrafts are repayable on demand.
20 Cash and cash equivalents Group Company 2011/2012 2010/2011 2011/2012 2010/2011 Rs. ‘000 Rs. ‘000 Rs. ‘000 Rs. ‘000
Cash at bank and in hand 3,445,988 1,274,365 25,210 63,349treasury bills - 1,289,494 - - 3,445,988 2,563,859 25,210 63,349
short term borrowings (note 19) (4,191,303) (3,805,934) (1,507,188) (1,571,332) (745,315) (1,242,075) (1,481,978) (1,507,983)
notes to the Financial statements Contd.
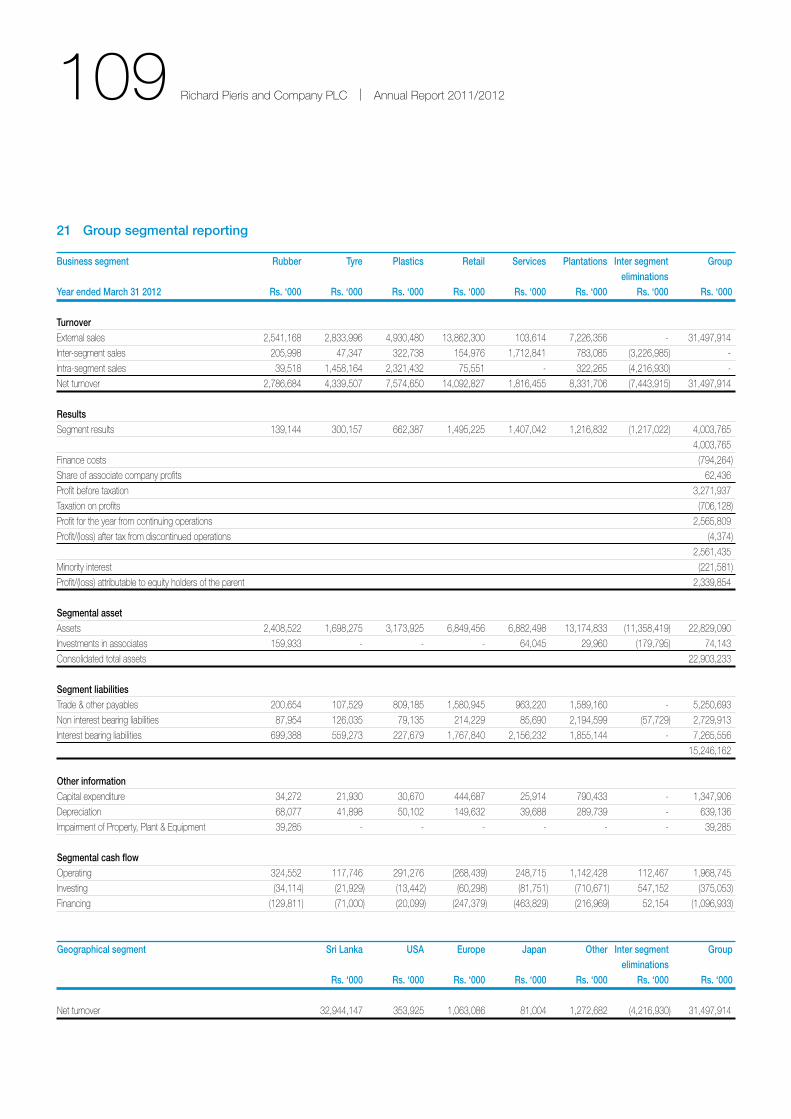
109 Richard Pieris and Company PLC | Annual Report 2011/2012
21 Group segmental reporting
Business segment Rubber Tyre Plastics Retail Services Plantations Inter segment Group eliminations Year ended March 31 2012 Rs. ‘000 Rs. ‘000 Rs. ‘000 Rs. ‘000 Rs. ‘000 Rs. ‘000 Rs. ‘000 Rs. ‘000
Turnoverexternal sales 2,541,168 2,833,996 4,930,480 13,862,300 103,614 7,226,356 - 31,497,914
Inter-segment sales 205,998 47,347 322,738 154,976 1,712,841 783,085 (3,226,985) -
Intra-segment sales 39,518 1,458,164 2,321,432 75,551 - 322,265 (4,216,930) -
net turnover 2,786,684 4,339,507 7,574,650 14,092,827 1,816,455 8,331,706 (7,443,915) 31,497,914
Resultssegment results 139,144 300,157 662,387 1,495,225 1,407,042 1,216,832 (1,217,022) 4,003,765
4,003,765
Finance costs (794,264)
share of associate company profits 62,436
Profit before taxation 3,271,937
taxation on profits (706,128)
Profit for the year from continuing operations 2,565,809
Profit/(loss) after tax from discontinued operations (4,374)
2,561,435
Minority interest (221,581)
Profit/(loss) attributable to equity holders of the parent 2,339,854
Segmental assetAssets 2,408,522 1,698,275 3,173,925 6,849,456 6,882,498 13,174,833 (11,358,419) 22,829,090
Investments in associates 159,933 - - - 64,045 29,960 (179,795) 74,143
Consolidated total assets 22,903,233
Segment liabilitiestrade & other payables 200,654 107,529 809,185 1,580,945 963,220 1,589,160 - 5,250,693
non interest bearing liabilities 87,954 126,035 79,135 214,229 85,690 2,194,599 (57,729) 2,729,913
Interest bearing liabilities 699,388 559,273 227,679 1,767,840 2,156,232 1,855,144 - 7,265,556
15,246,162
Other informationCapital expenditure 34,272 21,930 30,670 444,687 25,914 790,433 - 1,347,906
Depreciation 68,077 41,898 50,102 149,632 39,688 289,739 - 639,136
Impairment of Property, Plant & equipment 39,285 - - - - - - 39,285
Segmental cash flowoperating 324,552 117,746 291,276 (268,439) 248,715 1,142,428 112,467 1,968,745
Investing (34,114) (21,929) (13,442) (60,298) (81,751) (710,671) 547,152 (375,053)
Financing (129,811) (71,000) (20,099) (247,379) (463,829) (216,969) 52,154 (1,096,933)
Geographical segment Sri Lanka USA Europe Japan Other Inter segment Group eliminations Rs. ‘000 Rs. ‘000 Rs. ‘000 Rs. ‘000 Rs. ‘000 Rs. ‘000 Rs. ‘000
net turnover 32,944,147 353,925 1,063,086 81,004 1,272,682 (4,216,930) 31,497,914
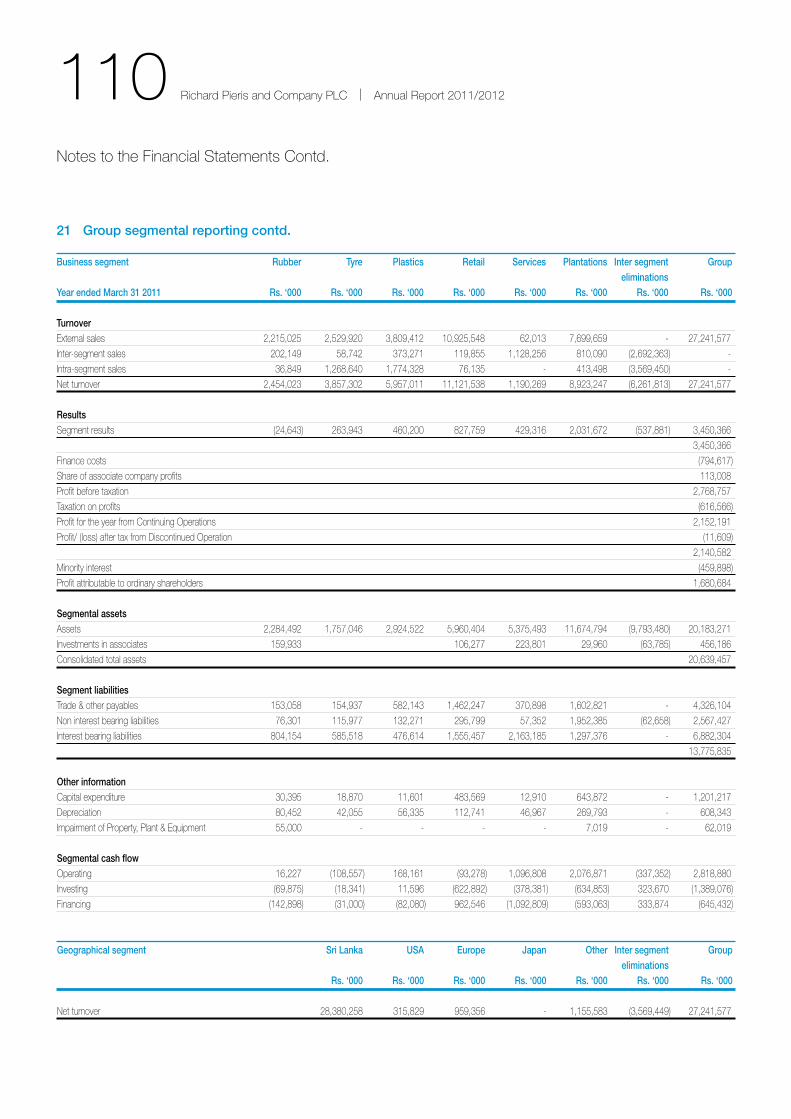
110 Richard Pieris and Company PLC | Annual Report 2011/2012
21 Group segmental reporting contd.
Business segment Rubber Tyre Plastics Retail Services Plantations Inter segment Group eliminations Year ended March 31 2011 Rs. ‘000 Rs. ‘000 Rs. ‘000 Rs. ‘000 Rs. ‘000 Rs. ‘000 Rs. ‘000 Rs. ‘000
Turnover external sales 2,215,025 2,529,920 3,809,412 10,925,548 62,013 7,699,659 - 27,241,577
Inter-segment sales 202,149 58,742 373,271 119,855 1,128,256 810,090 (2,692,363) -
Intra-segment sales 36,849 1,268,640 1,774,328 76,135 - 413,498 (3,569,450) -
net turnover 2,454,023 3,857,302 5,957,011 11,121,538 1,190,269 8,923,247 (6,261,813) 27,241,577
Resultssegment results (24,643) 263,943 460,200 827,759 429,316 2,031,672 (537,881) 3,450,366
3,450,366
Finance costs (794,617)
share of associate company profits 113,008
Profit before taxation 2,768,757
taxation on profits (616,566)
Profit for the year from Continuing operations 2,152,191
Profit/ (loss) after tax from Discontinued operation (11,609)
2,140,582
Minority interest (459,898)
Profit attributable to ordinary shareholders 1,680,684
Segmental assetsAssets 2,284,492 1,757,046 2,924,522 5,960,404 5,375,493 11,674,794 (9,793,480) 20,183,271
Investments in associates 159,933 106,277 223,801 29,960 (63,785) 456,186
Consolidated total assets 20,639,457
Segment liabilitiestrade & other payables 153,058 154,937 582,143 1,462,247 370,898 1,602,821 - 4,326,104
non interest bearing liabilities 76,301 115,977 132,271 295,799 57,352 1,952,385 (62,658) 2,567,427
Interest bearing liabilities 804,154 585,518 476,614 1,555,457 2,163,185 1,297,376 - 6,882,304
13,775,835
Other informationCapital expenditure 30,395 18,870 11,601 483,569 12,910 643,872 - 1,201,217
Depreciation 80,452 42,055 56,335 112,741 46,967 269,793 - 608,343
Impairment of Property, Plant & equipment 55,000 - - - - 7,019 - 62,019
Segmental cash flowoperating 16,227 (108,557) 168,161 (93,278) 1,096,808 2,076,871 (337,352) 2,818,880
Investing (69,875) (18,341) 11,596 (622,892) (378,381) (634,853) 323,670 (1,389,076)
Financing (142,898) (31,000) (82,080) 962,546 (1,092,809) (593,063) 333,874 (645,432)
Geographical segment Sri Lanka USA Europe Japan Other Inter segment Group eliminations Rs. ‘000 Rs. ‘000 Rs. ‘000 Rs. ‘000 Rs. ‘000 Rs. ‘000 Rs. ‘000
net turnover 28,380,258 315,829 959,356 - 1,155,583 (3,569,449) 27,241,577
notes to the Financial statements Contd.
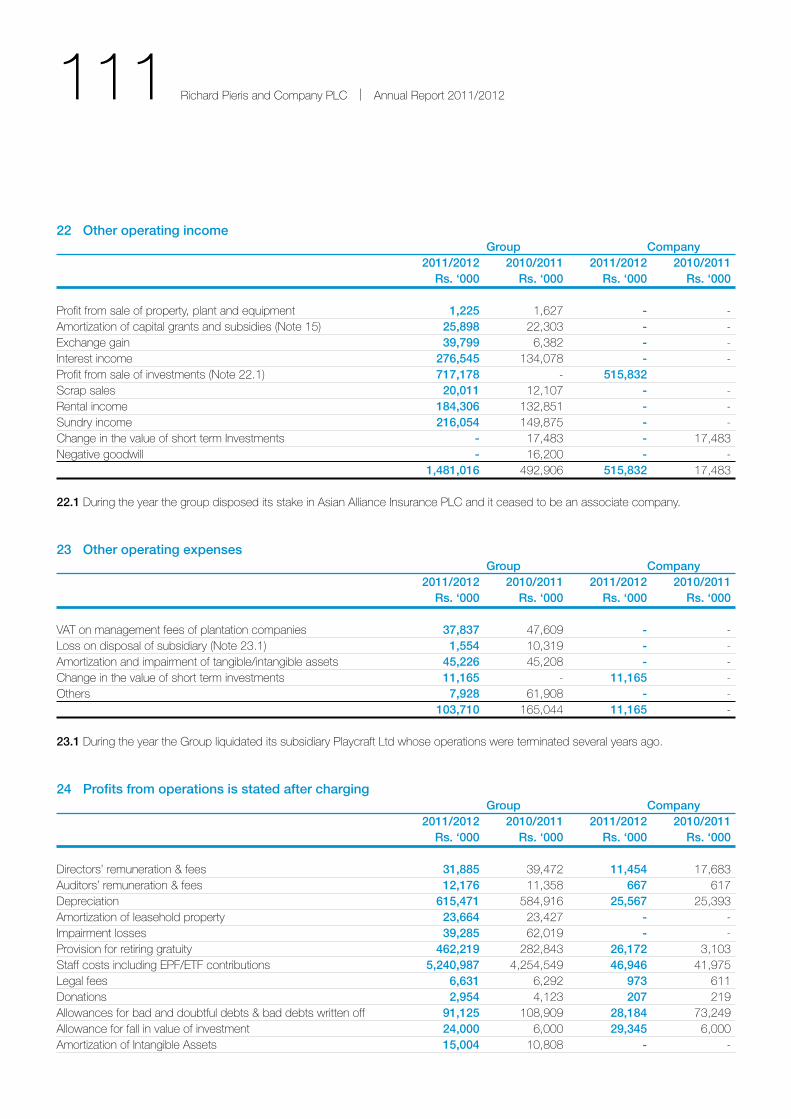
111 Richard Pieris and Company PLC | Annual Report 2011/2012
22 Other operating income Group Company 2011/2012 2010/2011 2011/2012 2010/2011 Rs. ‘000 Rs. ‘000 Rs. ‘000 Rs. ‘000
Profit from sale of property, plant and equipment 1,225 1,627 - -Amortization of capital grants and subsidies (note 15) 25,898 22,303 - -exchange gain 39,799 6,382 - -Interest income 276,545 134,078 - -Profit from sale of investments (note 22.1) 717,178 - 515,832scrap sales 20,011 12,107 - -Rental income 184,306 132,851 - -sundry income 216,054 149,875 - -Change in the value of short term Investments - 17,483 - 17,483negative goodwill - 16,200 - - 1,481,016 492,906 515,832 17,483
22.1 During the year the group disposed its stake in Asian Alliance Insurance PLC and it ceased to be an associate company.
23 Other operating expenses Group Company 2011/2012 2010/2011 2011/2012 2010/2011 Rs. ‘000 Rs. ‘000 Rs. ‘000 Rs. ‘000
VAt on management fees of plantation companies 37,837 47,609 - -Loss on disposal of subsidiary (note 23.1) 1,554 10,319 - -Amortization and impairment of tangible/intangible assets 45,226 45,208 - -Change in the value of short term investments 11,165 - 11,165 -others 7,928 61,908 - - 103,710 165,044 11,165 -
23.1 During the year the Group liquidated its subsidiary Playcraft Ltd whose operations were terminated several years ago.
24 Profits from operations is stated after charging Group Company 2011/2012 2010/2011 2011/2012 2010/2011 Rs. ‘000 Rs. ‘000 Rs. ‘000 Rs. ‘000
Directors’ remuneration & fees 31,885 39,472 11,454 17,683Auditors’ remuneration & fees 12,176 11,358 667 617Depreciation 615,471 584,916 25,567 25,393Amortization of leasehold property 23,664 23,427 - -Impairment losses 39,285 62,019 - -Provision for retiring gratuity 462,219 282,843 26,172 3,103staff costs including ePF/etF contributions 5,240,987 4,254,549 46,946 41,975Legal fees 6,631 6,292 973 611Donations 2,954 4,123 207 219Allowances for bad and doubtful debts & bad debts written off 91,125 108,909 28,184 73,249Allowance for fall in value of investment 24,000 6,000 29,345 6,000Amortization of Intangible Assets 15,004 10,808 - -
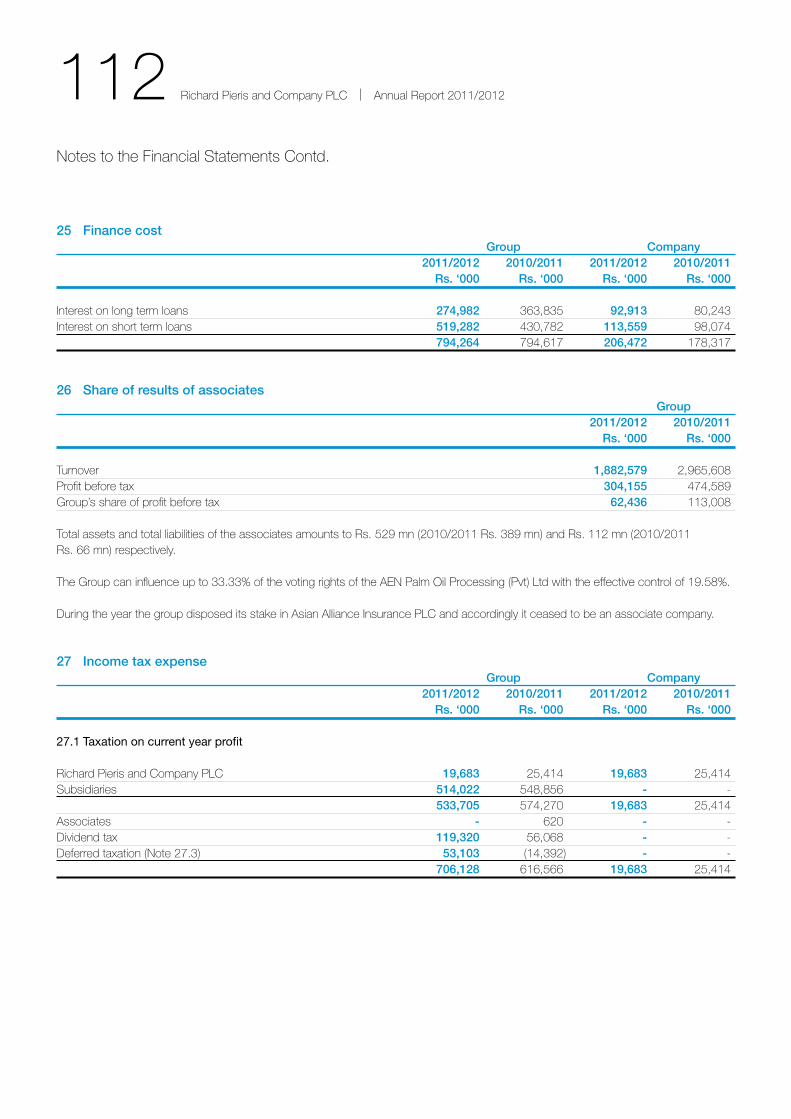
112 Richard Pieris and Company PLC | Annual Report 2011/2012
25 Finance cost Group Company 2011/2012 2010/2011 2011/2012 2010/2011 Rs. ‘000 Rs. ‘000 Rs. ‘000 Rs. ‘000
Interest on long term loans 274,982 363,835 92,913 80,243Interest on short term loans 519,282 430,782 113,559 98,074 794,264 794,617 206,472 178,317
26 Share of results of associates Group 2011/2012 2010/2011 Rs. ‘000 Rs. ‘000
turnover 1,882,579 2,965,608Profit before tax 304,155 474,589Group’s share of profit before tax 62,436 113,008
total assets and total liabilities of the associates amounts to Rs. 529 mn (2010/2011 Rs. 389 mn) and Rs. 112 mn (2010/2011 Rs. 66 mn) respectively.
the Group can influence up to 33.33% of the voting rights of the Aen Palm oil Processing (Pvt) Ltd with the effective control of 19.58%.
During the year the group disposed its stake in Asian Alliance Insurance PLC and accordingly it ceased to be an associate company.
27 Income tax expense Group Company 2011/2012 2010/2011 2011/2012 2010/2011 Rs. ‘000 Rs. ‘000 Rs. ‘000 Rs. ‘000
27.1 Taxation on current year profit
Richard Pieris and Company PLC 19,683 25,414 19,683 25,414subsidiaries 514,022 548,856 - - 533,705 574,270 19,683 25,414Associates - 620 - -Dividend tax 119,320 56,068 - -Deferred taxation (note 27.3) 53,103 (14,392) - - 706,128 616,566 19,683 25,414
notes to the Financial statements Contd.
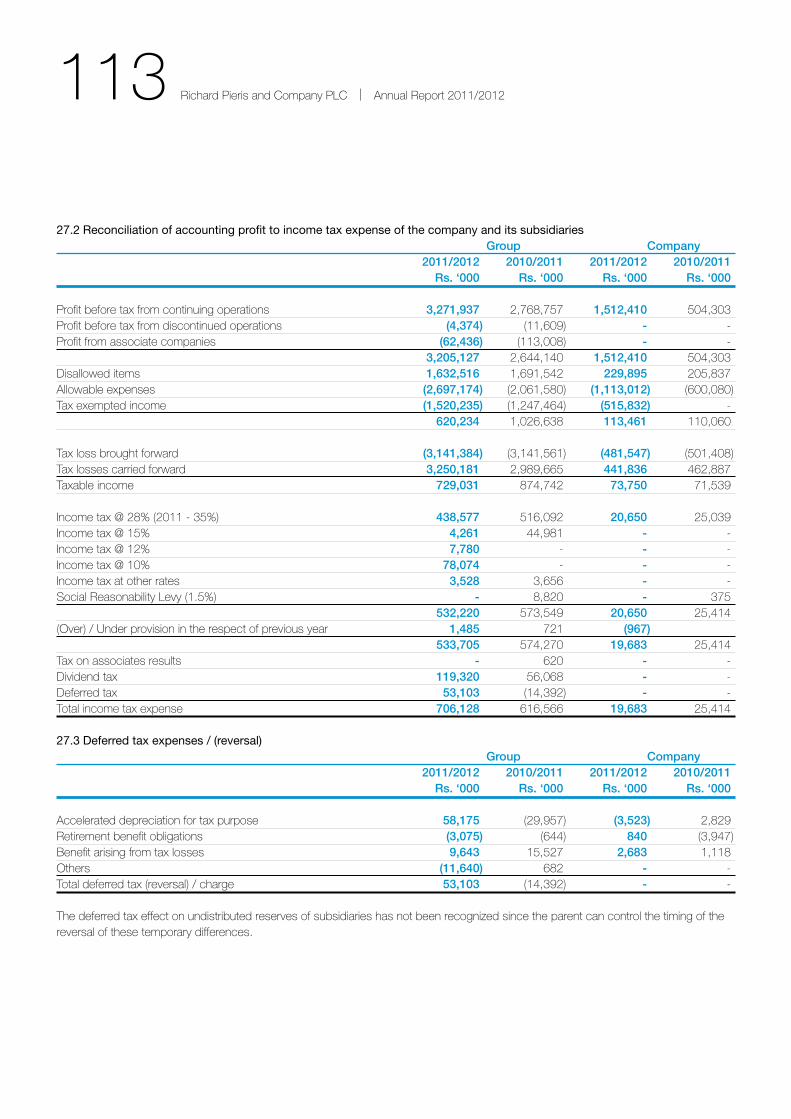
113 Richard Pieris and Company PLC | Annual Report 2011/2012
27.2 Reconciliation of accounting profit to income tax expense of the company and its subsidiaries Group Company 2011/2012 2010/2011 2011/2012 2010/2011 Rs. ‘000 Rs. ‘000 Rs. ‘000 Rs. ‘000
Profit before tax from continuing operations 3,271,937 2,768,757 1,512,410 504,303Profit before tax from discontinued operations (4,374) (11,609) - -Profit from associate companies (62,436) (113,008) - - 3,205,127 2,644,140 1,512,410 504,303Disallowed items 1,632,516 1,691,542 229,895 205,837Allowable expenses (2,697,174) (2,061,580) (1,113,012) (600,080)tax exempted income (1,520,235) (1,247,464) (515,832) - 620,234 1,026,638 113,461 110,060
tax loss brought forward (3,141,384) (3,141,561) (481,547) (501,408)tax losses carried forward 3,250,181 2,989,665 441,836 462,887taxable income 729,031 874,742 73,750 71,539
Income tax @ 28% (2011 - 35%) 438,577 516,092 20,650 25,039Income tax @ 15% 4,261 44,981 - -Income tax @ 12% 7,780 - - -Income tax @ 10% 78,074 - - -Income tax at other rates 3,528 3,656 - -social Reasonability Levy (1.5%) - 8,820 - 375 532,220 573,549 20,650 25,414(over) / Under provision in the respect of previous year 1,485 721 (967) 533,705 574,270 19,683 25,414tax on associates results - 620 - -Dividend tax 119,320 56,068 - -Deferred tax 53,103 (14,392) - -total income tax expense 706,128 616,566 19,683 25,414
27.3 Deferred tax expenses / (reversal) Group Company 2011/2012 2010/2011 2011/2012 2010/2011 Rs. ‘000 Rs. ‘000 Rs. ‘000 Rs. ‘000
Accelerated depreciation for tax purpose 58,175 (29,957) (3,523) 2,829Retirement benefit obligations (3,075) (644) 840 (3,947)Benefit arising from tax losses 9,643 15,527 2,683 1,118others (11,640) 682 - -total deferred tax (reversal) / charge 53,103 (14,392) - -
the deferred tax effect on undistributed reserves of subsidiaries has not been recognized since the parent can control the timing of the reversal of these temporary differences.
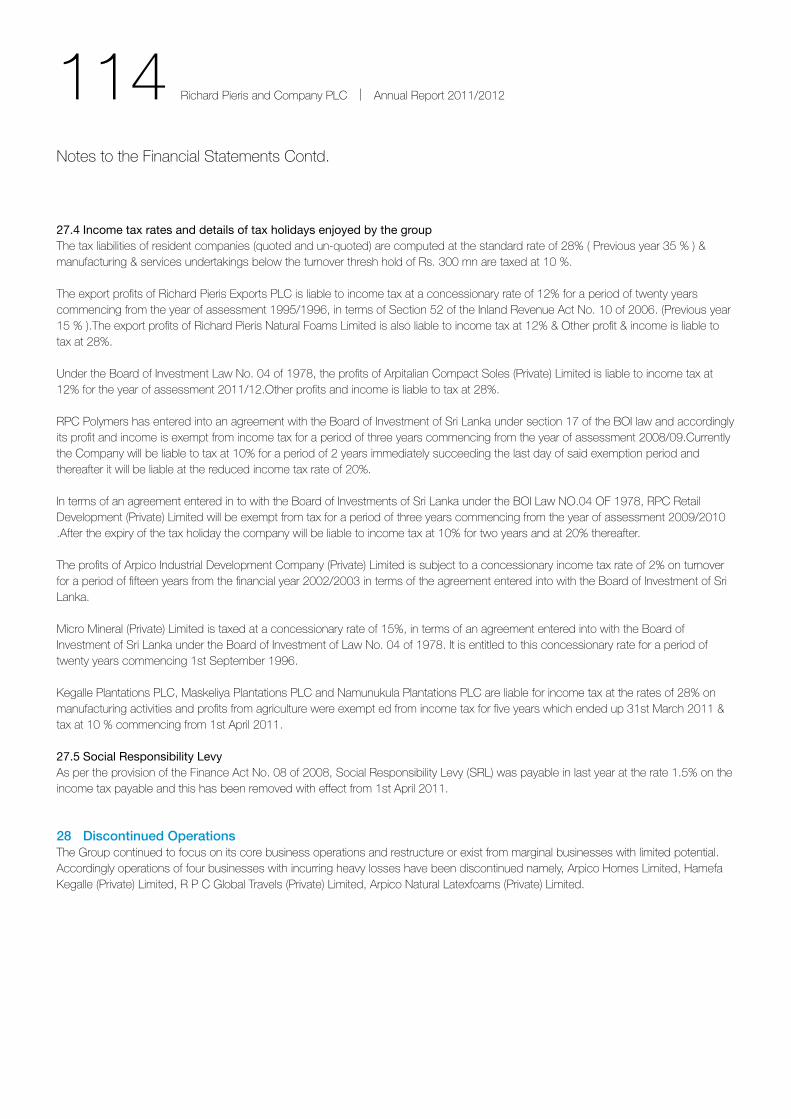
114 Richard Pieris and Company PLC | Annual Report 2011/2012
27.4 Income tax rates and details of tax holidays enjoyed by the groupthe tax liabilities of resident companies (quoted and un-quoted) are computed at the standard rate of 28% ( Previous year 35 % ) & manufacturing & services undertakings below the turnover thresh hold of Rs. 300 mn are taxed at 10 %.
the export profits of Richard Pieris exports PLC is liable to income tax at a concessionary rate of 12% for a period of twenty years commencing from the year of assessment 1995/1996, in terms of section 52 of the Inland Revenue Act no. 10 of 2006. (Previous year 15 % ).the export profits of Richard Pieris natural Foams Limited is also liable to income tax at 12% & other profit & income is liable to tax at 28%.
Under the Board of Investment Law no. 04 of 1978, the profits of Arpitalian Compact soles (Private) Limited is liable to income tax at 12% for the year of assessment 2011/12.other profits and income is liable to tax at 28%.
RPC Polymers has entered into an agreement with the Board of Investment of sri Lanka under section 17 of the BoI law and accordingly its profit and income is exempt from income tax for a period of three years commencing from the year of assessment 2008/09.Currently the Company will be liable to tax at 10% for a period of 2 years immediately succeeding the last day of said exemption period and thereafter it will be liable at the reduced income tax rate of 20%.
In terms of an agreement entered in to with the Board of Investments of sri Lanka under the BoI Law no.04 oF 1978, RPC Retail Development (Private) Limited will be exempt from tax for a period of three years commencing from the year of assessment 2009/2010 .After the expiry of the tax holiday the company will be liable to income tax at 10% for two years and at 20% thereafter.
the profits of Arpico Industrial Development Company (Private) Limited is subject to a concessionary income tax rate of 2% on turnover for a period of fifteen years from the financial year 2002/2003 in terms of the agreement entered into with the Board of Investment of sri Lanka.
Micro Mineral (Private) Limited is taxed at a concessionary rate of 15%, in terms of an agreement entered into with the Board of Investment of sri Lanka under the Board of Investment of Law no. 04 of 1978. It is entitled to this concessionary rate for a period of twenty years commencing 1st september 1996.
Kegalle Plantations PLC, Maskeliya Plantations PLC and namunukula Plantations PLC are liable for income tax at the rates of 28% on manufacturing activities and profits from agriculture were exempt ed from income tax for five years which ended up 31st March 2011 & tax at 10 % commencing from 1st April 2011.
27.5 Social Responsibility LevyAs per the provision of the Finance Act no. 08 of 2008, social Responsibility Levy (sRL) was payable in last year at the rate 1.5% on the income tax payable and this has been removed with effect from 1st April 2011.
28 Discontinued Operationsthe Group continued to focus on its core business operations and restructure or exist from marginal businesses with limited potential. Accordingly operations of four businesses with incurring heavy losses have been discontinued namely, Arpico Homes Limited, Hamefa Kegalle (Private) Limited, R P C Global travels (Private) Limited, Arpico natural Latexfoams (Private) Limited.
notes to the Financial statements Contd.

115 Richard Pieris and Company PLC | Annual Report 2011/2012
the results of discontinued operations are given below.
2011/2012 2010/2011 Rs. ‘000 Rs. ‘000
Revenue - -Cost of sales - -Gross Profit / (Loss) - -other Income 4,515 4,369expenses (8,889) (15,978)Loss for the year from discontinued operations (4,374) (11,609)
Cash flow implications for the year are presented below:
2011/2012 2010/2011 Rs. ‘000 Rs. ‘000
net cash flows from operating activities 2,143 (2,989)
Assets and Liabilities of Entities that are not going concernthe financial statements of the companies stated above have been prepared on a basis other than on a going concern reflecting the closure of discontinued operations.
the aggregated amount of assets and liabilities of such companies as at 31March 2012 are as follows.
total assets Rs. 124 mn (2011 Rs.132 mn)total liabilities Rs. 450 mn (2011 Rs. 454 mn)
Accordingly ,adjustments have been made for the diminution in value of all property, plant and equipment so as to reduce their carrying value to their estimated realisable amount, and for any further liabilities which could arise.
29 Earnings per shareBasic earnings Per share is calculated by dividing the net profit for the year attributable to ordinary shareholders of the company by the weighted average number of ordinary shares outstanding during the year.
the weighted average number of ordinary shares outstanding during the year and the previous year are adjusted for events, that have changed the number of ordinary shares outstanding, without a corresponding change in the resources such as a bonus issue.
Diluted earnings Per share is calculated by dividing the net profit attributable to ordinary shareholders by the weighted average number of ordinary shares outstanding during the year adjusted for the effects of diluted potential ordinary shares.
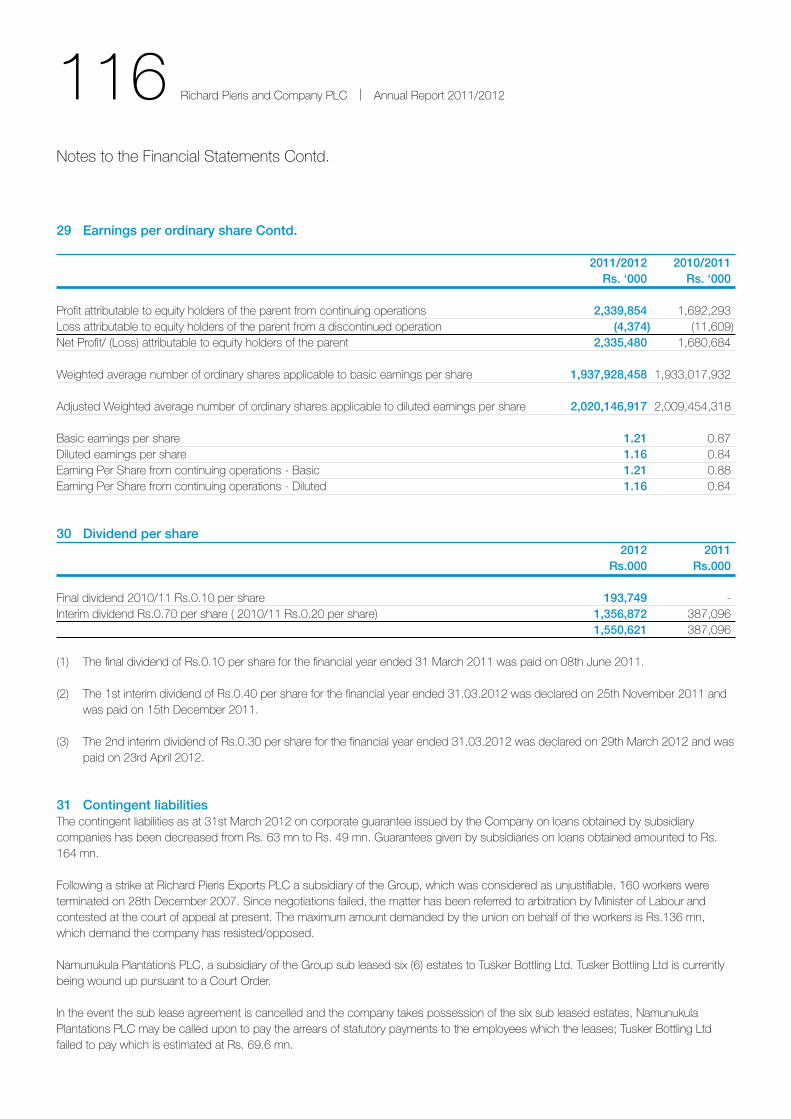
116 Richard Pieris and Company PLC | Annual Report 2011/2012
29 Earnings per ordinary share Contd.
2011/2012 2010/2011 Rs. ‘000 Rs. ‘000
Profit attributable to equity holders of the parent from continuing operations 2,339,854 1,692,293Loss attributable to equity holders of the parent from a discontinued operation (4,374) (11,609)net Profit/ (Loss) attributable to equity holders of the parent 2,335,480 1,680,684
Weighted average number of ordinary shares applicable to basic earnings per share 1,937,928,458 1,933,017,932
Adjusted Weighted average number of ordinary shares applicable to diluted earnings per share 2,020,146,917 2,009,454,318
Basic earnings per share 1.21 0.87Diluted earnings per share 1.16 0.84earning Per share from continuing operations - Basic 1.21 0.88earning Per share from continuing operations - Diluted 1.16 0.84
30 Dividend per share 2012 2011 Rs.000 Rs.000
Final dividend 2010/11 Rs.0.10 per share 193,749 -Interim dividend Rs.0.70 per share ( 2010/11 Rs.0.20 per share) 1,356,872 387,096 1,550,621 387,096
(1) the final dividend of Rs.0.10 per share for the financial year ended 31 March 2011 was paid on 08th June 2011.
(2) the 1st interim dividend of Rs.0.40 per share for the financial year ended 31.03.2012 was declared on 25th november 2011 and was paid on 15th December 2011.
(3) the 2nd interim dividend of Rs.0.30 per share for the financial year ended 31.03.2012 was declared on 29th March 2012 and was paid on 23rd April 2012.
31 Contingent liabilitiesthe contingent liabilities as at 31st March 2012 on corporate guarantee issued by the Company on loans obtained by subsidiary companies has been decreased from Rs. 63 mn to Rs. 49 mn. Guarantees given by subsidiaries on loans obtained amounted to Rs. 164 mn.
Following a strike at Richard Pieris exports PLC a subsidiary of the Group, which was considered as unjustifiable, 160 workers were terminated on 28th December 2007. since negotiations failed, the matter has been referred to arbitration by Minister of Labour and contested at the court of appeal at present. the maximum amount demanded by the union on behalf of the workers is Rs.136 mn, which demand the company has resisted/opposed.
namunukula Plantations PLC, a subsidiary of the Group sub leased six (6) estates to tusker Bottling Ltd. tusker Bottling Ltd is currently being wound up pursuant to a Court order.
In the event the sub lease agreement is cancelled and the company takes possession of the six sub leased estates, namunukula Plantations PLC may be called upon to pay the arrears of statutory payments to the employees which the leases; tusker Bottling Ltd failed to pay which is estimated at Rs. 69.6 mn.
notes to the Financial statements Contd.
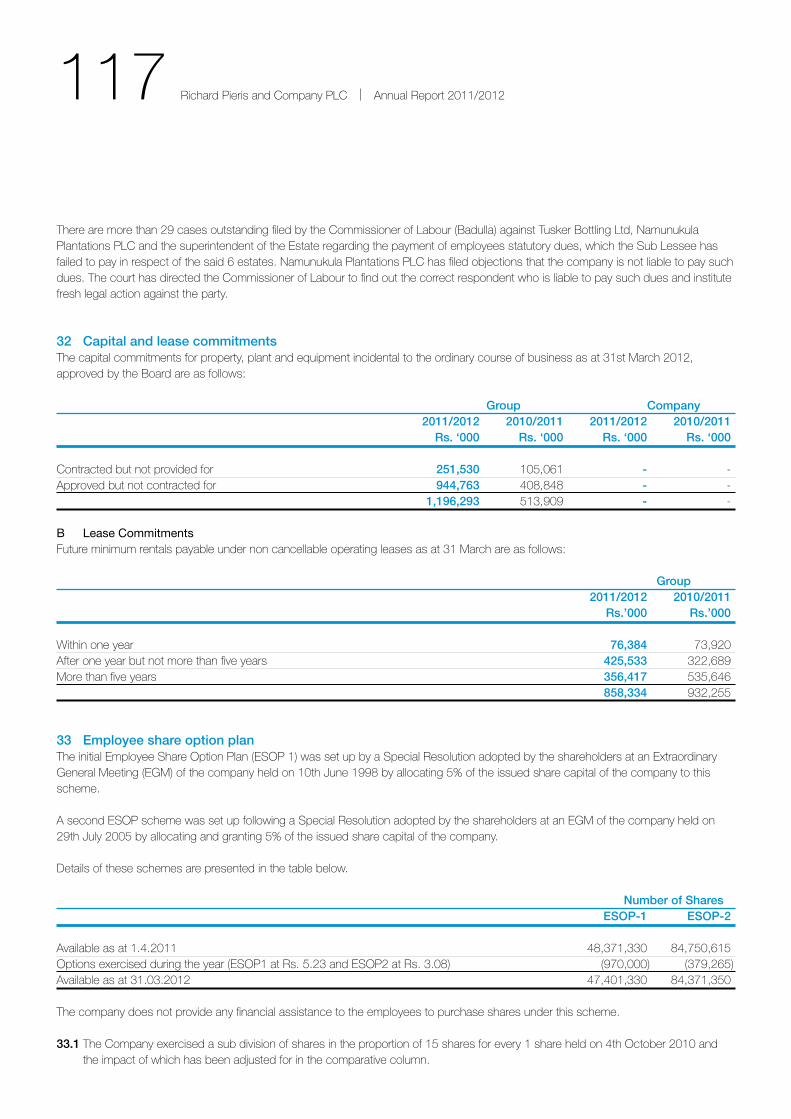
117 Richard Pieris and Company PLC | Annual Report 2011/2012
there are more than 29 cases outstanding filed by the Commissioner of Labour (Badulla) against tusker Bottling Ltd, namunukula Plantations PLC and the superintendent of the estate regarding the payment of employees statutory dues, which the sub Lessee has failed to pay in respect of the said 6 estates. namunukula Plantations PLC has filed objections that the company is not liable to pay such dues. the court has directed the Commissioner of Labour to find out the correct respondent who is liable to pay such dues and institute fresh legal action against the party.
32 Capital and lease commitments the capital commitments for property, plant and equipment incidental to the ordinary course of business as at 31st March 2012, approved by the Board are as follows:
Group Company 2011/2012 2010/2011 2011/2012 2010/2011 Rs. ‘000 Rs. ‘000 Rs. ‘000 Rs. ‘000
Contracted but not provided for 251,530 105,061 - -Approved but not contracted for 944,763 408,848 - - 1,196,293 513,909 - -
B Lease CommitmentsFuture minimum rentals payable under non cancellable operating leases as at 31 March are as follows:
Group 2011/2012 2010/2011 Rs.’000 Rs.’000
Within one year 76,384 73,920After one year but not more than five years 425,533 322,689More than five years 356,417 535,646 858,334 932,255
33 Employee share option planthe initial employee share option Plan (esoP 1) was set up by a special Resolution adopted by the shareholders at an extraordinary General Meeting (eGM) of the company held on 10th June 1998 by allocating 5% of the issued share capital of the company to this scheme.
A second esoP scheme was set up following a special Resolution adopted by the shareholders at an eGM of the company held on 29th July 2005 by allocating and granting 5% of the issued share capital of the company.
Details of these schemes are presented in the table below.
Number of Shares ESOP-1 ESOP-2
Available as at 1.4.2011 48,371,330 84,750,615options exercised during the year (esoP1 at Rs. 5.23 and esoP2 at Rs. 3.08) (970,000) (379,265)Available as at 31.03.2012 47,401,330 84,371,350
the company does not provide any financial assistance to the employees to purchase shares under this scheme.
33.1 the Company exercised a sub division of shares in the proportion of 15 shares for every 1 share held on 4th october 2010 and the impact of which has been adjusted for in the comparative column.
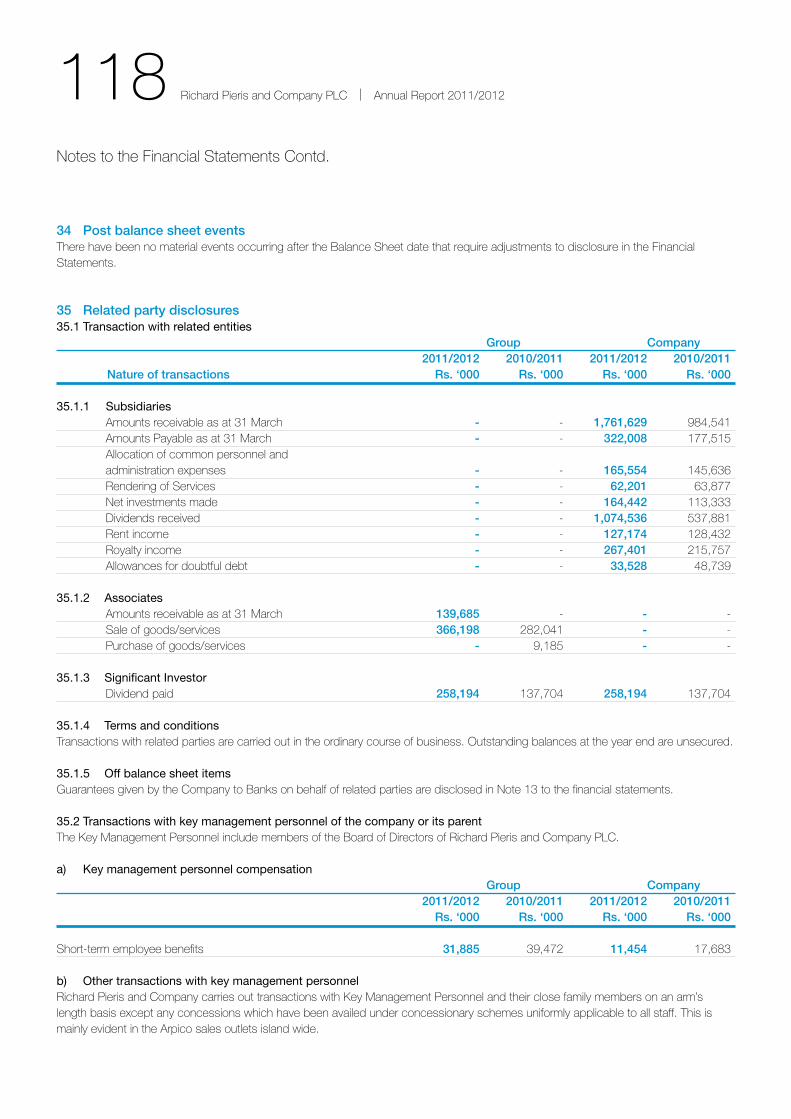
118 Richard Pieris and Company PLC | Annual Report 2011/2012
34 Post balance sheet eventsthere have been no material events occurring after the Balance sheet date that require adjustments to disclosure in the Financial statements.
35 Related party disclosures35.1 Transaction with related entities Group Company 2011/2012 2010/2011 2011/2012 2010/2011 Nature of transactions Rs. ‘000 Rs. ‘000 Rs. ‘000 Rs. ‘000
35.1.1 Subsidiaries Amounts receivable as at 31 March - - 1,761,629 984,541 Amounts Payable as at 31 March - - 322,008 177,515 Allocation of common personnel and administration expenses - - 165,554 145,636 Rendering of services - - 62,201 63,877 net investments made - - 164,442 113,333 Dividends received - - 1,074,536 537,881 Rent income - - 127,174 128,432 Royalty income - - 267,401 215,757 Allowances for doubtful debt - - 33,528 48,739
35.1.2 Associates Amounts receivable as at 31 March 139,685 - - - sale of goods/services 366,198 282,041 - - Purchase of goods/services - 9,185 - -
35.1.3 Significant Investor Dividend paid 258,194 137,704 258,194 137,704
35.1.4 Terms and conditionstransactions with related parties are carried out in the ordinary course of business. outstanding balances at the year end are unsecured.
35.1.5 Off balance sheet itemsGuarantees given by the Company to Banks on behalf of related parties are disclosed in note 13 to the financial statements.
35.2 Transactions with key management personnel of the company or its parentthe Key Management Personnel include members of the Board of Directors of Richard Pieris and Company PLC.
a) Key management personnel compensation Group Company 2011/2012 2010/2011 2011/2012 2010/2011 Rs. ‘000 Rs. ‘000 Rs. ‘000 Rs. ‘000
short-term employee benefits 31,885 39,472 11,454 17,683
b) Other transactions with key management personnelRichard Pieris and Company carries out transactions with Key Management Personnel and their close family members on an arm’s length basis except any concessions which have been availed under concessionary schemes uniformly applicable to all staff. this is mainly evident in the Arpico sales outlets island wide.
notes to the Financial statements Contd.
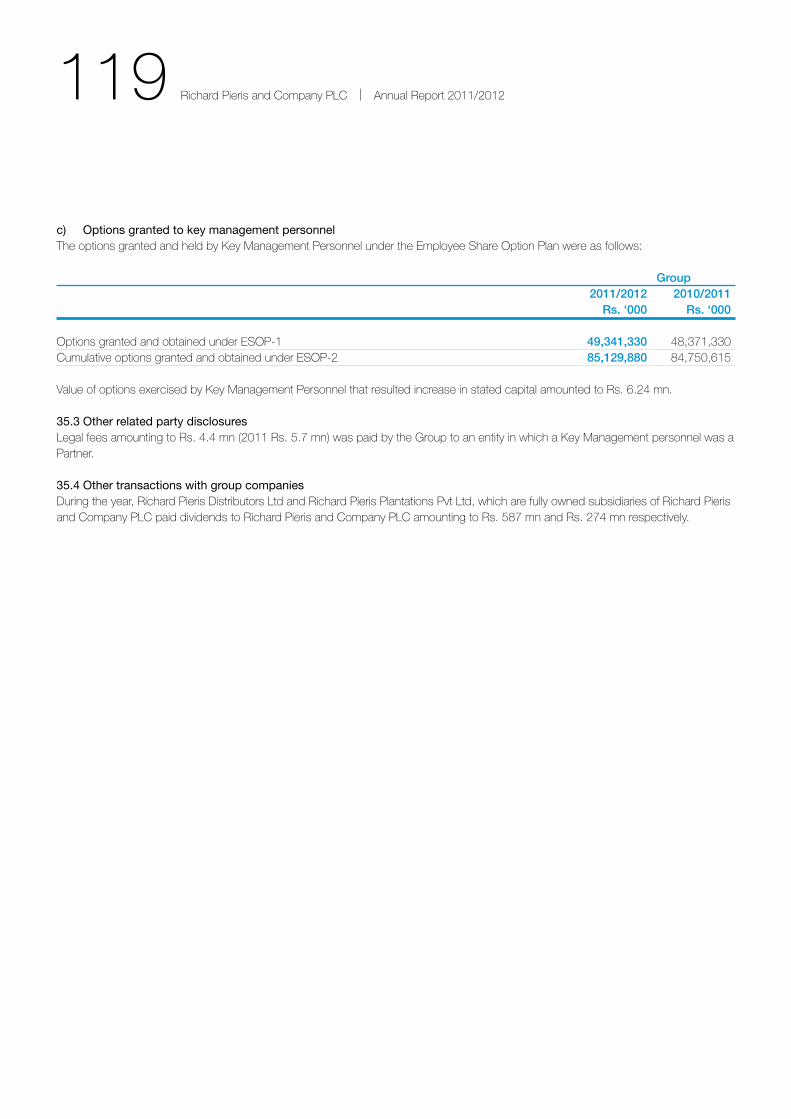
119 Richard Pieris and Company PLC | Annual Report 2011/2012
c) Options granted to key management personnelthe options granted and held by Key Management Personnel under the employee share option Plan were as follows:
Group 2011/2012 2010/2011 Rs. ‘000 Rs. ‘000
options granted and obtained under esoP-1 49,341,330 48,371,330Cumulative options granted and obtained under esoP-2 85,129,880 84,750,615
Value of options exercised by Key Management Personnel that resulted increase in stated capital amounted to Rs. 6.24 mn.
35.3 Other related party disclosures Legal fees amounting to Rs. 4.4 mn (2011 Rs. 5.7 mn) was paid by the Group to an entity in which a Key Management personnel was a Partner.
35.4 Other transactions with group companiesDuring the year, Richard Pieris Distributors Ltd and Richard Pieris Plantations Pvt Ltd, which are fully owned subsidiaries of Richard Pieris and Company PLC paid dividends to Richard Pieris and Company PLC amounting to Rs. 587 mn and Rs. 274 mn respectively.

120 Richard Pieris and Company PLC | Annual Report 2011/2012
2011/2012 2010/2011 2009/2010 2008/2009 2007/2008 2006/2007 2005/2006 2004/2005 2003/2004 2002/2003 Rs. ‘000 Rs. ‘000 Rs. ‘000 Rs. ‘000 Rs. ‘000 Rs. ‘000 Rs. ‘000 Rs. ‘000 Rs. ‘000 Rs. ‘000 TRADING RESULTS net turnover 31,497,914 27,241,577 22,339,288 21,103,176 20,142,591 15,627,638 13,093,791 10,118,693 5,237,157 4,351,197Profit from operations 4,003,765 3,450,366 1,969,697 1,378,556 2,045,930 1,640,288 1,256,820 1,316,639 498,085 260,807 Loss on disposal of investment - - - - (277,000) - - - - - Finance cost (794,264) (794,617) (969,147) (1,436,225) (1,472,629) (879,601) (548,240) (313,895) (120,136) (171,343)Profit from operations after finance cost 3,209,501 2,655,749 1,000,550 (57,669) 296,301 760,687 708,580 1,002,744 377,949 89,464 Income from associates before tax 62,436 113,008 59,609 41,015 27,969 11,646 4,593 101,455 193,647 97,149 Profit/(loss) before tax from continuing operations 3,271,937 2,768,757 1,060,159 (16,654) 324,270 772,333 713,173 1,104,199 571,597 186,613 Income tax expense (706,128) (616,566) (330,592) (180,411) (77,278) (92,231) (120,150) (151,567) (71,738) (29,728)Profit/(loss) for the year from continuing operations 2,565,809 2,152,191 729,567 (197,065) 246,992 680,102 - - - - Loss after tax from discontinued operations (4,374) (11,609) (17,873) (107,963) (203,216) (165,527) - - - - Profit/(loss) for the year 2,561,435 2,140,582 711,694 (305,028) 43,776 514,575 593,023 952,632 499,859 156,885 Minority interest 221,581 459,898 131,490 24,055 (258,853) (208,180) (63,994) (82,229) (19,194) (31,095)Profit/(loss) attributable to equity holders of parent 2,339,854 1,680,684 580,204 (329,083) (215,077) 306,395 529,029 870,403 480,665 125,790 Gross dividend 1,550,621 515,946 - - - 59,193 177,578 207,174 177,403 47,111 BALANCE SHEET Assets Property, plant and equipment 11,313,855 10,607,259 10,142,760 10,167,170 10,125,468 9,433,192 9,464,246 6,203,485 5,481,116 2,105,783 Intangible assets 542,758 497,279 480,177 491,491 500,857 500,816 520,058 272,053 286,989 74,655 Investments in associates and other investments 79,768 480,186 180,919 136,757 101,007 1,765,956 96,408 73,694 628,540 1,018,016 Current assets 10,966,849 9,054,733 6,560,961 6,128,679 7,079,997 5,983,116 5,801,373 4,143,522 2,543,878 1,408,965 22,903,230 20,639,457 17,364,817 16,924,097 17,807,329 17,683,080 15,882,085 10,692,754 8,940,523 4,607,419 Equity and liabilities stated Capital 1,633,853 1,627,612 1,578,475 1,578,475 1,578,475 1,183,856 1,183,856 591,928 590,540 235,556 Capital and revenue reserves 4,137,236 3,348,003 2,185,500 1,603,061 1,932,144 2,601,033 2,395,652 2,576,931 1,902,699 1,880,271 Foreign currency translation 38,236 27,314 31,152 32,371 21,599 23,363 17,162 13,878 12,315 11,765 Preliminary and pre-operating expenses - - - - - - - - - - Minority interest 1,847,746 1,860,693 1,500,836 1,380,908 1,390,232 1,197,663 1,022,198 805,191 760,230 220,763 term loans payable after one year 2,177,814 1,998,291 1,957,680 2,354,617 2,683,162 2,968,288 2,197,653 1,224,344 1,515,237 553,159 Deferred income and Deferred tax 641,301 595,352 553,879 499,951 386,143 353,751 521,598 435,731 434,425 106,790 Provisions and other liabilities 1,940,629 1,662,131 1,529,685 1,103,222 1,037,650 871,716 832,373 595,252 563,882 151,082 net liability to the lessor payable after one year 638,237 650,980 672,158 697,432 722,234 713,740 691,219 441,632 446,411 - Current liabilities 9,838,791 8,869,081 7,355,452 7,674,060 8,055,690 7,769,670 7,020,374 4,007,867 2,714,783 1,448,033 22,893,839 20,639,457 17,364,817 16,924,097 17,807,329 17,683,080 15,882,085 10,692,754 8,940,523 4,607,419 RATIOS & OTHER INFORMATION earnings per share (Rs.) 1.21 0.87 4.52 (2.57) (1.68) 2.39 4.47 7.36 4.07 1.07 Market value per share (Rs.) 7.50 13.60 55.00 25.00 39.00 65.00 75.00 165.00 92.75 92.50 Price earnings ratio (no. of times) 6.20 15.63 12.17 - - 27.20 16.78 11.28 11.39 17.29 net assets per share (Rs.) 3.00 2.58 29.57 25.06 27.54 32.17 30.38 53.77 42.43 36.03 Return on equity (%) 43.28 38.22 16.56 (10.24) (6.09) 8.05 15.61 30.60 20.75 5.99 Dividend per share (Rs.) 0.70 0.30 1.00 - - 0.50 1.50 3.50 3.00 2.00 Dividend cover (no. of times) 1.73 2.90 4.52 - - 4.78 2.98 4.20 2.71 2.67 Interest cover (no. of times) 5.04 4.34 2.03 0.96 1.20 1.86 2.30 4.52 5.76 2.09 Current ratio (no. of times) 1.11 1.02 0.89 0.79 0.88 0.77 0.83 1.03 0.94 0.97 Gearing ratio (%) 33.28 38.62 49.68 59.80 61.49 63.03 58.61 41.93 45.22 41.13
ten Year summary
Net Turnover
0
5,000
10,000
15,000
25,000
35,000
30,000
20,000
07/08 08/09 09/10 10/11 11/12
Rs. Mn.
Tax Expense
0
100
200
300
500
800
700
600
400
07/08 08/09 09/10 10/11 11/12
Rs. Mn.
Interest Cover
Finance Cost
Interest Cover Ratio
0
400
200
600
800
1,200
1,400
1,000
1,600
07/08 08/09 09/10 10/11 11/120
1.0
2.0
3.0
4.0
5.0
6.0
Rs. Mn.
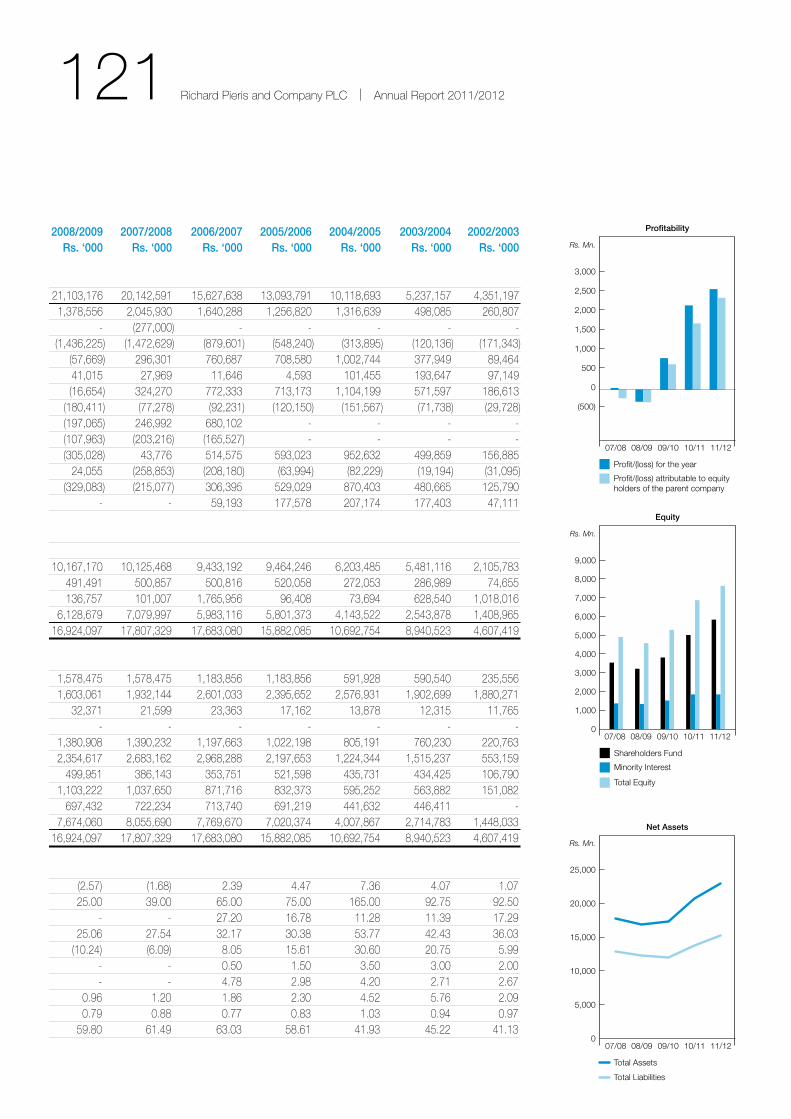
121 Richard Pieris and Company PLC | Annual Report 2011/2012
Equity
0
1,000
2,000
3,000
5,000
9,000
7,000
8,000
6,000
4,000
07/08 08/09 09/10 10/11 11/12
Rs. Mn.
Shareholders Fund
Minority Interest
Total Equity
Net Assets
Total Assets
Total Liabilities
0
5,000
10,000
15,000
20,000
25,000
07/08 08/09 09/10 10/11 11/12
Rs. Mn.
Profitability
Profit/(loss) for the year
Profit/(loss) attributable to equity holders of the parent company
(500)
0
500
1,000
1,500
2,000
2,500
3,000
07/08 08/09 09/10 10/11 11/12
Rs. Mn.
2011/2012 2010/2011 2009/2010 2008/2009 2007/2008 2006/2007 2005/2006 2004/2005 2003/2004 2002/2003 Rs. ‘000 Rs. ‘000 Rs. ‘000 Rs. ‘000 Rs. ‘000 Rs. ‘000 Rs. ‘000 Rs. ‘000 Rs. ‘000 Rs. ‘000 TRADING RESULTS net turnover 31,497,914 27,241,577 22,339,288 21,103,176 20,142,591 15,627,638 13,093,791 10,118,693 5,237,157 4,351,197Profit from operations 4,003,765 3,450,366 1,969,697 1,378,556 2,045,930 1,640,288 1,256,820 1,316,639 498,085 260,807 Loss on disposal of investment - - - - (277,000) - - - - - Finance cost (794,264) (794,617) (969,147) (1,436,225) (1,472,629) (879,601) (548,240) (313,895) (120,136) (171,343)Profit from operations after finance cost 3,209,501 2,655,749 1,000,550 (57,669) 296,301 760,687 708,580 1,002,744 377,949 89,464 Income from associates before tax 62,436 113,008 59,609 41,015 27,969 11,646 4,593 101,455 193,647 97,149 Profit/(loss) before tax from continuing operations 3,271,937 2,768,757 1,060,159 (16,654) 324,270 772,333 713,173 1,104,199 571,597 186,613 Income tax expense (706,128) (616,566) (330,592) (180,411) (77,278) (92,231) (120,150) (151,567) (71,738) (29,728)Profit/(loss) for the year from continuing operations 2,565,809 2,152,191 729,567 (197,065) 246,992 680,102 - - - - Loss after tax from discontinued operations (4,374) (11,609) (17,873) (107,963) (203,216) (165,527) - - - - Profit/(loss) for the year 2,561,435 2,140,582 711,694 (305,028) 43,776 514,575 593,023 952,632 499,859 156,885 Minority interest 221,581 459,898 131,490 24,055 (258,853) (208,180) (63,994) (82,229) (19,194) (31,095)Profit/(loss) attributable to equity holders of parent 2,339,854 1,680,684 580,204 (329,083) (215,077) 306,395 529,029 870,403 480,665 125,790 Gross dividend 1,550,621 515,946 - - - 59,193 177,578 207,174 177,403 47,111 BALANCE SHEET Assets Property, plant and equipment 11,313,855 10,607,259 10,142,760 10,167,170 10,125,468 9,433,192 9,464,246 6,203,485 5,481,116 2,105,783 Intangible assets 542,758 497,279 480,177 491,491 500,857 500,816 520,058 272,053 286,989 74,655 Investments in associates and other investments 79,768 480,186 180,919 136,757 101,007 1,765,956 96,408 73,694 628,540 1,018,016 Current assets 10,966,849 9,054,733 6,560,961 6,128,679 7,079,997 5,983,116 5,801,373 4,143,522 2,543,878 1,408,965 22,903,230 20,639,457 17,364,817 16,924,097 17,807,329 17,683,080 15,882,085 10,692,754 8,940,523 4,607,419 Equity and liabilities stated Capital 1,633,853 1,627,612 1,578,475 1,578,475 1,578,475 1,183,856 1,183,856 591,928 590,540 235,556 Capital and revenue reserves 4,137,236 3,348,003 2,185,500 1,603,061 1,932,144 2,601,033 2,395,652 2,576,931 1,902,699 1,880,271 Foreign currency translation 38,236 27,314 31,152 32,371 21,599 23,363 17,162 13,878 12,315 11,765 Preliminary and pre-operating expenses - - - - - - - - - - Minority interest 1,847,746 1,860,693 1,500,836 1,380,908 1,390,232 1,197,663 1,022,198 805,191 760,230 220,763 term loans payable after one year 2,177,814 1,998,291 1,957,680 2,354,617 2,683,162 2,968,288 2,197,653 1,224,344 1,515,237 553,159 Deferred income and Deferred tax 641,301 595,352 553,879 499,951 386,143 353,751 521,598 435,731 434,425 106,790 Provisions and other liabilities 1,940,629 1,662,131 1,529,685 1,103,222 1,037,650 871,716 832,373 595,252 563,882 151,082 net liability to the lessor payable after one year 638,237 650,980 672,158 697,432 722,234 713,740 691,219 441,632 446,411 - Current liabilities 9,838,791 8,869,081 7,355,452 7,674,060 8,055,690 7,769,670 7,020,374 4,007,867 2,714,783 1,448,033 22,893,839 20,639,457 17,364,817 16,924,097 17,807,329 17,683,080 15,882,085 10,692,754 8,940,523 4,607,419 RATIOS & OTHER INFORMATION earnings per share (Rs.) 1.21 0.87 4.52 (2.57) (1.68) 2.39 4.47 7.36 4.07 1.07 Market value per share (Rs.) 7.50 13.60 55.00 25.00 39.00 65.00 75.00 165.00 92.75 92.50 Price earnings ratio (no. of times) 6.20 15.63 12.17 - - 27.20 16.78 11.28 11.39 17.29 net assets per share (Rs.) 3.00 2.58 29.57 25.06 27.54 32.17 30.38 53.77 42.43 36.03 Return on equity (%) 43.28 38.22 16.56 (10.24) (6.09) 8.05 15.61 30.60 20.75 5.99 Dividend per share (Rs.) 0.70 0.30 1.00 - - 0.50 1.50 3.50 3.00 2.00 Dividend cover (no. of times) 1.73 2.90 4.52 - - 4.78 2.98 4.20 2.71 2.67 Interest cover (no. of times) 5.04 4.34 2.03 0.96 1.20 1.86 2.30 4.52 5.76 2.09 Current ratio (no. of times) 1.11 1.02 0.89 0.79 0.88 0.77 0.83 1.03 0.94 0.97 Gearing ratio (%) 33.28 38.62 49.68 59.80 61.49 63.03 58.61 41.93 45.22 41.13
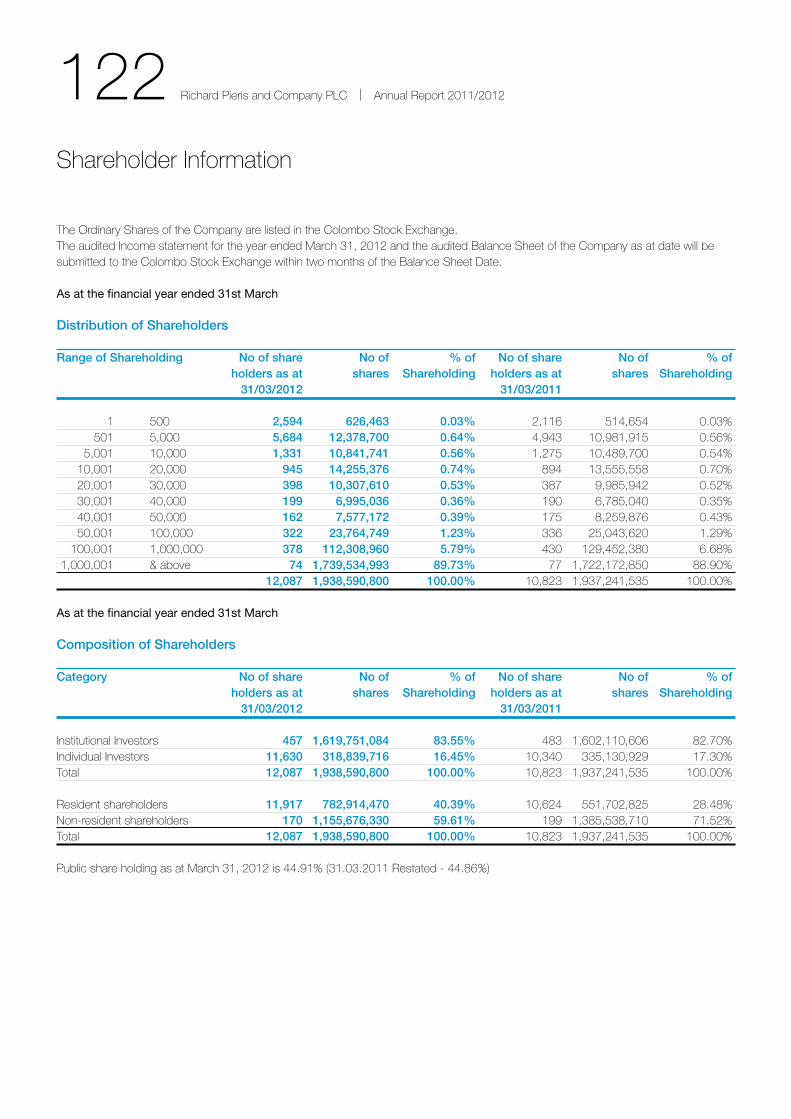
122 Richard Pieris and Company PLC | Annual Report 2011/2012
the ordinary shares of the Company are listed in the Colombo stock exchange.the audited Income statement for the year ended March 31, 2012 and the audited Balance sheet of the Company as at date will be submitted to the Colombo stock exchange within two months of the Balance sheet Date.
As at the financial year ended 31st March
Distribution of Shareholders
Range of Shareholding No of share No of % of No of share No of % of holders as at shares Shareholding holders as at shares Shareholding 31/03/2012 31/03/2011
1 500 2,594 626,463 0.03% 2,116 514,654 0.03% 501 5,000 5,684 12,378,700 0.64% 4,943 10,981,915 0.56% 5,001 10,000 1,331 10,841,741 0.56% 1,275 10,489,700 0.54% 10,001 20,000 945 14,255,376 0.74% 894 13,555,558 0.70% 20,001 30,000 398 10,307,610 0.53% 387 9,985,942 0.52% 30,001 40,000 199 6,995,036 0.36% 190 6,785,040 0.35% 40,001 50,000 162 7,577,172 0.39% 175 8,259,876 0.43% 50,001 100,000 322 23,764,749 1.23% 336 25,043,620 1.29% 100,001 1,000,000 378 112,308,960 5.79% 430 129,452,380 6.68% 1,000,001 & above 74 1,739,534,993 89.73% 77 1,722,172,850 88.90% 12,087 1,938,590,800 100.00% 10,823 1,937,241,535 100.00%
As at the financial year ended 31st March
Composition of Shareholders Category No of share No of % of No of share No of % of holders as at shares Shareholding holders as at shares Shareholding 31/03/2012 31/03/2011
Institutional Investors 457 1,619,751,084 83.55% 483 1,602,110,606 82.70%Individual Investors 11,630 318,839,716 16.45% 10,340 335,130,929 17.30%total 12,087 1,938,590,800 100.00% 10,823 1,937,241,535 100.00%
Resident shareholders 11,917 782,914,470 40.39% 10,624 551,702,825 28.48%non-resident shareholders 170 1,155,676,330 59.61% 199 1,385,538,710 71.52%total 12,087 1,938,590,800 100.00% 10,823 1,937,241,535 100.00%
Public share holding as at March 31, 2012 is 44.91% (31.03.2011 Restated - 44.86%)
shareholder Information
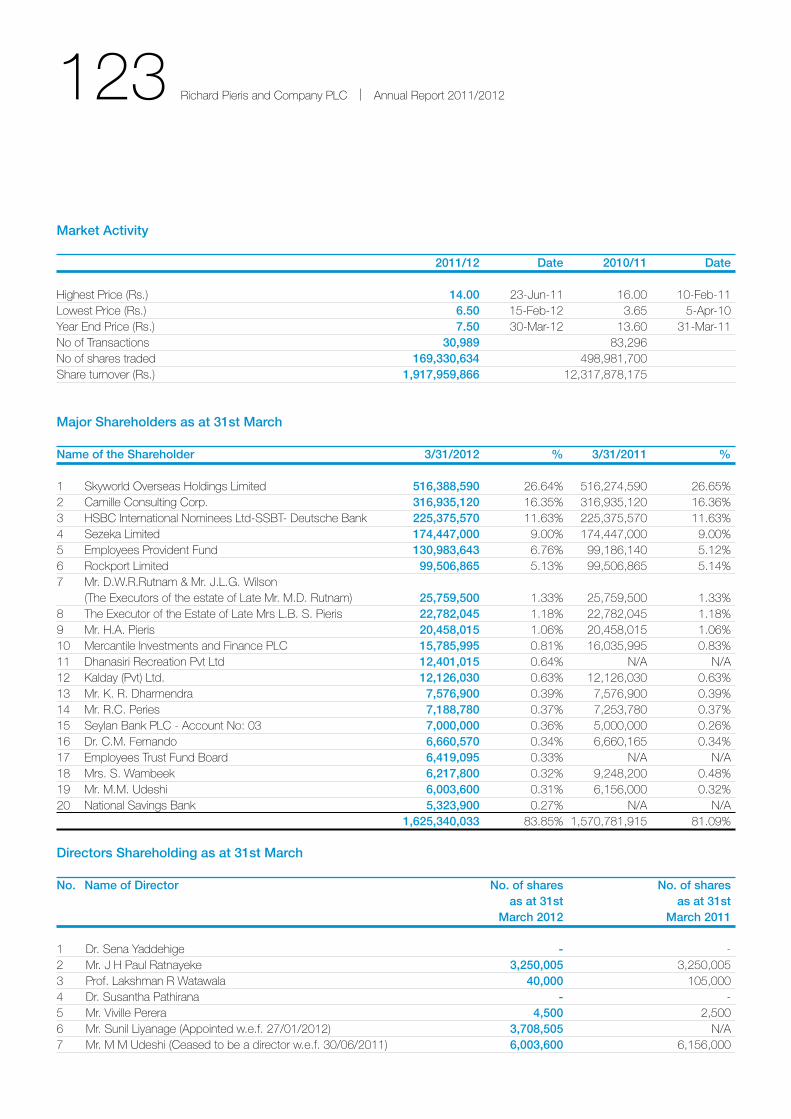
123 Richard Pieris and Company PLC | Annual Report 2011/2012
Market Activity
2011/12 Date 2010/11 Date
Highest Price (Rs.) 14.00 23-Jun-11 16.00 10-Feb-11Lowest Price (Rs.) 6.50 15-Feb-12 3.65 5-Apr-10Year end Price (Rs.) 7.50 30-Mar-12 13.60 31-Mar-11no of transactions 30,989 83,296no of shares traded 169,330,634 498,981,700share turnover (Rs.) 1,917,959,866 12,317,878,175
Major Shareholders as at 31st March
Name of the Shareholder 3/31/2012 % 3/31/2011 %
1 skyworld overseas Holdings Limited 516,388,590 26.64% 516,274,590 26.65%2 Camille Consulting Corp. 316,935,120 16.35% 316,935,120 16.36%3 HsBC International nominees Ltd-ssBt- Deutsche Bank 225,375,570 11.63% 225,375,570 11.63%4 sezeka Limited 174,447,000 9.00% 174,447,000 9.00%5 employees Provident Fund 130,983,643 6.76% 99,186,140 5.12%6 Rockport Limited 99,506,865 5.13% 99,506,865 5.14%7 Mr. D.W.R.Rutnam & Mr. J.L.G. Wilson (the executors of the estate of Late Mr. M.D. Rutnam) 25,759,500 1.33% 25,759,500 1.33%8 the executor of the estate of Late Mrs L.B. s. Pieris 22,782,045 1.18% 22,782,045 1.18%9 Mr. H.A. Pieris 20,458,015 1.06% 20,458,015 1.06%10 Mercantile Investments and Finance PLC 15,785,995 0.81% 16,035,995 0.83%11 Dhanasiri Recreation Pvt Ltd 12,401,015 0.64% n/A n/A12 Kalday (Pvt) Ltd. 12,126,030 0.63% 12,126,030 0.63%13 Mr. K. R. Dharmendra 7,576,900 0.39% 7,576,900 0.39%14 Mr. R.C. Peries 7,188,780 0.37% 7,253,780 0.37%15 seylan Bank PLC - Account no: 03 7,000,000 0.36% 5,000,000 0.26%16 Dr. C.M. Fernando 6,660,570 0.34% 6,660,165 0.34%17 employees trust Fund Board 6,419,095 0.33% n/A n/A18 Mrs. s. Wambeek 6,217,800 0.32% 9,248,200 0.48%19 Mr. M.M. Udeshi 6,003,600 0.31% 6,156,000 0.32%20 national savings Bank 5,323,900 0.27% n/A n/A 1,625,340,033 83.85% 1,570,781,915 81.09%
Directors Shareholding as at 31st March
No. Name of Director No. of shares No. of shares as at 31st as at 31st March 2012 March 2011
1 Dr. sena Yaddehige - -2 Mr. J H Paul Ratnayeke 3,250,005 3,250,0053 Prof. Lakshman R Watawala 40,000 105,0004 Dr. susantha Pathirana - -5 Mr. Viville Perera 4,500 2,5006 Mr. sunil Liyanage (Appointed w.e.f. 27/01/2012) 3,708,505 n/A7 Mr. M M Udeshi (Ceased to be a director w.e.f. 30/06/2011) 6,003,600 6,156,000
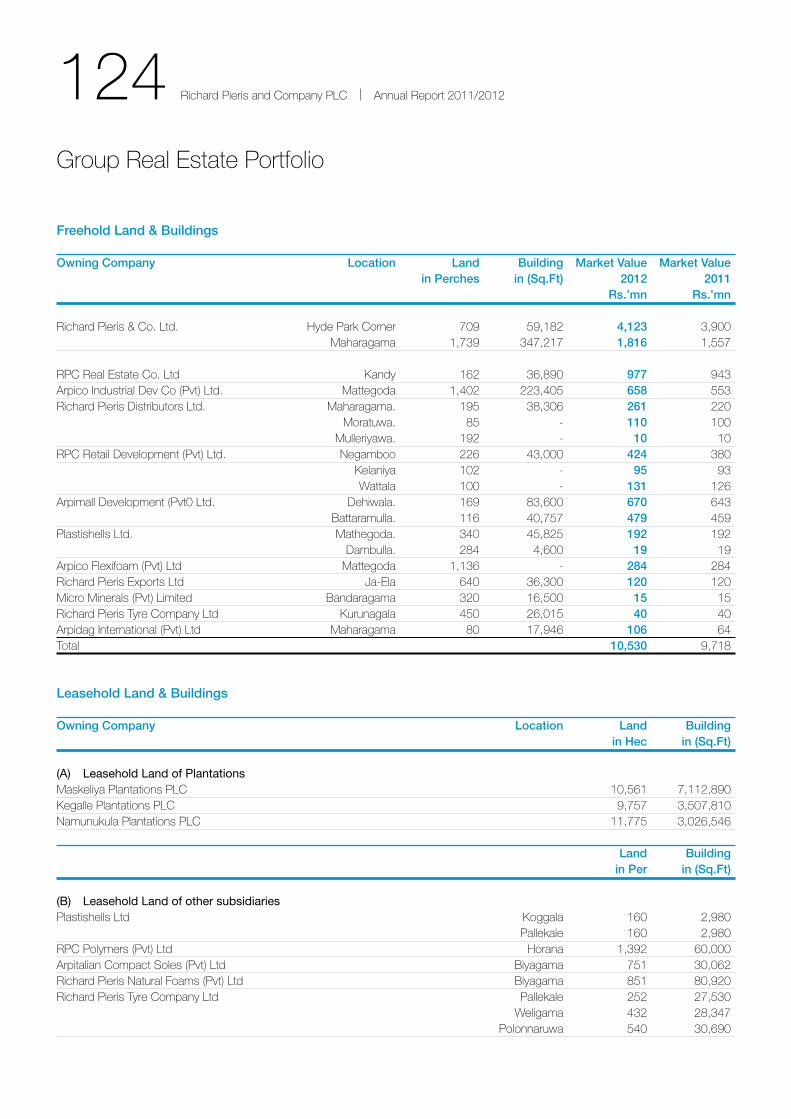
124 Richard Pieris and Company PLC | Annual Report 2011/2012
Group Real estate Portfolio
Freehold Land & Buildings
Owning Company Location Land Building Market Value Market Value in Perches in (Sq.Ft) 2012 2011 Rs.’mn Rs.’mn
Richard Pieris & Co. Ltd. Hyde Park Corner 709 59,182 4,123 3,900 Maharagama 1,739 347,217 1,816 1,557
RPC Real estate Co. Ltd Kandy 162 36,890 977 943Arpico Industrial Dev Co (Pvt) Ltd. Mattegoda 1,402 223,405 658 553Richard Pieris Distributors Ltd. Maharagama. 195 38,306 261 220 Moratuwa. 85 - 110 100 Mulleriyawa. 192 - 10 10RPC Retail Development (Pvt) Ltd. negamboo 226 43,000 424 380 Kelaniya 102 - 95 93 Wattala 100 - 131 126Arpimall Development (Pvt0 Ltd. Dehiwala. 169 83,600 670 643 Battaramulla. 116 40,757 479 459Plastishells Ltd. Mathegoda. 340 45,825 192 192 Dambulla. 284 4,600 19 19Arpico Flexifoam (Pvt) Ltd Mattegoda 1,136 - 284 284Richard Pieris exports Ltd Ja-ela 640 36,300 120 120Micro Minerals (Pvt) Limited Bandaragama 320 16,500 15 15Richard Pieris tyre Company Ltd Kurunagala 450 26,015 40 40Arpidag International (Pvt) Ltd Maharagama 80 17,946 106 64total 10,530 9,718
Leasehold Land & Buildings
Owning Company Location Land Building in Hec in (Sq.Ft)
(A) Leasehold Land of PlantationsMaskeliya Plantations PLC 10,561 7,112,890Kegalle Plantations PLC 9,757 3,507,810namunukula Plantations PLC 11,775 3,026,546
Land Building in Per in (Sq.Ft)
(B) Leasehold Land of other subsidiariesPlastishells Ltd Koggala 160 2,980 Pallekale 160 2,980RPC Polymers (Pvt) Ltd Horana 1,392 60,000Arpitalian Compact soles (Pvt) Ltd Biyagama 751 30,062Richard Pieris natural Foams (Pvt) Ltd Biyagama 851 80,920Richard Pieris tyre Company Ltd Pallekale 252 27,530 Weligama 432 28,347 Polonnaruwa 540 30,690
125 Richard Pieris and Company PLC | Annual Report 2011/2012
Associate CompanyA Company other than a subsidiary in which a holding company
has a participating interest and exercises significant influence over
its operating and financial policies.
Current RatioCurrent Assets divided by Current Liabilities. A measure of short
term liquidity.
Debt to Equity RatioLong term Interest Bearing Borrowings divided by net Assets.
Deferred Taxationsum set aside for tax in the Financial statements that will become
payable in a financial year other than the current financial year.
Dividend CoverProfit attributable to ordinary shareholders divided by Gross
Dividend. Measures the number of times dividend is covered by
distributable profit.
Dividend per ShareGross Dividend divided by the number of ordinary shares in
issue at the year end.
Dividend YieldGross Dividend per share as a percentage of the year end market
price per share. A measure of return on shareholders’ investment.
Earnings Per Share (EPS)Profits attributable to ordinary shareholders divided by the
weighted average number of ordinary shares in issue.
Earnings Yieldearnings per share as a percentage of the year end market price
per share.
Effective Tax RateIncome tax expenses divided by profit before tax.
Gearing RatioProportion of total interest bearing liabilities to total capital
employed.
Gross DividendPortion of profits inclusive of tax withheld, distributed to
shareholders during the year.
Glossary of Financial terms
Interest CoverProfit Before tax (PBt) plus net finance cost divided by net
finance cost. Measure of entity’s debt service ability.
Investment PropertyA property that is not occupied by the owner, usually purchased
specifically to generate profit through rental income and/or capital
gains.
Market Capitalizationnumber of shares in issue multiplied by the market value of a
share at the reported date.
Minority InterestAn outside ownership interest in a subsidiary that is consolidated
with the parent for financial reporting purposes.
Net Assets per Shareshareholders’ fund divided by weighted average number of
ordinary shares in issue. A basis of relative share valuation.
Price Earnings RatioMarket Price of a share divided by earnings per share as reported
at that date.
Price to Book ValueMarket price of a share divided by net Assets per share.
Public Shareholdingshares of a Listed entity held by any person other than those
directly or indirectly held by;
a) its parent, subsidiary or associate companies or any
subsidiaries or associates of its parent company; and,
b) its directors who are holding office as directors of the entity,
their spouses and children under 18 years of age; and,
c) Chief executive officer, his/her spouse and children under
18 years of age; and,
d) any single shareholder who holds 10% or more of the
shares.
Related PartiesParties who could control or significantly influence the financial
and operating policies of the business.
Return on Total Capital EmployedProfit before tax plus net finance cost divided by average total
capital employed.

126 Richard Pieris and Company PLC | Annual Report 2011/2012
Return on EquityProfit after tax less Preference share dividend if any, expressed
as a percentage of Average ordinary shareholders’ Fund.
Revenue ReservesReserves considered as being available for distributions.
RecessionReduction of a country’s GDP or negative real economic growth
for at least two consecutive quarters.
Segmental AnalysisAnalysis of financial information to segments of an enterprise
specifically, the different industries and the different geographical
areas in which it operates.
Shareholders’ Fundstated Capital plus Revenue Reserves.
Stated Capitalthe total of all amounts received by the entity or due and payable
to the entity by shareholders in respect of the issue of shares and
calls on shares.
Subsidiary CompanyA company is a subsidiary of another company if the parent
company holds more than 50% of the voting rights or controls the
composition of its Board of Directors.
Total Capital Employedtotal shareholders’ Fund plus Minority Interest plus total interest
bearing borrowings.
Value Additionthe quantum of wealth generated by the activities of the Group
measured as the differences between net revenue (including
other income) and the cost of materials and services bought in.
Working Capital InvestmentCapital required financing the day-to-day operations computed as
the excess of current assets over current liabilities.
Glossary of Financial terms Contd.

127 Richard Pieris and Company PLC | Annual Report 2011/2012
notes

128 Richard Pieris and Company PLC | Annual Report 2011/2012
notes Contd.

129 Richard Pieris and Company PLC | Annual Report 2011/2012
130 Richard Pieris and Company PLC | Annual Report 2011/2012
notICe Is HeReBY GIVen that the seventy third Annual General
Meeting of Richard Pieris & Company PLC will be held at the
Registered office of the Company, no. 310, High Level Road,
nawinna, Maharagama on Friday, 29th June 2012 at 4.00.p.m.
and the business to be brought before the meeting will be as
follows;
1. to consider the Report of the Directors and the statement
of Accounts for the year ended 31st March 2012 with the
Report of the Auditors thereon.
2. to re-elect Mr. J H P Ratnayeke who retires by rotation in
terms of Article 85 at the Annual General Meeting, as a
Director.
3. to elect Mr. sunil Liyanage who retires in terms of Article 91
as a Director.
4. to re -appoint M/s. ernst & Young, Chartered Accountants
as Auditors of the Company and to authorize the Directors
to determine their remuneration.
5. to authorize the Directors to determine contributions to
charities.
6. to consider any other business of which due notice has
been given.
By order of the Board
Richard Pieris Group Services (Private) LimitedSecretaries
no. 310, High Level Road, nawinna, Maharagama
24th May 2012
notice of Meeting
Note:a) A member entitled to attend and vote at the meeting is
entitled to appoint a proxy to attend and vote instead of him/
her.
b) A proxy need not be a member of the Company. the form
of proxy will be found inserted in the Annual Report.
c) the completed form of proxy should be deposited at the
registered office of the Company no. 310, High Level Road,
nawinna, Maharagama., not less than 48 hours before the
time appointed for the holding of the meeting.
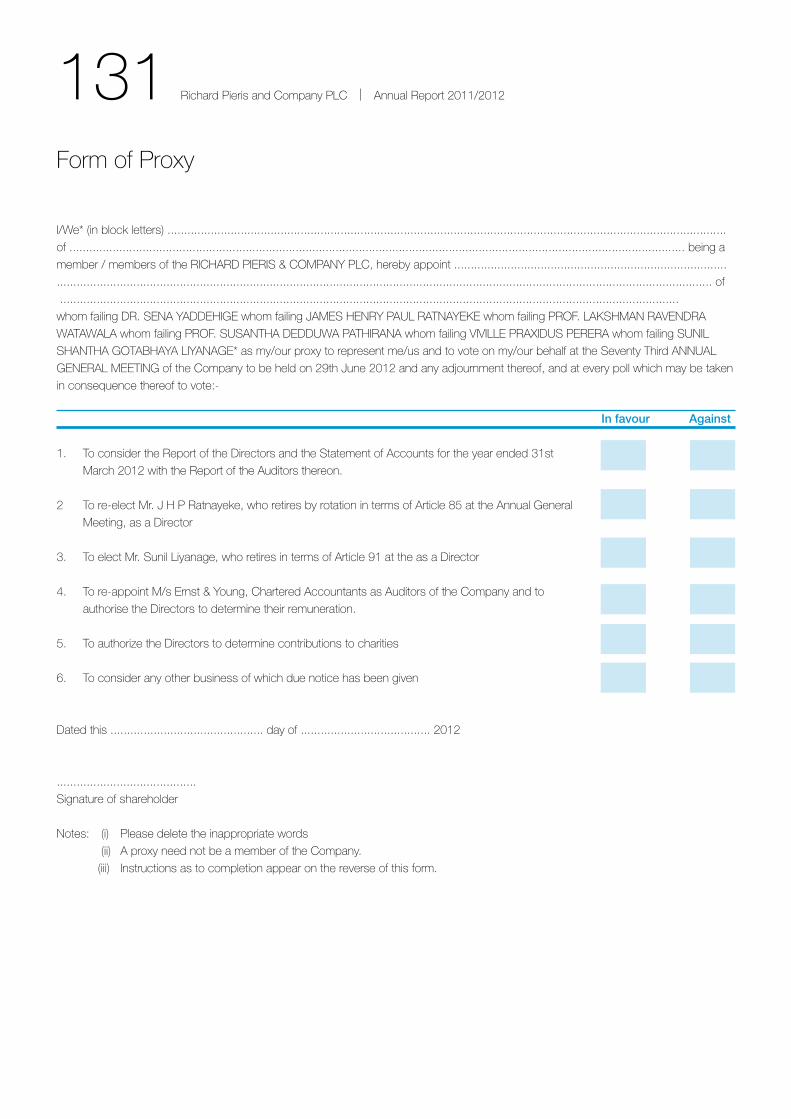
131 Richard Pieris and Company PLC | Annual Report 2011/2012
I/We* (in block letters) ........................................................................................................................................................................
of ......................................................................................................................................................................................... being a
member / members of the RICHARD PIeRIs & CoMPAnY PLC, hereby appoint ..................................................................................
..................................................................................................................................................................................................... of
..........................................................................................................................................................................................
whom failing DR. senA YADDeHIGe whom failing JAMes HenRY PAUL RAtnAYeKe whom failing PRoF. LAKsHMAn RAVenDRA
WAtAWALA whom failing PRoF. sUsAntHA DeDDUWA PAtHIRAnA whom failing VIVILLe PRAXIDUs PeReRA whom failing sUnIL
sHAntHA GotABHAYA LIYAnAGe* as my/our proxy to represent me/us and to vote on my/our behalf at the seventy third AnnUAL
GeneRAL MeetInG of the Company to be held on 29th June 2012 and any adjournment thereof, and at every poll which may be taken
in consequence thereof to vote:-
In favour Against
1. to consider the Report of the Directors and the statement of Accounts for the year ended 31st
March 2012 with the Report of the Auditors thereon.
2 to re-elect Mr. J H P Ratnayeke, who retires by rotation in terms of Article 85 at the Annual General
Meeting, as a Director
3. to elect Mr. sunil Liyanage, who retires in terms of Article 91 at the as a Director
4. to re-appoint M/s ernst & Young, Chartered Accountants as Auditors of the Company and to
authorise the Directors to determine their remuneration.
5. to authorize the Directors to determine contributions to charities
6. to consider any other business of which due notice has been given
Dated this .............................................. day of ....................................... 2012
..........................................
signature of shareholder
notes: (i) Please delete the inappropriate words
(ii) A proxy need not be a member of the Company.
(iii) Instructions as to completion appear on the reverse of this form.
Form of Proxy
132 Richard Pieris and Company PLC | Annual Report 2011/2012
INSTRUCTIONS AS TO COMPLETION OF PROXY FORMto be valid, this Form of Proxy must be deposited at the
registered office of the Company no. 310, High Level Road,
nawinna, Maharagama., not later than 4.00 p.m. on Wednesday,
27th June 2012.
In perfecting the Form of Proxy, please ensure that all details are
legible.
In the case of a Company/Corporation, the proxy must be under
its Common seal, which should be affixed and attested in the
manner prescribed by its Articles of Association.
Please indicate with an ‘X’ in the space provided how your proxy
is to vote on each resolution. If no indication is given the proxy at
his/her discretion will vote as he/she thinks fit.
this Form of Proxy shall in the case of an individual be signed
by the appointor or his/her Attorney. Where the Form of Proxy is
signed under a Power of Attorney, which has not been registered
with the Company, the original Power of Attorney together with a
photocopy of same or a copy certified by a notary Public must
be lodged with the Company, along with the Form of Proxy.
Form of Proxy Contd.

For 80 years, Richard Pieris and Company has been touching the lives of Sri Lankans all over the island. We have made an indelible mark in the industry and together with a team that is focused on success, have taken our business to new heights. This year, as we celebrate a myriad of achievements, we look back on the illustrious years that have bought us to where we are today; a company that has stood the test of time, growing and adapting with time to become an unmistakable part of local lives. This is our legacy and our contribution to a budding economy, embodying the spirit and optimism of a growing nation while creating value for all.
TouChing LiveS
Produced by Copyline (Pvt) Ltd Printed by Gunaratne Offset Ltd

Richard Pieris & Company PLCAnnual Report 2011 / 2012
Touching Lives
Richard Pieris & Company PLC310, High Level Road, Nawinna, Maharagama, Sri Lanka.
www.arpico.com
Richard
Pieris &
Com
pany P
LC
| A
nnual Rep
ort 2011 / 2012