Torlon - solvay.com · The general molecular structure of Torlon ® PAI is shown in Figure 1 ....
48
SPECIALTY POLYMERS Torlon ® PAI Design Guide Torlon ®
Transcript of Torlon - solvay.com · The general molecular structure of Torlon ® PAI is shown in Figure 1 ....

SPECIALTYPOLYMERS
Torlon® PAIDesign Guide
Torlon®
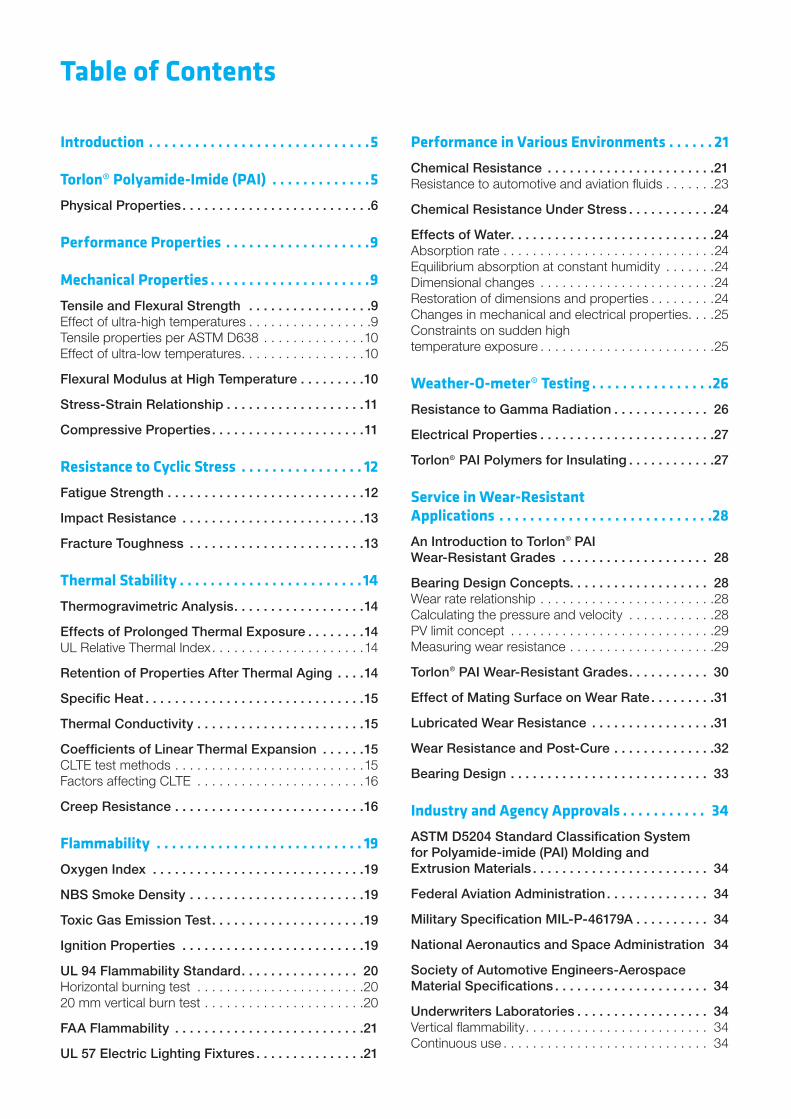
Table of Contents
Introduction . . . . . . . . . . . . . . . . . . . . . . . . . . . . .5
Torlon® Polyamide-Imide (PAI) . . . . . . . . . . . . .5Physical Properties . . . . . . . . . . . . . . . . . . . . . . . . . .6
Performance Properties . . . . . . . . . . . . . . . . . . .9
Mechanical Properties . . . . . . . . . . . . . . . . . . . . .9Tensile and Flexural Strength . . . . . . . . . . . . . . . . .9Effect of ultra-high temperatures . . . . . . . . . . . . . . . . .9Tensile properties per ASTM D638 . . . . . . . . . . . . . .10Effect of ultra-low temperatures . . . . . . . . . . . . . . . . .10
Flexural Modulus at High Temperature . . . . . . . . .10
Stress-Strain Relationship . . . . . . . . . . . . . . . . . . .11
Compressive Properties . . . . . . . . . . . . . . . . . . . . .11
Resistance to Cyclic Stress . . . . . . . . . . . . . . . . 12Fatigue Strength . . . . . . . . . . . . . . . . . . . . . . . . . . .12
Impact Resistance . . . . . . . . . . . . . . . . . . . . . . . . .13
Fracture Toughness . . . . . . . . . . . . . . . . . . . . . . . .13
Thermal Stability . . . . . . . . . . . . . . . . . . . . . . . .14Thermogravimetric Analysis . . . . . . . . . . . . . . . . . .14
Effects of Prolonged Thermal Exposure . . . . . . . .14UL Relative Thermal Index . . . . . . . . . . . . . . . . . . . . .14
Retention of Properties After Thermal Aging . . . .14
Specific Heat . . . . . . . . . . . . . . . . . . . . . . . . . . . . . .15
Thermal Conductivity . . . . . . . . . . . . . . . . . . . . . . .15
Coefficients of Linear Thermal Expansion . . . . . .15CLTE test methods . . . . . . . . . . . . . . . . . . . . . . . . . .15Factors affecting CLTE . . . . . . . . . . . . . . . . . . . . . . .16
Creep Resistance . . . . . . . . . . . . . . . . . . . . . . . . . .16
Flammability . . . . . . . . . . . . . . . . . . . . . . . . . . . 19Oxygen Index . . . . . . . . . . . . . . . . . . . . . . . . . . . . .19
NBS Smoke Density . . . . . . . . . . . . . . . . . . . . . . . .19
Toxic Gas Emission Test . . . . . . . . . . . . . . . . . . . . .19
Ignition Properties . . . . . . . . . . . . . . . . . . . . . . . . .19
UL 94 Flammability Standard . . . . . . . . . . . . . . . . 20Horizontal burning test . . . . . . . . . . . . . . . . . . . . . . .2020 mm vertical burn test . . . . . . . . . . . . . . . . . . . . . .20
FAA Flammability . . . . . . . . . . . . . . . . . . . . . . . . . .21
UL 57 Electric Lighting Fixtures . . . . . . . . . . . . . . .21
Performance in Various Environments . . . . . . 21Chemical Resistance . . . . . . . . . . . . . . . . . . . . . . .21Resistance to automotive and aviation fluids . . . . . . .23
Chemical Resistance Under Stress . . . . . . . . . . . .24
Effects of Water . . . . . . . . . . . . . . . . . . . . . . . . . . . .24Absorption rate . . . . . . . . . . . . . . . . . . . . . . . . . . . . .24Equilibrium absorption at constant humidity . . . . . . .24Dimensional changes . . . . . . . . . . . . . . . . . . . . . . . .24Restoration of dimensions and properties . . . . . . . . .24Changes in mechanical and electrical properties . . . .25Constraints on sudden high temperature exposure . . . . . . . . . . . . . . . . . . . . . . . .25
Weather-O-meter® Testing . . . . . . . . . . . . . . . .26Resistance to Gamma Radiation . . . . . . . . . . . . . 26
Electrical Properties . . . . . . . . . . . . . . . . . . . . . . . .27
Torlon® PAI Polymers for Insulating . . . . . . . . . . . .27
Service in Wear-Resistant Applications . . . . . . . . . . . . . . . . . . . . . . . . . . . .28An Introduction to Torlon® PAI Wear-Resistant Grades . . . . . . . . . . . . . . . . . . . . 28
Bearing Design Concepts . . . . . . . . . . . . . . . . . . . 28Wear rate relationship . . . . . . . . . . . . . . . . . . . . . . . .28Calculating the pressure and velocity . . . . . . . . . . . .28PV limit concept . . . . . . . . . . . . . . . . . . . . . . . . . . . .29Measuring wear resistance . . . . . . . . . . . . . . . . . . . .29
Torlon® PAI Wear-Resistant Grades . . . . . . . . . . . 30
Effect of Mating Surface on Wear Rate . . . . . . . . .31
Lubricated Wear Resistance . . . . . . . . . . . . . . . . .31
Wear Resistance and Post-Cure . . . . . . . . . . . . . .32
Bearing Design . . . . . . . . . . . . . . . . . . . . . . . . . . . 33
Industry and Agency Approvals . . . . . . . . . . . 34ASTM D5204 Standard Classification System for Polyamide-imide (PAI) Molding and Extrusion Materials . . . . . . . . . . . . . . . . . . . . . . . . 34
Federal Aviation Administration . . . . . . . . . . . . . . 34
Military Specification MIL-P-46179A . . . . . . . . . . 34
National Aeronautics and Space Administration 34
Society of Automotive Engineers-Aerospace Material Specifications . . . . . . . . . . . . . . . . . . . . . 34
Underwriters Laboratories . . . . . . . . . . . . . . . . . . 34Vertical flammability . . . . . . . . . . . . . . . . . . . . . . . . . 34Continuous use . . . . . . . . . . . . . . . . . . . . . . . . . . . . 34
Torlon® PAI Design Guide / 3
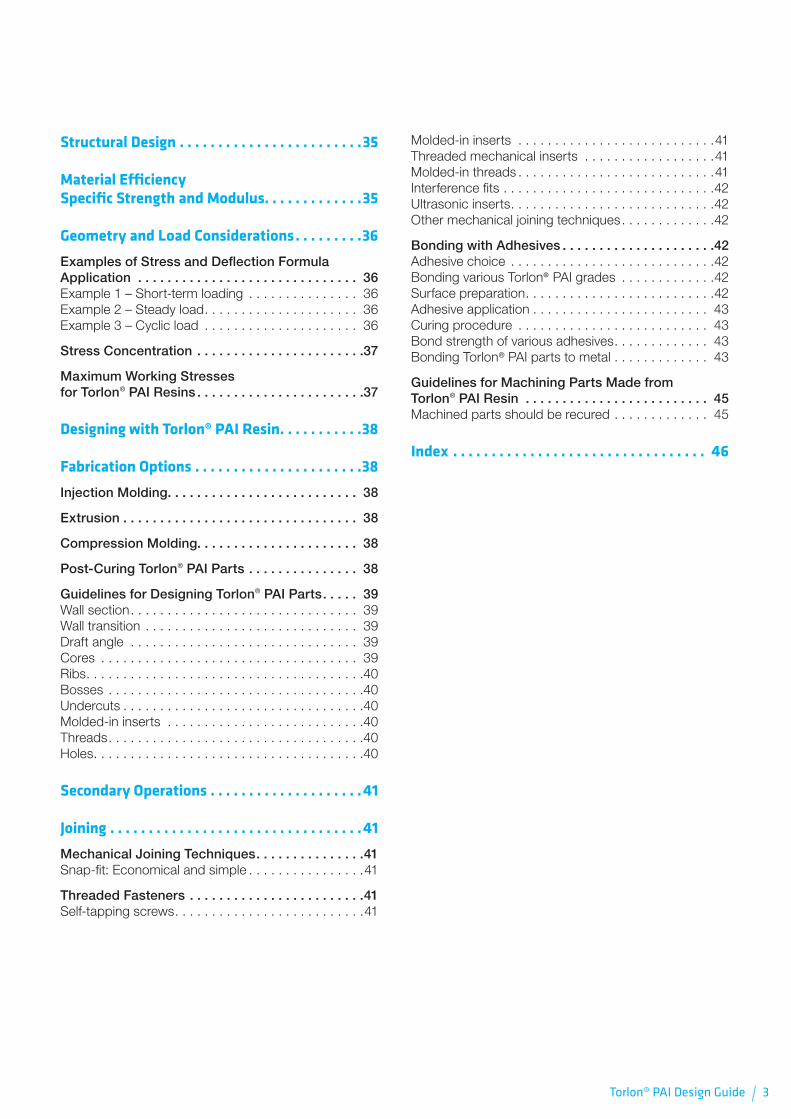
Structural Design . . . . . . . . . . . . . . . . . . . . . . . .35
Material Efficiency Specific Strength and Modulus . . . . . . . . . . . . .35
Geometry and Load Considerations . . . . . . . . .36Examples of Stress and Deflection Formula Application . . . . . . . . . . . . . . . . . . . . . . . . . . . . . . 36Example 1 – Short-term loading . . . . . . . . . . . . . . . 36Example 2 – Steady load . . . . . . . . . . . . . . . . . . . . . 36Example 3 – Cyclic load . . . . . . . . . . . . . . . . . . . . . 36
Stress Concentration . . . . . . . . . . . . . . . . . . . . . . .37
Maximum Working Stresses for Torlon® PAI Resins . . . . . . . . . . . . . . . . . . . . . . .37
Designing with Torlon® PAI Resin . . . . . . . . . . .38
Fabrication Options . . . . . . . . . . . . . . . . . . . . . .38Injection Molding . . . . . . . . . . . . . . . . . . . . . . . . . . 38
Extrusion . . . . . . . . . . . . . . . . . . . . . . . . . . . . . . . . 38
Compression Molding . . . . . . . . . . . . . . . . . . . . . . 38
Post-Curing Torlon® PAI Parts . . . . . . . . . . . . . . . 38
Guidelines for Designing Torlon® PAI Parts . . . . . 39Wall section . . . . . . . . . . . . . . . . . . . . . . . . . . . . . . . 39Wall transition . . . . . . . . . . . . . . . . . . . . . . . . . . . . . 39Draft angle . . . . . . . . . . . . . . . . . . . . . . . . . . . . . . . 39Cores . . . . . . . . . . . . . . . . . . . . . . . . . . . . . . . . . . . 39Ribs . . . . . . . . . . . . . . . . . . . . . . . . . . . . . . . . . . . . . .40Bosses . . . . . . . . . . . . . . . . . . . . . . . . . . . . . . . . . . .40Undercuts . . . . . . . . . . . . . . . . . . . . . . . . . . . . . . . . .40Molded-in inserts . . . . . . . . . . . . . . . . . . . . . . . . . . .40Threads . . . . . . . . . . . . . . . . . . . . . . . . . . . . . . . . . . .40Holes . . . . . . . . . . . . . . . . . . . . . . . . . . . . . . . . . . . . .40
Secondary Operations . . . . . . . . . . . . . . . . . . . .41
Joining . . . . . . . . . . . . . . . . . . . . . . . . . . . . . . . . .41Mechanical Joining Techniques . . . . . . . . . . . . . . .41Snap-fit: Economical and simple . . . . . . . . . . . . . . . .41
Threaded Fasteners . . . . . . . . . . . . . . . . . . . . . . . .41Self-tapping screws . . . . . . . . . . . . . . . . . . . . . . . . . .41
Molded-in inserts . . . . . . . . . . . . . . . . . . . . . . . . . . .41Threaded mechanical inserts . . . . . . . . . . . . . . . . . .41Molded-in threads . . . . . . . . . . . . . . . . . . . . . . . . . . .41Interference fits . . . . . . . . . . . . . . . . . . . . . . . . . . . . .42Ultrasonic inserts . . . . . . . . . . . . . . . . . . . . . . . . . . . .42Other mechanical joining techniques . . . . . . . . . . . . .42
Bonding with Adhesives . . . . . . . . . . . . . . . . . . . . .42Adhesive choice . . . . . . . . . . . . . . . . . . . . . . . . . . . .42Bonding various Torlon® PAI grades . . . . . . . . . . . . .42Surface preparation . . . . . . . . . . . . . . . . . . . . . . . . . .42Adhesive application . . . . . . . . . . . . . . . . . . . . . . . . 43Curing procedure . . . . . . . . . . . . . . . . . . . . . . . . . . 43Bond strength of various adhesives . . . . . . . . . . . . . 43Bonding Torlon® PAI parts to metal . . . . . . . . . . . . . 43
Guidelines for Machining Parts Made from Torlon® PAI Resin . . . . . . . . . . . . . . . . . . . . . . . . . 45Machined parts should be recured . . . . . . . . . . . . . 45
Index . . . . . . . . . . . . . . . . . . . . . . . . . . . . . . . . . 46

4 \ Torlon® PAI Design Guide
Torlon® PAI Design Guide / 5
Introduction
Torlon® Polyamide-Imide (PAI)For reliable performance at extremely high temperature and stress, use Torlon® PAI polymers . Parts made of Torlon® PAI polymers perform under conditions generally considered too severe for thermoplastics . That’s why parts for the space shuttle, automotive transmissions, and many other critical components have been molded from Torlon® PAI polymers . Torlon® PAI parts meet design challenges across a wide range of industries, including electrical and electronics, business equipment, aerospace, transportation, process, and heavy equipment .
Torlon® PAI polymers has the highest strength and stiffness of any thermoplastic up to 260 °C (500 °F) . Unlike many other high-temperature polymers, it offers the added advantage of being injection moldable . That means exact replication and low unit cost, making Torlon® PAI polymers the cost-effective solution to difficult design problems .
This manual introduces the reader to the Torlon® PAI polymer family . Numerous graphs and tables present the physical properties and load-bearing capabilities of Torlon® PAI polymers . A discussion of design guidelines and secondary operations focuses on the practical aspects of fabricating high-performance Torlon® PAI parts . Using this manual, the designer can relate the characteristics of these exceptional resins to his own specific needs .
The general molecular structure of Torlon® PAI is shown in Figure 1 .
Figure 1: Structure of polyamide-imide
O
O
N
N
HAr
O
The variety of applications requiring high-temperature resistance, high strength, and the economies of injection molding has led to the commercialization of several Torlon® PAI grades, each designed to maximize specific properties . These materials can be divided into two categories: high-strength grades and wear-resistant grades . We can also compound Torlon® PAI polymers to meet your specifications . For advice concerning your application, please contact your Solvay representative .
The high-strength grades perform more like metals at elevated temperature, even under considerable stress . These grades are ideally suited for repetitively-used, high-precision mechanical and load-bearing parts .
The inherent lubricity of Torlon® PAI is enhanced with additives in the wear-resistant grades . Moving parts made of Torlon® PAI polymers provide dependable service in lubricated and non-lubricated environments .
Table 1: Torlon® PAI polymers
High Strength Wear Resistant (1)
4203L(2) 4301
5030 4275
7130 4630
4435
4645(1) Products listed in order of increasing wear resistance(2) 4203 has equivalent properties to 4203L
Torlon® PAI polymers off a unique combination of properties:
• Performance from cryogenic to 260 °C (500 °F)
• Outstanding mechanical strength
• Easy fabrication
• Low flammability and smoke generation
• Fatigue strength
• Impact strength
• Creep resistance
• Wear resistance
• Low expansion coefficients
• Excellent thermal stability
• Resistance to aviation and automotive fluids
6 \ Torlon® PAI Design Guide
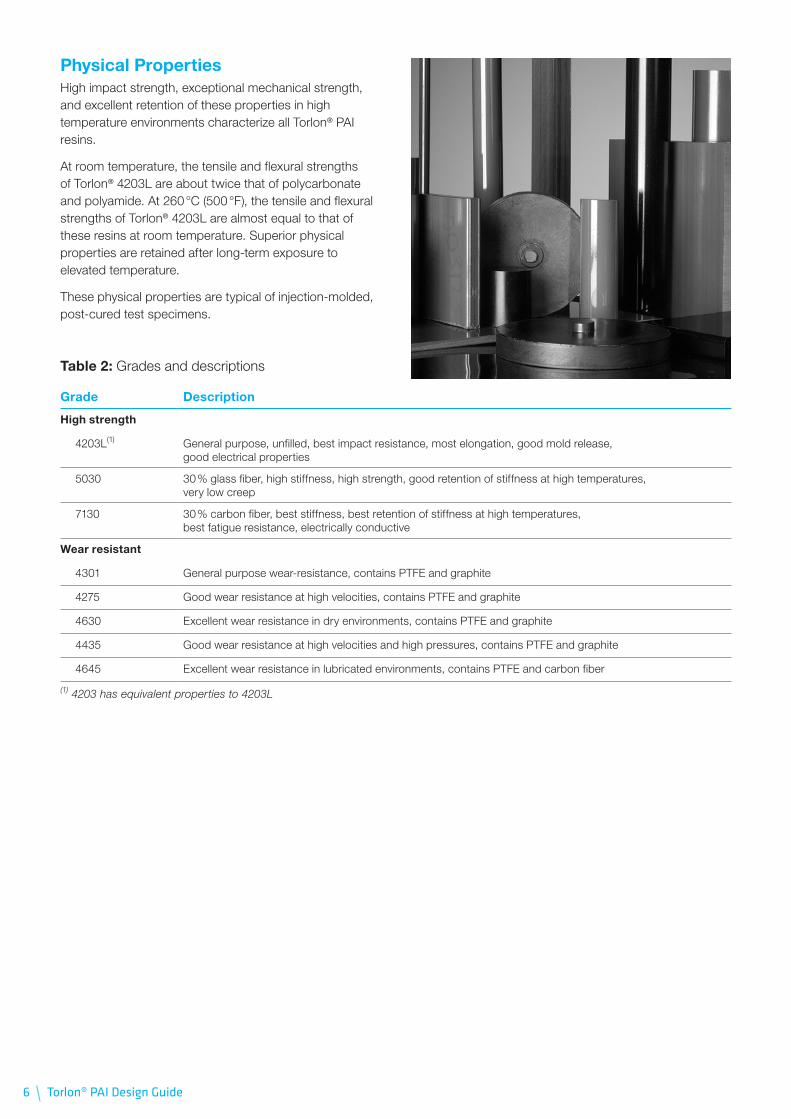
Physical PropertiesHigh impact strength, exceptional mechanical strength, and excellent retention of these properties in high temperature environments characterize all Torlon® PAI resins .
At room temperature, the tensile and flexural strengths of Torlon® 4203L are about twice that of polycarbonate and polyamide . At 260 °C (500 °F), the tensile and flexural strengths of Torlon® 4203L are almost equal to that of these resins at room temperature . Superior physical properties are retained after long-term exposure to elevated temperature .
These physical properties are typical of injection-molded, post-cured test specimens .
Table 2: Grades and descriptions
Grade Description
High strength
4203L(1) General purpose, unfilled, best impact resistance, most elongation, good mold release, good electrical properties
5030 30 % glass fiber, high stiffness, high strength, good retention of stiffness at high temperatures, very low creep
7130 30 % carbon fiber, best stiffness, best retention of stiffness at high temperatures, best fatigue resistance, electrically conductive
Wear resistant
4301 General purpose wear-resistance, contains PTFE and graphite
4275 Good wear resistance at high velocities, contains PTFE and graphite
4630 Excellent wear resistance in dry environments, contains PTFE and graphite
4435 Good wear resistance at high velocities and high pressures, contains PTFE and graphite
4645 Excellent wear resistance in lubricated environments, contains PTFE and carbon fiber
(1) 4203 has equivalent properties to 4203L

Torlon® PAI Design Guide / 7
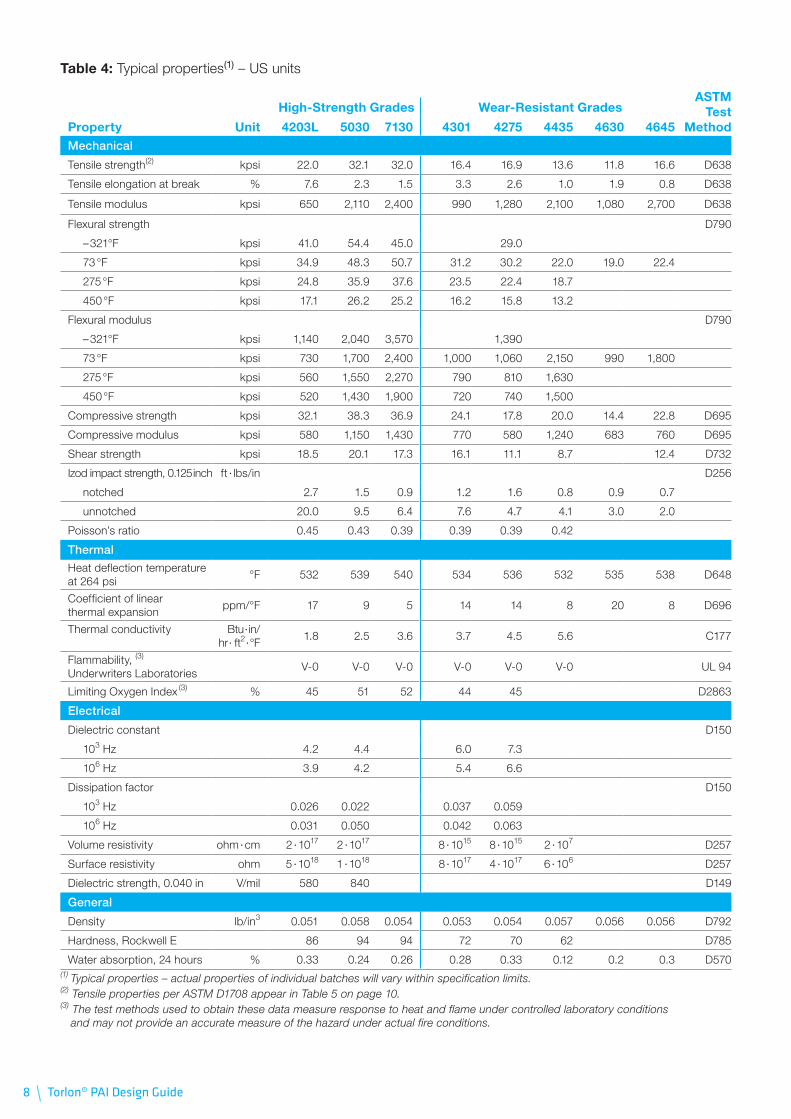
Table 3: Typical properties(1) – SI units
ASTM Test
Method
High-Strength Grades Wear-Resistant Grades
Property Unit 4203L 5030 7130 4301 4275 4435 4630 4645Mechanical
Tensile strength(2) MPa 152 221 221 113 117 94 81 .4 114 D638
Tensile elongation at break % 7 .6 2 .3 1 .5 3 .3 2 .6 1 .0 1 .9 0 .8 D638
Tensile modulus GPa 4 .5 14 .6 16 .5 6 .8 8 .8 14 .5 7 .45 18 .6 D638
Flexural strength D790
– 196 °C MPa 282 374 310 200
23 °C MPa 244 338 355 219 212 152 131 154
135 °C MPa 174 251 263 165 157 129
232 °C MPa 120 184 177 113 111 91
Flexural modulus D790
– 196 °C GPa 7 .9 14 .1 24 .6 9 .6
23 °C GPa 5 .0 11 .7 19 .9 6 .9 7 .3 14 .8 6 .8 12 .4
135 °C GPa 3 .9 10 .7 15 .6 5 .5 5 .6 11 .2
232 °C GPa 3 .6 9 .9 13 .1 4 .5 5 .1 10 .3
Compressive strength MPa 220 260 250 170 120 138 99 157 D695
Compressive modulus GPa 4 .0 7 .9 9 .9 5 .3 4 .0 8 .5 4 .7 5 .2 D695
Shear strength MPa 128 140 120 112 77 60 85 D732
Izod impact strength, 3 .2 mm J/m D256
notched 142 79 47 63 84 43 48 37
unnotched 1,062 504 340 404 250 219 160 107
Poisson’s ratio 0 .45 0 .43 0 .39 0 .39 0 .39 0 .42
Thermal
Heat deflection temperature at 1 .82 MPa
°C 278 282 282 279 280 278 279 281 D648
Coefficient of linear thermal expansion
ppm/°C 30 .6 16 .2 9 .0 25 .2 25 .2 14 .4 11 .5 14 .4 D696
Thermal conductivity W/mK 0 .26 0 .37 0 .53 0 .54 0 .65 0 .80 C177
Flammability, (3) Underwriters Laboratories
V-0 V-0 V-0 V-0 V-0 V-0 UL 94
Limiting Oxygen Index (3) % 45 51 52 44 45 D2863
Electrical
Dielectric constant D150
103 Hz 4 .2 4 .4 6 .0 7 .3
106 Hz 3 .9 4 .2 5 .4 6 .6
Dissipation factor D150
103 Hz 0 .026 0 .022 0 .037 0 .059
106 Hz 0 .031 0 .050 0 .042 0 .063
Volume resistivity ohm · cm 2 · 1017 2 · 1017 8 · 1015 8 · 1015 2 · 107 D257
Surface resistivity ohm 5 · 1018 1 · 1018 8 · 1017 4 · 1017 6 · 106 D257
Dielectric strength, 1 mm kV/mm 23 .6 32 .6 D149
General
Density g/cm3 1 .42 1 .61 1 .48 1 .46 1 .51 1 .59 1 .56 1 .56 D792
Hardness, Rockwell E 86 94 94 72 70 62 D785
Water absorption, 24 hours % 0 .33 0 .24 0 .26 0 .28 0 .33 0 .12 0 .2 0 .3 D570(1) Typical properties – actual properties of individual batches will vary within specification limits.(2) Tensile properties per ASTM D1708 appear in Table 5 on page 10.(3) The test methods used to obtain these data measure response to heat and flame under controlled laboratory conditions and may not provide an accurate measure of the hazard under actual fire conditions.
8 \ Torlon® PAI Design Guide
Table 4: Typical properties(1) – US units
ASTM Test
Method
High-Strength Grades Wear-Resistant Grades
Property Unit 4203L 5030 7130 4301 4275 4435 4630 4645Mechanical
Tensile strength(2) kpsi 22 .0 32 .1 32 .0 16 .4 16 .9 13 .6 11 .8 16 .6 D638
Tensile elongation at break % 7 .6 2 .3 1 .5 3 .3 2 .6 1 .0 1 .9 0 .8 D638
Tensile modulus kpsi 650 2,110 2,400 990 1,280 2,100 1,080 2,700 D638
Flexural strength D790
– 321°F kpsi 41 .0 54 .4 45 .0 29 .0
73 °F kpsi 34 .9 48 .3 50 .7 31 .2 30 .2 22 .0 19 .0 22 .4
275 °F kpsi 24 .8 35 .9 37 .6 23 .5 22 .4 18 .7
450 °F kpsi 17 .1 26 .2 25 .2 16 .2 15 .8 13 .2
Flexural modulus D790
– 321°F kpsi 1,140 2,040 3,570 1,390
73 °F kpsi 730 1,700 2,400 1,000 1,060 2,150 990 1,800
275 °F kpsi 560 1,550 2,270 790 810 1,630
450 °F kpsi 520 1,430 1,900 720 740 1,500
Compressive strength kpsi 32 .1 38 .3 36 .9 24 .1 17 .8 20 .0 14 .4 22 .8 D695
Compressive modulus kpsi 580 1,150 1,430 770 580 1,240 683 760 D695
Shear strength kpsi 18 .5 20 .1 17 .3 16 .1 11 .1 8 .7 12 .4 D732
Izod impact strength, 0 .125 inch ft · lbs/in D256
notched 2 .7 1 .5 0 .9 1 .2 1 .6 0 .8 0 .9 0 .7
unnotched 20 .0 9 .5 6 .4 7 .6 4 .7 4 .1 3 .0 2 .0
Poisson’s ratio 0 .45 0 .43 0 .39 0 .39 0 .39 0 .42
Thermal
Heat deflection temperature at 264 psi
°F 532 539 540 534 536 532 535 538 D648
Coefficient of linear thermal expansion
ppm/°F 17 9 5 14 14 8 20 8 D696
Thermal conductivity Btu · in/hr · ft2 · °F
1 .8 2 .5 3 .6 3 .7 4 .5 5 .6 C177
Flammability, (3) Underwriters Laboratories
V-0 V-0 V-0 V-0 V-0 V-0 UL 94
Limiting Oxygen Index (3) % 45 51 52 44 45 D2863
Electrical
Dielectric constant D150
103 Hz 4 .2 4 .4 6 .0 7 .3
106 Hz 3 .9 4 .2 5 .4 6 .6
Dissipation factor D150
103 Hz 0 .026 0 .022 0 .037 0 .059
106 Hz 0 .031 0 .050 0 .042 0 .063
Volume resistivity ohm · cm 2 · 1017 2 · 1017 8 · 1015 8 · 1015 2 · 107 D257
Surface resistivity ohm 5 · 1018 1 · 1018 8 · 1017 4 · 1017 6 · 106 D257
Dielectric strength, 0 .040 in V/mil 580 840 D149
General
Density lb/in3 0 .051 0 .058 0 .054 0 .053 0 .054 0 .057 0 .056 0 .056 D792
Hardness, Rockwell E 86 94 94 72 70 62 D785
Water absorption, 24 hours % 0 .33 0 .24 0 .26 0 .28 0 .33 0 .12 0 .2 0 .3 D570(1) Typical properties – actual properties of individual batches will vary within specification limits.(2) Tensile properties per ASTM D1708 appear in Table 5 on page 10.(3) The test methods used to obtain these data measure response to heat and flame under controlled laboratory conditions and may not provide an accurate measure of the hazard under actual fire conditions.
Torlon® PAI Design Guide / 9
Performance Properties
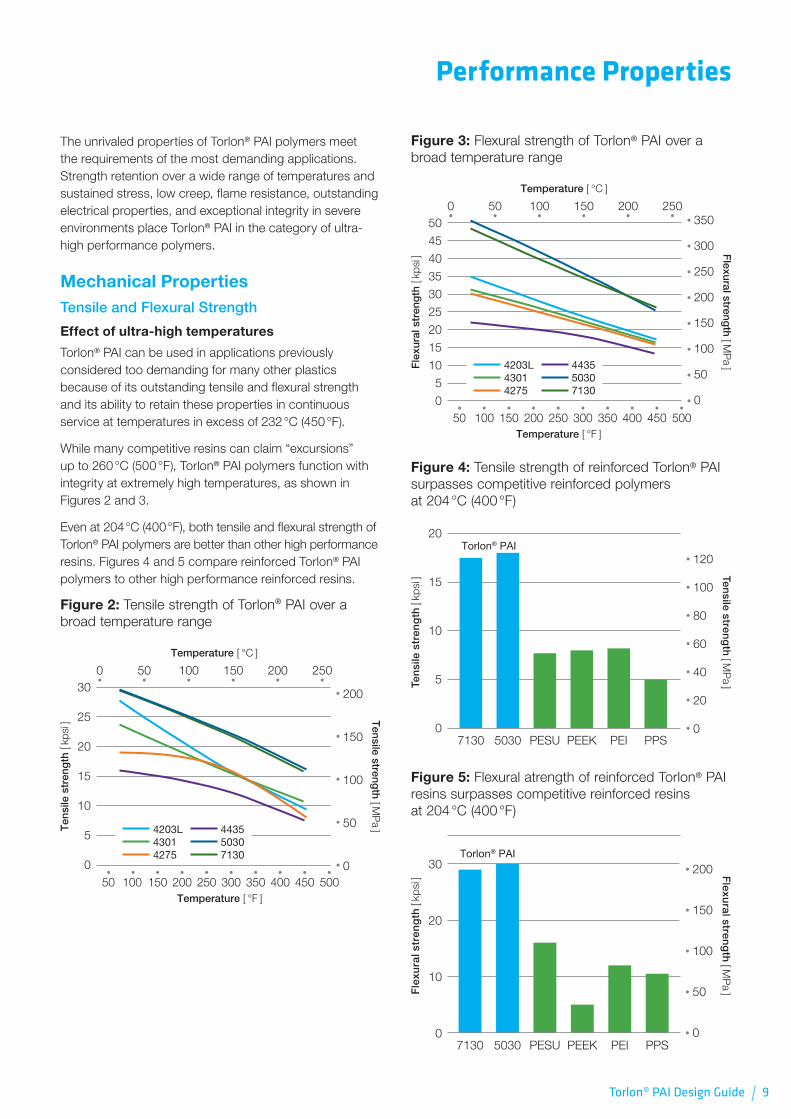
The unrivaled properties of Torlon® PAI polymers meet the requirements of the most demanding applications . Strength retention over a wide range of temperatures and sustained stress, low creep, flame resistance, outstanding electrical properties, and exceptional integrity in severe environments place Torlon® PAI in the category of ultra-high performance polymers .
Mechanical PropertiesTensile and Flexural Strength
Effect of ultra-high temperatures
Torlon® PAI can be used in applications previously considered too demanding for many other plastics because of its outstanding tensile and flexural strength and its ability to retain these properties in continuous service at temperatures in excess of 232 °C (450 °F) .
While many competitive resins can claim “excursions” up to 260 °C (500 °F), Torlon® PAI polymers function with integrity at extremely high temperatures, as shown in Figures 2 and 3 .
Even at 204 °C (400 °F), both tensile and flexural strength of Torlon® PAI polymers are better than other high performance resins . Figures 4 and 5 compare reinforced Torlon® PAI polymers to other high performance reinforced resins .
Figure 2: Tensile strength of Torlon® PAI over a broad temperature range
Ten
sile
str
eng
th [
kpsi
] Tensile streng
th [ MP
a ]
30
25
20
15
10
5
0
200
150
100
50
0
Temperature [ °F ]
Temperature [ °C ]
500150 200 250 300 350 400 45010050
0 50 100 150 200 250
4203L43014275
443550307130
Figure 3: Flexural strength of Torlon® PAI over a broad temperature range
Fle
xura
l str
eng
th [
kpsi
] Flexural streng
th [ MP
a ]
50
45
40
35
30
25
20
15
10
5
0
350
300
250
200
150
100
50
0
Temperature [ °F ]
Temperature [ °C ]
500150 200 250 300 350 400 45010050
0 50 100 150 200 250
4203L43014275
443550307130
Figure 4: Tensile strength of reinforced Torlon® PAI surpasses competitive reinforced polymers at 204 °C (400 °F)
20
15
10
5
0
120
100
80
60
40
20
0
Ten
sile
str
eng
th [
kpsi
] Tensile stren
gth
[ MP
a ]
7130 5030 PEIPEEKPESU PPS
Torlon® PAI
Figure 5: Flexural atrength of reinforced Torlon® PAI resins surpasses competitive reinforced resins at 204 °C (400 °F)
30
20
10
0
200
150
100
50
0
Fle
xura
l str
eng
th [
kpsi
] Flexu
ral streng
th [ M
Pa ]
7130 5030 PEIPEEKPESU PPS
Torlon® PAI
10 \ Torlon® PAI Design Guide
Tensile properties per ASTM D638
Tensile properties reported in the preceding section were obtained in accordance with ASTM D638 . Since tensile properties are frequently measured using ASTM D1708, Torlon® PAI polymers were also tested in accordance with this method . The data appears in Table 5 .
Effect of ultra-low temperatures
At the other end of the temperature spectrum, Torlon® PAI polymers do not become brittle as do other resins . Table 6 shows Torlon® PAI resins have excellent properties under cryogenic conditions .
Table 5: Tensile properties per ASTM D1708
Grade
Property Unit 4203L 4301 4275 4435 5030 7130
Tensile strength
23 °C 73 °F
MPa kpsi
192 27 .8
164 23 .7
131 19 .0
110 16 .0
205 29 .7
203 29 .4
135 °C 275 °F
MPa kpsi
117 16 .9
113 16 .3
116 16 .9
90 13 .0
160 23 .1
158 22 .8
232 °C 450 °F
MPa kpsi
66 9 .5
73 10 .6
56 8 .1
52 7 .5
113 16 .3
108 15 .7
Tensile elongation at break
23 °C 73 °F
% 15 7 7 6 7 6
135 °C 275 °F
% 21 20 15 4 15 14
232 °C 450 °F
% 22 17 17 3 12 11
Tensile modulus
23 °C 73 °F
GPa kpsi
4 .5 700
6 .8 950
8 .8 1,130
14 .5 1,410
14 .6 1,560
16 .5 3,220
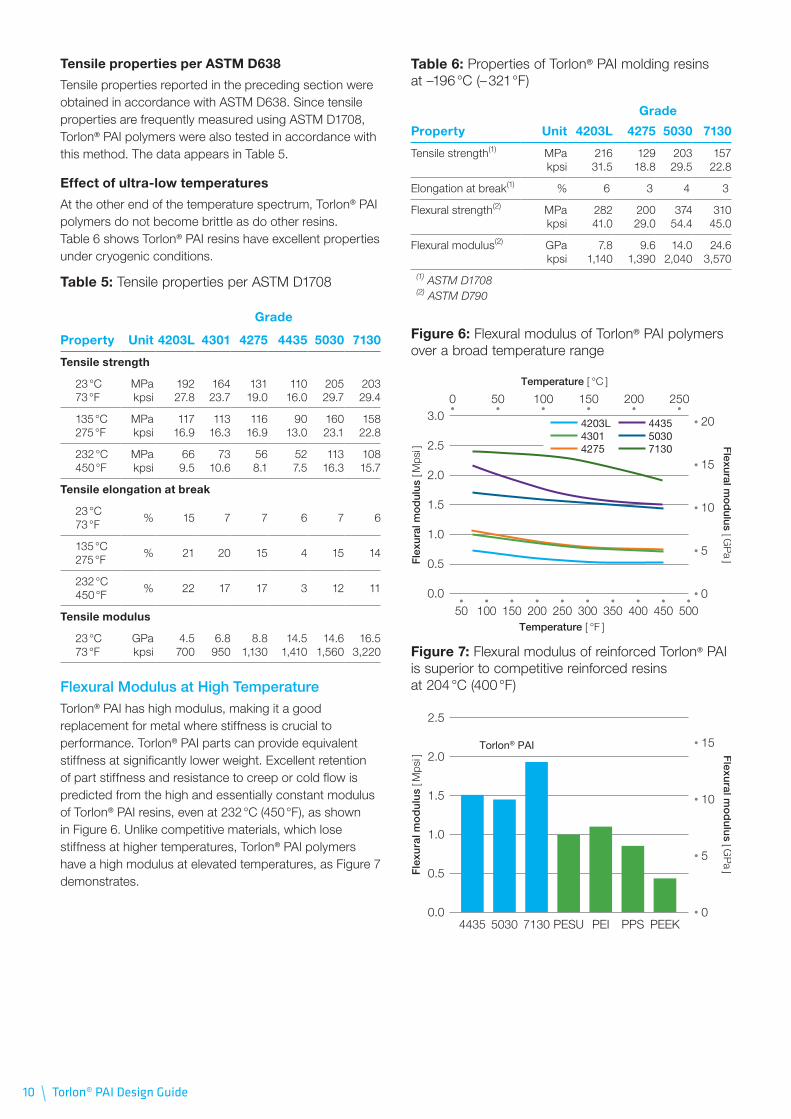
Flexural Modulus at High TemperatureTorlon® PAI has high modulus, making it a good replacement for metal where stiffness is crucial to performance . Torlon® PAI parts can provide equivalent stiffness at significantly lower weight . Excellent retention of part stiffness and resistance to creep or cold flow is predicted from the high and essentially constant modulus of Torlon® PAI resins, even at 232 °C (450 °F), as shown in Figure 6 . Unlike competitive materials, which lose stiffness at higher temperatures, Torlon® PAI polymers have a high modulus at elevated temperatures, as Figure 7 demonstrates .
Table 6: Properties of Torlon® PAI molding resins at –196 °C (– 321 °F)
Grade
Property Unit 4203L 4275 5030 7130
Tensile strength(1) MPa kpsi
216 31 .5
129 (((18 .8
203 29 .5
157 22 .8
Elongation at break(1) % 6) 3) 4) 3)
Flexural strength(2) MPa kpsi
282 41 .0
200 29 .0
374 54 .4
310 45 .0
Flexural modulus(2) GPa kpsi
7 .8 1,140
9 .6 1,390
14 .0 2,040
24 .6 3,570
(1) ASTM D1708(2) ASTM D790
Figure 6: Flexural modulus of Torlon® PAI polymers over a broad temperature range
Fle
xura
l mo
dul
us [
Mps
i ] Flexural m
od
ulus [ GP
a ]
3.0
2.5
2.0
1.5
1.0
0.5
0.0
20
15
10
5
0
Temperature [ °F ]
Temperature [ °C ]
500150 200 250 300 350 400 45010050
0 50 100 150 200 250
4203L43014275
443550307130
Figure 7: Flexural modulus of reinforced Torlon® PAI is superior to competitive reinforced resins at 204 °C (400 °F)
2.5
2.0
1.5
1.0
0.5
0.0
15
10
5
0
Fle
xura
l mo
du
lus
[ Mps
i ] Flexu
ral mo
du
lus [ G
Pa ]
4435 71305030 PEI PEEKPESU PPS
Torlon® PAI
Torlon® PAI Design Guide / 11
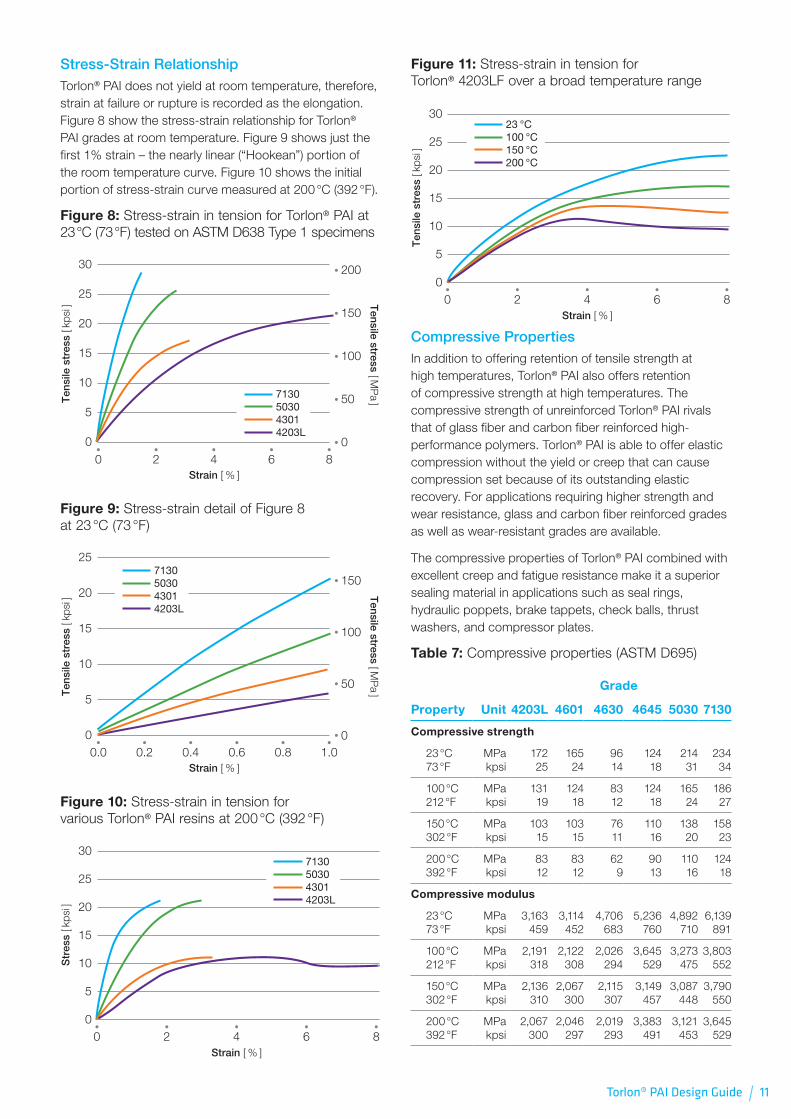
Stress-Strain RelationshipTorlon® PAI does not yield at room temperature, therefore, strain at failure or rupture is recorded as the elongation . Figure 8 show the stress-strain relationship for Torlon® PAI grades at room temperature . Figure 9 shows just the first 1 % strain – the nearly linear (“Hookean”) portion of the room temperature curve . Figure 10 shows the initial portion of stress-strain curve measured at 200 °C (392 °F) .
Figure 8: Stress-strain in tension for Torlon® PAI at 23 °C (73 °F) tested on ASTM D638 Type 1 specimens
200
150
100
50
0
30
25
20
15
10
5
0
Ten
sile
str
ess
[ kps
i ]
Tensile stress [ M
Pa ]
Strain [ % ]862 40
7130503043014203L
Figure 9: Stress-strain detail of Figure 8 at 23 °C (73 °F)
25
20
15
10
5
0
150
100
50
0
Ten
sile
str
ess
[ kps
i ]
Tensile stress [ M
Pa ]
Strain [ % ]1.00.80.60.2 0.40.0
7130503043014203L
Figure 10: Stress-strain in tension for various Torlon® PAI resins at 200 °C (392 °F)
Str
ess
[ kps
i ]
30
25
20
15
10
5
00 2 4 6 8
7130503043014203L
Strain [ % ]
Figure 11: Stress-strain in tension for Torlon® 4203LF over a broad temperature range
Ten
sile
str
ess
[ kps
i ]
30
25
20
15
10
5
00 2 4 6 8
Strain [ % ]
23 °C100 °C150 °C200 °C
Compressive PropertiesIn addition to offering retention of tensile strength at high temperatures, Torlon® PAI also offers retention of compressive strength at high temperatures . The compressive strength of unreinforced Torlon® PAI rivals that of glass fiber and carbon fiber reinforced high-performance polymers . Torlon® PAI is able to offer elastic compression without the yield or creep that can cause compression set because of its outstanding elastic recovery . For applications requiring higher strength and wear resistance, glass and carbon fiber reinforced grades as well as wear-resistant grades are available .
The compressive properties of Torlon® PAI combined with excellent creep and fatigue resistance make it a superior sealing material in applications such as seal rings, hydraulic poppets, brake tappets, check balls, thrust washers, and compressor plates .
Table 7: Compressive properties (ASTM D695)
Grade
Property Unit 4203L 4601 4630 4645 5030 7130
Compressive strength
23 °C 73 °F
MPa kpsi
172 25
165 24
96 14
124 18
214 31
234 34
100 °C 212 °F
MPa kpsi
131 19
124 18
83 12
124 18
165 24
186 27
150 °C 302 °F
MPa kpsi
103 15
103 15
76 11
110 16
138 20
158 23
200 °C 392 °F
MPa kpsi
83 12
83 12
62 9
90 13
110 16
124 18
Compressive modulus
23 °C 73 °F
MPa kpsi
3,163 459
3,114 452
4,706 683
5,236 760
4,892 710
6,139 891
100 °C 212 °F
MPa kpsi
2,191 318
2,122 308
2,026 294
3,645 529
3,273 475
3,803 552
150 °C 302 °F
MPa kpsi
2,136 310
2,067 300
2,115 307
3,149 457
3,087 448
3,790 550
200 °C 392 °F
MPa kpsi
2,067 300
2,046 297
2,019 293
3,383 491
3,121 453
3,645 529
12 \ Torlon® PAI Design Guide
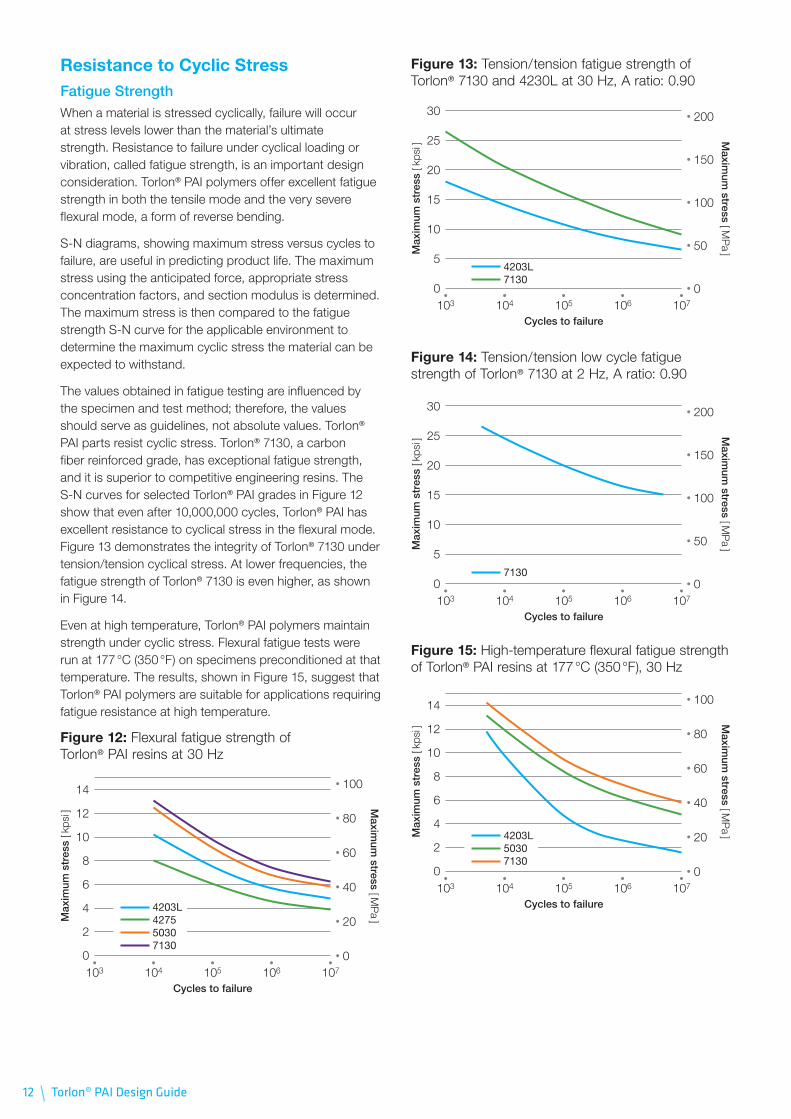
Resistance to Cyclic StressFatigue StrengthWhen a material is stressed cyclically, failure will occur at stress levels lower than the material’s ultimate strength . Resistance to failure under cyclical loading or vibration, called fatigue strength, is an important design consideration . Torlon® PAI polymers offer excellent fatigue strength in both the tensile mode and the very severe flexural mode, a form of reverse bending .
S-N diagrams, showing maximum stress versus cycles to failure, are useful in predicting product life . The maximum stress using the anticipated force, appropriate stress concentration factors, and section modulus is determined . The maximum stress is then compared to the fatigue strength S-N curve for the applicable environment to determine the maximum cyclic stress the material can be expected to withstand .
The values obtained in fatigue testing are influenced by the specimen and test method; therefore, the values should serve as guidelines, not absolute values . Torlon® PAI parts resist cyclic stress . Torlon® 7130, a carbon fiber reinforced grade, has exceptional fatigue strength, and it is superior to competitive engineering resins . The S-N curves for selected Torlon® PAI grades in Figure 12 show that even after 10,000,000 cycles, Torlon® PAI has excellent resistance to cyclical stress in the flexural mode . Figure 13 demonstrates the integrity of Torlon® 7130 under tension/tension cyclical stress . At lower frequencies, the fatigue strength of Torlon® 7130 is even higher, as shown in Figure 14 .
Even at high temperature, Torlon® PAI polymers maintain strength under cyclic stress . Flexural fatigue tests were run at 177 °C (350 °F) on specimens preconditioned at that temperature . The results, shown in Figure 15, suggest that Torlon® PAI polymers are suitable for applications requiring fatigue resistance at high temperature .
Figure 12: Flexural fatigue strength of Torlon® PAI resins at 30 Hz
Max
imum
str
ess
[ kps
i ]
Maxim
um stress [ M
Pa ]
14
12
10
8
6
4
2
0
100
80
60
40
20
0
Cycles to failure107106105104103
4203L427550307130
Figure 13: Tension/tension fatigue strength of Torlon® 7130 and 4230L at 30 Hz, A ratio: 0 .90
Max
imum
str
ess
[ kps
i ]
Maxim
um stress [ M
Pa ]
30
25
20
15
10
5
0
200
150
100
50
0
Cycles to failure107106105104103
4203L7130
Figure 14: Tension/tension low cycle fatigue strength of Torlon® 7130 at 2 Hz, A ratio: 0 .90
Max
imum
str
ess
[ kps
i ]
Maxim
um stress [ M
Pa ]
30
25
20
15
10
5
0
200
150
100
50
0
Cycles to failure107106105104103
7130
Figure 15: High-temperature flexural fatigue strength of Torlon® PAI resins at 177 °C (350 °F), 30 Hz
Max
imum
str
ess
[ kps
i ]
Maxim
um stress [ M
Pa ]
14
12
10
8
6
4
2
0
100
80
60
40
20
0
Cycles to failure107106105104103
4203L50307130
Torlon® PAI Design Guide / 13
Table 8: Izod impact resistance of 3 .2 mm (0 .125 inch) bars of Torlon® PAI resins
Notched Unnotched
Grade J/m ft · lb/inch J/m ft · lb/inch
4203L 142 2 .7 1,062 20 .0
4301 63 1 .2 404 7 .6
4275 84 1 .6 250 4 .7
4435 42 0 .8 220 4 .1
5030 79 1 .5 504 9 .5
7130 47 0 .9 340 6 .4
Figure 16: Izod impact resistance of Torlon® PAI resins vs . competitive materials
3
2
1
0
150
100
50
0
No
tch
ed iz
od
[ ft
·lbs/
in ] N
otch
ed izo
d [ J/m
]
4203L 71305030 PPS PEEKPI PEI
Torlon® PAI
Impact ResistanceTorlon® PAI resins absorb impact energy better than most high-modulus plastics . In tests using the notched Izod method (ASTM D256), Torlon® PAI resins outperformed other high-temperature resins (Figure 16) . Table 8 summarizes both notched and unnotched impact data for Torlon® PAI resins .
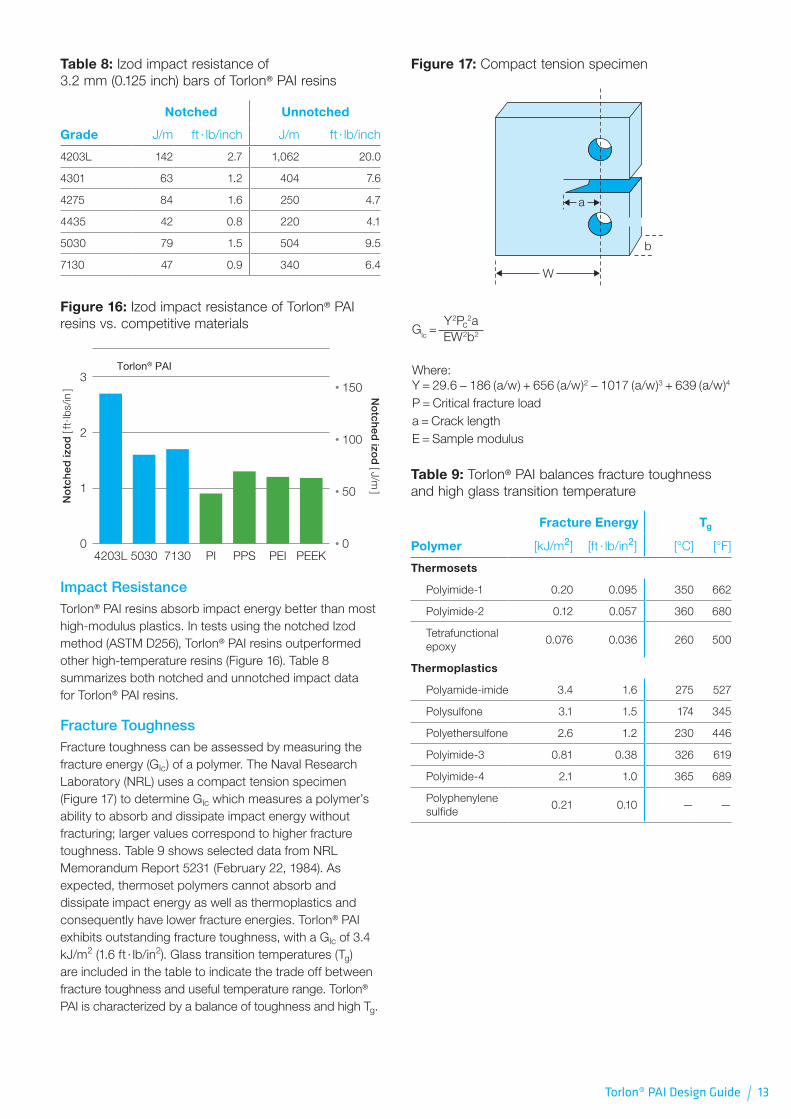
Fracture ToughnessFracture toughness can be assessed by measuring the fracture energy (Glc) of a polymer . The Naval Research Laboratory (NRL) uses a compact tension specimen (Figure 17) to determine Glc which measures a polymer’s ability to absorb and dissipate impact energy without fracturing; larger values correspond to higher fracture toughness . Table 9 shows selected data from NRL Memorandum Report 5231 (February 22, 1984) . As expected, thermoset polymers cannot absorb and dissipate impact energy as well as thermoplastics and consequently have lower fracture energies . Torlon® PAI exhibits outstanding fracture toughness, with a Glc of 3 .4 kJ/m2 (1 .6 ft · lb/in2) . Glass transition temperatures (Tg) are included in the table to indicate the trade off between fracture toughness and useful temperature range . Torlon® PAI is characterized by a balance of toughness and high Tg .
Figure 17: Compact tension specimen
W
a
b
Where:Y = 29.6 − 186 (a/w) + 656 (a/w)2 − 1017 (a/w)3 + 639 (a/w)4
P = Critical fracture loada = Crack lengthE = Sample modulus
Y2Pc2a
EW2b2Glc =
Table 9: Torlon® PAI balances fracture toughness and high glass transition temperature
Fracture Energy Tg
Polymer [kJ/m2] [ft · lb/in2] [°C] [°F]
Thermosets
Polyimide-1 0 .20 0 .095 350 662
Polyimide-2 0 .12 0 .057 360 680
Tetrafunctional epoxy
0 .076 0 .036 260 500
Thermoplastics
Polyamide-imide 3 .4 1 .6 275 527
Polysulfone 3 .1 1 .5 174 345
Polyethersulfone 2 .6 1 .2 230 446
Polyimide-3 0 .81 0 .38 326 619
Polyimide-4 2 .1 1 .0 365 689
Polyphenylene sulfide
0 .21 0 .10 — —
14 \ Torlon® PAI Design Guide
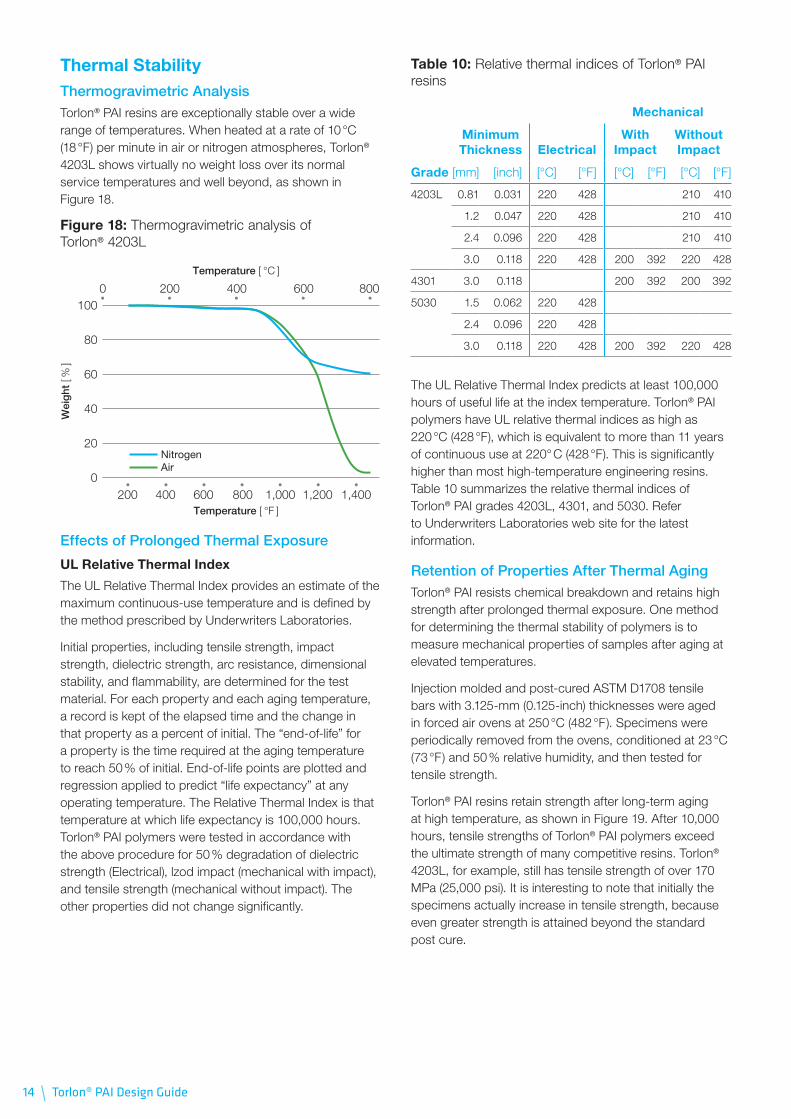
Thermal StabilityThermogravimetric AnalysisTorlon® PAI resins are exceptionally stable over a wide range of temperatures . When heated at a rate of 10 °C (18 °F) per minute in air or nitrogen atmospheres, Torlon® 4203L shows virtually no weight loss over its normal service temperatures and well beyond, as shown in Figure 18 .
Figure 18: Thermogravimetric analysis of Torlon® 4203L
Wei
ght
[ %
]
100
80
60
40
20
0
Temperature [ °F ]
Temperature [ °C ]
1,4001,2001,000400200
2000 400 600 800
600 800
NitrogenAir
Effects of Prolonged Thermal Exposure
UL Relative Thermal Index
The UL Relative Thermal Index provides an estimate of the maximum continuous-use temperature and is defined by the method prescribed by Underwriters Laboratories .
Initial properties, including tensile strength, impact strength, dielectric strength, arc resistance, dimensional stability, and flammability, are determined for the test material . For each property and each aging temperature, a record is kept of the elapsed time and the change in that property as a percent of initial . The “end-of-life” for a property is the time required at the aging temperature to reach 50 % of initial . End-of-life points are plotted and regression applied to predict “life expectancy” at any operating temperature . The Relative Thermal Index is that temperature at which life expectancy is 100,000 hours . Torlon® PAI polymers were tested in accordance with the above procedure for 50 % degradation of dielectric strength (Electrical), lzod impact (mechanical with impact), and tensile strength (mechanical without impact) . The other properties did not change significantly .
Table 10: Relative thermal indices of Torlon® PAI resins
Mechanical
Minimum Thickness Electrical
With Impact
Without Impact
Grade [mm] [inch] [°C] [°F] [°C] [°F] [°C] [°F]
4203L 0 .81 0 .031 220 428 210 410
1 .2 0 .047 220 428 210 410
2 .4 0 .096 220 428 210 410
3 .0 0 .118 220 428 200 392 220 428
4301 3 .0 0 .118 200 392 200 392
5030 1 .5 0 .062 220 428
2 .4 0 .096 220 428
3 .0 0 .118 220 428 200 392 220 428
The UL Relative Thermal Index predicts at least 100,000 hours of useful life at the index temperature . Torlon® PAI polymers have UL relative thermal indices as high as 220 °C (428 °F), which is equivalent to more than 11 years of continuous use at 220° C (428 °F) . This is significantly higher than most high-temperature engineering resins . Table 10 summarizes the relative thermal indices of Torlon® PAI grades 4203L, 4301, and 5030 . Refer to Underwriters Laboratories web site for the latest information .
Retention of Properties After Thermal AgingTorlon® PAI resists chemical breakdown and retains high strength after prolonged thermal exposure . One method for determining the thermal stability of polymers is to measure mechanical properties of samples after aging at elevated temperatures .
Injection molded and post-cured ASTM D1708 tensile bars with 3 .125-mm (0 .125-inch) thicknesses were aged in forced air ovens at 250 °C (482 °F) . Specimens were periodically removed from the ovens, conditioned at 23 °C (73 °F) and 50 % relative humidity, and then tested for tensile strength .
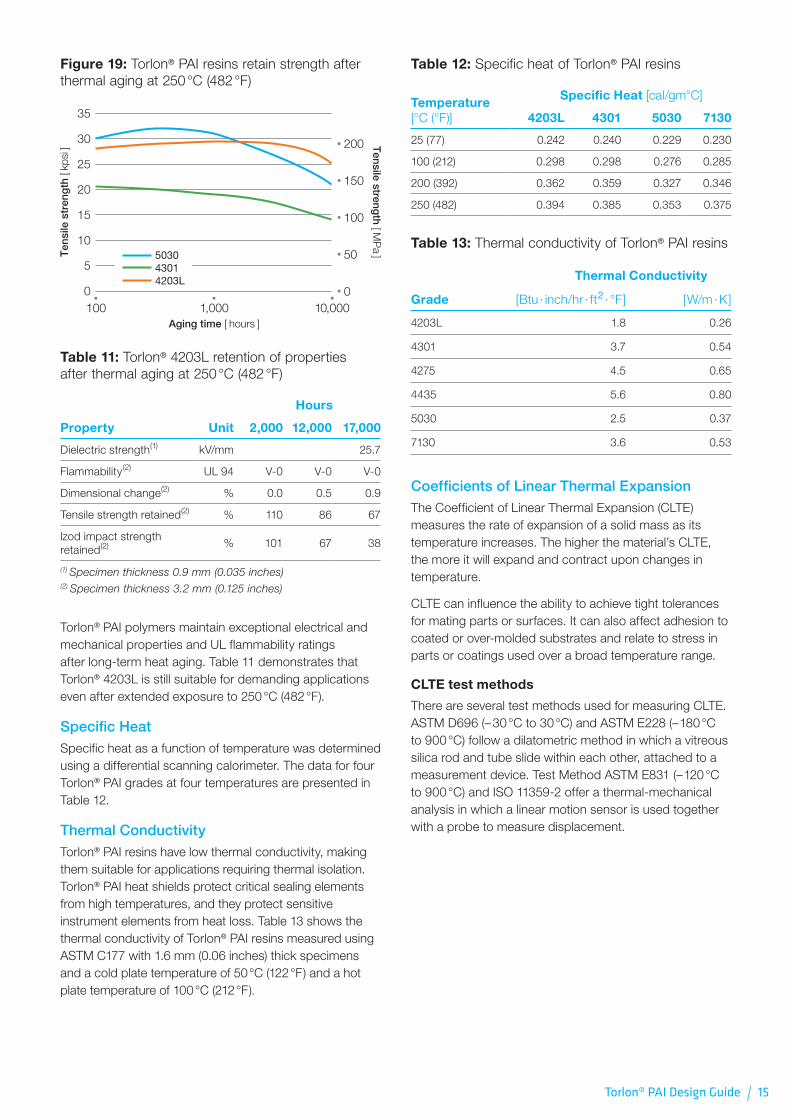
Torlon® PAI resins retain strength after long-term aging at high temperature, as shown in Figure 19 . After 10,000 hours, tensile strengths of Torlon® PAI polymers exceed the ultimate strength of many competitive resins . Torlon® 4203L, for example, still has tensile strength of over 170 MPa (25,000 psi) . It is interesting to note that initially the specimens actually increase in tensile strength, because even greater strength is attained beyond the standard post cure .
Torlon® PAI Design Guide / 15
Figure 19: Torlon® PAI resins retain strength after thermal aging at 250 °C (482 °F)
Ten
sile
str
eng
th [
kpsi
] Tensile streng
th [ MP
a ]
35
30
25
20
15
10
5
0
200
150
100
50
0
Aging time [ hours ]10,0001,000100
503043014203L
Table 11: Torlon® 4203L retention of properties after thermal aging at 250 °C (482 °F)
Property Unit
Hours
2,000 12,000 17,000
Dielectric strength(1) kV/mm 25 .7
Flammability(2) UL 94 V-0 V-0 V-0
Dimensional change(2) % 0 .0 0 .5 0 .9
Tensile strength retained(2) % 110 86 67
lzod impact strength retained(2) % 101 67 38
(1) Specimen thickness 0.9 mm (0.035 inches)(2) Specimen thickness 3.2 mm (0.125 inches)
Torlon® PAI polymers maintain exceptional electrical and mechanical properties and UL flammability ratings after long-term heat aging . Table 11 demonstrates that Torlon® 4203L is still suitable for demanding applications even after extended exposure to 250 °C (482 °F) .
Specific HeatSpecific heat as a function of temperature was determined using a differential scanning calorimeter . The data for four Torlon® PAI grades at four temperatures are presented in Table 12 .
Thermal ConductivityTorlon® PAI resins have low thermal conductivity, making them suitable for applications requiring thermal isolation . Torlon® PAI heat shields protect critical sealing elements from high temperatures, and they protect sensitive instrument elements from heat loss . Table 13 shows the thermal conductivity of Torlon® PAI resins measured using ASTM C177 with 1 .6 mm (0 .06 inches) thick specimens and a cold plate temperature of 50 °C (122 °F) and a hot plate temperature of 100 °C (212 °F) .
Table 12: Specific heat of Torlon® PAI resins
Temperature [°C (°F)]
Specific Heat [cal/gm°C]
4203L 4301 5030 7130
25 (77) 0 .242 0 .240 0 .229 0 .230
100 (212) 0 .298 0 .298 0 .276 0 .285
200 (392) 0 .362 0 .359 0 .327 0 .346
250 (482) 0 .394 0 .385 0 .353 0 .375
Table 13: Thermal conductivity of Torlon® PAI resins
Grade
Thermal Conductivity
[Btu · inch/hr · ft2 · °F] [W/m · K]
4203L 1 .8 0 .26
4301 3 .7 0 .54
4275 4 .5 0 .65
4435 5 .6 0 .80
5030 2 .5 0 .37
7130 3 .6 0 .53
Coefficients of Linear Thermal ExpansionThe Coefficient of Linear Thermal Expansion (CLTE) measures the rate of expansion of a solid mass as its temperature increases . The higher the material’s CLTE, the more it will expand and contract upon changes in temperature .
CLTE can influence the ability to achieve tight tolerances for mating parts or surfaces . It can also affect adhesion to coated or over-molded substrates and relate to stress in parts or coatings used over a broad temperature range .
CLTE test methods
There are several test methods used for measuring CLTE . ASTM D696 (– 30 °C to 30 °C) and ASTM E228 (– 180 °C to 900 °C) follow a dilatometric method in which a vitreous silica rod and tube slide within each other, attached to a measurement device . Test Method ASTM E831 (– 120 °C to 900 °C) and ISO 11359-2 offer a thermal-mechanical analysis in which a linear motion sensor is used together with a probe to measure displacement .
16 \ Torlon® PAI Design Guide
Factors affecting CLTE
It is important to realize that CLTE can vary depending on sample size and preparation . Therefore, a thorough evaluation of CTLE data involves consideration of several factors .
Part thickness
Thermal expansion is not linear with thickness . Heat flow and temperature differential across thick parts can inflate or deflate CLTE .
Temperature range and phase changes
The phase of a polymer can change across its glass transition temperature (Tg) . Above the Tg, molecular mobility increases and expansion rate increases .
Processing parameters
Factors such as mold temperature and annealing can affect crystallinity and stresses in parts, which can affect CLTE . It important to cure Torlon® PAI resin properly to minimize CLTE .
Reinforcements
High aspect ratio fillers such as glass and carbon fibers can lead to anisotropic CLTE . Orientation of fillers can be affected by processing parameters and mold design .
Table 14: CLTE for Torlon® PAI resins and selected metals(1)
CLTE
[ppm/°C] [ppm/°F]
Torlon® 7130 9 .0 5 .0
Inconel X, annealed 12 .1 6 .7
Plain carbon steel AISI-SAE 1020 12 .1 6 .7
Titanium 6-2-4-2 12 .6 7 .0
Torlon® 5030 16 .2 9 .0
Copper 16 .7 9 .3
Stainless steel, type 304 17 .3 9 .6
Commercial bronze, 90 %, C2200 18 .4 10 .2
Aluminum alloy 2017, annealed, ASTM B221
22 .9 12 .7
Torlon® 4275 25 .2 14 .0
Torlon® 4301 25 .2 14 .0
Aluminum alloy 7075 26 .0 14 .4
Torlon® 4203L 30 .6 17 .0(1) The CLTE data for Torlon® PAI resins were determined per ASTM D696, over a temperature range of 24 °C to 149 °C (75 °F to 300 °F). CLTE data for metals are from the CRC Handbook of Chemistry and Physics, 54th ed. and Materials Engineering, 1984 Materials Selector edition, Dec. 1983.
Part geometrySpecimens of different thickness can yield different results depending on thermal conductivity . The most useful CLTE measurements will be made on parts of similar thickness to application dimensions, prepared in a similar way .
In general, parts should be designed such that they will be properly sized at end-use temperature . Molds should be designed accordingly, with clearances and tolerances taking expansion at temperature into account .
Note that while CLTE data is reported in the direction of flow, or transverse to the direction of the flow, actual applications will typically need to factor in the affect of CLTE in all directions .
Due to its amorphous nature, Torlon® PAI offers a highly isotropic CLTE with very high consistency over a broad temperature range . As shown in Table 14, the thermal expansion of filled Torlon® PAI resin nearly matches that of common metals .
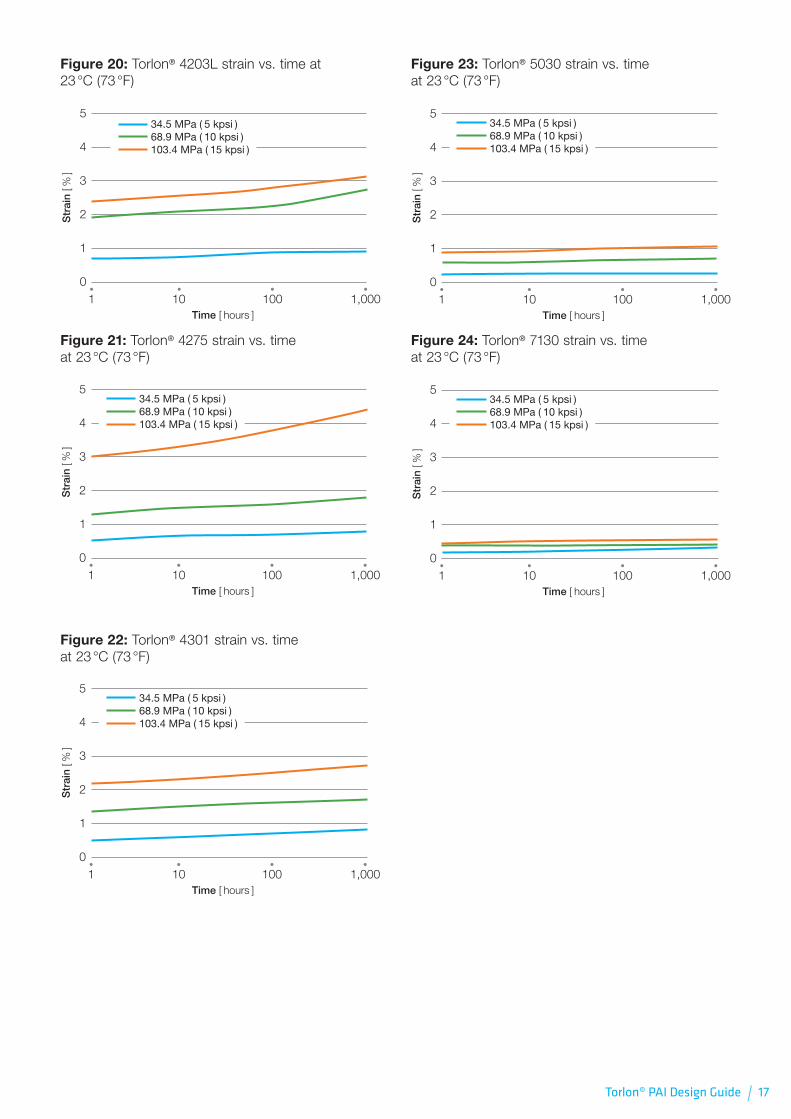
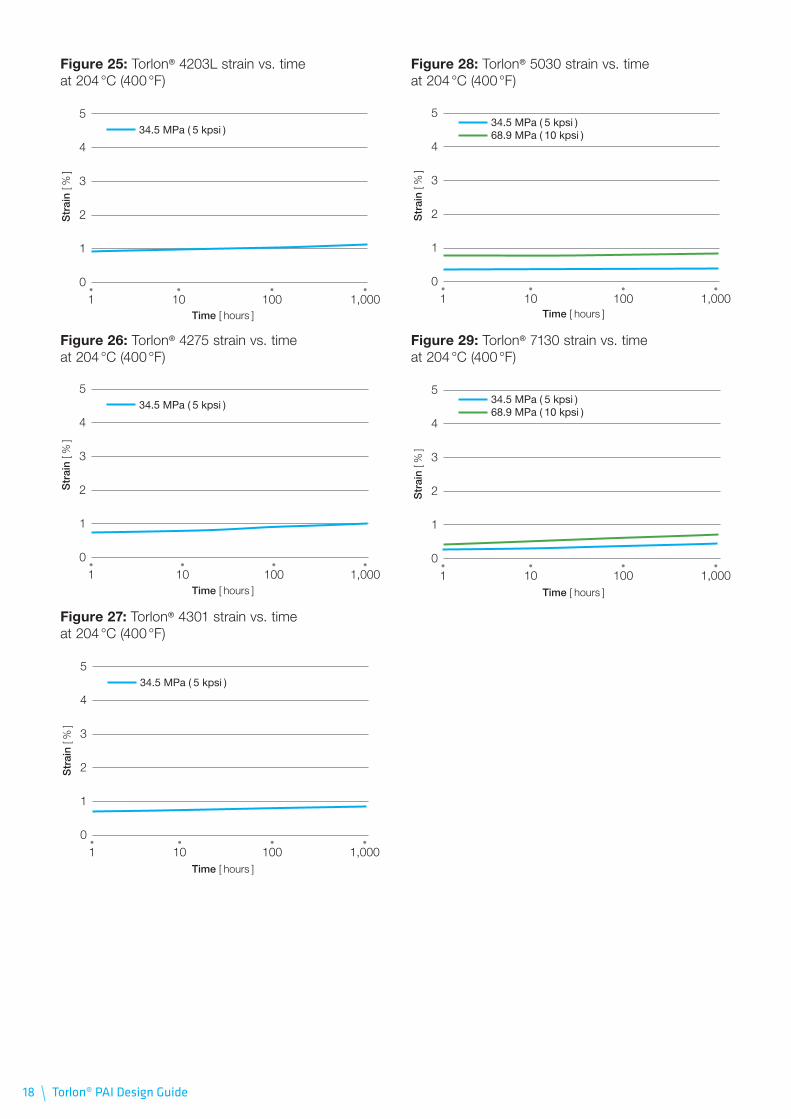
Creep ResistanceWhen a material is subjected to a stress, it will deform or exhibit strain . The immediate strain can be calculated from the appropriate modulus . If the stress is continually applied for an extended time, additional strain will result which is known as creep strain . Torlon® PAI resists creep and handles stress more like a metal than a plastic . To get measurable creep, Torlon® PAI must be stressed beyond the ultimate strength of most other plastics . The designer must consider the long-term creep behavior of plastics under the expected stress and temperature conditions of the proposed application . Figures 20 through 24 summarize selected data from tensile creep tests (ASTM D2990) at applied stresses of 34 .5 MPa, 68 .9 MPa, and 103 .4 MPa (5 kpsi, 10 kpsi and 15 kpsi) at room temperature .
Figures 25 through 29 show this data for tests performed at 204 °C (400 °F) . Non-reinforced Torlon® PAI grades may creep or rupture at extremely high temperatures – over 204 °C (400 °F) – when stress exceeds 34 .5 MPa (5 kpsi) . For these applications, a reinforced grade is recommended .
Torlon® PAI Design Guide / 17
Figure 20: Torlon® 4203L strain vs . time at 23 °C (73 °F)
Str
ain
[ % ]
5
4
3
2
1
01 10 100 1,000
Time [ hours ]
34.5 MPa ( 5 kpsi )68.9 MPa ( 10 kpsi )103.4 MPa ( 15 kpsi )
Figure 21: Torlon® 4275 strain vs . time at 23 °C (73 °F)
Str
ain
[ % ]
5
4
3
2
1
01 10 100 1,000
Time [ hours ]
34.5 MPa ( 5 kpsi )68.9 MPa ( 10 kpsi )103.4 MPa ( 15 kpsi )
Figure 22: Torlon® 4301 strain vs . time at 23 °C (73 °F)
Str
ain
[ % ]
5
4
3
2
1
01 10 100 1,000
Time [ hours ]
34.5 MPa ( 5 kpsi )68.9 MPa ( 10 kpsi )103.4 MPa ( 15 kpsi )
Figure 23: Torlon® 5030 strain vs . time at 23 °C (73 °F)
Str
ain
[ % ]
5
4
3
2
1
01 10 100 1,000
Time [ hours ]
34.5 MPa ( 5 kpsi )68.9 MPa ( 10 kpsi )103.4 MPa ( 15 kpsi )
Figure 24: Torlon® 7130 strain vs . time at 23 °C (73 °F)
Str
ain
[ % ]
5
4
3
2
1
01 10 100 1,000
Time [ hours ]
34.5 MPa ( 5 kpsi )68.9 MPa ( 10 kpsi )103.4 MPa ( 15 kpsi )
18 \ Torlon® PAI Design Guide
Figure 25: Torlon® 4203L strain vs . time at 204 °C (400 °F)
Str
ain
[ % ]
5
4
3
2
1
01 10 100 1,000
Time [ hours ]
34.5 MPa ( 5 kpsi )
Figure 26: Torlon® 4275 strain vs . time at 204 °C (400 °F)
Str
ain
[ % ]
5
4
3
2
1
01 10 100 1,000
Time [ hours ]
34.5 MPa ( 5 kpsi )
Figure 27: Torlon® 4301 strain vs . time at 204 °C (400 °F)
Str
ain
[ % ]
5
4
3
2
1
01 10 100 1,000
Time [ hours ]
34.5 MPa ( 5 kpsi )
Figure 28: Torlon® 5030 strain vs . time at 204 °C (400 °F)
Str
ain
[ % ]
5
4
3
2
1
01 10 100 1,000
Time [ hours ]
34.5 MPa ( 5 kpsi )68.9 MPa ( 10 kpsi )
Figure 29: Torlon® 7130 strain vs . time at 204 °C (400 °F)
Str
ain
[ % ]
5
4
3
2
1
01 10 100 1,000
Time [ hours ]
34.5 MPa ( 5 kpsi )68.9 MPa ( 10 kpsi )
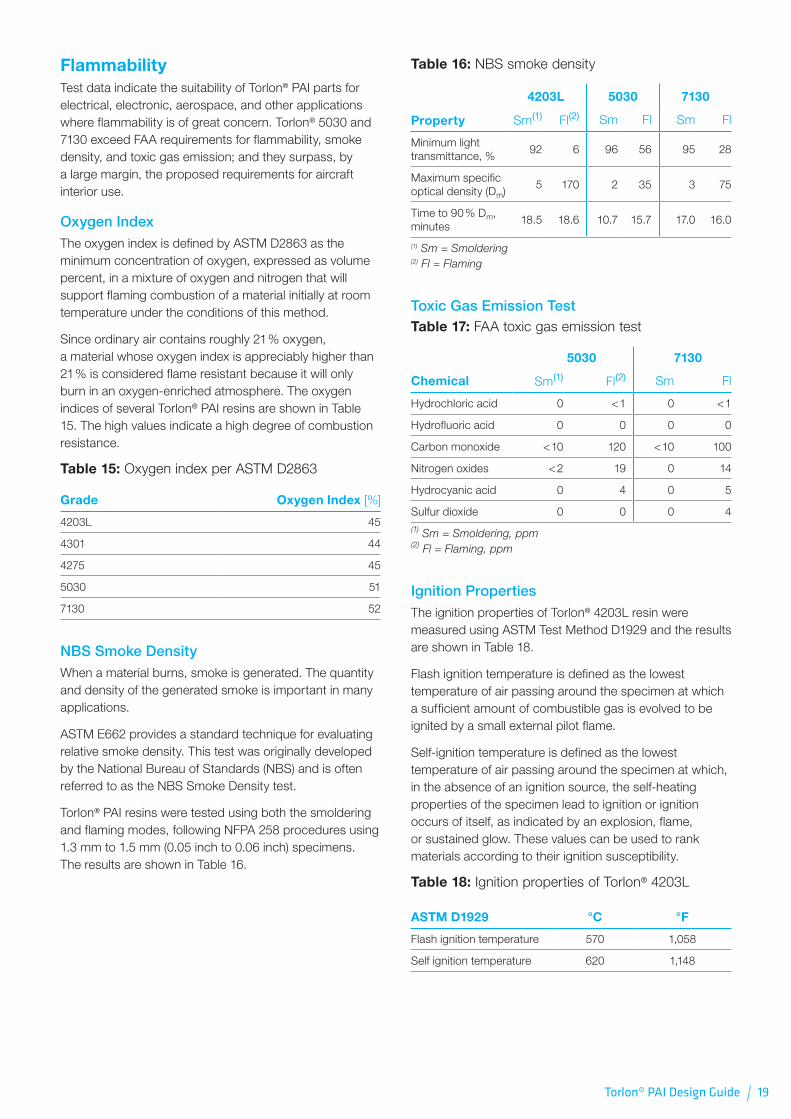
Torlon® PAI Design Guide / 19
FlammabilityTest data indicate the suitability of Torlon® PAI parts for electrical, electronic, aerospace, and other applications where flammability is of great concern . Torlon® 5030 and 7130 exceed FAA requirements for flammability, smoke density, and toxic gas emission; and they surpass, by a large margin, the proposed requirements for aircraft interior use .
Oxygen IndexThe oxygen index is defined by ASTM D2863 as the minimum concentration of oxygen, expressed as volume percent, in a mixture of oxygen and nitrogen that will support flaming combustion of a material initially at room temperature under the conditions of this method .
Since ordinary air contains roughly 21 % oxygen, a material whose oxygen index is appreciably higher than 21 % is considered flame resistant because it will only burn in an oxygen-enriched atmosphere . The oxygen indices of several Torlon® PAI resins are shown in Table 15 . The high values indicate a high degree of combustion resistance .
Table 15: Oxygen index per ASTM D2863
Grade Oxygen Index [%]
4203L 45
4301 44
4275 45
5030 51
7130 52
NBS Smoke DensityWhen a material burns, smoke is generated . The quantity and density of the generated smoke is important in many applications .
ASTM E662 provides a standard technique for evaluating relative smoke density . This test was originally developed by the National Bureau of Standards (NBS) and is often referred to as the NBS Smoke Density test .
Torlon® PAI resins were tested using both the smoldering and flaming modes, following NFPA 258 procedures using 1 .3 mm to 1 .5 mm (0 .05 inch to 0 .06 inch) specimens . The results are shown in Table 16 .
Table 16: NBS smoke density
Property
4203L 5030 7130
Sm(1) Fl(2) Sm Fl Sm Fl
Minimum light transmittance, %
92 6 96 56 95 28
Maximum specific optical density (Dm)
5 170 2 35 3 75
Time to 90 % Dm, minutes
18 .5 18 .6 10 .7 15 .7 17 .0 16 .0
(1) Sm = Smoldering(2) Fl = Flaming
Toxic Gas Emission TestTable 17: FAA toxic gas emission test
5030 7130
Chemical Sm(1) Fl(2) Sm Fl
Hydrochloric acid 0 < 1 0 < 1
Hydrofluoric acid 0 0 0 0
Carbon monoxide < 10 120 < 10 100
Nitrogen oxides < 2 19 0 14
Hydrocyanic acid 0 4 0 5
Sulfur dioxide 0 0 0 4(1) Sm = Smoldering, ppm(2) Fl = Flaming, ppm
Ignition PropertiesThe ignition properties of Torlon® 4203L resin were measured using ASTM Test Method D1929 and the results are shown in Table 18 .
Flash ignition temperature is defined as the lowest temperature of air passing around the specimen at which a sufficient amount of combustible gas is evolved to be ignited by a small external pilot flame .
Self-ignition temperature is defined as the lowest temperature of air passing around the specimen at which, in the absence of an ignition source, the self-heating properties of the specimen lead to ignition or ignition occurs of itself, as indicated by an explosion, flame, or sustained glow . These values can be used to rank materials according to their ignition susceptibility .
Table 18: Ignition properties of Torlon® 4203L
ASTM D1929 °C °F
Flash ignition temperature 570 1,058
Self ignition temperature 620 1,148

20 \ Torlon® PAI Design Guide
UL 94 Flammability StandardThe UL 94 flammability standard established by Underwriters Laboratories is a system by which plastic materials can be classified with respect to their ability to withstand combustion . The flammability rating given to a plastic material is dependent upon the response of the material to heat and flame under controlled laboratory conditions and serves as a preliminary indicator of its acceptability with respect to flammability for a particular application . The actual response to heat and flame of a thermoplastic depends on other factors such as the size, form, and end-use of the product . Additionally, characteristics in end-use application such as ease of ignition, burning rate, flame spread, fuel contribution, intensity of burning, and products of combustion will affect the combustion response of the material .
Three primary test methods comprise the UL 94 standard . They are the Horizontal Burning Test, the 20 MM Vertical Burning Test, and the 500 MW Vertical Burning Test.
Horizontal burning test
For a HB classification rating, injection molded test specimens are limited to a 125 mm (5 .0 inch) length, 13 mm (0 .5 inch) width and the minimum thickness for which the rating is desired . The samples are clamped in a horizontal position with a 20 mm blue flame applied to the unclamped edge of the specimen at a 45 ° angle for 30 seconds or so, as soon as the combustion front reaches a pre-marked line 25 mm from the edge of the bar . After the flame is removed, the rate of burn for the combustion front to travel from the 25 mm line to a pre-marked 100 mm line is calculated . At least three specimens are tested in this manner . A plastic obtains a HB rating by not exceeding a burn rate of 40 mm/min for specimens having a thickness greater than 3 mm or 75 mm/min for bars less than 3 mm thick . The rating is also extended to products that do not support combustion to the 100 mm reference mark .
Table 19: UL criteria for classifying materials
Criteria Conditions V-0 V-1 V-2
Afterflame time for each individual specimen, (t1 or t2)
≤ 10s ≤ 30s ≤ 30s
Total afterflame time for any condition set (t1 + t2 for the 5 specimens)
≤ 50s ≤ 250s ≤ 250s
Afterflame plus afterglow time for each individual specimen after the second flame application (t2 + t3)
≤ 30s ≤ 60s ≤ 60s
Afterflame or afterglow of any specimen up to the holding clamp
No No No
Cotton indicator ignited by flaming particles or drops
No No Yes
20 mm vertical burn testMaterials can be classified V-0, V-1, or V-2 based on the results obtained from the combustion of samples clamped in a vertical position .
The 20 mm vertical burn test is more aggressive than the HB test and is performed on samples that measure 125 mm in length, 13 mm in width, and the minimum thickness at which the rating is desired (typically 0 .8 mm or 1 .57 mm) .
The samples are clamped in a vertical position with a 20 mm high blue flame applied to the lower edge of the clamped specimen . The flame is applied for 10 seconds and removed . When the specimen stops burning, the flame is reapplied for an additional 10 seconds and then removed . A total of five bars are tested in this manner . Table 19 lists the criteria by which a material is classified in this test .
Table 20 gives the ratings of selected grades of Torlon® PAI resins . The most current ratings of Torlon® PAI resins can be found at the Underwriters Laboratories web site at www.ul.com.
Table 20: Vertical flammability by Underwriters Laboratories (UL 94)
Thickness
UL 94 RatingGrade [mm] [inch]
4203, 4203L 1 .2 0 .047 V-0
2 .4 0 .094 V-0
3 .0 0 .118 V-0
4301 1 .2 0 .047 V-0
2 .4 0 .094 V-0
3 .0 0 .118 V-0
5030 1 .2 0 .047 V-0
1 .5 0 .059 V-0
2 .4 0 .094 V-0
3 .0 0 .118 V-0
Torlon® PAI Design Guide / 21
FAA FlammabilityTorlon® 5030 and 7130 were tested by the FAA vertical flammability test for Transport Category Airplanes as described in 25 .853(a) and Appendix F . The results are shown in Table 21 .
Samples of Torlon® 5030 and 7130 were also tested for horizontal flammability (FAA Transport Category Airplanes, 25 .853 [b-3] and Appendix F) and 45 flammability (FAA Cargo and Baggage Compartment, 25 .855 [1-a]) . In both cases, the test specimens did not ignite . Based on that result, Torlon® 5030 and 7130 meet the requirements of these codes .
Table 21: FAA vertical flammability
Average Burn Length
Grade [mm] [inch]
5030 15 .2 0 .6
7130 15 .2 0 .6
UL 57 Electric Lighting FixturesTorlon® 4203L resin was tested for conformance to the flammability requirements of this standard . The results shown in Table 22 show that the requirements are met .
Note: The test methods used to obtain the data in this section measure response to heat and flame under controlled laboratory conditions detailed in the test method specified and may not provide an accurate measure of fire hazard under actual fire conditions . Furthermore, as Solvay has no control over final formulation by the user of these resins including components incorporated either internally or externally, nor over processing conditions or final physical form or shape, these results may not be directly applicable to the intended end use .
Table 22: Electric lighting fixtures, flammability requirements (UL 57)
Grade Test Results
4203L Noncombustible by section 81 .12 for thickness of 1 .02 mm, 3 .18 mm and 5 .08 mm (0 .040 inch, 0 .125 inch and 0 .200 inch)
Performance in Various EnvironmentsChemical ResistanceTorlon® PAI is virtually unaffected by aliphatic and aromatic hydrocarbons, chlorinated and fluorinated hydrocarbons, and most acids at moderate temperatures . The polymer, however, may be attacked by saturated steam, strong bases, and some high-temperature acid systems . The effects of a number of specific chemicals on the tensile strength of Torlon® 4203L are presented in Table 23 . Proper post-cure of Torlon® PAI parts is necessary to achieve optimal chemical resistance .
Table 23: Chemical resistance of Torlon® 4203L, 24 hr at 93 °C (200 °F)
Chemical RatingAcids
Acetic acid (10 %) A
Glacial acetic acid A
Acetic anhydride A
Lactic acid A
Benzene sulfonic acid F
Chromic acid (10 %) A
Formic acid (88 %) C
Hydrochloric acid (10 %) A
Hydrochloric acid (37 %) A
Hydrofluoric acid (40 %) F
Phosphoric acid (35 %) A
Sulfuric acid (30 %) A
Bases
Ammonium hydroxide (28 %) C
Sodium hydroxide (15 %) F
Sodium hydroxide (30 %) F
Aqueous solutions (10 %)
Aluminum sulfate A
Ammonium chloride A
Ammonium nitrate A
Barium chloride A
Bromine (saturated solution, 49 °C (120 °F))
A
Calcium chloride A
Calcium nitrate A
Ferric chloride A
Magnesium chloride A
Potassium permanganate A
Sodium bicarbonate A
Silver chloride A
Sodium carbonate A
Sodium chloride A
Sodium chromate A
Sodium hypochlorite A
Sodium sulfate A
Sodium sulfide A
Sodium Sulfite A
22 \ Torlon® PAI Design Guide
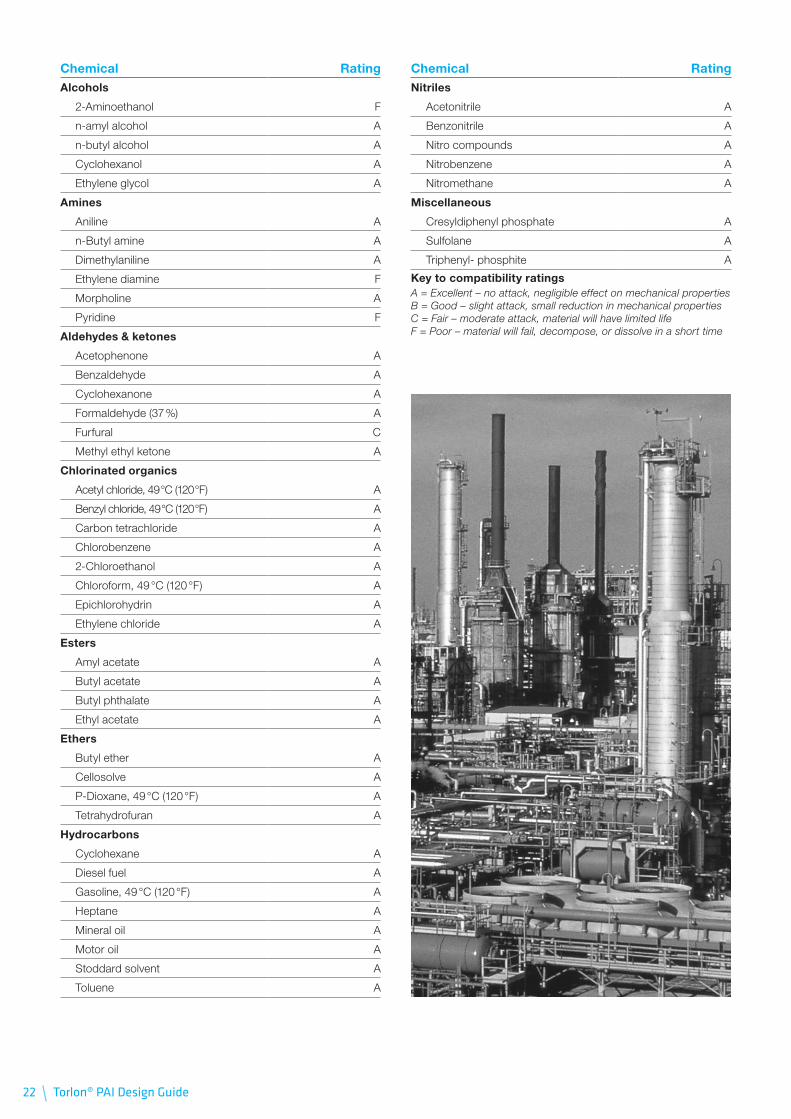
Chemical RatingAlcohols
2-Aminoethanol F
n-amyl alcohol A
n-butyl alcohol A
Cyclohexanol A
Ethylene glycol A
Amines
Aniline A
n-Butyl amine A
Dimethylaniline A
Ethylene diamine F
Morpholine A
Pyridine F
Aldehydes & ketones
Acetophenone A
Benzaldehyde A
Cyclohexanone A
Formaldehyde (37 %) A
Furfural C
Methyl ethyl ketone A
Chlorinated organics
Acetyl chloride, 49 °C (120 °F) A
Benzyl chloride, 49 °C (120 °F) A
Carbon tetrachloride A
Chlorobenzene A
2-Chloroethanol A
Chloroform, 49 °C (120 °F) A
Epichlorohydrin A
Ethylene chloride A
Esters
Amyl acetate A
Butyl acetate A
Butyl phthalate A
Ethyl acetate A
Ethers
Butyl ether A
Cellosolve A
P-Dioxane, 49 °C (120 °F) A
Tetrahydrofuran A
Hydrocarbons
Cyclohexane A
Diesel fuel A
Gasoline, 49 °C (120 °F) A
Heptane A
Mineral oil A
Motor oil A
Stoddard solvent A
Toluene A
Chemical RatingNitriles
Acetonitrile A
Benzonitrile A
Nitro compounds A
Nitrobenzene A
Nitromethane A
Miscellaneous
Cresyldiphenyl phosphate A
Sulfolane A
Triphenyl- phosphite A
Key to compatibility ratingsA = Excellent – no attack, negligible effect on mechanical properties B = Good – slight attack, small reduction in mechanical properties C = Fair – moderate attack, material will have limited life F = Poor – material will fail, decompose, or dissolve in a short time
Torlon® PAI Design Guide / 23
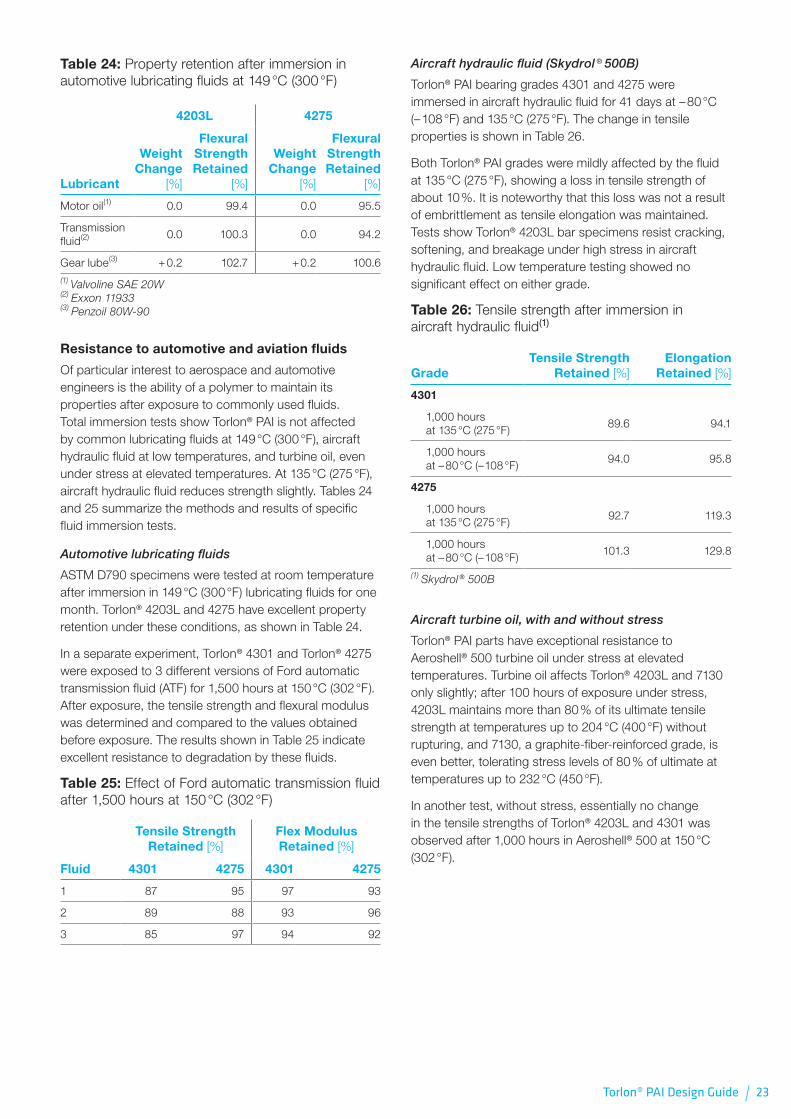
Table 24: Property retention after immersion in automotive lubricating fluids at 149 °C (300 °F)
4203L 4275
Lubricant
Weight Change
[%]
Flexural Strength Retained
[%]
Weight Change
[%]
Flexural Strength Retained
[%]
Motor oil(1) 0 .0 99 .4 0 .0 95 .5
Transmission fluid(2) 0 .0 100 .3 0 .0 94 .2
Gear lube(3) + 0 .2 102 .7 + 0 .2 100 .6(1) Valvoline SAE 20W (2) Exxon 11933 (3) Penzoil 80W-90
Resistance to automotive and aviation fluids
Of particular interest to aerospace and automotive engineers is the ability of a polymer to maintain its properties after exposure to commonly used fluids . Total immersion tests show Torlon® PAI is not affected by common lubricating fluids at 149 °C (300 °F), aircraft hydraulic fluid at low temperatures, and turbine oil, even under stress at elevated temperatures . At 135 °C (275 °F), aircraft hydraulic fluid reduces strength slightly . Tables 24 and 25 summarize the methods and results of specific fluid immersion tests .
Automotive lubricating fluids
ASTM D790 specimens were tested at room temperature after immersion in 149 °C (300 °F) lubricating fluids for one month . Torlon® 4203L and 4275 have excellent property retention under these conditions, as shown in Table 24 .
In a separate experiment, Torlon® 4301 and Torlon® 4275 were exposed to 3 different versions of Ford automatic transmission fluid (ATF) for 1,500 hours at 150 °C (302 °F) . After exposure, the tensile strength and flexural modulus was determined and compared to the values obtained before exposure . The results shown in Table 25 indicate excellent resistance to degradation by these fluids .
Table 25: Effect of Ford automatic transmission fluid after 1,500 hours at 150 °C (302 °F)
Tensile Strength Retained [%]
Flex Modulus Retained [%]
Fluid 4301 4275 4301 4275
1 87 95 97 93
2 89 88 93 96
3 85 97 94 92
Aircraft hydraulic fluid (Skydrol ® 500B)
Torlon® PAI bearing grades 4301 and 4275 were immersed in aircraft hydraulic fluid for 41 days at – 80 °C (– 108 °F) and 135 °C (275 °F) . The change in tensile properties is shown in Table 26 .
Both Torlon® PAI grades were mildly affected by the fluid at 135 °C (275 °F), showing a loss in tensile strength of about 10 % . It is noteworthy that this loss was not a result of embrittlement as tensile elongation was maintained . Tests show Torlon® 4203L bar specimens resist cracking, softening, and breakage under high stress in aircraft hydraulic fluid . Low temperature testing showed no significant effect on either grade .
Table 26: Tensile strength after immersion in aircraft hydraulic fluid(1)
GradeTensile Strength
Retained [%] Elongation
Retained [%]
4301
1,000 hours at 135 °C (275 °F)
89 .6 94 .1
1,000 hours at – 80 °C (– 108 °F)
94 .0 95 .8
4275
1,000 hours at 135 °C (275 °F)
92 .7 119 .3
1,000 hours at – 80 °C (– 108 °F)
101 .3 129 .8
(1) Skydrol ® 500B
Aircraft turbine oil, with and without stress
Torlon® PAI parts have exceptional resistance to Aeroshell® 500 turbine oil under stress at elevated temperatures . Turbine oil affects Torlon® 4203L and 7130 only slightly; after 100 hours of exposure under stress, 4203L maintains more than 80 % of its ultimate tensile strength at temperatures up to 204 °C (400 °F) without rupturing, and 7130, a graphite-fiber-reinforced grade, is even better, tolerating stress levels of 80 % of ultimate at temperatures up to 232 °C (450 °F) .
In another test, without stress, essentially no change in the tensile strengths of Torlon® 4203L and 4301 was observed after 1,000 hours in Aeroshell® 500 at 150 °C (302 °F) .
24 \ Torlon® PAI Design Guide
Chemical Resistance Under StressTorlon® PAI parts which had been thoroughly post-cured were tested for chemical resistance under stress . Test specimens, 127 x 13 x 3 mm (5 x 0 .5 x 0 .125 inch) were clamped over a fixture with a 127 mm (5 .0 inch) radius curved surface . The test chemical was applied to the middle of each specimen for one minute . The application was repeated after one and two hours . Specimens were inspected after 24 hours for breakage, cracking, swelling, and softening .
Resistance to the following chemical environments was tested: aviation gasoline, turbine fuel (Jet A/A-1), hydraulic fluid, methyl ethyl ketone, methylene chloride, 1,1,1 trichloroethane, and toluene . None of the Torlon® PAI specimens showed any breakage, cracking, swelling, or softening .
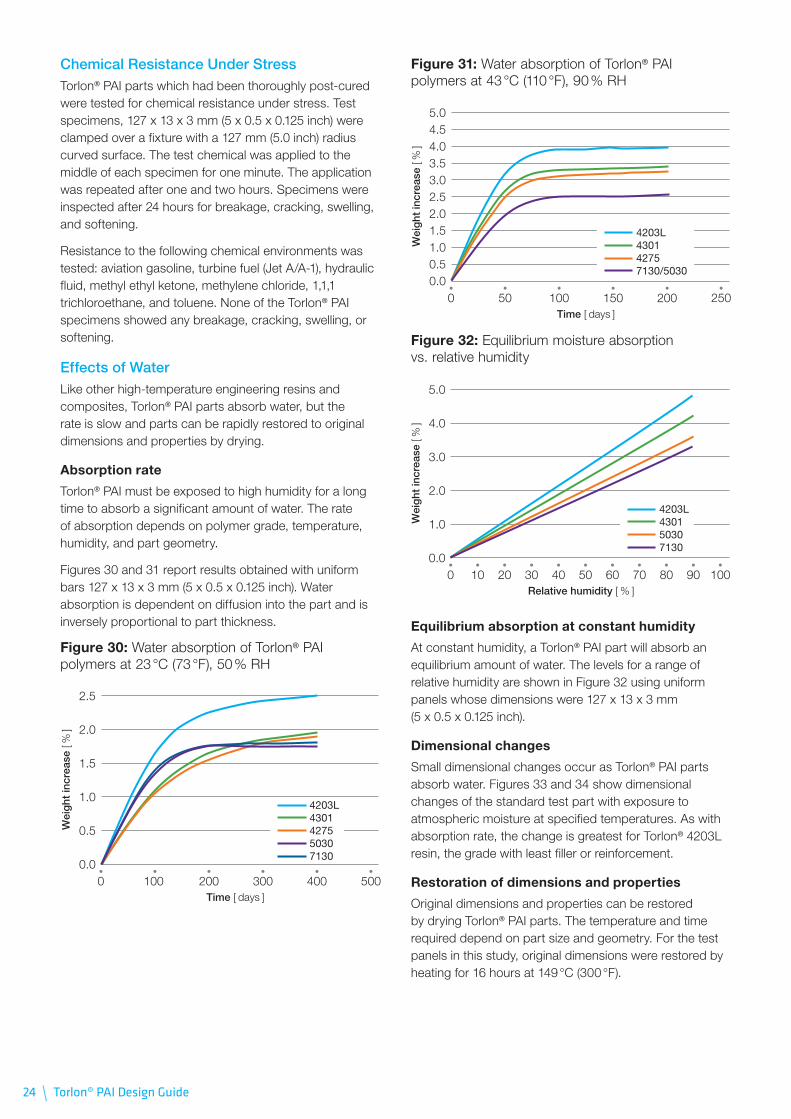
Effects of WaterLike other high-temperature engineering resins and composites, Torlon® PAI parts absorb water, but the rate is slow and parts can be rapidly restored to original dimensions and properties by drying .
Absorption rate
Torlon® PAI must be exposed to high humidity for a long time to absorb a significant amount of water . The rate of absorption depends on polymer grade, temperature, humidity, and part geometry .
Figures 30 and 31 report results obtained with uniform bars 127 x 13 x 3 mm (5 x 0 .5 x 0 .125 inch) . Water absorption is dependent on diffusion into the part and is inversely proportional to part thickness .
Figure 30: Water absorption of Torlon® PAI polymers at 23 °C (73 °F), 50 % RH
Wei
ght
incr
ease
[ %
]
2.5
2.0
1.5
1.0
0.5
0.00 100 300200 400 500
Time [ days ]
4203L4301427550307130
Figure 31: Water absorption of Torlon® PAI polymers at 43 °C (110 °F), 90 % RH
Wei
ght
incr
ease
[ %
]
5.04.54.03.53.02.52.01.51.00.50.0
0 50 150100 200 250Time [ days ]
4203L430142757130/5030
Figure 32: Equilibrium moisture absorption vs . relative humidity
Wei
ght
incr
ease
[ %
]
5.0
4.0
3.0
2.0
1.0
0.00 20 6040 80 9010 5030 70 100
Relative humidity [ % ]
4203L430150307130
Equilibrium absorption at constant humidity
At constant humidity, a Torlon® PAI part will absorb an equilibrium amount of water . The levels for a range of relative humidity are shown in Figure 32 using uniform panels whose dimensions were 127 x 13 x 3 mm (5 x 0 .5 x 0 .125 inch) .
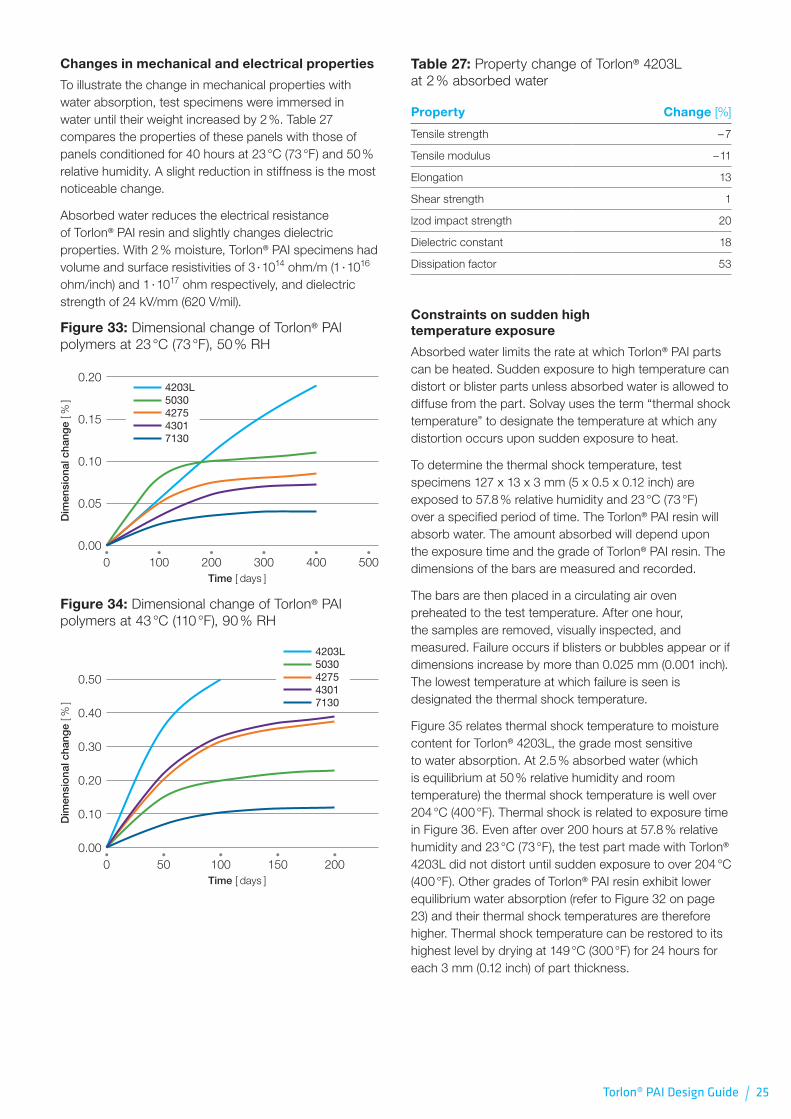
Dimensional changes
Small dimensional changes occur as Torlon® PAI parts absorb water . Figures 33 and 34 show dimensional changes of the standard test part with exposure to atmospheric moisture at specified temperatures . As with absorption rate, the change is greatest for Torlon® 4203L resin, the grade with least filler or reinforcement .
Restoration of dimensions and properties
Original dimensions and properties can be restored by drying Torlon® PAI parts . The temperature and time required depend on part size and geometry . For the test panels in this study, original dimensions were restored by heating for 16 hours at 149 °C (300 °F) .
Torlon® PAI Design Guide / 25
Changes in mechanical and electrical properties
To illustrate the change in mechanical properties with water absorption, test specimens were immersed in water until their weight increased by 2 % . Table 27 compares the properties of these panels with those of panels conditioned for 40 hours at 23 °C (73 °F) and 50 % relative humidity . A slight reduction in stiffness is the most noticeable change .
Absorbed water reduces the electrical resistance of Torlon® PAI resin and slightly changes dielectric properties . With 2 % moisture, Torlon® PAI specimens had volume and surface resistivities of 3 · 1014 ohm/m (1 · 1016 ohm/inch) and 1 · 1017 ohm respectively, and dielectric strength of 24 kV/mm (620 V/mil) .
Figure 33: Dimensional change of Torlon® PAI polymers at 23 °C (73 °F), 50 % RH
Dim
ensi
ona
l cha
nge
[ % ]
0.20
0.15
0.10
0.05
0.000 100 300200 400 500
Time [ days ]
4203L5030427543017130
Figure 34: Dimensional change of Torlon® PAI polymers at 43 °C (110 °F), 90 % RH
Dim
ensi
ona
l cha
nge
[ % ]
0.50
0.40
0.30
0.20
0.10
0.000 50 150100 200
Time [ days ]
4203L5030427543017130
Table 27: Property change of Torlon® 4203L at 2 % absorbed water
Property Change [%]
Tensile strength – 7
Tensile modulus – 11
Elongation 13
Shear strength 1
lzod impact strength 20
Dielectric constant 18
Dissipation factor 53
Constraints on sudden high temperature exposure
Absorbed water limits the rate at which Torlon® PAI parts can be heated . Sudden exposure to high temperature can distort or blister parts unless absorbed water is allowed to diffuse from the part . Solvay uses the term “thermal shock temperature” to designate the temperature at which any distortion occurs upon sudden exposure to heat .
To determine the thermal shock temperature, test specimens 127 x 13 x 3 mm (5 x 0 .5 x 0 .12 inch) are exposed to 57 .8 % relative humidity and 23 °C (73 °F) over a specified period of time . The Torlon® PAI resin will absorb water . The amount absorbed will depend upon the exposure time and the grade of Torlon® PAI resin . The dimensions of the bars are measured and recorded .
The bars are then placed in a circulating air oven preheated to the test temperature . After one hour, the samples are removed, visually inspected, and measured . Failure occurs if blisters or bubbles appear or if dimensions increase by more than 0 .025 mm (0 .001 inch) . The lowest temperature at which failure is seen is designated the thermal shock temperature .
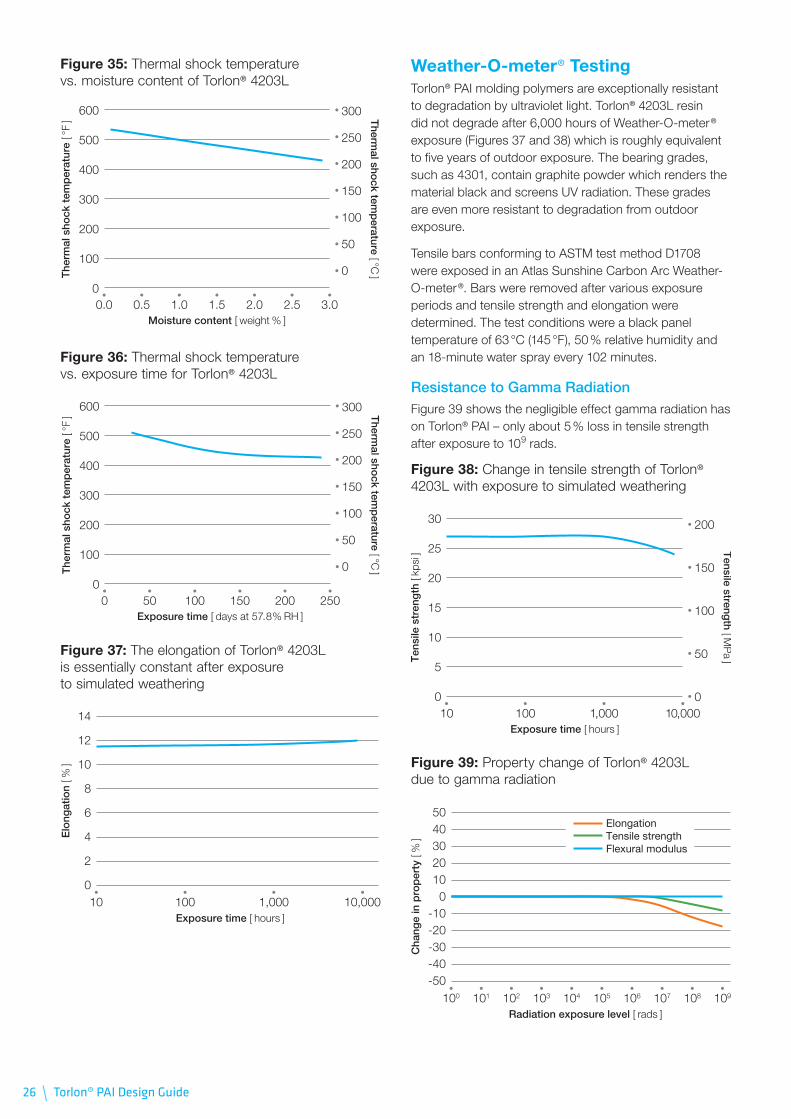
Figure 35 relates thermal shock temperature to moisture content for Torlon® 4203L, the grade most sensitive to water absorption . At 2 .5 % absorbed water (which is equilibrium at 50 % relative humidity and room temperature) the thermal shock temperature is well over 204 °C (400 °F) . Thermal shock is related to exposure time in Figure 36 . Even after over 200 hours at 57 .8 % relative humidity and 23 °C (73 °F), the test part made with Torlon® 4203L did not distort until sudden exposure to over 204 °C (400 °F) . Other grades of Torlon® PAI resin exhibit lower equilibrium water absorption (refer to Figure 32 on page 23) and their thermal shock temperatures are therefore higher . Thermal shock temperature can be restored to its highest level by drying at 149 °C (300 °F) for 24 hours for each 3 mm (0 .12 inch) of part thickness .
26 \ Torlon® PAI Design Guide
Figure 35: Thermal shock temperature vs . moisture content of Torlon® 4203L
600
500
400
300
200
100
0
300
250
200
150
100
50
0The
rmal
sho
ck t
emp
erat
ure
[ °F
] Therm
al shock tem
perature [ °C
]
Moisture content [ weight % ]3.02.0 2.50.5 1.0 1.50.0
Figure 36: Thermal shock temperature vs . exposure time for Torlon® 4203L
600
500
400
300
200
100
0
300
250
200
150
100
50
0The
rmal
sho
ck t
emp
erat
ure
[ °F
] Therm
al shock tem
perature [ °C
]
Exposure time [ days at 57.8% RH ]25020050 100 1500
Figure 37: The elongation of Torlon® 4203L is essentially constant after exposure to simulated weathering
Elo
ngat
ion
[ % ]
14
12
10
8
6
4
2
010 100 1,000 10,000
Exposure time [ hours ]
Weather-O-meter® TestingTorlon® PAI molding polymers are exceptionally resistant to degradation by ultraviolet light . Torlon® 4203L resin did not degrade after 6,000 hours of Weather-O-meter ® exposure (Figures 37 and 38) which is roughly equivalent to five years of outdoor exposure . The bearing grades, such as 4301, contain graphite powder which renders the material black and screens UV radiation . These grades are even more resistant to degradation from outdoor exposure .
Tensile bars conforming to ASTM test method D1708 were exposed in an Atlas Sunshine Carbon Arc Weather-O-meter ® . Bars were removed after various exposure periods and tensile strength and elongation were determined . The test conditions were a black panel temperature of 63 °C (145 °F), 50 % relative humidity and an 18-minute water spray every 102 minutes .
Resistance to Gamma RadiationFigure 39 shows the negligible effect gamma radiation has on Torlon® PAI – only about 5 % loss in tensile strength after exposure to 109 rads .
Figure 38: Change in tensile strength of Torlon® 4203L with exposure to simulated weathering
Ten
sile
str
eng
th [
kpsi
] Tensile streng
th [ MP
a ]
30
25
20
15
10
5
0
200
150
100
50
0
Exposure time [ hours ]10,0001,00010 100
Figure 39: Property change of Torlon® 4203L due to gamma radiation
Cha
nge
in p
rop
erty
[ %
]
50403020100
-10-20-30-40-50
100 101 102 103 104 105 106 107 108 109
Radiation exposure level [ rads ]
ElongationTensile strengthFlexural modulus
Torlon® PAI Design Guide / 27
Electrical PropertiesMost Torlon® PAI grades provide electrical insulation . Torlon® PAI provides a unique combination of high temperature service and ease of moldability into complex electrical and electronic parts . Special grades of Torlon® PAI engineering polymer are conductive . Torlon® 7130, a conductive grade, effectively shields electromagnetic interference . The design engineer should consider the significant electrical properties of a material, such as those summarized in Table 28 .
Table 28: Important electrical considerations
Property
ASTM Test
Method Significance
Dielectric constant
D150 The ratio of the capacity of a condenser filled with the material to the capacity of an evacuated capacitor . It is a measure of the ability of the molecules to become polarized in an electric field . A low dielectric constant indicates low polarizability; thus the material can function as an insulator .
Dissipation factor
D150 A measure of the dielectric loss (energy dissipated) of alternating current to heat . A low dissipation factor indicates low dielectric loss, while a high dissipation factor indicates high loss of power to the material, which may become hot in use at high frequencies .
Volume resistivity
D257 The electrical resistance of a unit cube calculated by multiplying the resistance in ohms between the faces of the cube by the area of the faces . The higher the volume resistivity, the better the material will function as an insulator .
Surface resistivity
D257 The resistance to electric current along the surface of a one square centimeter sample of material . Higher surface resistivity indicates better insulating properties .
Dielectric strength
D149 A measure of the voltage an insulating material can take before failure (dielectric breakdown) . A high dielectric strength indicates the material is a good insulator .
Torlon® PAI Polymers for InsulatingTorlon® PAI resin has excellent electrical insulating properties and maintains them in a variety of environments . Torlon® PAI grades 4203L and 5030 have high dielectric strengths and high volume and surface resistivity as shown in Table 29 .
The Torlon® PAI grades intended for wear-resistant applications – 4301, 4275, and 4435 – contain graphite which under some conditions can conduct electricity . Although these materials have high resistivities by the ASTM test method D257, which uses direct current for its measurements, these materials may demonstrate some conductivity at higher frequencies and voltages .
Table 29: Electrical properties of Torlon® PAI resins
Grade
4203L 4301(1) 4275(1) 4435(1) 5030
Volume resistivity (ASTM D257)
ohm · cm 2 · 1017 8 · 1015 8 · 1015 2 · 107 2 · 1017
Surface resistivity (ASTM D257)
ohm 5 · 1018 8 · 1017 4 · 1017 6 · 1010 1 · 1018
Dielectric strength [1 mm (0 .040 inch)] (ASTM D149)
V/mil 580 840
kV/mm 24 33
Dielectric constant (ASTM D150)
103 Hz 4 .2 6 .0 7 .3 4 .4
106 Hz 3 .9 5 .4 6 .6 4 .2
Dissipation factor (ASTM D150)
103 Hz 0 .026 0 .037 0 .059 0 .022
106 Hz 0 .031 0 .042 0 .063 0 .023(1) Contains graphite powder. By these tests, they behave as insulators, but they may behave in a more conductive manner at high voltage or high frequency.
28 \ Torlon® PAI Design Guide
Service in Wear-Resistant ApplicationsAn Introduction to Torlon® PAI Wear-Resistant GradesNew possibilities in the design of moving parts are made available by Torlon® PAI wear-resistant grades: 4301, 4275, and 4435 . These materials offer high compressive strength and modulus, excellent creep resistance, and outstanding retention of strength and modulus at elevated temperatures, as well as self-lubricity and low coefficients of thermal expansion, which make them prime candidates for wear surfaces in severe service . Torlon® PAI bearings are dependable in lubricated, unlubricated, and marginally lubricated service . Some typical applications which lend themselves to this unique set of properties are plain bearings, thrust washers, seal rings, vanes, valve seats, bushings, and wear pads .
Bearing Design ConceptsWhenever two solids rub against each other, some wear is inevitable . The force pressing the sliding surfaces together (pressure) and the speed at which the sliding occurs (velocity) impact the rate at which wear occurs .
Wear rate relationship
The rate at which wear occurs can be related to the pressure and velocity by the following empirical equation:
t = KPVT
where:
t = wear K = wear factor determined at a given P and V P = pressure on bearing surface V = bearing surface velocity T = time
This equation seems to suggest that the wear will be directly proportional to the pressure and velocity . That would be true if the wear factor K were constant . For polymeric materials, the wear factor is not constant and varies with the pressure and velocity . The equation is only useful for calculating the wear depth at a particular PV from the wear rate at that PV and the expected service life, corrected for duty factor .
Calculating the pressure and velocity
Bearings
A typical plain bearing application consists of a sleeve bearing around a rotating shaft . To calculate the sliding velocity in meters per minute, multiply the shaft diameter in millimeters by the rpm, then by 0 .003144; or to get the velocity in feet per minute, multiply the shaft diameter in inches by the revolutions per minute (rpm), and then by 0 .262 . For example, a 12 .7 mm shaft rotating at 1,200 rpm, would have a velocity of 47 .9 meters per minute or (dividing by 60) 0 .8 meters per second . Or in US customary units, the 0 .5 inch shaft rotating at 1,200 rpm would have a velocity of 157 .2 feet per minute .
To calculate the pressure, divide the total load by the area . For sleeve bearings, the projected area is typically used, so the length of the sleeve would be multiplied by the inside diameter of the bearing as shown in Figure 40 . In the SI system, pressure is usually expressed in Pascals, which is the same as Newtons per square meter . In US customary units, the pressure is expressed in pounds per square inch .
Figure 40: Calculating bearing projected area
Projected area
Length
Insidediameter
Thrust washers
To calculate the sliding velocity of a thrust washer application, the mean diameter is typically used to determine the length per revolution . For example, a thrust washer with an outside diameter of 76 mm (3 inch) and an inside diameter of 51 mm (2 inch), would have a mean diameter of 63 .5 mm (2 .5 inch), and the distance slid per revolution would be obtained by multiplying that diameter by π or 3 .14 . That value would be multiplied by the rpm and, in the SI system, divided by 60,000 to get velocity in meters per second . In the US system, the mean diameter in inches would be multiplied by 3 .14 and the rpm, and then divided by 12 to get velocity in feet per minute . To continue the example, assume an rpm of 100, then the velocity in SI units is 63 .5 × 3 .14 × 100 ÷ 60,000, or 0 .33 meters per second . In US units, the velocity would be 2 .5 × 3 .14 × 100 ÷12, or 65 .4 feet per minute .
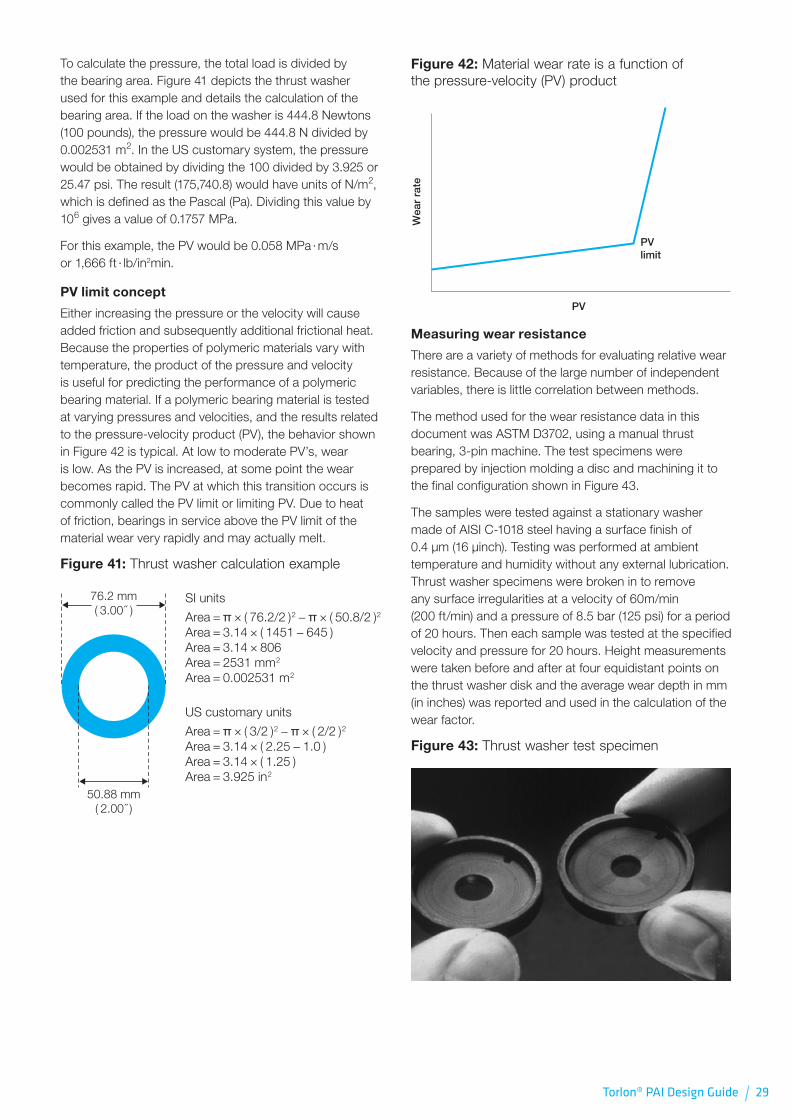
Torlon® PAI Design Guide / 29
To calculate the pressure, the total load is divided by the bearing area . Figure 41 depicts the thrust washer used for this example and details the calculation of the bearing area . If the load on the washer is 444 .8 Newtons (100 pounds), the pressure would be 444 .8 N divided by 0 .002531 m2 . In the US customary system, the pressure would be obtained by dividing the 100 divided by 3 .925 or 25 .47 psi . The result (175,740 .8) would have units of N/m2, which is defined as the Pascal (Pa) . Dividing this value by 106 gives a value of 0 .1757 MPa .
For this example, the PV would be 0 .058 MPa · m/s or 1,666 ft · lb/in2min .
PV limit concept
Either increasing the pressure or the velocity will cause added friction and subsequently additional frictional heat . Because the properties of polymeric materials vary with temperature, the product of the pressure and velocity is useful for predicting the performance of a polymeric bearing material . If a polymeric bearing material is tested at varying pressures and velocities, and the results related to the pressure-velocity product (PV), the behavior shown in Figure 42 is typical . At low to moderate PV’s, wear is low . As the PV is increased, at some point the wear becomes rapid . The PV at which this transition occurs is commonly called the PV limit or limiting PV . Due to heat of friction, bearings in service above the PV limit of the material wear very rapidly and may actually melt .
Figure 41: Thrust washer calculation example
50.88 mm( 2.00˝ )
76.2 mm( 3.00˝ )
SI units
Area = π × ( 76.2/2 )2 − π × ( 50.8/2 )2
Area = 3.14 × ( 1451 − 645 )Area = 3.14 × 806Area = 2531 mm2
Area = 0.002531 m2
US customary units
Area = π × ( 3/2 )2 − π × ( 2/2 )2
Area = 3.14 × ( 2.25 − 1.0 )Area = 3.14 × ( 1.25 )Area = 3.925 in2
Figure 42: Material wear rate is a function of the pressure-velocity (PV) product
Wea
r ra
te
PV
PVlimit
Measuring wear resistance
There are a variety of methods for evaluating relative wear resistance . Because of the large number of independent variables, there is little correlation between methods .
The method used for the wear resistance data in this document was ASTM D3702, using a manual thrust bearing, 3-pin machine . The test specimens were prepared by injection molding a disc and machining it to the final configuration shown in Figure 43 .
The samples were tested against a stationary washer made of AISI C-1018 steel having a surface finish of 0 .4 μm (16 μinch) . Testing was performed at ambient temperature and humidity without any external lubrication . Thrust washer specimens were broken in to remove any surface irregularities at a velocity of 60m/min (200 ft/min) and a pressure of 8 .5 bar (125 psi) for a period of 20 hours . Then each sample was tested at the specified velocity and pressure for 20 hours . Height measurements were taken before and after at four equidistant points on the thrust washer disk and the average wear depth in mm (in inches) was reported and used in the calculation of the wear factor .
Figure 43: Thrust washer test specimen
30 \ Torlon® PAI Design Guide
Torlon® PAI Wear-Resistant GradesLow wear factors (K) are characteristic of wear resistant materials . Fluoropolymers, which have low coefficients of friction, have very low wear factors, but limited mechanical properties and poor creep resistance . At low PV’s, Torlon® PAI wear resistant grades have wear factors comparable to filled polytetrafluoroethylene (PTFE), a fluoropolymer, but Torlon® PAI polymers offer superior creep resistance and strength .
Torlon® PAI polymers have wear factors similar to those of more expensive polyimide resins, and there is a distinct cost advantage in choosing Torlon® PAI . In addition, Torlon® PAI resins are injection moldable; polyimides are not .
The wear factors and coefficient of friction obtained when wear resistant grades of Torlon® PAI were tested at various PV’s are shown in Table 30 .
Table 30: Wear factor and coefficient of friction, dry environment
Grade
P [MPs (psi)]
PV [MPa · m/s (psi · ft/min)]
4301 4275 4630
WF(1) COF(2) WF COF WF COFVelocity – 0.25 m/s (50 ft/min)
3 .4 (500)
0 .9 (25,000)
28 .2 (14 .0)
0 .3126 .2
(13 .0)0 .31
12 .1 (6 .0)
0 .32
6 .9 (1,000)
1 .7 (50,000)
33 .2 (16 .5)
0 .2732 .2
(16 .0)0 .27
36 .3 (18 .0)
0 .29
10 .3 (1,500)
2 .6 (75,000)
30 .2 (15 .0)
0 .2434 .8 (17 .3)
0 .2428 .6
(14 .2)0 .20
13 .8 (2,000)
3 .4 (100,000)
55 .4 (27 .5)
0 .1945 .1
(22 .4)0 .18
30 .8 (15 .3)
0 .13
17 .2 (2,500)
4 .3 (125,000)
66 .9 (33 .2)
0 .1533 .8
(16 .8)0 .14
24 .6 (12 .2)
0 .11
20 .7 (3,000)
5 .2 (150,000)
NT (3) NT30 .6
(15 .2)0 .12
22 .6 (11 .2)
0 .10
Velocity – 1 m/s (200 ft/min)
0 .9 (125)
0 .9 (25,000)
38 .3 (19 .0)
0 .35 NT NT NT NT
1 .7 (250)
1 .7 (50,000)
31 .2 (15 .5)
0 .3534 .2 (17 .0)
0 .3130 .2
(15 .0)0 .32
2 .6 (375)
2 .6 (75,000)
191 .0 (94 .8)
0 .2558 .4
(29 .0)0 .24
44 .3 (22 .0)
0 .19
3 .4 (500)
3 .4 (100,000)
NT NT111 .4 (55 .3)
0 .1844 .7
(22 .2)0 .17
4 .3 (625)
4 .3 (125,000)
NT NT100 .3 (49 .8)
0 .1836 .9
(18 .3)0 .14
5 .2 (750)
5 .2 (150,000)
NT NT558 .0
(277 .0)0 .14
36 .3 (18 .0)
0 .12
Velocity – 4 m/s (800 ft/min)
0 .2 (31 .25)
0 .9 (25,000)
34 .2 (17 .0)
0 .3935 .3 (17 .5)
0 .2927 .2
(13 .5)0 .32
0 .4 (62 .5)
1 .7 (50,000)
77 .6 (38 .5)
0 .2840 .3
(20 .0)0 .34
47 .3 (23 .5)
0 .24
0 .6 (93 .75)
2 .6 (75,000)
73 .1 (36 .3)
0 .2175 .1
(37 .3)0 .21
37 .7 (18 .7)
0 .22
0 .9 (125)
3 .4 (100,000)
151 .1 (75 .0)
0 .24199 .8 (99 .2)
0 .1648 .3
(24 .0)0 .16
1 .1 (162 .5)
4 .5 (125,000)
239 .7 (119 .0)
0 .22151 .5 (75 .2)
0 .2168 .5
(34 .0)0 .14
1 .3 (187 .5)
5 .2 (150,000)
NT NT NT NT96 .7
(48 .0)0 .14
(1) WF = Wear Factor of 10-8 mm3/N · m (10-10 in3min/ft · lb · hr), (2) COF = Coefficient of Friction, (3) NT = Not Tested
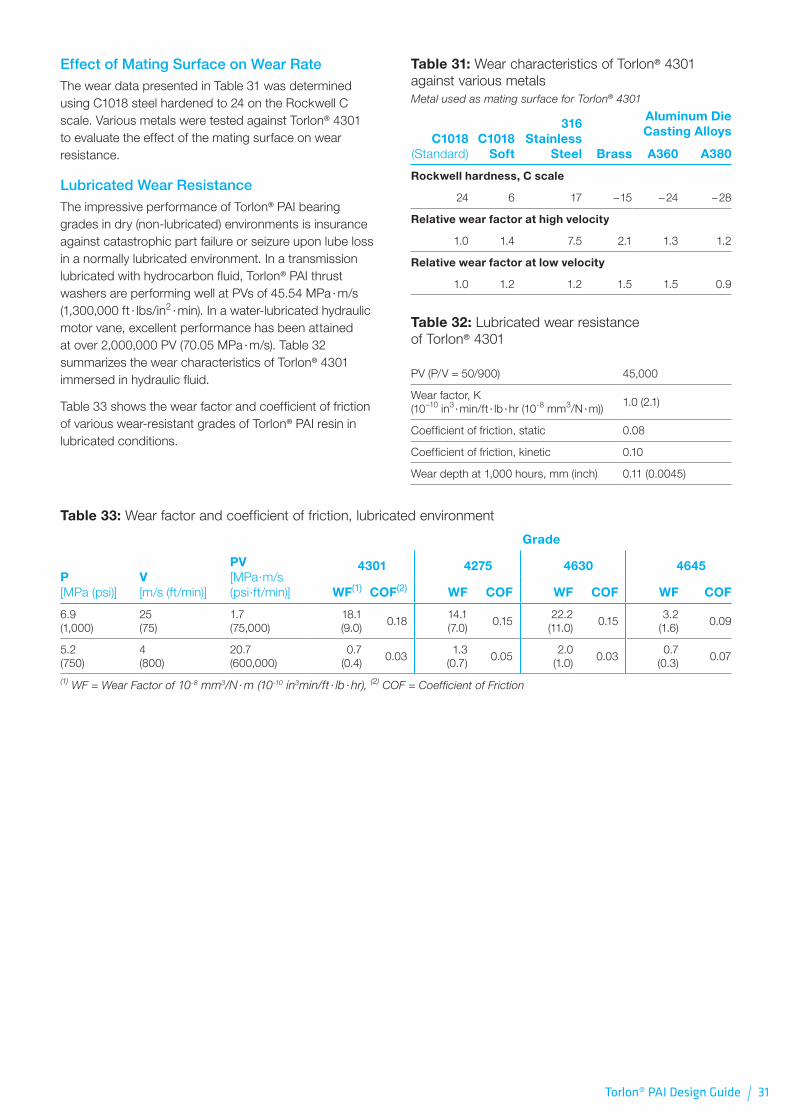
Torlon® PAI Design Guide / 31
Effect of Mating Surface on Wear RateThe wear data presented in Table 31 was determined using C1018 steel hardened to 24 on the Rockwell C scale . Various metals were tested against Torlon® 4301 to evaluate the effect of the mating surface on wear resistance .
Lubricated Wear ResistanceThe impressive performance of Torlon® PAI bearing grades in dry (non-lubricated) environments is insurance against catastrophic part failure or seizure upon lube loss in a normally lubricated environment . In a transmission lubricated with hydrocarbon fluid, Torlon® PAI thrust washers are performing well at PVs of 45 .54 MPa · m/s (1,300,000 ft · lbs/in2 · min) . In a water-lubricated hydraulic motor vane, excellent performance has been attained at over 2,000,000 PV (70 .05 MPa · m/s) . Table 32 summarizes the wear characteristics of Torlon® 4301 immersed in hydraulic fluid .
Table 33 shows the wear factor and coefficient of friction of various wear-resistant grades of Torlon® PAI resin in lubricated conditions .
Table 31: Wear characteristics of Torlon® 4301 against various metalsMetal used as mating surface for Torlon® 4301
C1018 (Standard)
C1018 Soft
316 Stainless
Steel Brass
Aluminum Die Casting Alloys
A360 A380
Rockwell hardness, C scale
24 6 17 – 15 – 24 – 28
Relative wear factor at high velocity
1 .0 1 .4 7 .5 2 .1 1 .3 1 .2
Relative wear factor at low velocity
1 .0 1 .2 1 .2 1 .5 1 .5 0 .9
Table 32: Lubricated wear resistance of Torlon® 4301
PV (P/V = 50/900) 45,000
Wear factor, K (10–10 in3 · min/ft · lb · hr (10-8 mm3/N · m))
1 .0 (2 .1)
Coefficient of friction, static 0 .08
Coefficient of friction, kinetic 0 .10
Wear depth at 1,000 hours, mm (inch) 0 .11 (0 .0045)
Table 33: Wear factor and coefficient of friction, lubricated environment
Grade
P [MPa (psi)]
V [m/s (ft/min)]
PV [MPa·m/s (psi·ft/min)]
4301 4275 4630 4645
WF(1) COF(2) WF COF WF COF WF COF
6 .9 (1,000)
25 (75)
1 .7 (75,000)
18 .1 (9 .0)
0 .1814 .1 (7 .0)
0 .1522 .2
(11 .0)0 .15
3 .2 (1 .6)
0 .09
5 .2 (750)
4 (800)
20 .7 (600,000)
0 .7 (0 .4)
0 .031 .3
(0 .7)0 .05
2 .0 (1 .0)
0 .030 .7
(0 .3)0 .07
(1) WF = Wear Factor of 10-8 mm3/N · m (10-10 in3min/ft · lb · hr), (2) COF = Coefficient of Friction
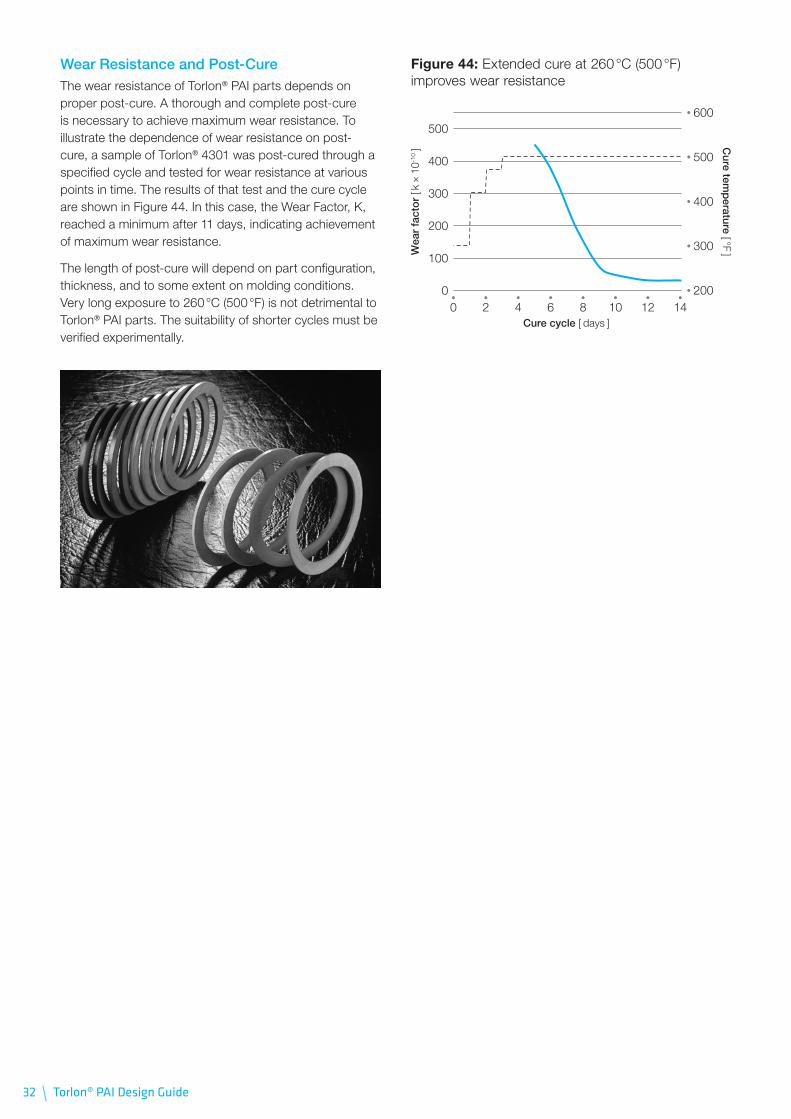
32 \ Torlon® PAI Design Guide
Wear Resistance and Post-CureThe wear resistance of Torlon® PAI parts depends on proper post-cure . A thorough and complete post-cure is necessary to achieve maximum wear resistance . To illustrate the dependence of wear resistance on post-cure, a sample of Torlon® 4301 was post-cured through a specified cycle and tested for wear resistance at various points in time . The results of that test and the cure cycle are shown in Figure 44 . In this case, the Wear Factor, K, reached a minimum after 11 days, indicating achievement of maximum wear resistance .
The length of post-cure will depend on part configuration, thickness, and to some extent on molding conditions . Very long exposure to 260 °C (500 °F) is not detrimental to Torlon® PAI parts . The suitability of shorter cycles must be verified experimentally .
Figure 44: Extended cure at 260 °C (500 °F) improves wear resistance
500
400
300
200
100
0
600
500
400
300
200
Wea
r fa
cto
r [ k
× 1
0-10 ]
Cure tem
perature [ °F ]
Cure cycle [ days ]148 12102 4 60
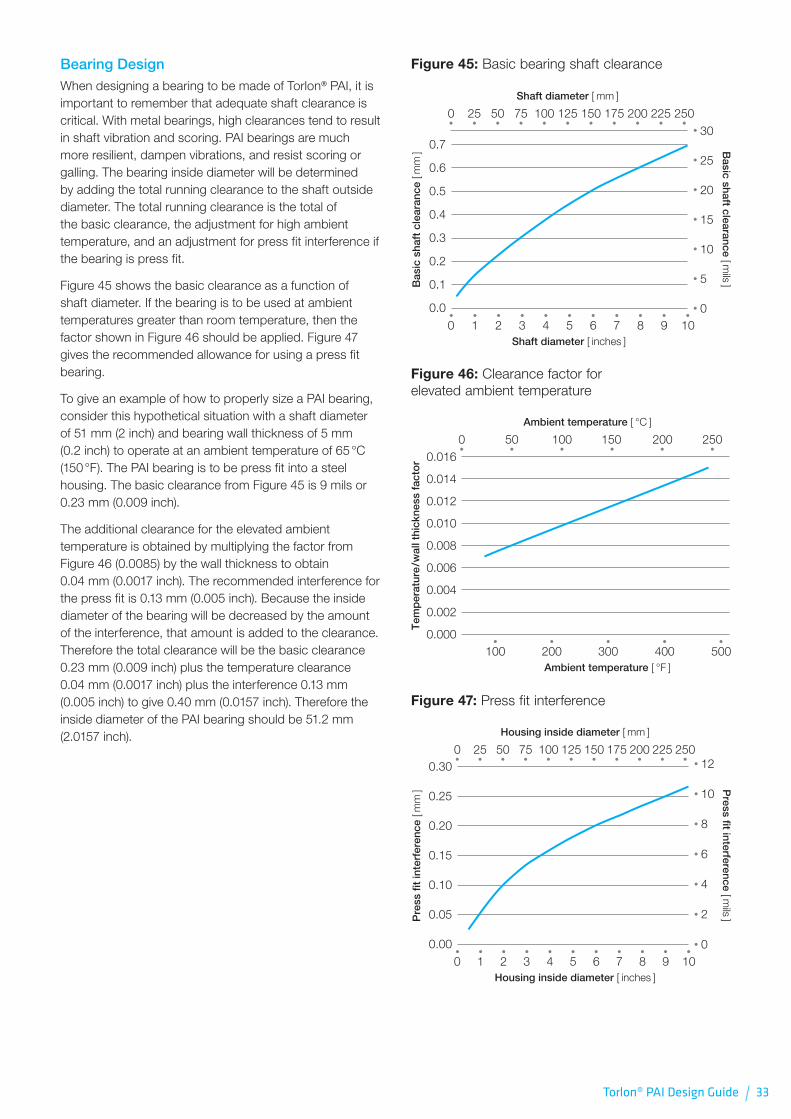
Torlon® PAI Design Guide / 33
Bearing DesignWhen designing a bearing to be made of Torlon® PAI, it is important to remember that adequate shaft clearance is critical . With metal bearings, high clearances tend to result in shaft vibration and scoring . PAI bearings are much more resilient, dampen vibrations, and resist scoring or galling . The bearing inside diameter will be determined by adding the total running clearance to the shaft outside diameter . The total running clearance is the total of the basic clearance, the adjustment for high ambient temperature, and an adjustment for press fit interference if the bearing is press fit .
Figure 45 shows the basic clearance as a function of shaft diameter . If the bearing is to be used at ambient temperatures greater than room temperature, then the factor shown in Figure 46 should be applied . Figure 47 gives the recommended allowance for using a press fit bearing .
To give an example of how to properly size a PAI bearing, consider this hypothetical situation with a shaft diameter of 51 mm (2 inch) and bearing wall thickness of 5 mm (0 .2 inch) to operate at an ambient temperature of 65 °C (150 °F) . The PAI bearing is to be press fit into a steel housing . The basic clearance from Figure 45 is 9 mils or 0 .23 mm (0 .009 inch) .
The additional clearance for the elevated ambient temperature is obtained by multiplying the factor from Figure 46 (0 .0085) by the wall thickness to obtain 0 .04 mm (0 .0017 inch) . The recommended interference for the press fit is 0 .13 mm (0 .005 inch) . Because the inside diameter of the bearing will be decreased by the amount of the interference, that amount is added to the clearance . Therefore the total clearance will be the basic clearance 0 .23 mm (0 .009 inch) plus the temperature clearance 0 .04 mm (0 .0017 inch) plus the interference 0 .13 mm (0 .005 inch) to give 0 .40 mm (0 .0157 inch) . Therefore the inside diameter of the PAI bearing should be 51 .2 mm (2 .0157 inch) .
Figure 45: Basic bearing shaft clearance
Bas
ic s
haft
cle
aran
ce [
mm
] Basic shaft clearance [ m
ils ]
0.7
0.6
0.5
0.4
0.3
0.2
0.1
0.0
30
25
20
15
10
5
0
Shaft diameter [ inches ]
Shaft diameter [ mm ]
10987654321
0 25 50 75 100 125 150 175 200 225 250
0
Figure 46: Clearance factor for elevated ambient temperature
Tem
per
atur
e/w
all t
hick
ness
fac
tor 0.016
0.014
0.012
0.010
0.008
0.006
0.004
0.002
0.000
Ambient temperature [ °F ]
Ambient temperature [ °C ]
500400300200100
0 50 100 150 200 250
Figure 47: Press fit interference
Pre
ss fi
t in
terf
eren
ce [
mm
] Press fit interference [ m
ils ]
0.30
0.25
0.20
0.15
0.10
0.05
0.00
12
10
8
6
4
2
0
Housing inside diameter [ inches ]
Housing inside diameter [ mm ]
10987654321
0 25 50 75 100 125 150 175 200 225 250
0
34 \ Torlon® PAI Design Guide
Industry and Agency Approvals
Torlon® PAI polymers have been tested successfully against many industry standards and specifications . The following list is a summary of approvals to date, but should not be considered inclusive, as work continues to qualify Torlon® PAI for a myriad of applications .
ASTM D5204 Standard Classification System for Polyamide-imide (PAI) Molding and Extrusion Materials
Grade ASTM D5204 Designation
4203L PAI000R03A56316E11FB41 or PAI011M03 or PAI021M03
4301 PAI000L15A32232E12FB42 or PAI012L15 or PAI022L15
4275 PAI000L23A22133E13FB42 or PAI012L23 or PAI022L23
4435 PAI0120R35 or PAI0220R35
4630 PAI0120R30 or PAI0220R30
4645 PAI0120R45 or PAI0220R45
5030 PAI000G30A61643E15FB46 or PAI013G30 or PAI023G30
7130 PAI000C30A51661FB47 or PAI013C30 or PAI023C30
Federal Aviation AdministrationTorlon® 5030 and 7130 pass FAA requirements for flammability, smoke density, and toxic gas emissions .
Military Specification MIL-P-46179AThis specification was cancelled on July 27, 1994 and ASTM D5204 was adopted by the Department of Defense . The following cross reference table appears in the adoption notice .
Type Class ASTM D5204
4203L I PAI000R03A56316E11FB41
4301 II 1 PAI000L15A32232E12FB42
4275 II 2 PAI000L23A22133E13FB42
5030 III 1 PAI000G30A61643E15FB46
7130 IV PAI000C30A51661FB47
National Aeronautics and Space AdministrationNHB8060 .1 “Flammability, Odor, and Offgassing Requirements and Test Procedures for Materials in Environments that Support Combustion” Torlon® 4203L and 4301 have passed the NASA spacecraft materials requirements for non-vacuum exposures per NHB8060 .1 .
Society of Automotive Engineers-Aerospace Material SpecificationsAMS 3670 is the specification for Torlon® PAI materials . The specification suggests applications requiring a low coefficient of friction, thermal stability, and toughness up to 250 °C (482 °F) . Torlon® 4203L, 4275, 4301, 5030, and 7130 are covered in the detail specifications:
AMS 3670/1-Torlon® 4203L AMS 3670/2-Torlon® 4275 AMS 3670/3-Torlon® 4301 AMS 3670/4-Torlon® 5030 AMS 3670/5-Torlon® 7130
Underwriters Laboratories
Vertical flammability
All Torlon® PAI grades have been awarded a V-0 classification . See Table 19 on page 20 .
Continuous use
The Relative Thermal Indices of Torlon® 4203L, 4301, and 5030 are shown in Table 10 on page 14 .
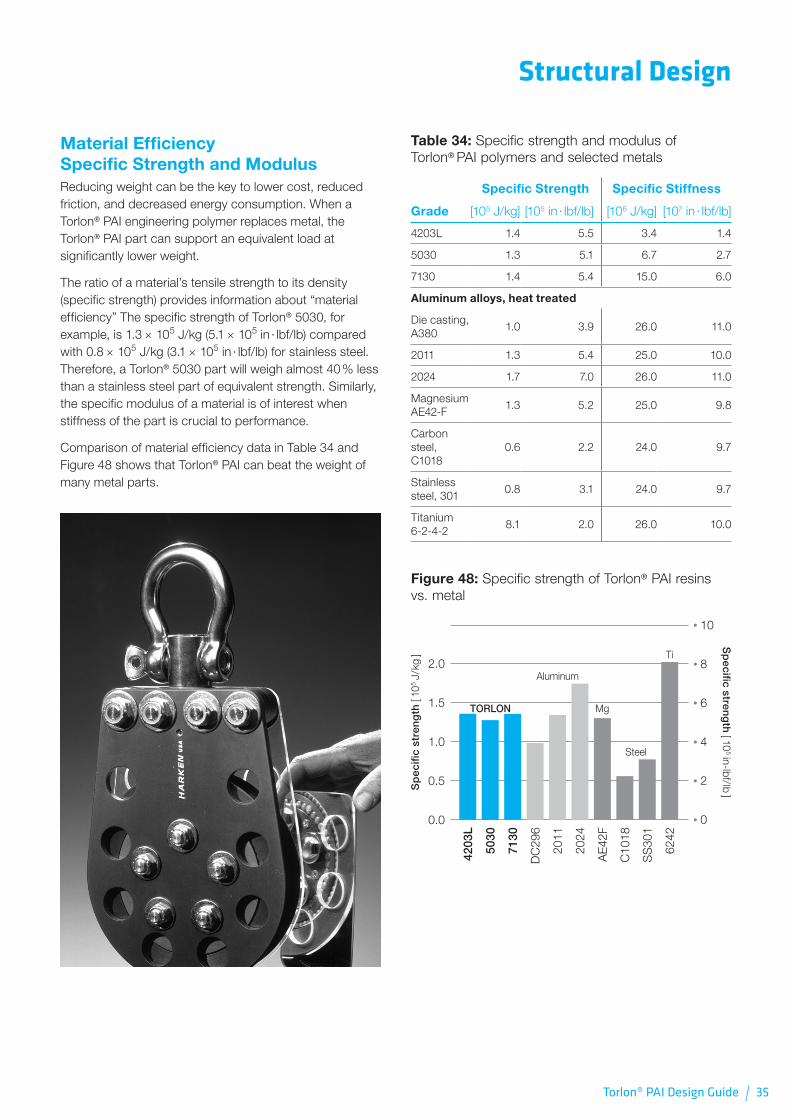
Torlon® PAI Design Guide / 35
Structural Design
Material Efficiency Specific Strength and ModulusReducing weight can be the key to lower cost, reduced friction, and decreased energy consumption . When a Torlon® PAI engineering polymer replaces metal, the Torlon® PAI part can support an equivalent load at significantly lower weight .
The ratio of a material’s tensile strength to its density (specific strength) provides information about “material efficiency” The specific strength of Torlon® 5030, for example, is 1 .3 × 105 J/kg (5 .1 × 105 in · lbf/lb) compared with 0 .8 × 105 J/kg (3 .1 × 105 in · lbf/lb) for stainless steel . Therefore, a Torlon® 5030 part will weigh almost 40 % less than a stainless steel part of equivalent strength . Similarly, the specific modulus of a material is of interest when stiffness of the part is crucial to performance .
Comparison of material efficiency data in Table 34 and Figure 48 shows that Torlon® PAI can beat the weight of many metal parts .
Table 34: Specific strength and modulus of Torlon® PAI polymers and selected metals
Specific Strength Specific Stiffness
Grade [105 J/kg] [105 in · lbf/lb] [106 J/kg] [107 in · lbf/lb]
4203L 1 .4 5 .5 3 .4 1 .4
5030 1 .3 5 .1 6 .7 2 .7
7130 1 .4 5 .4 15 .0 6 .0
Aluminum alloys, heat treated
Die casting, A380
1 .0 3 .9 26 .0 11 .0
2011 1 .3 5 .4 25 .0 10 .0
2024 1 .7 7 .0 26 .0 11 .0
Magnesium AE42-F
1 .3 5 .2 25 .0 9 .8
Carbon steel, C1018
0 .6 2 .2 24 .0 9 .7
Stainless steel, 301
0 .8 3 .1 24 .0 9 .7
Titanium 6-2-4-2
8 .1 2 .0 26 .0 10 .0
Figure 48: Specific strength of Torlon® PAI resins vs . metal
2.0
1.5
1.0
0.5
0.0
10
8
6
4
2
0
Sp
ecifi
c st
ren
gth
[ 10
5 J/k
g ]
Sp
ecific streng
th [ 10
5 in-lbf/lb ]
TORLON
Aluminum
Mg
Steel
Ti
4203
L
2011
2024
5030
7130
DC
296
AE
42F
C10
18
6242
SS
301
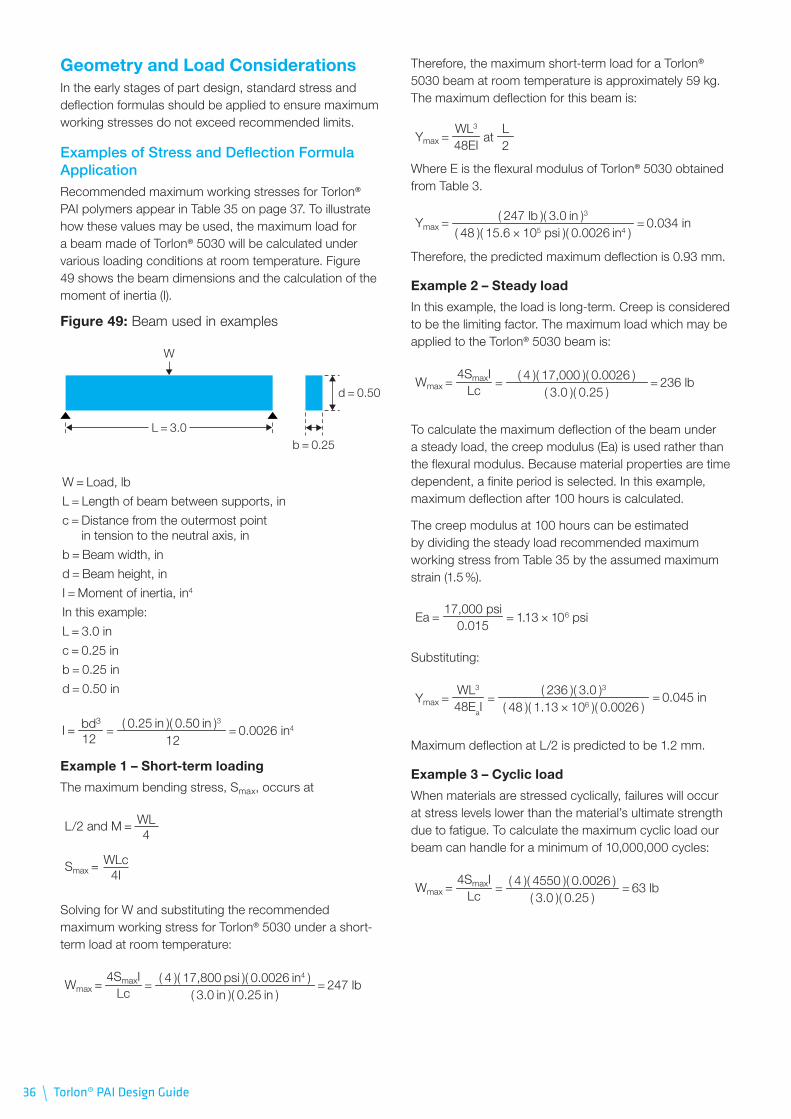
36 \ Torlon® PAI Design Guide
Geometry and Load ConsiderationsIn the early stages of part design, standard stress and deflection formulas should be applied to ensure maximum working stresses do not exceed recommended limits .
Examples of Stress and Deflection Formula ApplicationRecommended maximum working stresses for Torlon® PAI polymers appear in Table 35 on page 37 . To illustrate how these values may be used, the maximum load for a beam made of Torlon® 5030 will be calculated under various loading conditions at room temperature . Figure 49 shows the beam dimensions and the calculation of the moment of inertia (I) .
Figure 49: Beam used in examples
L = 3.0
d = 0.50
b = 0.25
W
W = Load, lb
L = Length of beam between supports, in
c = Distance from the outermost point in tension to the neutral axis, in
b = Beam width, in
d = Beam height, in
I = Moment of inertia, in4
In this example:
L = 3.0 in
c = 0.25 in
b = 0.25 in
d = 0.50 in
0.0026 in4 = ( 0.25 in )( 0.50 in )3
12 = bd3
I = 12
Example 1 – Short-term loading
The maximum bending stress, Smax, occurs at
WLcSmax = 4I
WLL/2 and M = 4
Solving for W and substituting the recommended maximum working stress for Torlon® 5030 under a short-term load at room temperature:
247 lb = ( 4 )( 17,800 psi )( 0.0026 in4 )( 3.0 in )( 0.25 in )
= 4SmaxIWmax =
Lc
Therefore, the maximum short-term load for a Torlon® 5030 beam at room temperature is approximately 59 kg .The maximum deflection for this beam is:
L2
at WL3
Ymax = 48EI
Where E is the flexural modulus of Torlon® 5030 obtained from Table 3 .
0.034 in = ( 247 lb )( 3.0 in )3
( 48 )( 15.6 × 10⁵ psi )( 0.0026 in4 )Ymax =
Therefore, the predicted maximum deflection is 0 .93 mm .
Example 2 – Steady load
In this example, the load is long-term . Creep is considered to be the limiting factor . The maximum load which may be applied to the Torlon® 5030 beam is:
236 lb = ( 4 )( 17,000 )( 0.0026 )( 3.0 )( 0.25 )
= 4SmaxIWmax =
Lc
To calculate the maximum deflection of the beam under a steady load, the creep modulus (Ea) is used rather than the flexural modulus . Because material properties are time dependent, a finite period is selected . In this example, maximum deflection after 100 hours is calculated .
The creep modulus at 100 hours can be estimated by dividing the steady load recommended maximum working stress from Table 35 by the assumed maximum strain (1 .5 %) .
= 1.13 × 10⁶ psi17,000 psi
Ea = 0.015
Substituting:
WL3
Ymax = 48EaI
0.045 in = ( 236 )( 3.0 )3
( 48 )( 1.13 × 10⁶ )( 0.0026 ) =
Maximum deflection at L/2 is predicted to be 1 .2 mm .
Example 3 – Cyclic load
When materials are stressed cyclically, failures will occur at stress levels lower than the material’s ultimate strength due to fatigue . To calculate the maximum cyclic load our beam can handle for a minimum of 10,000,000 cycles:
63 lb = ( 4 )( 4550 )( 0.0026 )( 3.0 )( 0.25 )
= 4SmaxIWmax =
Lc
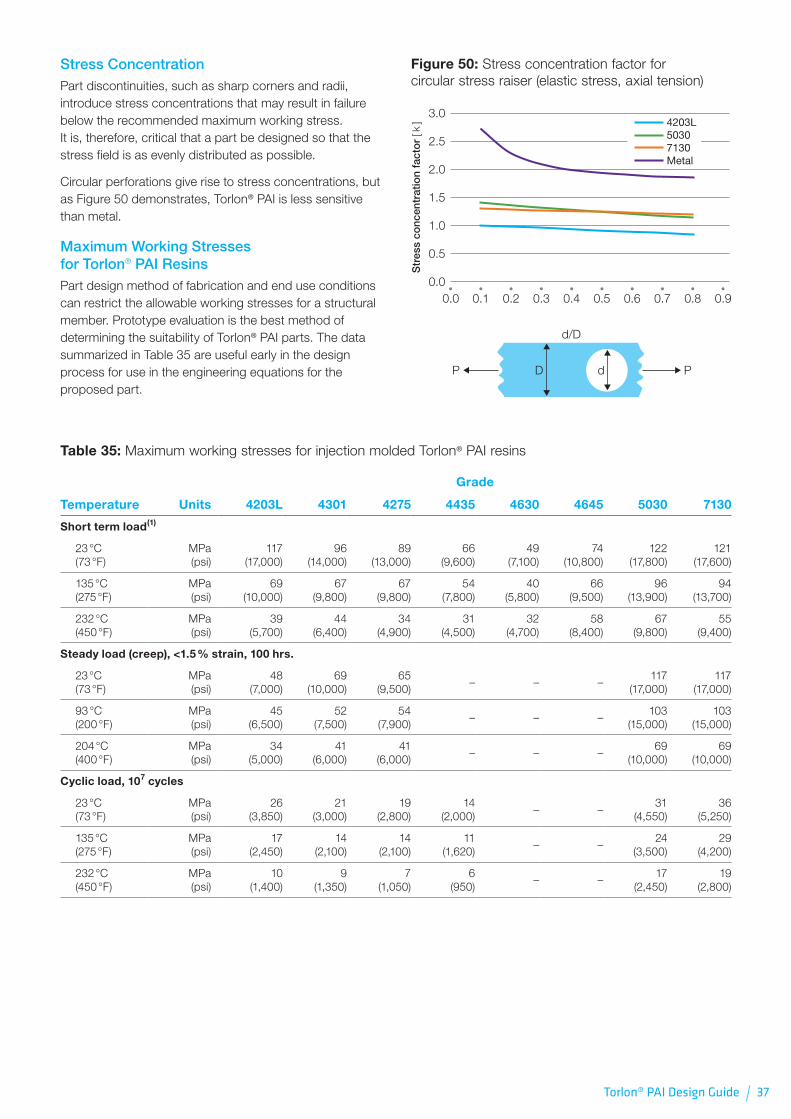
Torlon® PAI Design Guide / 37
Stress ConcentrationPart discontinuities, such as sharp corners and radii, introduce stress concentrations that may result in failure below the recommended maximum working stress . It is, therefore, critical that a part be designed so that the stress field is as evenly distributed as possible .
Circular perforations give rise to stress concentrations, but as Figure 50 demonstrates, Torlon® PAI is less sensitive than metal .
Maximum Working Stresses for Torlon® PAI ResinsPart design method of fabrication and end use conditions can restrict the allowable working stresses for a structural member . Prototype evaluation is the best method of determining the suitability of Torlon® PAI parts . The data summarized in Table 35 are useful early in the design process for use in the engineering equations for the proposed part .
Figure 50: Stress concentration factor for circular stress raiser (elastic stress, axial tension)
dDP P
d/D
Str
ess
conc
entr
atio
n fa
cto
r [ k
]
3.0
2.5
2.0
1.5
1.0
0.5
0.00.40.30.20.10.0 0.5 0.6 0.7 0.8 0.9
4203L50307130Metal
Table 35: Maximum working stresses for injection molded Torlon® PAI resins
Grade
Temperature Units 4203L 4301 4275 4435 4630 4645 5030 7130
Short term load(1)
23 °C (73 °F)
MPa (psi)
117 (17,000)
96 (14,000)
89 (13,000)
66 (9,600)
49 (7,100)
74 (10,800)
122 (17,800)
121 (17,600)
135 °C (275 °F)
MPa (psi)
69 (10,000)
67 (9,800)
67 (9,800)
54 (7,800)
40 (5,800)
66 (9,500)
96 (13,900)
94 (13,700)
232 °C (450 °F)
MPa (psi)
39 (5,700)
44 (6,400)
34 (4,900)
31 (4,500)
32 (4,700)
58 (8,400)
67 (9,800)
55 (9,400)
Steady load (creep), <1.5 % strain, 100 hrs.
23 °C (73 °F)
MPa (psi)
48 (7,000)
69 (10,000)
65 (9,500)
– – –117
(17,000)117
(17,000)
93 °C (200 °F)
MPa (psi)
45 (6,500)
52 (7,500)
54 (7,900)
– – –103
(15,000)103
(15,000)
204 °C (400 °F)
MPa (psi)
34 (5,000)
41 (6,000)
41 (6,000)
– – –69
(10,000)69
(10,000)
Cyclic load, 107 cycles
23 °C (73 °F)
MPa (psi)
26 (3,850)
21 (3,000)
19 (2,800)
14 (2,000)
– –31
(4,550)36
(5,250)
135 °C (275 °F)
MPa (psi)
17 (2,450)
14 (2,100)
14 (2,100)
11 (1,620)
– –24
(3,500)29
(4,200)
232 °C (450 °F)
MPa (psi)
10 (1,400)
9 (1,350)
7 (1,050)
6 (950)
– –17
(2,450)19
(2,800)
38 \ Torlon® PAI Design Guide
Designing with Torlon® PAI Resin
Fabrication OptionsTorlon® PAI can be molded using any of three conventional molding techniques; injection molding, extrusion and compression molding . Each has advantages and limitations .
Injection MoldingTorlon® PAI parts can be injection molded to fine detail . Of the three methods, injection molding produces parts of the highest strength . When a large quantity of complex parts is required, injection molding can be the most economical technique due to short cycle times and excellent replication . Part thickness is limited by the flow length versus thickness relationship of the polymer . Thickness is limited to a maximum of 15 .9 mm (0 .625 inch) .
ExtrusionTorlon® PAI polymers can be extruded into profiles and shapes such as rods, tubing, sheet, film and plates . Small parts with simple geometries can be economically produced by combining extrusion molding and automatic screw machining . Torlon® PAI rod and plate stock are available in a variety of sizes .
Compression MoldingLarge parts over 15 .9 mm (0 .625 inch) thick must be compression-molded . Tooling costs are considerably lower compared with other molding techniques . Compression-molded parts will generally be lower in strength than comparable injection-molded or extruded parts, but have lower stresses and are therefore easier to machine . Compression molded rod, OD/ID tube combinations and compression molded plates are available in a variety of sizes and thickness . Contact your Solvay Specialty Polymers representative for information on approved sources .
Post-Curing Torlon® PAI PartsTorlon® PAI parts must be post-cured . Optimal properties, especially chemical and wear resistance, are only achieved with thorough post-cure . Best results are obtained when Torlon® PAI parts are cured through a cycle of increasing temperature . Cure cycle parameters are a function of the size and geometry of a particular part .
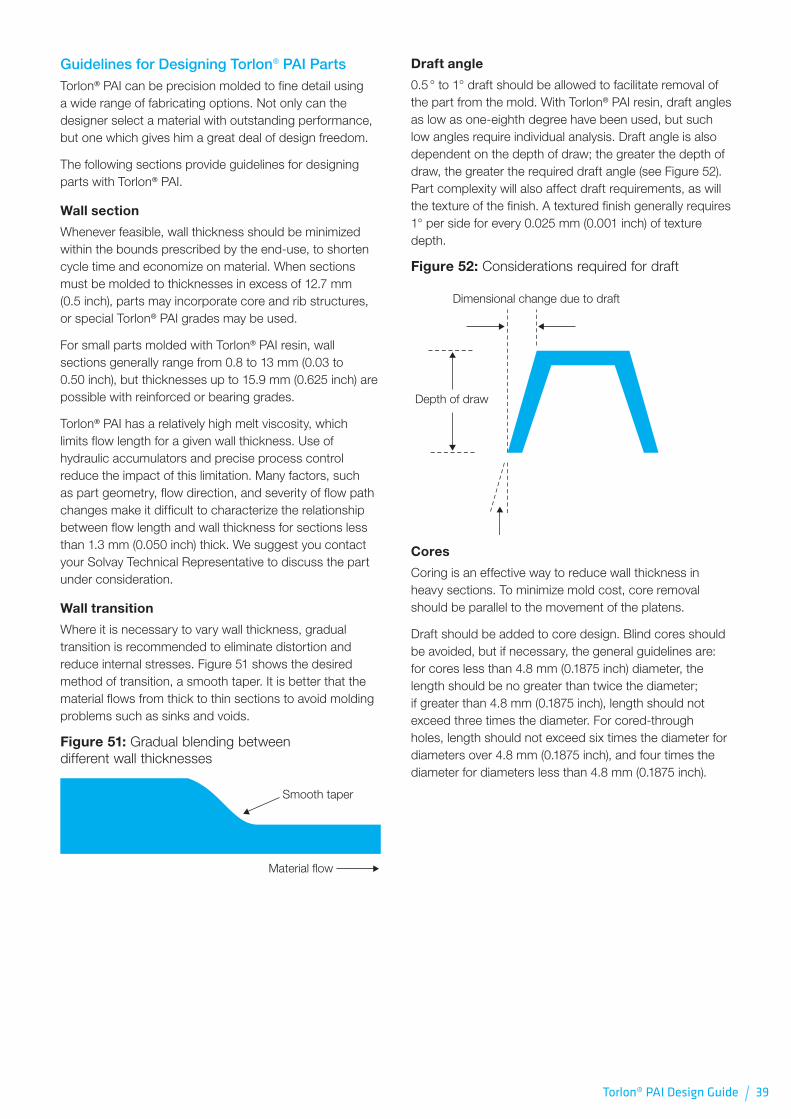
Torlon® PAI Design Guide / 39
Guidelines for Designing Torlon® PAI PartsTorlon® PAI can be precision molded to fine detail using a wide range of fabricating options . Not only can the designer select a material with outstanding performance, but one which gives him a great deal of design freedom .
The following sections provide guidelines for designing parts with Torlon® PAI .
Wall section
Whenever feasible, wall thickness should be minimized within the bounds prescribed by the end-use, to shorten cycle time and economize on material . When sections must be molded to thicknesses in excess of 12 .7 mm (0 .5 inch), parts may incorporate core and rib structures, or special Torlon® PAI grades may be used .
For small parts molded with Torlon® PAI resin, wall sections generally range from 0 .8 to 13 mm (0 .03 to 0 .50 inch), but thicknesses up to 15 .9 mm (0 .625 inch) are possible with reinforced or bearing grades .
Torlon® PAI has a relatively high melt viscosity, which limits flow length for a given wall thickness . Use of hydraulic accumulators and precise process control reduce the impact of this limitation . Many factors, such as part geometry, flow direction, and severity of flow path changes make it difficult to characterize the relationship between flow length and wall thickness for sections less than 1 .3 mm (0 .050 inch) thick . We suggest you contact your Solvay Technical Representative to discuss the part under consideration .
Wall transition
Where it is necessary to vary wall thickness, gradual transition is recommended to eliminate distortion and reduce internal stresses . Figure 51 shows the desired method of transition, a smooth taper . It is better that the material flows from thick to thin sections to avoid molding problems such as sinks and voids .
Figure 51: Gradual blending between different wall thicknesses
Smooth taper
Material flow
Draft angle
0 .5 ° to 1° draft should be allowed to facilitate removal of the part from the mold . With Torlon® PAI resin, draft angles as low as one-eighth degree have been used, but such low angles require individual analysis . Draft angle is also dependent on the depth of draw; the greater the depth of draw, the greater the required draft angle (see Figure 52) . Part complexity will also affect draft requirements, as will the texture of the finish . A textured finish generally requires 1° per side for every 0 .025 mm (0 .001 inch) of texture depth .
Figure 52: Considerations required for draft
Dimensional change due to draft
Depth of draw
Draft angleCores
Coring is an effective way to reduce wall thickness in heavy sections . To minimize mold cost, core removal should be parallel to the movement of the platens .
Draft should be added to core design . Blind cores should be avoided, but if necessary, the general guidelines are: for cores less than 4 .8 mm (0 .1875 inch) diameter, the length should be no greater than twice the diameter; if greater than 4 .8 mm (0 .1875 inch), length should not exceed three times the diameter . For cored-through holes, length should not exceed six times the diameter for diameters over 4 .8 mm (0 .1875 inch), and four times the diameter for diameters less than 4 .8 mm (0 .1875 inch) .
40 \ Torlon® PAI Design Guide
Ribs
Ribs can increase the stiffness of Torlon® PAI parts without increasing section thickness . The width of the rib at the base should be equal the thickness of the adjacent wall to avoid backfill . Ribs should be tapered for mold release .
Bosses
Bosses are commonly used to facilitate alignment during assembly, but may serve other functions . In general, the outer diameter of a boss should be equal to or greater than twice the inside diameter of the hole, and the wall thickness of the boss should be less than or equal to the adjacent wall thickness .
Undercuts
It is not possible to mold undercuts in Torlon® PAI parts unless side pulls are used . To minimize mold costs, undercuts should be avoided . If it is necessary, external undercuts can be accommodated by use of a side pull, but internal undercuts require collapsing or removable cores .
Molded-in inserts
Threads molded into Torlon® PAI parts have good pull-out strength, but if greater strength is needed, metal inserts can be molded-in . Torlon® PAI resins have low coefficients of thermal expansion, making them excellent materials for applications integrating plastic and metal . For ease of molding, inserts should be situated perpendicular to the parting line and should be supported so they are not displaced during injection of the molten plastic . Inserts should be preheated to the temperature of the mold .
Table 36 defines the ratio of the wall thickness of polymer around the insert to the outer diameter of the insert for common insert materials . Sufficient polymer surrounding the insert is necessary for strength .
Table 36: Wall thickness/insert Outer Diameter (OD) relationship
Insert MaterialRatio of Wall Thickness
to Insert OD
Steel 1 .2
Brass 1 .1
Aluminum 1 .0
Threads
Threads can be molded-in . Both internal and external threads can be molded using normal molding practices to Class 2 tolerance using Torlon® PAI resins . Class 3 can be molded using very high precision tooling . In general, it is more economical to machine threads for short runs . Table 39 on page 42 shows the screw holding strength of Torlon® PAI threads .
Holes
Holes can serve a variety of functions . Electrical connectors, for example, have numerous small holes in close proximity . Associated with each hole is a weld line which potentially is a weak point . The degree of weakness is related to flow distance, part geometry, and the thickness of the wall surrounding the hole . Because Torlon® PAI resins can be molded to close tolerances, and can be molded to thin cross sections without cracking, they are excellent materials for this type of part; however, each application must be considered on an individual basis due to the complexity of design variables .
Torlon® PAI Design Guide / 41
Secondary Operations
JoiningTorlon® PAI parts can be joined mechanically or with adhesives .
Mechanical Joining TechniquesThe dimensional stability and creep resistance of Torlon® PAI allows it to be readily joined with metal components even in rotating or sliding assemblies .
Snap-fit: Economical and simple
Snap-fit is an economical and simple method of joining Torlon® PAI parts . Although the strain limit must be considered for a snap-fit assembly that will be repeatedly assembled and disassembled, Torlon® PAI polymers are excellent for this type of use, due to the superior fatigue strength of polyamide-imide . The high modulus, elongation, and low creep of Torlon® PAI resins also make them well suited for snap-fit designs . Snap-in fingers in the locked position should be strain-free, or under a level of stress which can be tolerated by the material . Torlon® PAI resins can tolerate up to 10 % strain for the unfilled grades, and 5 % strain for filled grades . Graphite-fiber-reinforced grades are not suitable for snap-fit assembly .
Threaded Fasteners
Self-tapping screws
In general, Torlon® PAI is too tough for self-tapping screws . Tapped holes are recommended .
Molded-in inserts
Metal inserts can be molded into Torlon® PAI parts . Preheating the insert to the temperature of the mold is required for best results . While polyamide-imide has low shrink, it is still important to have sufficient material around the insert to distribute the stress induced by shrinkage .
Threaded mechanical inserts
Self-threading, self-locking inserts provide a high-strength, low-stress option for joining Torlon® PAI parts . These metal inserts have an exterior “locking” feature for anchorage in the Torlon® PAI part and allow for repeated assembly and disassembly through the threaded interior . HeliCoil® inserts from HeliCoil Products, division of Mite Corporation, and SpeedSerts® inserts from Tridair Fasteners, Rexnord, Incorporated, are examples of this type of insert .
Table 37 gives the tensile strength of HeliCoil® inserts in Torlon® 4203L and 5030 . It is the axial force required to pull the insert at least 0 .51 mm (0 .020 inch) out of Torlon® PAI specimens .
Table 37: Strength of HeliCoil® inserts
Tensile Strength
Thread Size #4-40 #6-32 #8-32 #10-32 ¼"-20
Engagement
mm 5 .7 7 .0 8 .3 9 .6 12 .7
inch 0 .224 0 .276 0 .328 0 .380 0 .500
4203L
N 3,870 6,540 8,180 9,790 12,600
lbf 870 1,470 1,840 2,200 2,830
5030
N 4,310 7,560 9,520 13,100 23,100
lbf 970 1,700 2,140 2,940 5,200
Molded-in threads
Both external and internal threads can be molded with Torlon® PAI polymer to a Class 2 tolerance . Mating parts with metal fasteners in Torlon® PAI threads works well because the thermal expansion of Torlon® PAI is close to that of metal, so there is relatively low thermal stress at the metal-to-plastic interface . Due to the increase in mold cost, it is generally advisable to machine threads for short runs .
Strength of bolts made of Torlon® PAI resin
Threaded fasteners molded from Torlon® PAI polymers are dependable because of the high strength, modulus, and load-bearing characteristics of Torlon® PAI polymers . Bolts were injection molded from Torlon® 4203L and 5030 then tested for tensile strength, elongation, and torque limit (Table 38) . The bolts were 6 .3 mm (0 .25 inch) diameter, type 28TPI with class 2A threads . Tensile strength calculations were based on 0 .235 cm2 (0 .0364 in2) cross sectioned area . Torque tests were conducted by tightening the bolts on a steel plate with steel washers and nuts . Maximum shear torque was determined using a torque wrench graduated in inch-pounds .
Table 38: Strength of Torlon® PAI bolts
Tensile Strength Elongation
Shear Torque
Grade [MPa] [psi] [%] [Nm] [inch · lb]
4203L 125 18,200 9 .5 3 .2 28 .6
5030 127 18,400 6 .6 3 .1 27 .2
42 \ Torlon® PAI Design Guide
Screw holding strength
Metal screws can securely join threaded Torlon® PAI parts . Holes for #4 – 40 screws were drilled and tapped in 4 .8 mm (0 .19 inch) thick Torlon® PAI plaques . Screw pull-out strength determined by ASTM D1761 appears in Table 39 . Crosshead speed was 2 .5 mm (0 .1 inch) per minute . The span between the plaque and the screw holding fixture was 27 mm (1 .08 inch) .
Table 39: Screw holding strength of threads in Torlon® PAI
Pull-out Strength Engagement Threads per HoleGrade [kg] [lb]
4203L 240 540 7 .5
4275 180 400 7 .7
4301 200 460 7 .8
Interference fits
Interference, or press, fits provide joints with good strength at minimum cost . Torlon® PAI engineering polymer is ideal for this joining technique due to its resistance to creep . Diametrical interference, actual service temperature, and load conditions should be evaluated to determine if stresses are within design limits .
Ultrasonic inserts
Metal inserts can be imbedded in uncured Torlon® PAI parts by ultrasonic insertion . Inserts are installed rapidly with strength comparable to that provided by molded-in techniques . A hole is molded slightly smaller than the insert . The metal insert is brought in contact with the Torlon® PAI part . Vibration in excess of 18 kHz is applied to the metal insert, creating frictional heat which melts the plastic . High strength is achieved if sufficient plastic flows around knurls, threads, etc .
Other mechanical joining techniques
Because post-cured Torlon® PAI parts are extremely tough, some joining techniques will not be suitable . Expansion inserts are generally not recommended; however, each application should be considered on an individual basis .
Bonding with AdhesivesTorlon® PAI parts can be joined with commercial adhesives, extending design options . It is a good practice to consult the adhesive supplier concerning the requirements of your application .
Adhesive choice
A variety of adhesives including amide-imide, epoxy, and cyanoacrylate can be used to bond Torlon® PAI parts . Cyanoacrylates have poor environmental resistance and are not recommended . Silicone, acrylic, and urethane adhesives are generally not recommended unless environment conditions preclude other options . The amide-imide adhesive is made by dissolving 35 parts of Torlon® 4000T PAI powder in 65 parts of N-methylpyrrolidone .
Warning! NMP is a flammable organic solvent and the appropriate handling procedures recommended by EPA, NIOSH, and OSHA should be followed . Adequate ventilation is necessary when using solvents .
Bonding various Torlon® PAI grades
Torlon® PAI resin grades 4203L, 5030, and 7130 are relatively easy to bond . Bearing grades 4301, 4275, and 4435 have inherent lubricity, and are more difficult to bond . Table 40 compares the shear strengths of these grades bonded with epoxy, cyanoacrylate, and amide-imide adhesives .
Post-cured Torlon® PAI bars, 64 × 13 × 3 mm (2 .5 × 0 .5 × 0 .12 inch) were lightly abraded, wiped with acetone, then bonded with a 13 mm (0 .5 inch) overlap . The clamped parts were cured per the adhesive manufacturer’s recommendations . After 7 days at room temperature, bonds were pulled apart with a tensile testing machine at a crosshead speed of 1 .3 mm per minute (0 .05 inch per minute) . If failure occurred outside the bond area, the process was repeated with progressively smaller bond areas, to a minimum overlap of 3 .2 mm (0 .125 inch) .
Surface preparation
Bonding surfaces should be free of contaminants, such as oil, hydraulic fluid, and dust . Torlon® PAI parts should be dried for at least 24 hours at 149 °C (300 °F) In a desiccant oven (thicker parts, over 6 .3 mm (0 .25 inch), require longer drying time) to dispel casual moisture prior to bonding . Torlon® PAI surfaces should be mechanically abraded and solvent-wiped, or treated with a plasma arc to enhance adhesion .
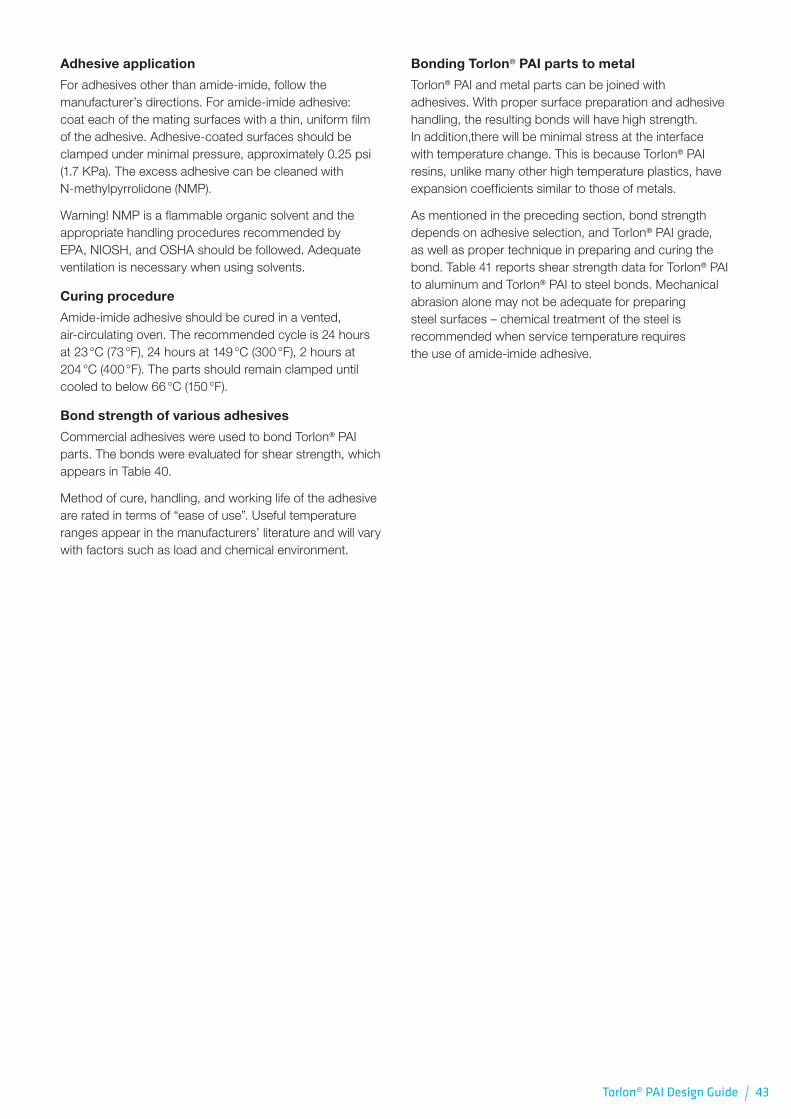
Torlon® PAI Design Guide / 43
Adhesive application
For adhesives other than amide-imide, follow the manufacturer’s directions . For amide-imide adhesive: coat each of the mating surfaces with a thin, uniform film of the adhesive . Adhesive-coated surfaces should be clamped under minimal pressure, approximately 0 .25 psi (1 .7 KPa) . The excess adhesive can be cleaned with N-methylpyrrolidone (NMP) .
Warning! NMP is a flammable organic solvent and the appropriate handling procedures recommended by EPA, NIOSH, and OSHA should be followed . Adequate ventilation is necessary when using solvents .
Curing procedure
Amide-imide adhesive should be cured in a vented, air-circulating oven . The recommended cycle is 24 hours at 23 °C (73 °F), 24 hours at 149 °C (300 °F), 2 hours at 204 °C (400 °F) . The parts should remain clamped until cooled to below 66 °C (150 °F) .
Bond strength of various adhesives
Commercial adhesives were used to bond Torlon® PAI parts . The bonds were evaluated for shear strength, which appears in Table 40 .
Method of cure, handling, and working life of the adhesive are rated in terms of “ease of use” . Useful temperature ranges appear in the manufacturers’ literature and will vary with factors such as load and chemical environment .
Bonding Torlon® PAI parts to metal
Torlon® PAI and metal parts can be joined with adhesives . With proper surface preparation and adhesive handling, the resulting bonds will have high strength . In addition,there will be minimal stress at the interface with temperature change . This is because Torlon® PAI resins, unlike many other high temperature plastics, have expansion coefficients similar to those of metals .
As mentioned in the preceding section, bond strength depends on adhesive selection, and Torlon® PAI grade, as well as proper technique in preparing and curing the bond . Table 41 reports shear strength data for Torlon® PAI to aluminum and Torlon® PAI to steel bonds . Mechanical abrasion alone may not be adequate for preparing steel surfaces – chemical treatment of the steel is recommended when service temperature requires the use of amide-imide adhesive .
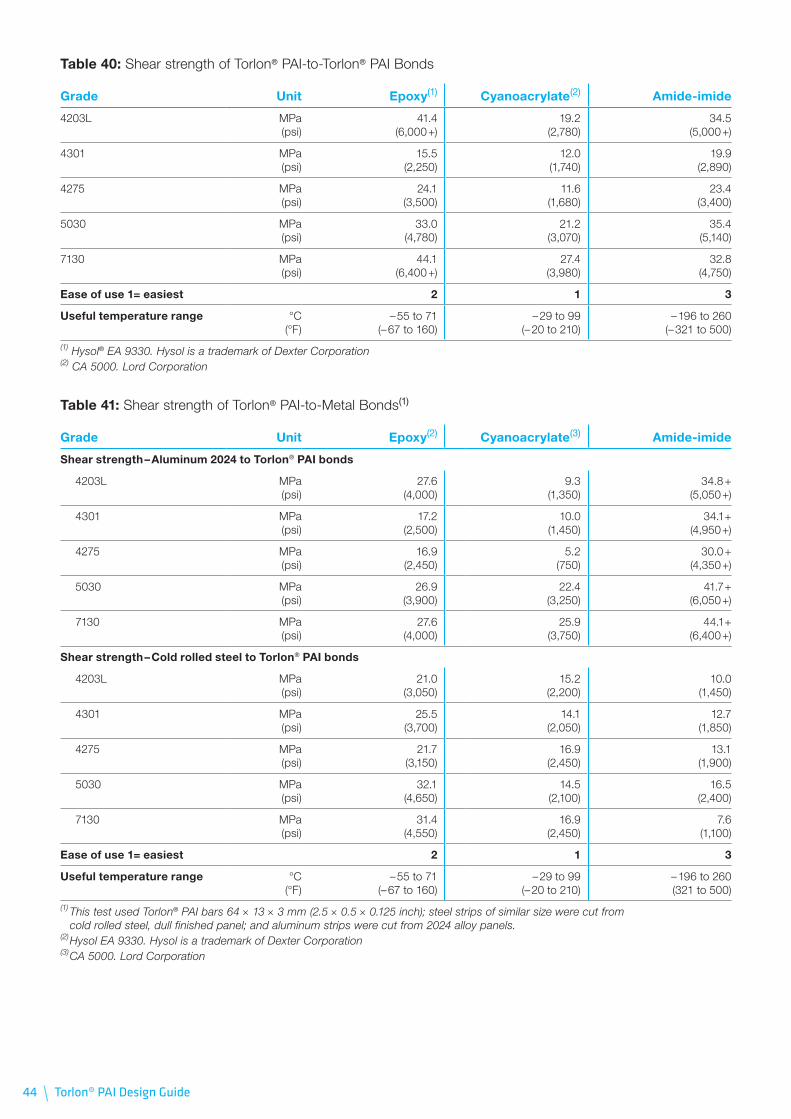
44 \ Torlon® PAI Design Guide
Table 40: Shear strength of Torlon® PAI-to-Torlon® PAI Bonds
Grade Unit Epoxy(1) Cyanoacrylate(2) Amide-imide
4203L MPa (psi)
41 .4 (6,000 +)
19 .2 (2,780)
34 .5 (5,000 +)
4301 MPa (psi)
15 .5 (2,250)
12 .0 (1,740)
19 .9 (2,890)
4275 MPa (psi)
24 .1 (3,500)
11 .6 (1,680)
23 .4 (3,400)
5030 MPa (psi)
33 .0 (4,780)
21 .2 (3,070)
35 .4 (5,140)
7130 MPa (psi)
44 .1 (6,400 +)
27 .4 (3,980)
32 .8 (4,750)
Ease of use 1= easiest 2 1 3
Useful temperature range °C (°F)
– 55 to 71 (– 67 to 160)
– 29 to 99 (– 20 to 210)
– 196 to 260 (– 321 to 500)
(1) Hysol® EA 9330. Hysol is a trademark of Dexter Corporation(2) CA 5000. Lord Corporation
Table 41: Shear strength of Torlon® PAI-to-Metal Bonds(1)
Grade Unit Epoxy(2) Cyanoacrylate(3) Amide-imide
Shear strength – Aluminum 2024 to Torlon® PAI bonds
4203L MPa (psi)
27 .6 (4,000)
9 .3 (1,350)
34 .8 + (5,050 +)
4301 MPa (psi)
17 .2 (2,500)
10 .0 (1,450)
34 .1 + (4,950 +)
4275 MPa (psi)
16 .9 (2,450)
5 .2 (750)
30 .0 + (4,350 +)
5030 MPa (psi)
26 .9 (3,900)
22 .4 (3,250)
41 .7 + (6,050 +)
7130 MPa (psi)
27 .6 (4,000)
25 .9 (3,750)
44 .1 + (6,400 +)
Shear strength – Cold rolled steel to Torlon® PAI bonds
4203L MPa (psi)
21 .0 (3,050)
15 .2 (2,200)
10 .0 (1,450)
4301 MPa (psi)
25 .5 (3,700)
14 .1 (2,050)
12 .7 (1,850)
4275 MPa (psi)
21 .7 (3,150)
16 .9 (2,450)
13 .1 (1,900)
5030 MPa (psi)
32 .1 (4,650)
14 .5 (2,100)
16 .5 (2,400)
7130 MPa (psi)
31 .4 (4,550)
16 .9 (2,450)
7 .6 (1,100)
Ease of use 1= easiest 2 1 3
Useful temperature range °C (°F)
– 55 to 71 (– 67 to 160)
– 29 to 99 (– 20 to 210)
– 196 to 260 (321 to 500)
(1) This test used Torlon® PAI bars 64 × 13 × 3 mm (2.5 × 0.5 × 0.125 inch); steel strips of similar size were cut from cold rolled steel, dull finished panel; and aluminum strips were cut from 2024 alloy panels.(2) Hysol EA 9330. Hysol is a trademark of Dexter Corporation(3) CA 5000. Lord Corporation
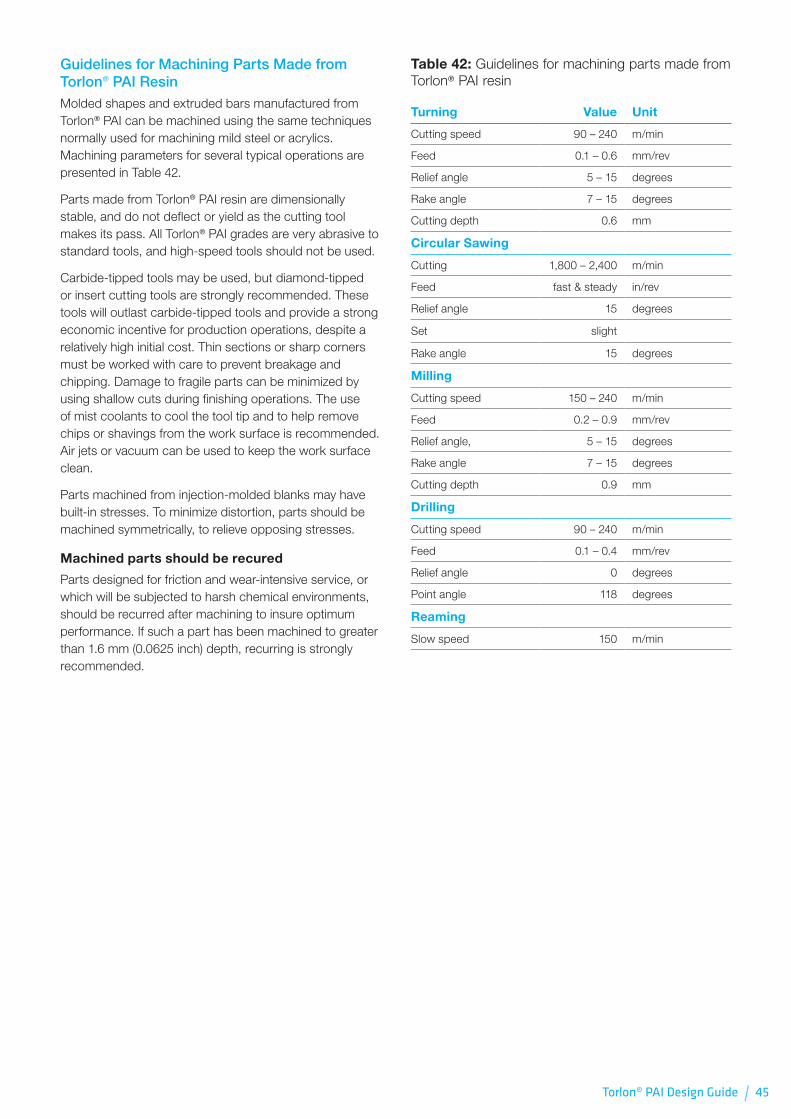
Torlon® PAI Design Guide / 45
Guidelines for Machining Parts Made from Torlon® PAI ResinMolded shapes and extruded bars manufactured from Torlon® PAI can be machined using the same techniques normally used for machining mild steel or acrylics . Machining parameters for several typical operations are presented in Table 42 .
Parts made from Torlon® PAI resin are dimensionally stable, and do not deflect or yield as the cutting tool makes its pass . All Torlon® PAI grades are very abrasive to standard tools, and high-speed tools should not be used .
Carbide-tipped tools may be used, but diamond-tipped or insert cutting tools are strongly recommended . These tools will outlast carbide-tipped tools and provide a strong economic incentive for production operations, despite a relatively high initial cost . Thin sections or sharp corners must be worked with care to prevent breakage and chipping . Damage to fragile parts can be minimized by using shallow cuts during finishing operations . The use of mist coolants to cool the tool tip and to help remove chips or shavings from the work surface is recommended . Air jets or vacuum can be used to keep the work surface clean .
Parts machined from injection-molded blanks may have built-in stresses . To minimize distortion, parts should be machined symmetrically, to relieve opposing stresses .
Machined parts should be recured
Parts designed for friction and wear-intensive service, or which will be subjected to harsh chemical environments, should be recurred after machining to insure optimum performance . If such a part has been machined to greater than 1 .6 mm (0 .0625 inch) depth, recurring is strongly recommended .
Table 42: Guidelines for machining parts made from Torlon® PAI resin
Turning Value Unit
Cutting speed 90 – 240 m/min
Feed 0 .1 – 0 .6 mm/rev
Relief angle 5 – 15 degrees
Rake angle 7 – 15 degrees
Cutting depth 0 .6 mm
Circular Sawing
Cutting 1,800 – 2,400 m/min
Feed fast & steady in/rev
Relief angle 15 degrees
Set slight
Rake angle 15 degrees
Milling
Cutting speed 150 – 240 m/min
Feed 0 .2 – 0 .9 mm/rev
Relief angle, 5 – 15 degrees
Rake angle 7 – 15 degrees
Cutting depth 0 .9 mm
Drilling
Cutting speed 90 – 240 m/min
Feed 0 .1 – 0 .4 mm/rev
Relief angle 0 degrees
Point angle 118 degrees
Reaming
Slow speed 150 m/min
Index
AAbsorption Rate . . . . . . . . . . . . . . . . . . . . . . . . . . . 24Adhesive Application . . . . . . . . . . . . . . . . . . . . . . . . 43Adhesive Choice . . . . . . . . . . . . . . . . . . . . . . . . . . . 42Aircraft Hydraulic Fluid (Skydrol® 500B) . . . . . . . . . 23Aircraft Turbine Oil, With and Without Stress . . . . . . 23An Introduction to Torlon® PAI Wear-Resistant Grades . . . . . . . . . . . . . . . . . . . . . . 28ASTM D5204 Standard Classification System for Polyamide-imide (PAI) Molding and Extrusion Materials . . . . . . . . . . . . . . . . . . . . . . . . . 34Automotive Lubricating Fluids . . . . . . . . . . . . . . . . . 23
BBearing Design . . . . . . . . . . . . . . . . . . . . . . . . . . . . 33Bearing Design Concepts . . . . . . . . . . . . . . . . . . . . 28Bearings . . . . . . . . . . . . . . . . . . . . . . . . . . . . . . . . . 28Bonding Torlon® PAI parts to metal . . . . . . . . . . . . . 43Bonding Various Torlon® PAI Grades . . . . . . . . . . . . 42Bonding with Adhesives . . . . . . . . . . . . . . . . . . . . . 42Bond Strength of Various Adhesives . . . . . . . . . . . . 43Bosses . . . . . . . . . . . . . . . . . . . . . . . . . . . . . . . . . . 40
CCalculating the Pressure and Velocity . . . . . . . . . . . 28Changes in Mechanical and Electrical Properties . . 25Chemical Resistance . . . . . . . . . . . . . . . . . . . . . . . . 21Chemical Resistance Under Stress . . . . . . . . . . . . . 24Coefficients of Linear Thermal Expansion (CLTE) . . . 15Compression Molding . . . . . . . . . . . . . . . . . . . . . . . 38Compressive Properties . . . . . . . . . . . . . . . . . . . . . 11Constraints on Sudden High Temperature Exposure 25Cores . . . . . . . . . . . . . . . . . . . . . . . . . . . . . . . . . . . 39Curing Procedure . . . . . . . . . . . . . . . . . . . . . . . . . . 43
DDesigning with Torlon® PAI Resin . . . . . . . . . . . . . . . 38Dimensional Changes . . . . . . . . . . . . . . . . . . . . . . . 24Draft Angle . . . . . . . . . . . . . . . . . . . . . . . . . . . . . . . 39
EEffect of Mating Surface on Wear Rate . . . . . . . . . . 31Effects of Prolonged Thermal Exposure . . . . . . . . . 14Effects of Water . . . . . . . . . . . . . . . . . . . . . . . . . . . . 24Electrical Properties . . . . . . . . . . . . . . . . . . . . . . . . 27Equilibrium Absorption at Constant Humidity . . . . . 24Example 1 - Short-term loading . . . . . . . . . . . . . . . . 36Example 2 - Steady load . . . . . . . . . . . . . . . . . . . . . 36Example 3 - Cyclic load . . . . . . . . . . . . . . . . . . . . . . 36Examples of Stress and Deflection Formula Application . . . . . . . . . . . . . . . . . . . . . . . . . 36Extrusion . . . . . . . . . . . . . . . . . . . . . . . . . . . . . . . . . 38
FFAA Flammability . . . . . . . . . . . . . . . . . . . . . . . . . . . 21Fabrication Options . . . . . . . . . . . . . . . . . . . . . . . . . 38Fatigue Strength . . . . . . . . . . . . . . . . . . . . . . . . . . . 12Federal Aviation Administration . . . . . . . . . . . . . . . . 34Flammability . . . . . . . . . . . . . . . . . . . . . . . . . . . . . . 19Fracture Toughness . . . . . . . . . . . . . . . . . . . . . . . . . 13
GGeometry and Load Considerations . . . . . . . . . . . . 36Guidelines for Designing Torlon Parts . . . . . . . . . . . 39Guidelines for Machining Parts Made from Torlon® PAI Resin . . . . . . . . . . . . . . . . . . . . . . . . . . . . . . . . . . . . 45
HHigh Performance Torlon® PAI Polymers . . . . . . . . . . 6Holes . . . . . . . . . . . . . . . . . . . . . . . . . . . . . . . . . . . . 40Horizontal Burning Test . . . . . . . . . . . . . . . . . . . . . . 20
IIgnition Properties . . . . . . . . . . . . . . . . . . . . . . . . . . 19Impact Resistance . . . . . . . . . . . . . . . . . . . . . . . . . . 13Industry and Agency Approvals . . . . . . . . . . . . . . . . 34Injection Molding . . . . . . . . . . . . . . . . . . . . . . . . . . . 38Interference Fits . . . . . . . . . . . . . . . . . . . . . . . . . . . . 42Introduction . . . . . . . . . . . . . . . . . . . . . . . . . . . . . . . . 5
JJoining . . . . . . . . . . . . . . . . . . . . . . . . . . . . . . . . . . 41
LLubricated Wear Resistance . . . . . . . . . . . . . . . . . . 31
MMachined Parts Should be Recured . . . . . . . . . . . . 45Material Efficiency—Specific Strength and Modulus 35Maximum Working Stresses for Torlon® PAI Resins 37Measuring wear resistance . . . . . . . . . . . . . . . . . . . 29Mechanical Joining Techniques . . . . . . . . . . . . . . . . 41Military Specification MIL-P-46179A . . . . . . . . . . . . . 34Molded-In Inserts . . . . . . . . . . . . . . . . . . . . . . . 40, 41Molded-In Threads . . . . . . . . . . . . . . . . . . . . . . . . . 41
NNational Aeronautics and Space Administration . . . 34NBS Smoke Density . . . . . . . . . . . . . . . . . . . . . . . . 19
OOther Mechanical Joining Techniques . . . . . . . . . . . 42Oxygen Index . . . . . . . . . . . . . . . . . . . . . . . . . . . . . 19
PPerformance in Various Environments . . . . . . . . . . . 21Performance Properties . . . . . . . . . . . . . . . . . . . . . . 9Physical Properties . . . . . . . . . . . . . . . . . . . . . . . . . . 6Post-Curing Torlon Parts . . . . . . . . . . . . . . . . . . . . . 38PV Limit Concept . . . . . . . . . . . . . . . . . . . . . . . . . . 29
RResistance To Automotive and Aviation Fluids . . . . . 23Resistance To Cyclic Stress . . . . . . . . . . . . . . . . . . 12Resistance to Gamma Radiation . . . . . . . . . . . . . . . 26Restoration of Dimensions and Properties . . . . . . . . 24Retention of Properties After Thermal Aging . . . . . . 14Ribs . . . . . . . . . . . . . . . . . . . . . . . . . . . . . . . . . . . . . 40
SScrew Holding Strength . . . . . . . . . . . . . . . . . . . . . 42Secondary Operations . . . . . . . . . . . . . . . . . . . . . . 41Self-Tapping Screws . . . . . . . . . . . . . . . . . . . . . . . . 41Service in Wear-Resistant Applications . . . . . . . . . . 28Snap-Fit: Economical and Simple . . . . . . . . . . . . . . 41Society of Automotive Engineers-Aerospace Material Specifications . . . . . . . . . . . . . . . . . . . . . . . . . . . . . 34Specific Heat . . . . . . . . . . . . . . . . . . . . . . . . . . . . . . 15Strength of Bolts made of Torlon® PAI Resin . . . . . . 41Stress Concentration . . . . . . . . . . . . . . . . . . . . . . . . 37Stress-Strain Relationship . . . . . . . . . . . . . . . . . . . . 11Structural Design . . . . . . . . . . . . . . . . . . . . . . . . . . . 35Surface Preparation . . . . . . . . . . . . . . . . . . . . . . . . 42
TTensile and Flexural Strength at Temperature Extremes . . . . . . . . . . . . . . . . . . . . . 9Tensile Properties Per ASTM Test Method D638 . . . 10
Thermal Conductivity . . . . . . . . . . . . . . . . . . . . . . . 15Thermal Stability . . . . . . . . . . . . . . . . . . . . . . . . . . . 13Thermogravimetric Analysis . . . . . . . . . . . . . . . . . . . 14Threaded Fasteners . . . . . . . . . . . . . . . . . . . . . . . . 41Threaded Mechanical Inserts . . . . . . . . . . . . . . . . . 41Threads . . . . . . . . . . . . . . . . . . . . . . . . . . . . . . . . . . 40Torlon® Polyamide-Imide (PAI) . . . . . . . . . . . . . . . . . . 5Torlon® PAI Polymers for Insulating . . . . . . . . . . . . . 27Torlon® PAI Wear-Resistant Grades . . . . . . . . . . . . . 30Toxic Gas Emission Test . . . . . . . . . . . . . . . . . . . . . 19
UUL 57 Electric Lighting Fixtures . . . . . . . . . . . . . . . . 21UL 94 Flammability Standard . . . . . . . . . . . . . . . . . 19UL Relative Thermal Index . . . . . . . . . . . . . . . . . . . . 14Ultra Low Temperature . . . . . . . . . . . . . . . . . . . . . . 10Ultrasonic Inserts . . . . . . . . . . . . . . . . . . . . . . . . . . . 42Undercuts . . . . . . . . . . . . . . . . . . . . . . . . . . . . . . . . 40Underwriters Laboratories . . . . . . . . . . . . . . . . . . . . 34
VVertical Burn Test . . . . . . . . . . . . . . . . . . . . . . . . . . 20
WWall Section . . . . . . . . . . . . . . . . . . . . . . . . . . . . . . 39Wall Transition . . . . . . . . . . . . . . . . . . . . . . . . . . . . . 39Wear rate relationship . . . . . . . . . . . . . . . . . . . . . . . 28Wear Resistance and Post-Cure . . . . . . . . . . . . . . . 32Weather-Ometer® Testing . . . . . . . . . . . . . . . . . . . . 26
www.solvay.com
Safety Data Sheets (SDS) are available by emailing us or contacting your sales representative. Always consult the appropriate SDS before using any of our products.
Neither Solvay Specialty Polymers nor any of its affiliates makes any warranty, express or implied, including merchantability or fitness for use, or accepts any liability in connection with this product, related information or its use. Some applications of which Solvay’s products may be proposed to be used are regulated or restricted by applicable laws and regulations or by national or international standards and in some cases by Solvay’s recommendation, including applications of food/feed, water treatment, medical, pharmaceuticals, and personal care. Only products designated as part of the Solviva® family of biomaterials may be considered as candidates for use in implantable medical devices. The user alone must finally determine suitability of any information or products for any contemplated use in compliance with applicable law, the manner of use and whether any patents are infringed. The information and the products are for use by technically skilled persons at their own discretion and risk and does not relate to the use of this product in combination with any other substance or any other process. This is not a license under any patent or other proprietary right.
All trademarks and registered trademarks are property of the companies that comprise the Solvay Group or their respective owners.© 2015, Solvay Specialty Polymers. All rights reserved. D 03/2007 | R 07/2015 | Version 5.0 Brochure Design by www.ahlersheinel.com
Specialty Polymers
Worldwide HeadquartersSpecialtyPolymers .EMEA@solvay .comViale Lombardia, 20 20021 Bollate (MI), Italy
Americas HeadquartersSpecialtyPolymers .Americas@solvay .com4500 McGinnis Ferry RoadAlpharetta, GA 30005, USA
Asia HeadquartersSpecialtyPolymers .Asia@solvay .comNo.3966 Jindu Road Shanghai, China 201108


![Second Quarter - solvay.com · [2] Total FCF generation will drive minimum €250 million deleveraging [1] Organic growth, excluding scope & forex conversion effects and IFRS 16 effect,](https://static.fdocuments.net/doc/165x107/5e17fd86de729b4bbe563b63/second-quarter-2-total-fcf-generation-will-drive-minimum-a250-million-deleveraging.jpg)