Topology of Learning and Correction in Dynamic Balance
98
Topology of Learning and Correction in Dynamic Balance Larissa Welti-Santos B.S., Actuarial Science Universidad de las Américas-Puebla (2002) Submitted to the Program in Media Arts and Sciences, School of Architecture and Planning, in partial fulfillment of the requirements for the degree of Master of Science at the MASSACHUSETTS INSTITUTE OF TECHNOLOGY September 2004 © 2004 Massachusetts Institute of Technology All rights reserved Signature of Author Program in Media Arts and Sciences August 6, 2004 Certified by Walter Bender Senior Research Scientist Program in Media Arts and Sciences Thesis Supervisor Accepted by Dr. Andrew B. Lippman Chair, Department Committee on Graduate Students
Transcript of Topology of Learning and Correction in Dynamic Balance
Topology of Learning and Correction in Dynamic Balance
Larissa Welti-Santos
B.S., Actuarial Science
Universidad de las Américas-Puebla (2002)
Submitted to the Program in Media Arts and Sciences,
School of Architecture and Planning, in partial fulfillment of the requirements for the degree of
Master of Science
at the
MASSACHUSETTS INSTITUTE OF TECHNOLOGY
September 2004
© 2004 Massachusetts Institute of Technology
All rights reserved
Signature of Author Program in Media Arts and Sciences
August 6, 2004
Certified by Walter Bender
Senior Research Scientist Program in Media Arts and Sciences
Thesis Supervisor
Accepted by Dr. Andrew B. Lippman
Chair, Department Committee on Graduate Students

Topology of Learning and Correction in Dynamic Balance
by
Larissa Welti-Santos
Submitted to the Program in Media Arts and Sciences, School of Architecture and Planning
on August 6, 2004, in partial fulfillment of the requirements for the degree of Master of Science
Abstract
“The discrepancy between [our personal experiences] and our idealizations of knowledge leads us into counterproductive strategies for learning and thinking” (Papert 1993). This discrepancy has driven most research towards understanding how people fail to accomplish a task, while few researchers have focused on looking at those instances where people have developed strategies for correcting their failure. This work has as its core belief that by identifying the strategies of correction we will develop better ways to assist in learning. However, to successfully assist in learning, we need to take into account both general rules of behavior and individual solutions. To explore this, we look at a concrete example from posture control, balance, to understand how learning modifies it. This research focuses on identifying an algorithm looking at the process of correction during dynamic balance. We outline an experiment whereby healthy subjects attempt to learn to balance on a two-degrees of freedom platform through external-focus feedback. The intent is to capture and analyze how the structure of old and new-learned body synergies for dynamic balance changes over time. The analysis we present offers a perspective of how subjects achieve kinetic coherence by building strategy maps.
Walter Bender Senior Research Scientist, Program in Media Arts and Sciences
3

4
Thesis Committee
Thesis Supervisor Walter Bender
Senior Research Scientist Program in Media Arts and Sciences
Thesis Supervisor Seymour Papert
Professor Emeritus Professor of Education and Media Technology
Program in Media Arts and Sciences
Thesis Reader Deb Kumar Roy
Assistant Professor Program in Media Arts and Sciences
Thesis Reader Conrad Wall III
Associate Professor Harvard Medical School
Harvard-MIT Whitaker College of Health Sciences Technology
5

6
Acknowledgements
I wish to thank my thesis advisers and readers, Professor Walter Bender, Professor Seymour
Papert, Professor Deb Roy, and Dr. Conrad Wall III. As Media Lab Director, Walter
provided a fresh, fun, and challenging environment in which to work. As an adviser, he
encouraged me to gain knowledge in areas I had never explored. For all of that, I am much
obliged. I am profoundly grateful to Seymour Papert for sharing refreshing and thoughtful
ideas and providing a sense of excitement as the thesis began to take its shape. Special
thanks go to Deb Roy for his valuable criticism and helpful insights and to Dr. Conrad Wall
III for his contagious enthusiasm about balance and technology.
I also appreciate the help of Anna Pandolfo in designing the questionnaires and running
the studies, Emmanuel Munguía Tapia for sharing his then-unpublished work of the sensors
used in the study, Stacy Morris for her advice concerning the accelerometers, Victor Adán for
the brief tutorial in signal processing, and Carlos Rocha for providing valuable help for
making the feedback system work properly. I would also like to thank Prof. Whitman
Richards for his enormous involvement and interest when developing the algorithm and
model of the task.
I would like to sincerely thank Bakhtiar Mikhak for offering me to use one of his
machines (which coincidentally had my name on it), Felice Gardner and John Archambault
for their kind support in getting the hardware, and Paula Aguilera for making the video of this
research project. I am indebted with all my “unofficial” readers for their patience during the
many hours of editing and to my friends who, although I often missed the bright sunshine
coming from a window, compensated for such warmth.
To my family in Mexico: Luga, Jorge, and Jordi; and to my family in Cambridge:
Bernardo, Carla, and Ouko I owe them, by far, gratitude and love for their everyday
encouragement.
This research was funded by the generous support of TELMEX.
7
Con profunda admiración, esta tesis la dedico a
quien me ha motivado a valorar lo que hago y a
luchar por lo que no he hecho, mi esposo
Bernardo.
8

Table of Contents
CHAPTER 1 INTRODUCTION 17
1.1 MOTIVATION 17
1.2 SCOPE 18
1.3 STRUCTURE 19
CHAPTER 2 BACKGROUND 21
2.1 TERMINOLOGY 21
2.2 POSTURAL CONTROL 22
2.3 BALANCE ASSESSMENT 23
2.4 PHYSICAL SKILL LEARNING 24
2.4.1 Theoretical frameworks 24 2.4.2 Dynamic balance studies 25 2.4.3 Influences and effects on the learning process 26
2.5 LESSONS LEARNED 27
CHAPTER 3 MATERIALS AND METHODS 29
3.1 PARTICIPANTS 29
3.2 INSTRUMENTATION 30
3.2.1 Accelerometers 30 3.2.2 Feedback system 31
3.3 PROTOCOL 34
3.3.1 The task 34 3.3.2 Conditions for the experiment 35
3.4 DATA COLLECTION 36
3.5 DATA ANALYSIS 37
3.5.1 Signal processing 37 3.5.2 Descriptive statistics and performance metrics 38 3.5.3 Statistical analysis 39
3.6 SUMMARY 47
9

CHAPTER 4 HOW AND WHAT INFORMATION IS LEARNED 49
4.1 INTUITIONS ABOUT THE TASK 49
4.1.1 Placement of the feet 50 4.1.2 Focus of control 51
4.2 ASSUMPTIONS AND MEMORIES OF BALANCE 51
4.2.1 Changes within one day: Transfer of learning 52 4.2.2 Changes within one week: Retention of skill 53
4.3 THE KNOW HOW 54
4.4 VISUAL FEEDBACK 56
4.4.1 Learning and performance 56 4.4.2 The balance meter 56 4.4.3 Effectiveness of the feedback system 57
4.5 PERCEIVED CONFIDENCE AND SATISFACTION 57
4.6 SUMMARY 59
CHAPTER 5 MODEL AND ALGORITHM 61
5.1 MODEL AND ALGORITHM SPECIFICATIONS 61
5.2 DESCRIPTION OF THE MODEL 62
5.2.1 The control structure 63 5.2.2 Finding the winner: The tally machine 64 5.2.3 Simulation 65
5.3 DESCRIPTION OF THE ALGORITHM 65
5.3.1 Understanding zones of chaos 66 5.3.2 Balance conjectures 69 5.3.3 Learning conjecture 71
5.4 SUMMARY 72
CHAPTER 6 CONCLUSION AND FUTURE WORK 73
6.1 AN OVERALL SUMMARY 73
6.2 TWO QUESTIONS THAT REMAIN UNANSWERED 75
6.3 SUGGESTIONS FOR FURTHER WORK 76
APPENDIX A BALANCE SELF TEST 77
APPENDIX B POST-TASK QUESTIONNAIRE SESSION 1 79
APPENDIX C POST-TASK QUESTIONNAIRE SESSION 2 83
10

APPENDIX D POST-TASK QUESTIONNAIRE SESSION 3 PART I 87
APPENDIX E POST-TASK QUESTIONNAIRE SESSION 3 PART II 91
REFERENCES 95
11

12

List of Figures
Figure 3-1 Transceiver with three axes of acceleration 30 Figure 3-2 Frame of reference for the balance board 32 Figure 3-3 Horizontal displacement of the squares from the center to the edges of the screen
as a function of acceleration 33 Figure 3-4 Feedback system mapping of movement 34 Figure 3-5 Experimental set-up 35 Figure 3-6 Placement of sensors 36 Figure 3-7 Average deviation of side-to-side mean head acceleration 41 Figure 3-8 Significant sources of variability within subjects in Session 1 and Session 3 43 Figure 3-9 Strategy number corresponding to the placement of the feet during Session 2 44 Figure 3-10 Average aggregate deviation of mean platform acceleration (EVp) in Session 2 45 Figure 3-11 Significant sources of variability within subjects in Session 2 46 Figure 4-1 Transfer test 52 Figure 4-2 Retention test 53 Figure 4-3 Average perceived confidence in Session 1 and Session 2 58 Figure 4-4 Average perceived confidence and satisfaction by experimental condition 59 Figure 5-1 Graphical representation of a six-order state system of the body 62
Figure 5-2 Strategy map for the Balancer model: { }6,,9,5,0, yx 67
Figure 5-3 Strategy map for the Balancer model: { }2,2,,4,,3 yx 68
Figure 5-4 Graphical representation of Conjecture 1 71
13

14

List of Tables
Table 4-1 Ensemble variable scores for Session 1 and Strategy 1 in Session 2 of the platform
and the body 55
15

16

Chapter 1
Introduction
When it comes to learning, particularly learning a physical skill, the core dilemma is how
fragmented motor responses come to be highly organized both in time and space to form a
single-threaded program. What has been seen so far in brain research and motor control
literature is that the brain acts not by seeking the ideal predictive information but rather the
most useful one for coordinating the action (Berthoz 2000). To promote understanding of the
organization dilemma, the focus of attention of this research is, thus, changes in movement
coordination during the learning process attributed to the process of correction. That is, the
study of movement will be attacked at the behavioral level of analysis, focusing on the
changes in the learning process. Throughout this document, the reader will encounter the
exploration of how movement patterns are acquired, corrected, and readapted during the
execution of a specific balancing task.
1.1 Motivation
The interest in developing new theories and practices to support learning of physical skills is
based on the MIT Media Laboratory’s growing efforts to uncover new types of learning
experiences in different domains by understanding the nature of human movement. Balance
itself is interesting as one of the fundamentals of motion study. People are familiar with this
concept and at the same time unaware of the complex processes that control posture. For
these two reasons, the area of posture control is suitable for our research purposes.
17

In addition to the epistemological enterprise around posture and balance, the degeneration
of the balance control system in the elderly and in many pathologies has posed this topic as
relevant in healthcare research. According to the Center for Disease Control and Prevention
(CDC), falls are the leading external cause of injury (cdc.gov 2001) and falls caused by
changes in the somatosensory system are the most common cause of morbidity and mortality
among the elderly (Collins, Priplata et al. 2003, March/April) (Dault, de Haart et al. 2003).
Therefore, understanding more about how the system works and how to quantify its status at
any point of time is the first step towards helping people to learn about learning to balance.
The importance of learning about learning is pointed out not as a philosophical understanding
but as a form to provide people with ways of discerning and choosing patterns or connections
of balance strategies better than before.
New research done by using the concept of noise-enhanced sensation (boosting sensory
feedback) could potentially speed up and enhance a patient’s rehabilitation with
somatosensory problems (Collins, Priplata et al. 2003, March/April) and increase the
percentage of reduced falls. Nevertheless there is a pending issue that arises when people
have posture deficits that require some durable benefit that no stochastic resonance-based
device has proven to offer after the device has been removed. For these cases, the algorithm
to be observed during the correction process will hopefully result in shareable models for
unexpected perturbations that people can reflect on and learn about. After all, “anticipatory
responses must be learned, but eventually they operate automatically, being triggered by
specific intended movements” (Kandel, Schwartz et al. 2000).
1.2 Scope
This document seeks to understand and place in perspective the importance of the process of
correction when learning a skill, in this case, when learning to balance on a board. Towards
understanding the process of correction, readers must be clear that the goal of this research is
not to develop a new method to assess balance problems nor to define a rehabilitation
procedure, but identify an algorithm that potentially describes the learning process during
balance. To do so, information captured by wearable sensors is analyzed through statistical
procedures. Later, intuitions are offered about the two basic questions that arise in skill
acquisition, namely, what has to be learned? and how is it learned?. And finally, a model
18

and an algorithm that reflect aspects of the process of correction as learning is unfolding are
presented.
Full investigation of how algorithms can be used for rehabilitation is beyond the scope of
this project as well as exhaustive treatment of the various approaches to learning. The
treatment here will be to provide a broad insight on what can be done to assist in learning
based on the results of this research. Hence, the concept embedded in this research is of
algorithms not as solution providers but as thinking catalysts.
1.3 Structure
The structure of this document is as follows. Chapter 2 serves as an introduction to relevant
concepts and current research in postural control, balance assessment, and physical skill
learning. In addition to the literature review, this chapter presents a description of the four
major challenges to providing deep insights about the balance-learning problem. In Chapter
3, the design, implementation, and statistical analysis of the study are introduced. Chapter 4
presents empirical relationships and intuitions about learning, as well as common and useful
measures in motor control. In Chapter 5, a model and an algorithm looking at the process of
correction are introduced. Finally, Chapter 6 summarizes the most important conclusions of
this work.
19

20

Chapter 2
Background
2.1 Terminology
The terminology used to describe balance depends on the perspective through which this
phenomenon is approached. Throughout this document two different approaches will be
presented. The most popular approach has to do with discrete modes of perception; the other
with using pattern dynamics and attractors. Even though both lines of research differ, the
following terminology for posture and balance pertain to both approaches:
1. Posture describes the geometric relation of the body parts relative to one another and
to the environment.
2. Balance describes the dynamics of body posture due to postural disturbances.
In the present study, the focus is on posture and balance related to dynamic balance,
which can be cast in terms of finding appropriate relations among body segments and
defining what to do with those relations to maintain balance.
21
2.2 Postural control
Maintaining postural stability is a complex process that relies on the interaction of three
components:
1. Combination of information from vision, the vestibular system and somatosensory
system;
2. Motor responses coordinated among muscles of the feet, legs, and trunk;
3. Integration of the sensory and motor processes, previously mentioned, and the
adaptation of these processes to changes in the environment (onbalance.com 2003).
This last component is particularly important because some of the information provided
by the visual, vestibular or somatosensory systems can be inaccurate in certain environments.
For this reason, the brain chooses sensory inputs according to the context to make the
appropriate postural adjustments (Berthoz 2000). However, postural adjustments are not the
only challenges met by the postural system. It also must be capable of generating responses
that anticipate voluntary movement and capable of adaptive leaning.
Two different approaches of postural adjustment are seen in current research: discrete
modes of perception and pattern dynamics and attractors. In the case of the discrete modes of
perception, there appear to be two ways of perceiving these postural relations. One takes the
head as reference and projects information in a top-down approach from the head to the trunk
and then to the feet. The other takes the ground as a reference and projects in a bottom-up
mode from the feet to the trunk and then to the head (Kandel, Schwartz et al. 2000). In
contrast to the discrete approach, the pattern-dynamics approach suggests that postural
synergies might not be discrete but functional synergies arranged in terms of pattern
variables. This later approach deals with phase relations and attractors in a dynamic system
(Kelso 1999) (Saltzman and Kelso 1985). In any case, postural and balance adjustments are
characterized by a collective assembling of motor patterns. Their timing and amplitude are
suggested as strategies or synergies (Winter 1995).
22

2.3 Balance assessment
A great variety of tests and instruments have been developed to qualify and quantify the
status of the postural control system. Some of these instruments are administered under
laboratory settings while others are not restricted to specific laboratory conditions. Some are
qualitative while others are quantitative. But no matter their nature there is no single
assessment technique that can truly indicate the efficiency of the balance control system
(Winter 1990). Consequentenly, the selection of an instrument depends on the results aimed
at.
The qualitative balance measurements are usually not restricted to laboratory settings
because they are mostly designed to assess balance capabilities in various tasks related to
everyday life (Berg, Wood-Dauphinee et al. 1989) (Tinetti 1986) (Whitney, Poole et al.
1998). They mostly measure the ability to execute coordinated movements. These tests do
not require training to administer, last a couple of minutes, and are inexpensive. They are
focused on capturing information related to typical balance problems, although because the
assessment is usually based on scores, these tests do not provide detailed information about
balance problems of the postural control system.
Thereupon a significant amount of research has focused on more elaborated balance
assessment methods, such as optical motion analysis systems (Medved 2001), force platforms
(Nashner 2001), and electromyography. These methods give more detailed information about
postural balance than the qualitative balance measurements; nevertheless they are restricted to
laboratory settings and are also much more expensive to perform than the qualitative
methods.
An unconventional balance assessment method, although not new, is accelerometry.
Accelerometry has been proposed as a useful gait analysis technique since the 1960’s and
more recently, it has been employed to:
1. Evaluate the effects of ageing and different walking surfaces as a measure of stability
under real life environmental conditions (Menz, Lord et al. 2003);
2. Measure balance control during quiet standing (Moe-Nilssen and Helbostad 2001)
(Mayagoitia, Lötters et al. 2002);
3. Diagnose and assist with therapy (Wall III and Weinberg 2003, March/April)
(Sabelman 2002).
23

The need for low cost devices that fall within the two most common areas of balance
assessment points towards accelerometry as an inexpensive alternative to optical motion
analysis systems (Mayagoitia, Nene et al. 2002). These portable systems have the potential
of enabling collection in everyday environments at low costs. Thus the data collection can be
done frequently and therefore enable real-time feedback.
2.4 Physical skill learning
2.4.1 Theoretical frameworks
Motor learning and control are mostly being studied under two theoretical frameworks: a
cognitive or information processing approach and a dynamic systems approach. The main
difference between these approaches revolves around the learner. The cognitive approach
and the dynamic systems approach conceive the role of the learner in different ways either as
an integrator of information or as an explorer during the learning process. Consequently the
learning process is rooted on a motor schema or an emerging design. This section briefly
describes both theoretical frameworks.
Until the 1970s research on movement and skill learning was confined to a problem of
motor control defined in terms of information processing and resource allocation. This
research is well structured under the cognitive framework. Under the information-processing
approach, learning occurs as an outcome of a motor program and its representation exists
inside an entity that can be considered a central programmer. How well each person allocates
processing and attention resources describes his/her ability to execute a motor skill (Magill
1998) (Schmidt and Wrisber 2000). Therefore, for the cognitive approach, the learner is the
communication channel that processes information in different hypothetical scenarios to
produce a motor action (Schmidt and Wrisber 2000). This same idea of being able to look
into the future and consider various combinations of possible actions to predict a possible
outcome is described by Minsky in his Five-Level Model of Mind with the difference that the
scheme of control he proposes is decentralized (Minsky 2003).
In response to the argument that motor-learning understanding was not possible unless
the processes of movement control were known, another approach to motor learning evolved.
The dynamic systems approach suggests that the coordination patterns are not represented in
24

motor programs but naturally emerge as self-organizing systems (Wulf, NcNevin et al. 1999).
The key task for the learner is assumed to be the exploration of those patterns of movement
that act as attractors. These attractors are first defined by each individual’s intrinsic dynamics
that represent their preferred modes of coordination and the environment’s constraints
(Corbetta and Vereijken 1999), but with practice, according to this approach, learners can
destabilize those dynamics and search for more optimal attractors. Such process implies the
optimal use of reactive forces in the environment. The principle of exploiting existing forces
was already formulated by Bernstein in 1967 as the third and final stage of the skill-
acquisition process. He stated that forces generated by the individual only worked as
complement of those forces available in the environment (Vereijken, Whiting et al. 1992).
2.4.2 Dynamic balance studies
Learning is usually conceived as changes in motor behaviors to master the coordination of
multiple degrees of freedom of a system (Bernstein 1967). Coordination can happen in two
ways. It can happen by freezing and freeing joints to decrease the number of degrees of
freedom to be mastered; or by the dissolution and emergence of task-specific couplings
between oscillators in the system (Caillou, Nourrit et al. 2002). Both types of adaptations
have been seen in previous research in balancing tasks and one of the basic conclusions of
these studies is the confirmation that these adaptations are strongly constrained by the task.
Task constraining becomes then an important issue to address in balance learning.
The most common way to study dynamic balance has been through the use of platforms
and stabilometers to examine how people learn to coordinate redundant degrees of freedom
(Ko, Challis et al. 2003) (Adkin, Frank et al. 2002) (Shea, Lai et al. 2000) (Shea and Wulf
1999) in laboratory settings. With the use of optical motion-analysis systems, force platforms
and electromyography, researchers have recorded muscle anticipatory responses, forces and
moments from force plates, and couplings between body parts to describe changes in practice
and the learning process. The contribution of the majority of these studies is on global
behavioral and motor trends that have enlightened the general panorama of motor control and
learning.
In addition to what has been considered as the traditional and most reliable methods of
analyzing motor trends, wearable inertial sensors have become an inexpensive option to
measure movement. Body-mounted sensors, like accelerometers and gyroscopes, have and
are being tested in different physical tasks to establish statistical reliability with laboratory
25

measures (Mayagoitia, Nene et al. 2002) (Moe-Nilssen 1998) (Morris 2004). Balance studies
using these systems have shown that they are useful for quantifying qualitative measures of
balance (Sabelman 2002) and helpful for building discriminants (Moe-Nilssen and Helbostad
2001), but once balance-control measures are developed they also provide relevant
quantitative data comparable to analogous optical data. Parameters such as angle, angular
velocity, linear acceleration, and variability are representative examples (Mayagoitia, Nene et
al. 2002). Nevertheless actual values of the parameters resulting from different systems are
not directly comparable (Mayagoitia, Lötters et al. 2002).
2.4.3 Influences and effects on the learning process
When confronted with a motor task, the learner does not only deal with his/her physical
constraints but also with other factors that might influence the learning process in positive or
negative ways. Balance literature has reported factors that have an effect on learning and
performance suggesting that skill execution can be modified by either controlling or
enhancing such factors. A series of experiments have been conducted mainly with force
platforms to measure the effect of the fear or falling or postural threat on the control of
posture (Adkin, Frank et al. 2002), the effect of spacing practice sessions across days and
within days on the learning of balance tasks (Shea, Lai et al. 2000) and the influence of
external-focus feedback (Shea and Wulf 1999).
Of main interest to this research is the use of feedback systems to aid in the learning
process. The most common type of feedback system in the balance-learning literature is a
visual display that provides real-time information about movement dynamics. Studies using
stabilometers frequently design their feedback systems with lines that represent the deviations
of the platform form the horizontal plane. The main purpose of this design is for subjects to
visually identify how tilted the board is without looking at it directly. The criticism to this
design is that it might be redundant with intrinsic feedback. Yet, according to Shea and Wulf
(Shea and Wulf 1999), feedback, although redundant, can enhance motor skills if the given
feedback refers to the effects of the participant’s movements rather than the movements
themselves (Shea and Wulf 1999). Nevertheless, some studies have indicated that feedback
is ineffective if it is redundant with the performer’s intrinsic feedback (Magill, Chamberlin et
al. 1991) (Vereijken and Whiting 1990) or if learners become dependent on it. The degrading
effects of frequent and immediate feedback are usually explained with the Guidance
Hypothesis (Salmoni, Schmidt et al. 1984) according to which the learner develops a
26
dependency on the feedback, if he/she is heavily guided by the augmented information. For
this reason, the careful design of a feedback system is imperative to effectively help users.
Besides visual feedback, tactile feedback (in areas of the body other than the feet and the
hands) has also proven to be effective in standing balance. Passive tactile sensory input on
the shoulder and leg using a vibrator has demonstrated an improvement in stability during
standing (Rogers, Wardman et al. 2001). Also, positive results have been achieved by tactile
feedback on the torso through an array of vibration sensors that are activated by the outputs
of an accelerometer and a gyroscope (Wall III and Weinberg 2003, March/April). A next
step is to analyze the potential for tactile cues to modify postural reactions in dynamic tasks.
2.5 Lessons learned
According to Winter, balance is related to the acceleration involved in the dynamics of body
posture and how the central nervous system (CNS) controls those accelerations (Winter
1995). For this reason, using accelerometers to capture balance information is thought to be a
natural option for body sensing for this research study. However, choosing the movement-
sensing system is not the only important decision to be made when designing a balance study.
Balance studies face four major challenges when willing to provide deep insights about the
balance-learning problem. These challenges will be next presented as well as the
expectations and approach taken by this research study.
1. Balance studies with main interest in extrapolating their results to real life have to
choose paradigms and design experiments that are representative of the kinds of
disturbances experienced outside the laboratories (Winter 1995). In this research
study, the experiment design is not likely to be representative of any disturbances
experienced in real life, but it is expected that it will uncover stages of skill-learning
that concern with the acquisition of movement coordination per se (which the authors
of this research believe is closely related to the process of correction during task
executions).
2. Measuring the dynamics of task executions and measuring the outcomes of those
executions are two different things (Vereijken, Whiting et al. 1992). The skill-
learning literature recognizes that a task can be interpreted in different ways, for
example in terms of its final goal or the strategies carried out to achieve the goal.
27
However, it becomes apparent that to understand the underlying dynamics of task
execution just looking at the final outcome is not sufficient. For this reason, this
research will concentrate on an in depth analysis of the dynamics of task executions
and the evolving strategy. Additionally, an overall analysis regarding to the final
goal will be presented.
3. The design of the feedback system impacts the learning process. It has been well
documented that “participants usually learn things that are different from those that
the experimenter expected them to learn” (Perruchet, Chambaron et al. 2003).
Therefore, careful design of the feedback system is essential. The feedback system
used this research study will be based on the hypothesis that trying to fall within a
range of what is considered close to being balanced achieves better performance than
trying to perfectly balance (for details see section 3.2.2). This assumption has not
been verified and might negatively affect the learning process if it is proven false. In
such a case a recommendation of possible useful designs for a feedback system will
be provided.
4. Learning and changes in variability are task dependent. It is frequently thought that
decreases in variability are common in balance learning. Hence, variability should
decrease if subjects learn to become more stable, and therefore become skilled at the
balance task (Schmidt and Lee 1999). However, if subjects learn to move close to
dangerous conditions, variability should increase (Patton, Lee et al. 2000). Because
of the nature of the task and the duration of the research study, an inverse relationship
between learning and variability is expected.
28

Chapter 3
Materials and methods
Healthy subjects attempted to learn to balance on a two-degrees-of-freedom platform with the
intent to capture and analyze how the structure of old and new learned body synergies for
dynamic balance changed over time. A balance fitness equipment was instrumented with a
compact circuit board to measure linear acceleration about three axes. Two additional circuit
boards placed on the subject’s body provided information about acceleration dynamics. All
data was wirelessly transmitted to a receiver connected to a computer through the serial port
with 66-Hz full-state updates streaming directly from each circuit board.
3.1 Participants
Participants were recruited through flyers seeking research study subjects for compensation.
Flyers were posted around the MIT campus. Thirty-one people volunteered to participate in
the study. Each volunteer was asked to go to a website to download and answer a
questionnaire, the Balance Self Test (see Appendix A), that helped the experimenters
determine if the participant was at risk of falling. Exclusion criteria included any affirmative
answer to the questions in the Balance Self Test. The study was conducted with twenty-four
subjects (male to female ratio of 4:1, age (years) 27.19 ± 7.10, body mass ( )
22.615 2.73). Each participant, informed of the experimental procedures, provided written
consent prior to each of three testing sessions. The MIT Committee On the Use of Humans
as Experimental Subjects (COUHES) approved all experimental procedures (COUHES
2003).
2/ mkg
±
29

3.2 Instrumentation
3.2.1 Accelerometers
Linear acceleration was collected via three 1.2” by 1” wireless circuit boards measuring three
axes of acceleration. The circuit boards are instrumented with two 2-axis accelerometers
from Analog Devices ADXL202/ADXL210, a microcontroller and wireless
transceiver/receiver, and a 3-Volt power supply. For each board, one of the accelerometers is
orthogonally attached to the side of the pane to achieve the third axis of sensing1 as shown in
Figure 3-1. These circuit boards are responsible for data collection and transmission to an
additional board referred to as the receiver. The receiver, which can also be instrumented
with two accelerometers, is connected to a computer through the serial port. The total
sampling rate of the system is 200-Hz (Munguia Tapia, Marmasse et al.).
Figure 3-1 Transceiver with three axes of acceleration
Considering that the balance task might have harmonics as high as 12-Hz in terms of a
load-upload mechanism for balance and taking into account that the suggested sampling rate
in Movement Science should be four times the highest frequency (Winter and Patla 1997),
four boards were appropriate for the study. Due to a last moment failure, the experimenter
ended up using three boards instead of four, two of which measure linear acceleration in the
2g range and another one in the 10g range. ± ±
1 Both accelerometers were soldered to the board by hand, so while the x-axis is expected to be close to perpendicular to the y-axis and the z-axis, the exact angle was unknown.
30

3.2.2 Feedback system
The main goal of the feedback system used in this study is to quantify what is not perfectly
visible: a vicinity of balance. This is similar to answering the question how close I am to be
balanced? To do so the system assumes that the minimum amount of data needed to provide
this information is position and velocity (Kadkade, Benda et al. 2003).
Three different designs were tested with a small group of volunteers from MIT
community to investigate the user experience and preferred real-time acceleration mappings.
Several iterations of usability testing were conducted to find the form of data representation
preferred by the group. The final outcome was a visual feedback system relying on two
hypotheses.
Hypothesis 1. Trying to fall within a range of what is considered close to being balanced
achieves better performance than trying to perfectly balance (i.e. ε∂ ≤ , where ∂
corresponds to the tilt of the platform from the horizontal position, 0=∂ , and ε is a
small number greater that zero).
Hypothesis 2. To efficiently balance, a person has to learn to respond to acceleration as
opposed to the tilt of the board (Papert 2004).
The system built in Processing (Fry and Reas 2004) and interfaced with Java, consists of
three squares, two of which move and change sizes according to the acceleration experienced
by the board in two different axes: pitch and roll. Pitch, captured by the x-axis of acceleration
of the circuit board (placed on the bottom of the board), controls the movement of the
squares. While roll, captured by the y-axis of acceleration, controls the size of the squares.
The frame of reference for the board seen from a top-view is depicted in Figure 3-2.
31

Figure 3-2 Frame of reference for the balance board
The acceleration, displacement, and size of the squares shown on a computer screen are
not the result of a linear mapping of the acceleration onto the squares. The dynamic
properties of the system are defined by a step function of the form:
( ) ( ) ( )22211121, xfxfxxf αα += . Equation 3-1
Where 1α and 2α ∈ .
( ) ( )
=
1,1
111
intint
αx
xf Equation 3-2
is a noise-reduction function and
( ) ( )
=
1,2
222
intint
αx
xf Equation 3-3
is a noise-add function. and are multiples of a zero-mean transformation of the linear
acceleration output from the sensors. takes its value from the acceleration output in the
1x 2x
1x
32

pitch axis of the platform and from the roll axis output from the same board. 2x 1,1α and
1,2α are both constants.
function
0.6 0.9
The step-wise mapping is based on the hypothesis that trying to fall within a range of
what is considered close to being balanced achieves better performance than trying to
perfectly balance. This mapping is especially relevant when a subject is close to be balanced.
Instead of watching the squares constantly moving due to common changes in acceleration
when he/she is not perfectly balanced, he/she will watch no such changes. To provide with a
graphical understanding of mapping functions, Figure 3-3 shows the horizontal displacement
of the squares given two different mapping functions: a linear function and the actual step
function used in the feedback system (Equation 3-1). In this case data was taken from a five-
seconds sequence of movement on the balance board using a ± 10g accelerometer.
Displacement as a step function of acceleration
-140
-120
-100
-80
-60
-40
-20
0
20
40
60
80
100
120
140
-1.5 -1.2 -0.9 -0.6 -0.3 0 0.3 0.6 0.9 1.2 1.5
Acceleration (g)
Dis
plac
emen
t (pi
xels
)
Figure 3-3 Horizontal displacement of the squares from the center to the edges of the screen as a function of acceleration
Displacement as a linearof acceleration
-140
-120
-100
-80
-60
-40
-20
0
20
40
60
80
100
120
140
-1.5 -1.2 -0.9 -0.6 -0.3 0 0.3 1.2 1.5
Acceleration (g)
Dis
plac
emen
t (pi
xels
)
Movement and size variations are not the only important features of the system. Color
was carefully chosen to enforce body symmetry and for easily searching the displayed
information. The colors of the two external squares have the same hue distance from the
central color. This helps the subject to avoid focusing on a single square and concentrate on
the global information provided by the system (Bender 2004). Actual snapshots of the
33
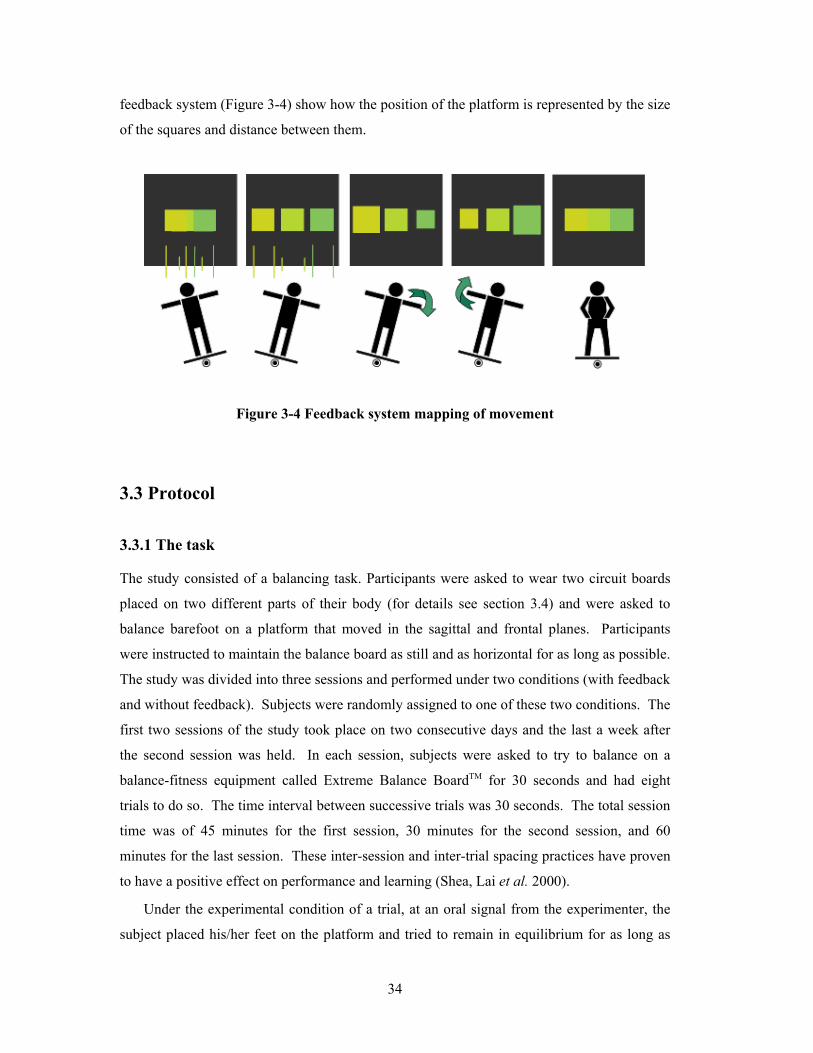
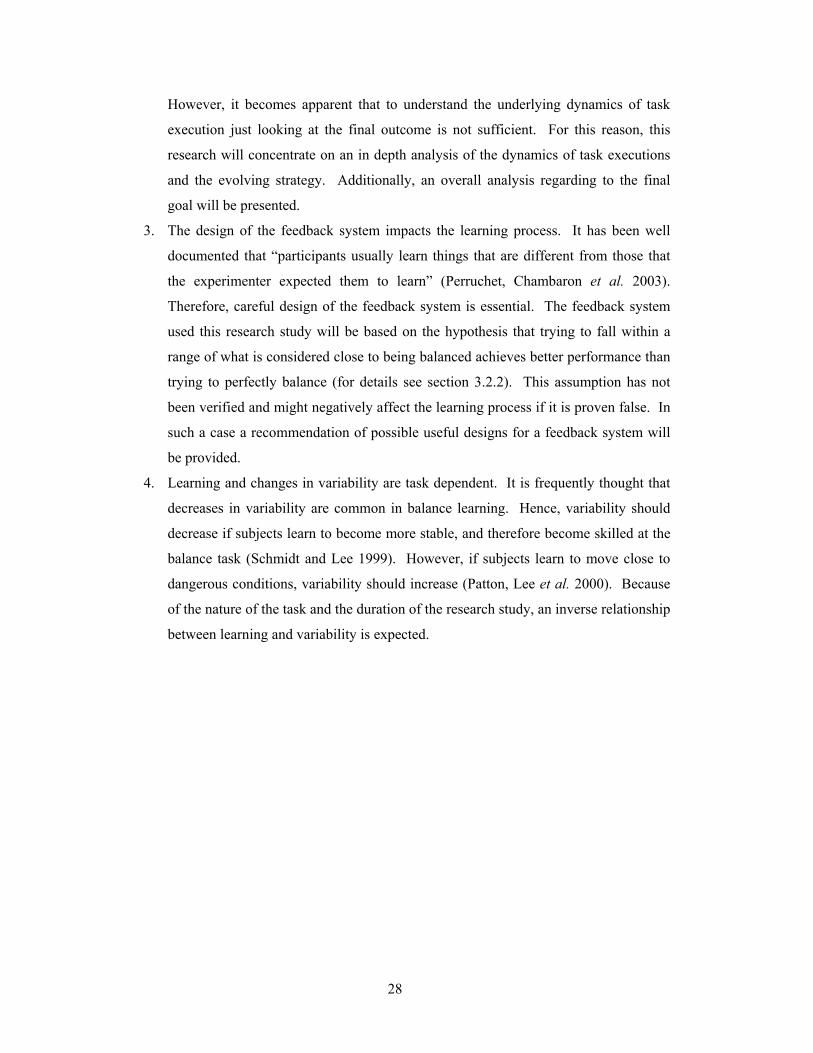
feedback system (Figure 3-4) show how the position of the platform is represented by the size
of the squares and distance between them.
Figure 3-4 Feedback system mapping of movement
3.3 Protocol
3.3.1 The task
The study consisted of a balancing task. Participants were asked to wear two circuit boards
placed on two different parts of their body (for details see section 3.4) and were asked to
balance barefoot on a platform that moved in the sagittal and frontal planes. Participants
were instructed to maintain the balance board as still and as horizontal for as long as possible.
The study was divided into three sessions and performed under two conditions (with feedback
and without feedback). Subjects were randomly assigned to one of these two conditions. The
first two sessions of the study took place on two consecutive days and the last a week after
the second session was held. In each session, subjects were asked to try to balance on a
balance-fitness equipment called Extreme Balance BoardTM for 30 seconds and had eight
trials to do so. The time interval between successive trials was 30 seconds. The total session
time was of 45 minutes for the first session, 30 minutes for the second session, and 60
minutes for the last session. These inter-session and inter-trial spacing practices have proven
to have a positive effect on performance and learning (Shea, Lai et al. 2000).
Under the experimental condition of a trial, at an oral signal from the experimenter, the
subject placed his/her feet on the platform and tried to remain in equilibrium for as long as
34

possible. At any time, the subject could go to a stable position by placing one side of the
board on the floor without stepping off the equipment. After the time was up, the
experimenter gave an oral signal for the subject to stop and step off the platform. Under both
experimental conditions, the study was restricted to the analysis of three stages in the learning
process each represented by a session. (Session 1): People bring their balance knowledge
(their constructions) of the physical world and try to apply that knowledge. (Session 2): The
experiment design forces participants to try different strategies by providing specific
instructions on where to place their feet on each trial. (Session 3): Participants are told to
pick by themselves the strategy that would allow them to achieve best performance.
3.3.2 Conditions for the experiment
The experiment was held at the Media Laboratory in a space where a loss of balance would
not result in contact with objects that could cause injury. This space was equipped with two
mats (7 ft x 4 ft x ½ ft) to protect participants in case of a fall.
Initially, all subjects familiarized themselves with the balance board by moving it freely
with their hands so that they understood its range of motion. In the case where a subject was
placed under the feedback condition, the participant moved the board and watched the display
at the same time so that he/she could understand how the feedback system worked. Once the
subjects felt they had understood the limits and possibilities of the range of motion they were
asked to leave the board still on the floor and stand barefoot close to the balance board.
Figure 3-5 Experimental set-up
35

Subjects wore two circuit boards (previously described in section 3.2.1) to collect data
from body movement. The boards were securely fastened on the forehead and over the T122
3.4
region using elastic bands and Velcro® straps as shown in Figure 3-6. A third circuit board
was placed on the bottom of the board to collect the platform’s acceleration. In the case
where a subject was placed under the feedback condition this same circuit board controlled
the visual display placed six feet away from the subject. This distance was appropriate for
the visual system to control postural stability (Brandt, Paulus et al. 1986) and yet provide
enough space for the subject to minimize any injury caused by a collision with an object.
Figure 3-6 Placement of sensors
In addition to collecting data from the sensors, every session was videotaped.
Anthropometric factors such as hip and knee joints, as well as the perimeter of the feet were
measured for each subject.
Data collection
Linear acceleration was measured by three circuit boards. Two of the circuit boards were
placed on the participant’s body: on the forehead and over the T12 region. The third one was
placed on the bottom of the platform. All data were wirelessly transmitted to a receiver
connected to a computer through the serial port with 66-Hz full-state updates streaming
directly from each circuit board. Data was recorded in a *.txt file that contained: the
sampling times in milliseconds and the acceleration for each of the nine channels of
information (three axes per board) in 10-bit samples. Data collection began before the first
2 Originally, one of the circuit boards was to be placed over the L3 region which is close to where the center of mass (COM) is believed to be during quiet standing according to Moe-Nilssen, but pilot studies revealed that subject felt uncomfortable while trying to accomplish the task. Moe-Nilssen, R. (1998). A new method for evaluating motor control in gait under real-life environmental conditions. Part 2: Gait analysis. Clinical Biomechanics 13: 328-335.
36

trial started and after the sensors were correctly placed. Data collection ended approximately
four to six seconds after the last oral signal to stop and step off the platform. Acceleration
data for each subject was stored in files with the following naming convention:
signal_s<subject no.>_t<session no.>. Where <subject no.> is an anonymous identifier for
the participant from 01 to 31.
The beginning and end of each trial were recorded in a *.xls file that saved the computer
clock time when a button was clicked. The starting time recorded for each trial corresponds
to the moment in which the participant started to lift the board off the ground. This time was
defined by the experimenter’s action of clicking a button on the spreadsheet. The stopping
time was automatically computed as 30 seconds after the starting time. Data for each subject
was stored in files with the following naming convention: times_s<subject no.>_t<session
no.>.
For each session, perceived confidence, satisfaction, performance, and expected
performance measures were reported by the participant. Participants scored each item on a
post-task questionnaire (one for each session) using a 7-point scale ranging from 1 (not at
all/not well at all) to 7 (very confident/very well). Participants answered additional questions
related to the strategies they used to balance during the first and last trials and the difficulty of
the task in each session. In the last session all participants were asked to watch their own
video recordings from Session 1 and Session 3 with the goal of comparing and contrasting
their strategies and performances between sessions. Additionally, participants in the
feedback condition reported levels of: usefulness; distraction; information; and intuition of
the feedback system. Participants scored each item using a 7-point scale ranging from 1 (not
at all) to 7 (very/ absolutely). By the end of the third session, each participant had answered a
total of four questionnaires. For more detail about the questionnaires see Appendices B, C,
D, and E.
3.5 Data analysis
3.5.1 Signal processing
Before statistical analysis of the data was done, a number of processing steps were applied to
the data; data were truncated, adjusted, and filtered. MATLAB® was used for all signal
processing.
37

Raw acceleration data were converted into MATLAB® files (*.mat) and then truncated
into eight segments, 30-seconds each, corresponding to the eight trials. Data segmentation
was computed in MATLAB® using a *.xls file that contained the beginning and end times of
each trial. Once the data were divided into trials, the zero offset of the axes of the
accelerometers was determined by the DC levels. Data were zero-meaned using the DC
components and then transformed to units of [-2g, 2g] for the data collected by the on-body
circuit boards and a range of [-10g, 10g] for the circuit board placed on the balance board.
No further transformations were performed to accurately determine the static acceleration for
each data point; determination of dynamic and static acceleration in the data could not be
determined from measurement of acceleration alone according to Einstein’s Equivalency
Principle3, hence the contribution of the gravitational component is still present in the
transformed data. Determination of the dynamic acceleration could have been achieved by
including a gyroscope on each board to record the orientation of the board with respect to the
horizontal plane (Morris 2004).
After truncation, two types of adjustments were made to the data before the statistical
analysis was done. Outliers were identified and replaced and some data was ignored due to a
wireless transmission problem related to missing data packages. Values that were greater or
equal than ),(),( 3jiji ttttx σ+ were considered as outliers; therefore they were replaced by
),( ji ttx . Where ),( ji ttx is the estimate of the mean of a window of approximately six seconds
of recorded data starting at time and ending at time for it jt 8,,2,1 K=i and .
The windows were overlapped by approximately three seconds. All data were low pass
filtered
8,,2,1 K=j
4 at a cutoff frequency of 20-Hz using a sixth-order Butterworth filter.
3.5.2 Descriptive statistics and performance metrics
The filtered acceleration data were used to extract descriptive statistics such as estimates for
the mean ( µ ), median (2
1µ ), standard deviation (σ ), coefficient of variation (CV), and root
mean square (RMS). These statistics were obtained for each of the nine channels of
information of every subject’s acceleration per trial, session, and experimental condition.
3 The principle states that no experiment can distinguish the acceleration due to gravity from the inertial acceleration due to a change of velocity. 4 MATLAB® function butter.m was used.
38

Additional to the descriptive statistics, three ensemble variables5 (EV) were derived as
performance metrics: ensemble variable of the platform ( ), ensemble variable of the
body ( ), and ensemble variable of the system ( ). These variables, jointly
considered, were subsequently used to study how the task was learned and what types of
strategies were used during the experiment. The EV variables were computed as follows:
pEV
sEVbEV
px
2hy
ex
22pp yxp RMSRMSEV += . Equation 3-4
Where corresponds to the pitch axis of the balance board, and corresponds to the roll
axis of the balance board.
py
222hee xyxb RMSRMSRMSRMSEV +++= . Equation 3-5
Where and correspond to the x-axes of acceleration of the back and the head; and
and correspond to the y-axes of acceleration of the back and the head respectively.
hx ey
hy
22bps RMSRMSEV += . Equation 3-6
3.5.3 Statistical analysis
After signal processing of the data was done, two major analyses were performed. The first
compared all possible interactions between Session 1 and Session 3; and the second analysis
was on the Strategies of Session 2. SPSS was used for all statistical analysis.
5 An ensemble variable is an informative and low dimensional dependent variable that reflects changes during the learning process. Ensemble variables have proven to be useful for explaining emerging movement patterns. Vereijken, B., H. T. A. Whiting, et al. (1992). A dynamical systems approach to skill acquisition. The Quarterly Journal of Experimental Psychology 45A(2): 323-344.
39

3.5.3.1 Session 1 versus Session 3
The experimental design consisted of a three-way design with one randomized group and two
repeated factors for each channel of information. The randomized-groups independent
variable was experimental condition (with feedback versus without feedback) and the
dependent variables were µ and RMS. Four trials were considered for the analysis (trial 3,
trial 4, trial 5, and trial 6) either in Session 1 or Session 3. Session 2 was left out of this first
analysis. Given the mixed design the statistical analysis was concentrated on the main effects
of the experimental condition and its interactions as well as the main effects of the sessions,
trials, and their interactions.
A 2 x 2 x 4 mixed randomized-repeated ANOVA procedure was performed for both µ
and RMS for each channel of information, resulting in a total of 18 mixed randomized-
repeated analysis. Total of 24 subjects (11 in the without-feedback condition versus 13 in
the feedback condition) was reduced to 21 with the deletion of their corresponding data
N6. The
subjects whose data was deleted from the analysis belonged to the feedback condition.
Normality of sampling distribution and homogeneity of variance were evaluated. Two cells
did not meet normality of sampling when the measure was µ and six cells did not meet
Normality of sampling when the measure was RMS. Large scores in skewness and
kurtosis ( ,
z58.2≥z 0.0 1=α , two-tailed) were identified in some cells. In those cases,
outliers were identified as a possible cause for the non-Normality. Outliers were adjusted to
reduce their impact on the data set7. Homogeneity of variance was not met in channel 5 when
the measure was µ
max
and in channels 4, 5, and 8 when the measure was RMS. Heterogeneity
of variance in channel 5 and channel 8 were expected and were not worrisome because they
corresponded to the vertical acceleration of the back and the head of the subjects.
Heterogeneity of variance in channel 4, corresponding to the side-to-side acceleration of the
back, ( for channel 4 was 16.14) needed treatment; therefore, F α for testing all effects
6 One subject reported that he intentionally avoided looking at the display in the last session. Another subject reported that he had forgotten to watch the display during the last session. These two subjects had to be removed from the analysis because their data on Session 3 did not include any effect by the experimental condition. Another subject had an unusual posture during all the sessions that was not comparable to any of the postures adopted by the rest of the subjects. 7 Given an ordered set of data points { , if is identified as an outlier, the adjustment
for is . If is identified as an outlier, the adjustment for is .
} 1ynyyy ,,, 21 K
ny1yˆny
1y+ny
)(ˆ 1211 yyyy −+=)21 −− − nn y
ny ny(= y
40

was set to 0.025 to compensate for any inflation of Type I error rate due to heterogeneity of
variance.
The probability level for Maucheley’s test of sphericity for trial and for session by trial
interaction was smaller than 0.025 in channels 3, 7, 8, and 9 for µ and channels 2, 3, 4, 5, 6,
and 8 for RMS. This implied that sphericity assumption was not met. However, in some
cases such as channels 4 and 6, the Huynh-Feldt corrections were used.
There was a significant three-way interaction between session number, trial number, and
experimental condition in side-to-side RMS acceleration of the head, ,
, partial . Thus, 16% of the variance in RMS is attributable to the session,
trial, and experimental condition interaction. For a graphical understanding of the interaction,
means of the Simple Effects Analysis are plotted in Figure 3-7.
127.3)57,3( =F
016.0=p 16.2 =η
Figure 3-7 Average deviation of side-to-side mean head acceleration
Examination of Figure 3-7 confirms that on average, the variable RMS is affected in
Session 3 by the experimental condition. It is not clear from these plots if the effect is due to
the fact that all subjects in the feedback condition were looking at a fixed point in the room
(the monitor with the visual feedback) or if it is attributable to the feedback.
On each trial of Session 3, subjects in the feedback condition, on the average,
successfully brought the head to oscillate with less variability than subjects in the without-
41
feedback condition as shown by Figure 3-7. Nevertheless, this result does not imply that
subjects in the feedback condition performed better on the task (i.e. maintain the balance
board as still and as horizontal for as long as possible).
Additional and well-known effects approached statistical significance for both µ and
RMS.
1. Mean difference in µ and RMS between trials was concluded for channel 1 (side
to side µ and RMS of the balance board), 350.3)57,3( =F , ,
and
025.0=p
15.02 =η 977.3)3( 57, =F , 012.0=p , , respectively. 17.02 =η
2. Mean difference in RMS between trials was concluded for channel 4 (side to side
RMS of the back) and channel 7 (side to side RMS of the head), ,
, and
066.4)57,3( =F
011.0=p 18.02 =η 621.3)57,3( =F , 018.0=p , , respectively. 16.02 =η
3. Mean difference in µ
0=
between sessions was concluded for channel 6 (forward
and backward acceleration of the back) with an ,
,
420.34)19,1( =F
51019.1 −×=p 64.2η
4. Mean difference in RMS between sessions was concluded for channel 1 (side to
side RMS of the balance board), channel 4 (side to side RMS of the back), and
channel 6 (forward and backward RMS of the back). The respective F-values,
p-values and values are: 2η 550.27)19,1( =F
31.02 =η 19,1(
, , ,
, , ,
51057.4 −×=p
671.30)
59.02 =η
514.8)19,1( =F 009.0=p =F , ,
.
51042.2 −×=p
62.02 =η
A summary and graphical representation of the significant sources of variability of the
within subjects effects is provided in Figure 3-8.
To conclude the statistical analysis of Session 1 and Session 3, three final analysis were
performed on the ensemble variables: , , and . Statistically significant effects
between sessions were concluded for the three ensemble variables, where 52%, 44%, and
52% of their variability is attributed to the session effect. Their corresponding F and p-values
pEV bEV sEV
42

are: , for , 799.20)19,1( =F 41014.2 −×=p pEV 815.14)19,1( =F , 001.0=p for , and
, for .
bEV
802.20)19, = =p1(F 41014.2 −× sEV
µ µ µ
Between sessions
Between trials 3-way interaction
RMS RMS RMS Ch 1 59% 15% 17% Ch 2 Ch 4 31% 18% Ch 6 64% 62% Ch 7 16% 16% Ch 9
Figure 3-8 Significant sources of variability within subjects in Session 1 and Session 3
3.5.3.2 Strategies in Session 2
The design consisted of a three-way design with one randomized group and two repeated
factors for each ensemble variable: , , and . The randomized-groups
independent variable was experimental condition (with feedback versus without feedback)
pEV bEV sEV
43
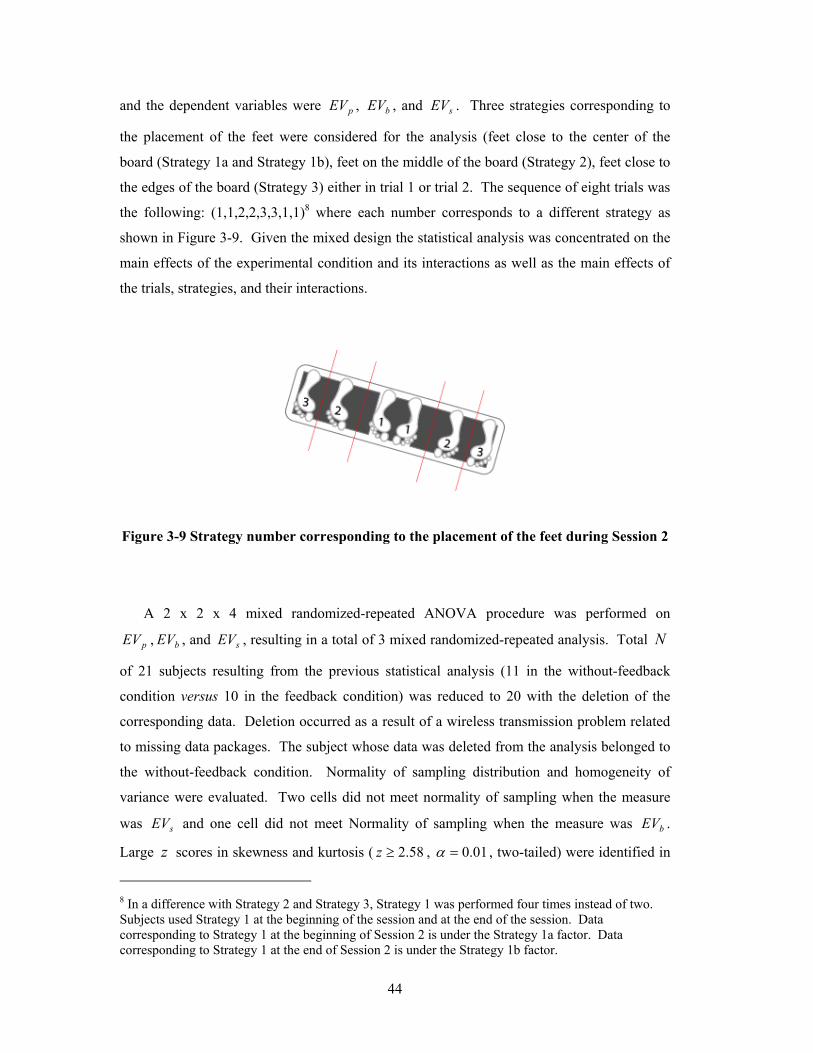
and the dependent variables were , , and . Three strategies corresponding to
the placement of the feet were considered for the analysis (feet close to the center of the
board (Strategy 1a and Strategy 1b), feet on the middle of the board (Strategy 2), feet close to
the edges of the board (Strategy 3) either in trial 1 or trial 2. The sequence of eight trials was
the following: (1,1,2,2,3,3,1,1)
pEV bEV
≥z
sEV
8 where each number corresponds to a different strategy as
shown in Figure 3-9. Given the mixed design the statistical analysis was concentrated on the
main effects of the experimental condition and its interactions as well as the main effects of
the trials, strategies, and their interactions.
=α
Figure 3-9 Strategy number corresponding to the placement of the feet during Session 2
A 2 x 2 x 4 mixed randomized-repeated ANOVA procedure was performed on
, , and , resulting in a total of 3 mixed randomized-repeated analysis. Total
of 21 subjects resulting from the previous statistical analysis (11 in the without-feedback
condition versus 10 in the feedback condition) was reduced to 20 with the deletion of the
corresponding data. Deletion occurred as a result of a wireless transmission problem related
to missing data packages. The subject whose data was deleted from the analysis belonged to
the without-feedback condition. Normality of sampling distribution and homogeneity of
variance were evaluated. Two cells did not meet normality of sampling when the measure
was and one cell did not meet Normality of sampling when the measure was .
Large scores in skewness and kurtosis ( ,
pEV bEV
sEV
z
sEV N
bEV
58.2 01.0 , two-tailed) were identified in
8 In a difference with Strategy 2 and Strategy 3, Strategy 1 was performed four times instead of two. Subjects used Strategy 1 at the beginning of the session and at the end of the session. Data corresponding to Strategy 1 at the beginning of Session 2 is under the Strategy 1a factor. Data corresponding to Strategy 1 at the end of Session 2 is under the Strategy 1b factor.
44

some cells. In those cases, outliers were identified as a possible cause for the non-Normality.
Outliers were adjusted to reduce their impact on the data set following the same conventions
of the previous statistical analysis.
The probability level for Maucheley’s test of sphericity for strategy and for trial by
strategy interaction was smaller than 0.025 in the system analysis. This implied that the
assumption of sphericity was not meet. However, the Huynh-Feldt correction was used.
There were significant effects between trials and between strategies in .
, , partial , and
pEV
371.15)18,1( =F 0001=p 46.02 =η 334.5)54,3( =F , , partial
respectively. This states that the variance in performance measure of the
platform’s control is mainly affected by practice (46%) and then, affected by the type of
strategy (23%). Means are plotted in Figure 3-10.
003.0=p
23.02 =η
Figure 3-10 Average aggregate deviation of mean platform acceleration (EVp) in
Session 2
Strategies 1a and 1b when seen as a single strategy performed in four trials (Strategy 1a
(Trial 1), Strategy 1a (Trial 2), Strategy 1b (Trial 1), and Strategy 1b (Trial 2)), shows the
biggest reduction in mean in both experimental conditions, as shown by Figure 3-10.
Strategy 1, in a difference with other strategies, incorporates the effects of practice and
pEV
45
learning in one session because this strategy had not been used by most of the subjects during
first session of the study.
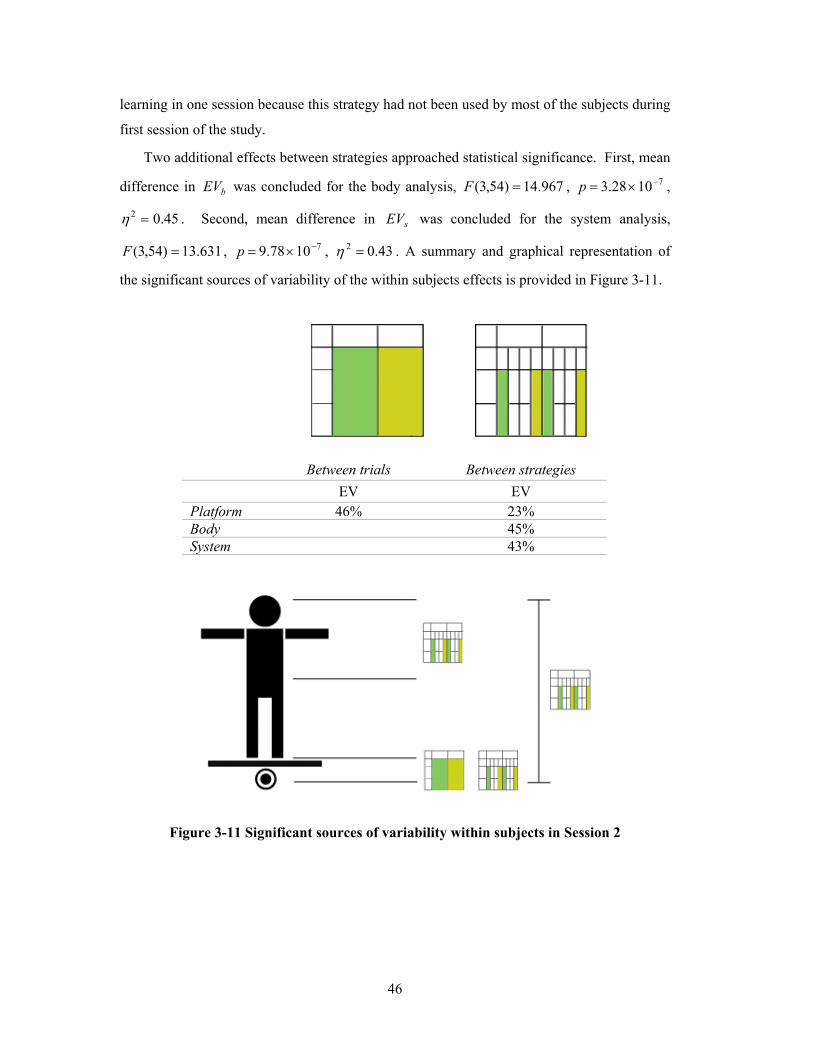
Two additional effects between strategies approached statistical significance. First, mean
difference in was concluded for the body analysis, bEV 967.14)54,3( =F , ,
. Second, mean difference in was concluded for the system analysis,
, , . A summary and graphical representation of
the significant sources of variability of the within subjects effects is provided in Figure 3-11.
71028.3 −×=p
45.02 =η
)54,3( =F
sEV
43631.13 71078.9 −×=p .02 =η
Between trials Between strategies EV EV
Platform 46% 23% Body 45% System 43%
Figure 3-11 Significant sources of variability within subjects in Session 2
46

3.6 Summary
This chapter presented the experimental design and results from the research study. In the
study, participants balanced on a moving platform with two-degrees of freedom,
approximately half of them receiving external-focus feedback. The feedback, provided by a
visual display and consisting of three squares, quantified how close a subject was to be
balanced by using color, movement, and size variations of the squares. Data was collected
from test subjects using a set of three-axis accelerometers: two accelerometers on the body
and one on the platform. This last accelerometer affected the movement and size of each of
the squares in the feedback system according to the acceleration experienced by the board in
two different axes: pitch and roll. The collected data from the board and the body was
processed in MATLAB® and analyzed in SPSS to determine the main effects of the
experimental condition and its interactions. The main effects of the session, trials, strategies,
and their interactions between experimental conditions were also analyzed.
In the analysis of Session 1 and Session 3 well-known effects approached statistical
significance for both µ and RMS. Mean differences between sessions and trials occurred.
The most interesting result from this analysis was the significant three-way interaction
between session number, trial number, and experimental condition in side-to-side RMS
acceleration of the head, which showed that on average, the experimental condition affected
the variable RMS in Session 3. On each trial of Session 3, subjects in the feedback condition,
on the average, brought the head to oscillate with less variability than subjects in the other
condition. The analysis of the strategies in Session 2 revealed that the variance in
performance measure of the platform’s control is affected by practice and the type of strategy
used. However, the mean difference in the ensemble variable of the body was statistically
significant only between strategies.
47

48

Chapter 4
How and what information is learned
Statistical results were presented in Chapter 3 regarding µ , RMS, and the ensemble variables
( , , and ). This chapter will present empirical relationships and intuitions about
learning, as well common and useful measures in motor control by focusing on and
. Although these ensemble variables are separately conceived as performance measures,
when jointly analyzed, they unveil their dual nature to explain both performance and
presumably learning. The approach is then to make inferences about learning on the basis of
the changes in behavior that were jointly observed and directly reported by the participants.
For most of the analysis presented in this chapter average performance curves and average
changes will be the main sources of information. Careful attention needs to be drawn to these
curves because they tend to obscure the variations that occurred within individual subjects
across trials and sessions. To overcome this problem, detailed individual analysis is included
in Chapter 5.
pEV
bEV
bEV sEV
pEV
4.1 Intuitions about the task
When confronted for the first time with the balancing task, participants faced two major
challenges: the understanding of the dynamics of the balance board and the discovery of
appropriate movement strategies to cope with the board. More than thinking about balance,
the task demanded a deeper insight into what was it that participants needed to control or not
to control, and what could or could not be changed. The ability and the knowledge necessary
49

to use their balance intuition and consciously or unconsciously modify them was expected to
be encouraged throughout the study.
At the beginning of Session 1, participants were asked to move the balance board with
their hands to understand its range of movement and familiarize themselves with the board;
however, most subjects did not seem to fully explore or understand the dynamics of the
balance board before the first trial of Session 1. Other experiences related to balance came to
their minds before creating new models for the task. In this way, the task was first
approached as transitions from other balance experiences.
4.1.1 Placement of the feet
Out of 20 subjects9, 80% of the participants reported to having an initial thought of where to
place their feet on the board before the first trial. Their intuitions were based on four ideas:
1. What they had seen in other balance tasks such as surfing, skating or acrobatics (one
subject reported “he thought of the guys that use a long pole in the circus”.);
2. What they conceived to be the most natural position for balance (i.e. wide stance);
3. Physics concepts (one subject reported that he thought about “using the moment
from Statics”.); dFM ×=
4. What they thought was a good exploration strategy (close to the middle to know if
the task demanded moving the feet inward or outward).
Based on their initial thoughts of how to approach the task, subjects, on the average,
placed their feet either close to the edges or on the middle of the board and found that the task
was more challenging than what they expected. Progressing through the eight trials of
Session 1, subjects either consciously or unconsciously changed the placement of their feet.
Although 75% of the subjects reported consciously exploring the dynamics of the platform by
changing the position of their feet on it10, the rest of the participants reported no doing so.
9 Subjects correspond to those that were included for the analysis presented in Chapter 3. 10 Four participants reported that changing the placement of their feet was useful all the time and six reported it was useful most of the time.
50

4.1.2 Focus of control
Half of the subjects reported that during the first trials of Session 1 their effort was put into
keeping the balance board from moving instead of trying not to interfere with the natural
movement of the platform. This is the same as dominating the system versus adapting into it.
From these people, 30% stated that the strategy was useful to maintain balance. But the
results differed for the last trials. The number of participants who explicitly chose to control
the balance board from moving was reduced to 20% of whom all of them agreed on the
usefulness of trying to dominate the system for maintaining balance.
It becomes apparent that the starting point for most of the subjects is to think that, for this
task, learning to keep the board as horizontal as possible has to do with learning to enforce
their own movements onto the board. But once subjects actually try to balance, their
intuitions change. The reflected change (from 50% to 20%) provides empirical support to say
that by the end of the Session 1, participants not only did not fully trust their original
intuitions but some even explored the impact of the placement of the feet on their reaction
time as well as on the amount of force required to perform the task.
4.2 Assumptions and memories of balance
During the Session 1 of the study, participants self-explored the task based on assumptions
that were not unreasonable in other contexts and then adopted different ways to approach the
task. Nevertheless, Session 2 saw an increase in the set of strategies related to the placement
of the feet on the board. For most of the subjects, at least one of the strategies of Session 2
had not been used during Session 1, hence it was expected that during this session
participants would identify one strategy to be the most appropriate for the task and
consequently use that same strategy during Session 3.
On the basis of the predictions of this study, results related to the persistence of the
acquired capability for performance under the experimental conditions are next presented.
Acquired capability refers to how well the balance skill was retained over time (retention)
and how useful was it to practice any strategy before asked to perform a specific one
(transfer). To evaluate retention and transfer, common methods and measures in motor
control and learning were used. On the one hand, transfer was measured by the percentage of
gain or loss of improvement in one strategy that was achieved by practice on another strategy.
This measure is known as Percentage Transfer (Schmidt and Lee 1999). On the other hand,
51
relative retention was evaluated using the Savings Score measure that corresponds to the
number of trials required for the subjects to reach the level of proficiency achieved in
previous practice. Both retention and transfer occurred in terms of the performance measure
(an aggregate measurement of error for the platform) previously described in Chapter 3. pEV
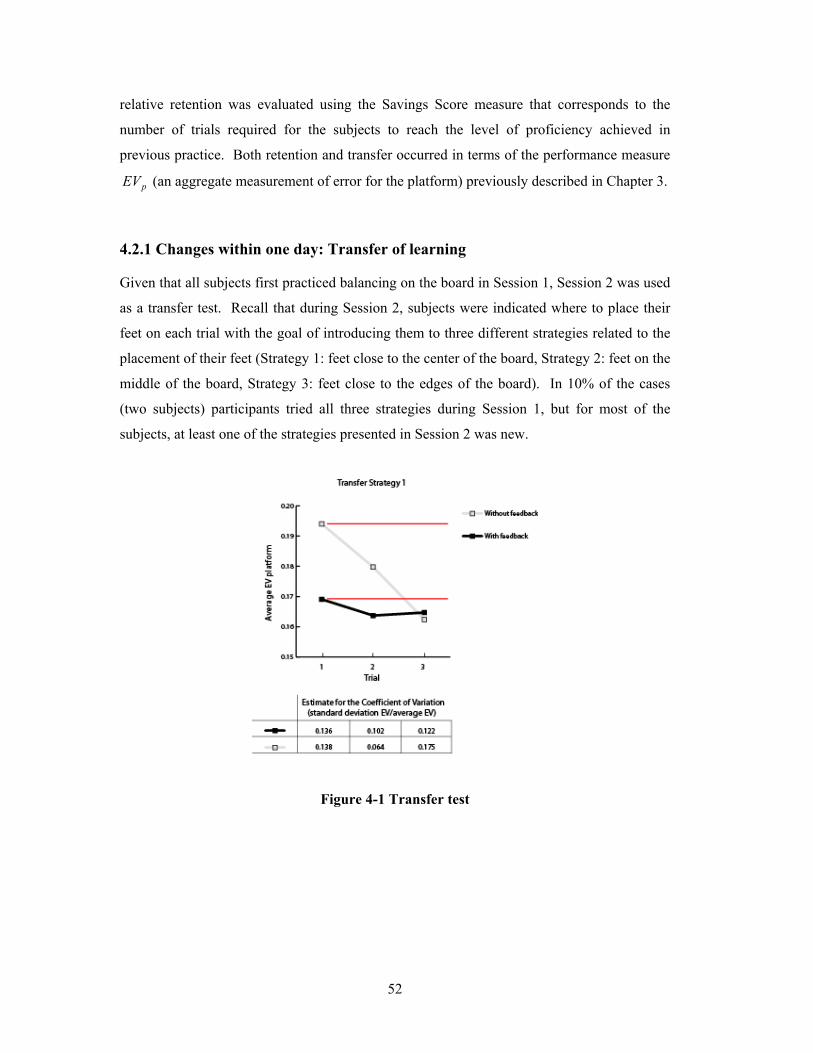
4.2.1 Changes within one day: Transfer of learning
Given that all subjects first practiced balancing on the board in Session 1, Session 2 was used
as a transfer test. Recall that during Session 2, subjects were indicated where to place their
feet on each trial with the goal of introducing them to three different strategies related to the
placement of their feet (Strategy 1: feet close to the center of the board, Strategy 2: feet on the
middle of the board, Strategy 3: feet close to the edges of the board). In 10% of the cases
(two subjects) participants tried all three strategies during Session 1, but for most of the
subjects, at least one of the strategies presented in Session 2 was new.
Figure 4-1 Transfer test
52

Under the feedback condition the group’s experience with other strategies in Session 1
provided for more than 80%11 of the improvement for the first three trials of Strategy 1 in
Session 2, as seen in Figure 4-1. Therefore, although it is not possible to infer the percentage
of learning from this data, it is possible to conclude that the skills involved in the first session
under the feedback condition have transferred to the skills involved in Strategy 1 as if
something that was learned in Session 1 was possibly applied to Strategy 1.
4.2.2 Changes within one week: Retention of skill
Session 3 served as a retention test, which was performed after a one-week retention interval.
During Session 3, subjects were asked to achieve best performance, and therefore chose the
strategy they thought was going to help them accomplish that goal. 90% of the subjects (18
subjects) chose Strategy 1.
Figure 4-2 Retention test
53
11 This percentage describes only the outward manifestations, i.e. performance, that resulted from the habit transfer.
Although the results show that performance in the first trial of Session 3 was not as good
as the last trial of the previous session, suggesting memory loss as possible reason for this,
recovery occurred immediately in the next trial (savings score of approximately 1 trial). This
fast rate of relearning suggests that retention was more or less complete; therefore, instead of
a memory loss the decrement in performance was possibly caused by the loss of non-memory
adjustments (bodily adjustments) critical to performance12.
4.3
The know how
As seen before, Session 2 played an important role during the study because it introduced
those strategies that participants had not tried in Session 1. Provided that no additional
information was given to the subjects but the placement of the feet, a big leap in the learning
process occurred as a result of being exposed to all the different strategies. Without doubt,
this session was a carrier of knowledge.
By the end of Session 2, 80% of the participants reported that they were planning on
using Strategy 1 in the next session. According to the accelerometer data, subjects seem to
unconsciously choose Strategy 1 as the best strategy based on its impact on upper body
control although they reported consciously choosing that strategy mainly according to one of
the following two reasons:
1. Good lateral control/ more control of the board/ ability to control methods and
movements;
2. How fun the task was with Strategy 113.
12 The Set Hypothesis states that “the loss of skill is related to the loss of set (one or more temporary internal states) that underlie and support the skill ” Schmidt, R. A. and T. D. Lee (1999). Motor control and learning a behavioral emphasis. Champaign, Human Kinetics. 13 One subject reported that he had chosen Strategy 1 because the task was more fun when using that strategy.
54

Average results for each condition show that scores were similar between Session 1
and Strategy 1 in Session 2 while scores differed for . Results from Table 4-1 suggest
that although the task was focused towards keeping the balance board as horizontal as
possible, after Session 2 subjects unconsciously hypothesized that by reducing body
oscillations they could perform better. Average results of for Session 3, where the main
strategy used by all subjects was Strategy 1, were the following: for the feedback
condition was 0.149 and for the without-feedback condition was 0.148. The immediate
effect was on the body and then, that effect was translated onto the board. Their strategy was,
thus, to ride the system and exploit the reactive forces. Hence, learning to keep the board as
horizontal as possible did not mean learning to control the board from moving, but learning to
reduce body oscillations.
pEV
bEV
pEV
pEV
pEV
Table 4-1 Ensemble variable scores for Session 1 and Strategy 1 in Session 2 of the
platform and the body
Average pEV bEVAverage
Session 1 Session 2 Session 1 Session 2
With feedback 0.169 0.163 0.228 0.163
Without feedback 0.176 0.175 0.230 0.178
With these results, the importance of Session 2 is again highlighted. It is not clear if
three sessions (structured like Session 1) would have been enough for people to hypothesize
and try different strategies to discover an appropriate movement coordination pattern. The
introduction of Session 2 as a hands-on-experience of movement strategies and modeling
encouraged participants to recognize and choose among different styles the way to approach
the task. It is probable that Session 2 unconsciously helped people to understand some of the
mechanical properties of the task that did not only include the platform, but the platform and
the body as a system. By doing so, people had at their disposal additional rules necessary to
perform the task. There are, however, marked individual differences that were not analyzed.
55
4.4 Visual feedback
Having identified that visual feedback could have positively benefited the transfer of
kinesthetic learning from one strategy to another, the next question to be addressed is if
participants in the feedback condition perceived it in the same way or not. Although in the
present study no data were collected about the subject’s perception of the feedback system in
each session, a few notes can be devoted to the results collected on the final session.
4.4.1 Learning and performance
In terms of learning, 60% 14of the subjects believed that the system helped them to learn to
balance faster than if they did not have had a display. Except for the data represented in
Table 4-1, the there is no evidence that the learning rate was significantly different between
experimental conditions. It is possible that participants might have perceived characteristics
in their own learning process that the sensors were not able to capture. That is, they
experienced a gain in the capability to think about learning while evident gains in
performance did not appeared. Sensors captured the output, but they missed to capture the
changes that happened on the inside.
Having described the perceived importance of the feedback system on the learning rate, a
surprising finding happened during the last session of the study. 20% of the participants
expressed belief that they would have performed better without a display. According to the
statistical analysis, no matter to which group they were assigned, participants, on the average,
showed similar performance results along the study, except for the lateral acceleration of the
head. As no further tests were performed in which people under the feedback condition were
asked to balance without feedback, this study cannot offer additional details about
performance when the display is removed.
4.4.2 The balance meter
Finally, a particular issue related to metrics of performance needs to be pointed out. In the
without-feedback condition, 40% of the subjects measured their performance based on a
metric present in the environment (i.e. the number of times the board touched the floor),
14 Using a 7-point scale ranging from 1 (not at all) to 7 (absolutely), that percentage corresponds to the fraction of participants that chose numbers 5, 6, and 7 as their answer.
56
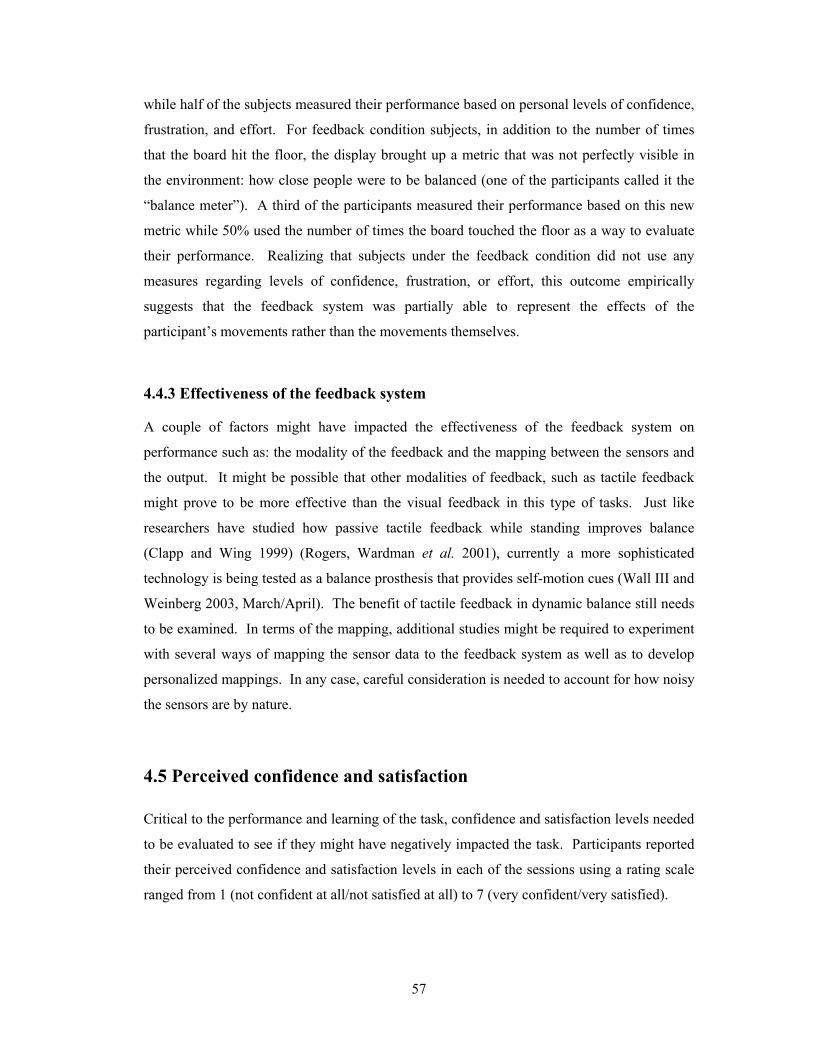
while half of the subjects measured their performance based on personal levels of confidence,
frustration, and effort. For feedback condition subjects, in addition to the number of times
that the board hit the floor, the display brought up a metric that was not perfectly visible in
the environment: how close people were to be balanced (one of the participants called it the
“balance meter”). A third of the participants measured their performance based on this new
metric while 50% used the number of times the board touched the floor as a way to evaluate
their performance. Realizing that subjects under the feedback condition did not use any
measures regarding levels of confidence, frustration, or effort, this outcome empirically
suggests that the feedback system was partially able to represent the effects of the
participant’s movements rather than the movements themselves.
4.4.3 Effectiveness of the feedback system
A couple of factors might have impacted the effectiveness of the feedback system on
performance such as: the modality of the feedback and the mapping between the sensors and
the output. It might be possible that other modalities of feedback, such as tactile feedback
might prove to be more effective than the visual feedback in this type of tasks. Just like
researchers have studied how passive tactile feedback while standing improves balance
(Clapp and Wing 1999) (Rogers, Wardman et al. 2001), currently a more sophisticated
technology is being tested as a balance prosthesis that provides self-motion cues (Wall III and
Weinberg 2003, March/April). The benefit of tactile feedback in dynamic balance still needs
to be examined. In terms of the mapping, additional studies might be required to experiment
with several ways of mapping the sensor data to the feedback system as well as to develop
personalized mappings. In any case, careful consideration is needed to account for how noisy
the sensors are by nature.
4.5 Perceived confidence and satisfaction
Critical to the performance and learning of the task, confidence and satisfaction levels needed
to be evaluated to see if they might have negatively impacted the task. Participants reported
their perceived confidence and satisfaction levels in each of the sessions using a rating scale
ranged from 1 (not confident at all/not satisfied at all) to 7 (very confident/very satisfied).
57
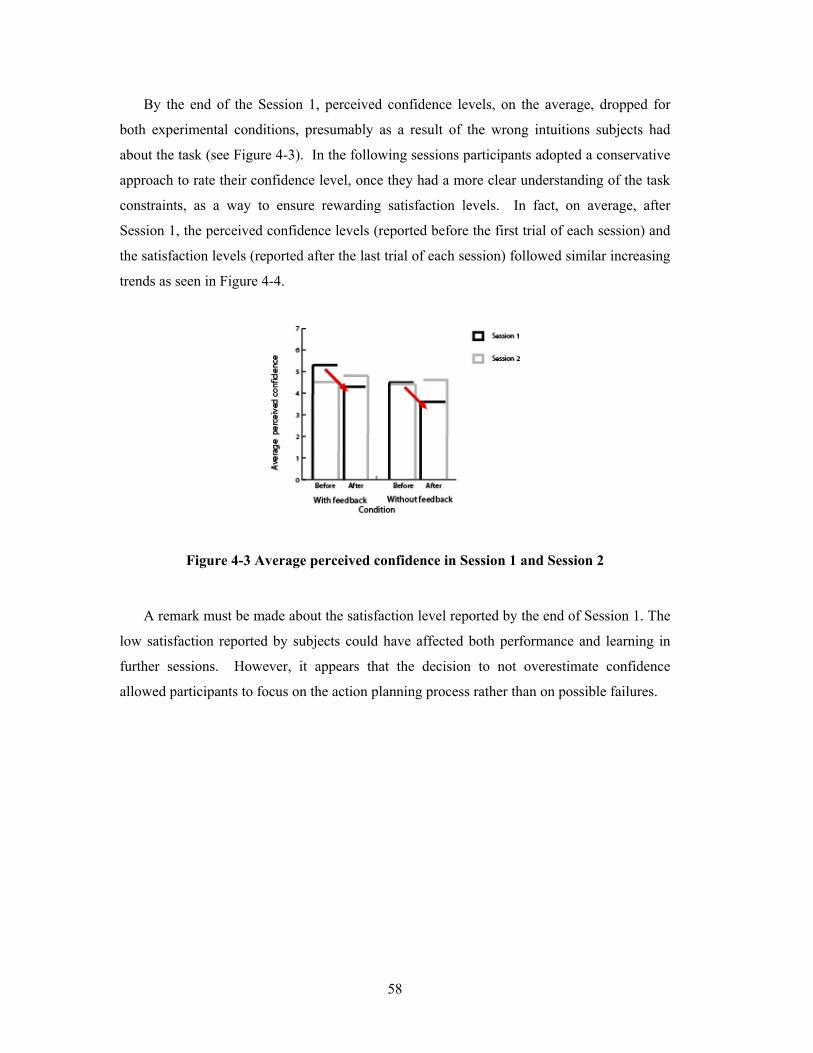
By the end of the Session 1, perceived confidence levels, on the average, dropped for
both experimental conditions, presumably as a result of the wrong intuitions subjects had
about the task (see Figure 4-3). In the following sessions participants adopted a conservative
approach to rate their confidence level, once they had a more clear understanding of the task
constraints, as a way to ensure rewarding satisfaction levels. In fact, on average, after
Session 1, the perceived confidence levels (reported before the first trial of each session) and
the satisfaction levels (reported after the last trial of each session) followed similar increasing
trends as seen in Figure 4-4.
Figure 4-3 Average perceived confidence in Session 1 and Session 2
A remark must be made about the satisfaction level reported by the end of Session 1. The
low satisfaction reported by subjects could have affected both performance and learning in
further sessions. However, it appears that the decision to not overestimate confidence
allowed participants to focus on the action planning process rather than on possible failures.
58

59
4.6
Figure 4-4 Average perceived confidence and satisfaction by experimental condition
Summary
The most salient results for explaining how and what was learned during this study were
presented throughout this chapter. On the one hand, at the beginning of the first session all
participants had the wrong intuitions about balancing. They balanced with their feet wide
apart (which is possible, but requires much more practice) and tried to impose correcting
mechanisms solely based on the tilt of the balance board. Throughout the rest of the sessions
and trials participants developed new ways to approach the task by riding the system and
exploiting the reactive forces. Hence, learning to keep the board as horizontal as possible did
not mean learning to control the board from moving, but learning to reduce body oscillations.
On the other hand, the visual feedback system, although it did not significantly impacted
performance, might have impacted the learning process according to the participants’
perspective. However, none of the variables analyzed were able to capture that learning-
support. What was in fact captured was the partial success of the system to become a
“balance meter”. The display brought up a metric that was not perfectly visible in the
environment and although it was not the most natural way to measure performance, 30% of
the subjects adopted it.

60
Chapter 5
Model and algorithm
So far the discussion has been focused in fragmented results from the research study. To fuse
everything together, this chapter presents a formal model of relationships and choices in the
balance-task domain of the study. The algorithm emerges from an agent-based model
grounded on the abstract framework of choices of Anigrafs™ (Richards 2003). This
framework allows for the construction of a useful topology that is consistent with the
constraints of the task and the subjects themselves. The degree to which the model and the
algorithm explain, or have the potential to explain the observed phenomena is partially
explored through an individual analysis.
5.1 Model and algorithm specifications
Modeling of the experimental paradigm (emerging strategies as a result of a process of
correction) is particularly convenient to understand and represent the learning process, as the
strategies used during the three sessions varied between subjects. Various models have been
developed for task specific studies to analyze control schemes, but none of them has as its
particular goal to develop an algorithm to articulate the process of correction. Therefore, the
model and the algorithm presented in this chapter will attempt to provide such a relationship
between strategies and their transitions in time. To do so, the model and the algorithm must
be able to account for well-known biomechanical, control, and task constraints that play a
role in forcing the selection of strategies (Kuo 1995). On the one hand, the model must be
able to: 1) account for a scheme that is sufficient to reproduce major characteristics of human
61

responses similar to that observed experimentally and 2) simulate the two most common
strategies in balance control: ankle and hip strategies. In other words, the model should be
able to represent a one-segment inverted pendulum (ankle strategy) or a two-segment
inverted pendulum (hip strategy). On the other hand, the algorithm must be able to: 1)
describe controls in the strategy space and 2) consider subject differences. With these
principles in mind, a model and an algorithm to describe the process of correction are next
introduced.
5.2 Description of the model
Let the following map be a reduced-order six state system of the body. Where each node
represents the following body parts: node H is the head, nodes R and L are the right and left
arms respectively, node T corresponds to the torso, node P are the hips, and node F represents
the feet.
Figure 5-1 Graphical representation of a six-order state system of the body
Nodes are linked to each other in a non-arbitrary way just like body parts are related to
each other. H, R, and L are connected to T; T is connected to H, which is connected to F.
The bi-directional connections among nodes in this graph (see Figure 5-1) represent feasible
interactions and allows for the existence of a top-down or a bottom-up flow of information as
suggested by the discrete modes of perception approach to postural adjustment (Kandel,
Schwartz et al. 2000). In this way, this rough and simple representation of the body is the
topology of the model to be used in this section: an Anigraf™.
62

An Anigraf™ is a graphical representation of a network of agents that have preferences
for a set of different actions (Richards 2003). It is abstracted as a map consisting of nodes
(agents), edges (preferences), and weight variables (voting power) that represent the system
as a whole.
The vertices (nodes) of the graph correspond to the different actions, and the edges of the graph show the similarity relations between the set of actions. The agent’s second choice(s) will be those actions most similar (i.e. adjacent nodes in the graph.) Weights or nodes reflect the numbers, or strengths of each type of agents. These weights, together with the preference ordering on actions for each type of agent are used to determine which particular action the system will take place (Richards 2004).
Because each agent has preferences, agents use their vote-power to define the next stage
in the social system. Hence, after all actions are compared paired-wise, the agent who wins
drives the action.
In some cases there will be no unique winner. Both the topology of the graph, as well as the voting strengths play the principal role in whether or not the group of agents can reach an agreement, or will suffer a settlement, which often may lead to chaotic series of outcomes for the system (Richards 2004).
Therefore, useful topologies are needed in order to achieve consensus.
5.2.1 The control structure
In this model that will be further referred as the Balancer, controls are described in strategy
space, where strategies are defined as the collective assembling of motor patterns of the
different agents (parts of the body) while trying to balance. Hence, the strategy space
consists of all the possible voting power (weight) combinations of the agents H, T, L,
R, P, and F that are constrained by the task. Although it will be assumed that the voting
power can take any number in the interval [0,10], as seen before, not every combination of
weights will result in consensus nor will represent a strategy that is biomechanically feasible.
6=n
63
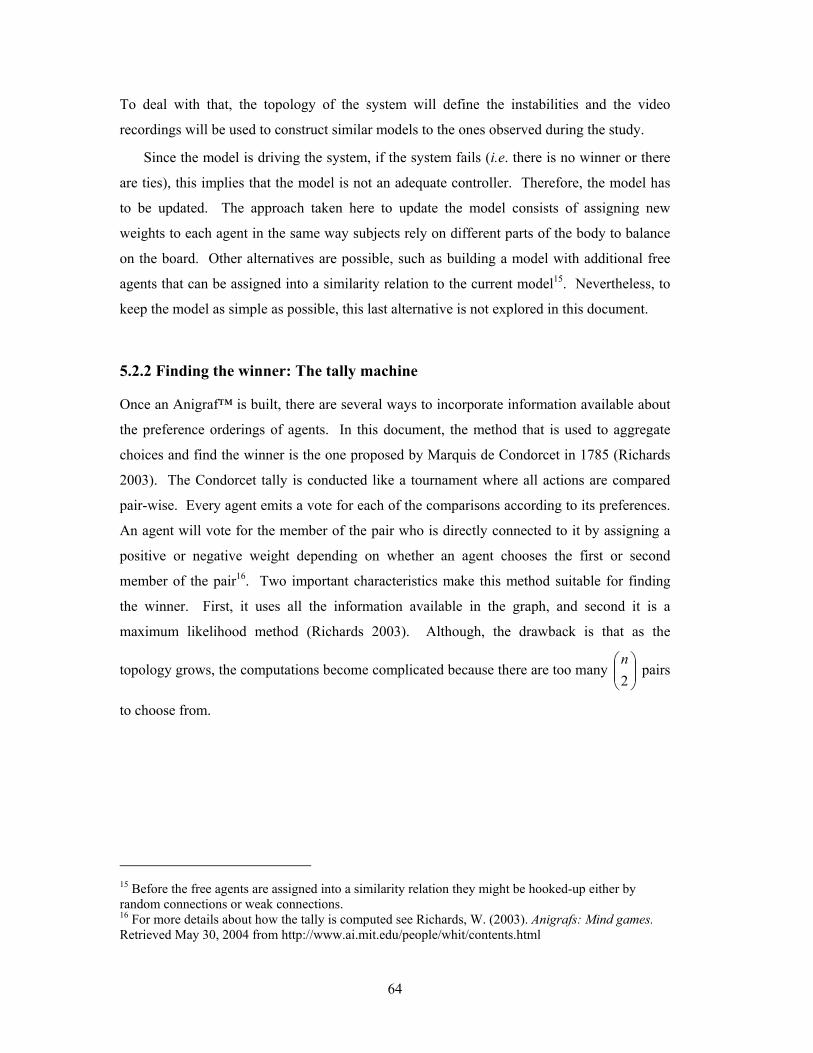
To deal with that, the topology of the system will define the instabilities and the video
recordings will be used to construct similar models to the ones observed during the study.
Since the model is driving the system, if the system fails (i.e. there is no winner or there
are ties), this implies that the model is not an adequate controller. Therefore, the model has
to be updated. The approach taken here to update the model consists of assigning new
weights to each agent in the same way subjects rely on different parts of the body to balance
on the board. Other alternatives are possible, such as building a model with additional free
agents that can be assigned into a similarity relation to the current model15. Nevertheless, to
keep the model as simple as possible, this last alternative is not explored in this document.
5.2.2 Finding the winner: The tally machine
Once an Anigraf™ is built, there are several ways to incorporate information available about
the preference orderings of agents. In this document, the method that is used to aggregate
choices and find the winner is the one proposed by Marquis de Condorcet in 1785 (Richards
2003). The Condorcet tally is conducted like a tournament where all actions are compared
pair-wise. Every agent emits a vote for each of the comparisons according to its preferences.
An agent will vote for the member of the pair who is directly connected to it by assigning a
positive or negative weight depending on whether an agent chooses the first or second
member of the pair16. Two important characteristics make this method suitable for finding
the winner. First, it uses all the information available in the graph, and second it is a
maximum likelihood method (Richards 2003). Although, the drawback is that as the
topology grows, the computations become complicated because there are too many pairs
to choose from.
2n
15 Before the free agents are assigned into a similarity relation they might be hooked-up either by random connections or weak connections. 16 For more details about how the tally is computed see Richards, W. (2003). Anigrafs: Mind games. Retrieved May 30, 2004 from http://www.ai.mit.edu/people/whit/contents.html
64
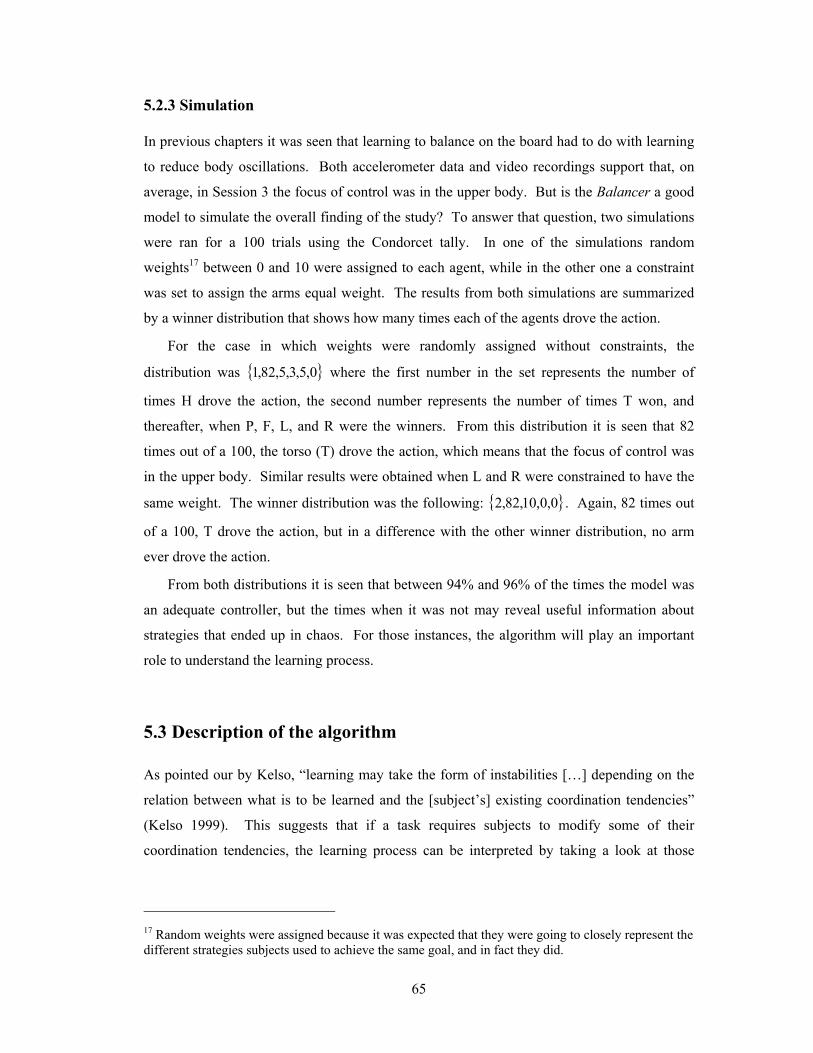
5.2.3 Simulation
In previous chapters it was seen that learning to balance on the board had to do with learning
to reduce body oscillations. Both accelerometer data and video recordings support that, on
average, in Session 3 the focus of control was in the upper body. But is the Balancer a good
model to simulate the overall finding of the study? To answer that question, two simulations
were ran for a 100 trials using the Condorcet tally. In one of the simulations random
weights17 between 0 and 10 were assigned to each agent, while in the other one a constraint
was set to assign the arms equal weight. The results from both simulations are summarized
by a winner distribution that shows how many times each of the agents drove the action.
For the case in which weights were randomly assigned without constraints, the
distribution was { where the first number in the set represents the number of
times H drove the action, the second number represents the number of times T won, and
thereafter, when P, F, L, and R were the winners. From this distribution it is seen that 82
times out of a 100, the torso (T) drove the action, which means that the focus of control was
in the upper body. Similar results were obtained when L and R were constrained to have the
same weight. The winner distribution was the following:
}0,5,3,5,82,1
{ }0,0,10,82,2 . Again, 82 times out
of a 100, T drove the action, but in a difference with the other winner distribution, no arm
ever drove the action.
From both distributions it is seen that between 94% and 96% of the times the model was
an adequate controller, but the times when it was not may reveal useful information about
strategies that ended up in chaos. For those instances, the algorithm will play an important
role to understand the learning process.
5.3
Description of the algorithm
As pointed our by Kelso, “learning may take the form of instabilities […] depending on the
relation between what is to be learned and the [subject’s] existing coordination tendencies”
(Kelso 1999). This suggests that if a task requires subjects to modify some of their
coordination tendencies, the learning process can be interpreted by taking a look at those
17 Random weights were assigned because it was expected that they were going to closely represent the different strategies subjects used to achieve the same goal, and in fact they did.
65

times when the instabilities occurred. The relationship between the stabilities and the
instabilities (mentioned by Kelso) is what this research describes as the process of correction.
5.3.1 Understanding zones of chaos
From the Balancer perspective, instabilities occur when the voting process results in no-
winner due to the combination of the agents’ voting power. Therefore, to create an
algorithm, there is a need to understand if, in fact, the changes in movement coordination
happened as a result of an unstable strategy selection that ended up in a no-winner according
to the Balancer model. To do so, the approach will be to define the individual learner as the
unit of analysis.
5.3.1.1 Strategy A
Let the following set of weights be the voting powers of each of the agents defining a balance
strategy in the Balancer model, namely Strategy A:
{ } { }6,6,9,5,0,0,,,,, =RLFPTH wwwwww . Equation 5-1
Where wH is the voting power of agent H, is the voting power of agent T, and so forth.
Voting power in the Balancer model is assigned according to how much participation the
agent shows in the social system, in this case, the balancing task. Therefore, a weight of 0
represents null participation, and a weight of 10 represents the maximum involvement.
Hence, Equation 5-1 states that the feet are heavily involved in Strategy A, while neither the
head nor the torso are. Once an individual learner is defined, and weights are given to every
node of the Balancer model, the Condorcet tally takes place.
wT
Based on these weights the Condorcet procedure did not yield a winner (i.e. the model
was not an adequate controller), and according to the video recordings, the subject was not
able to balance using this strategy. Since the system failed the model had to be updated, from
the Balancer perspective, or a different strategy needed to be explored, from the perspective
of the subject. In fact, that is what happened. In the next two trials of Session 1 the subject
slightly modified Strategy A by exploring new ways of incorporating the head into the
strategy and modifying the participation of the arms.
66

To represent the impact of such modifications suppose that from the six agents only two
of them could accept modifications to their original voting power, say H and L. Therefore, it
would be useful to have a map that could depict unstable zones such that one could know
which combination of weights would result in appropriate controllers for the Balancer model.
Using a color-coded representation of multiple Condorcet procedures (Purtell 2004), a
strategy map was built to show the regions of chaos (textured areas) and stable regions (full-
colored areas) of the Balancer with weights { }6,,9,5,0, yx .
A strategy map is a modeled representation of stable and unstable zones of coordination
tendencies described by the set of weights of the Balancer model. When a set of weights
(strategy) falls in an unstable zone then it is said that the Balancer is not and adequate
controller of the system. Both x and y can take any value in the range of [0,10] and each node
is represented by a color. For this model the color-coding is:
each of which represent
respectively.
{ }magentabluecyangreenyellowred ,,,,, { }RLFPTH ,,,,,
Figure 5-2 Strategy map for the Balancer model: { }6,,9,5,0, yx
As seen in Figure 5-2, although the map shows that there are some areas of stability for
T, P, F, and L, it is easy to imagine that if weights for H and L are randomly chosen from a
uniform distribution, about 65% of the times the combination will be placed in a chaotic
zone. The rationale behind this is the following: approximately 65% of the total area
corresponds to unstable zones of T, P, and F; T and F; and P and F. Although certain
67
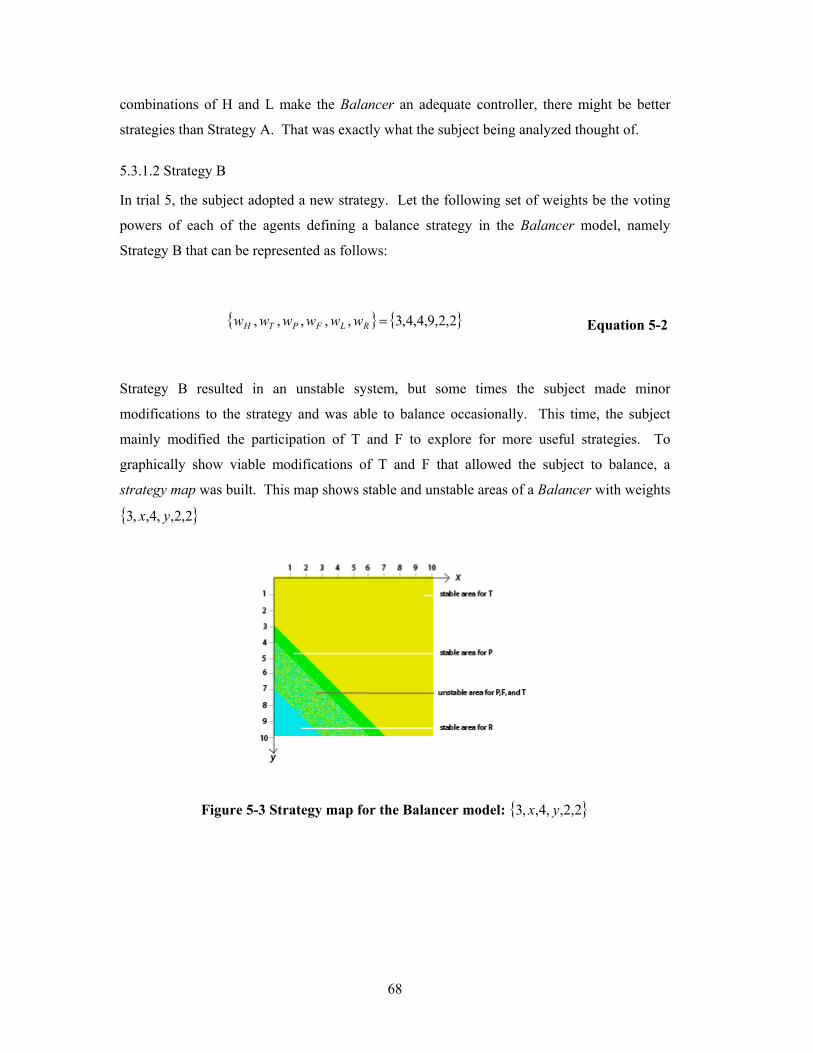
combinations of H and L make the Balancer an adequate controller, there might be better
strategies than Strategy A. That was exactly what the subject being analyzed thought of.
5.3.1.2 Strategy B
In trial 5, the subject adopted a new strategy. Let the following set of weights be the voting
powers of each of the agents defining a balance strategy in the Balancer model, namely
Strategy B that can be represented as follows:
{ } { }2,2,9,4,4,3,,,,, =RLFPTH wwwwww Equation 5-2
Strategy B resulted in an unstable system, but some times the subject made minor
modifications to the strategy and was able to balance occasionally. This time, the subject
mainly modified the participation of T and F to explore for more useful strategies. To
graphically show viable modifications of T and F that allowed the subject to balance, a
strategy map was built. This map shows stable and unstable areas of a Balancer with weights
{ }2,2,,4,,3 yx
Figure 5-3 Strategy map for the Balancer model: { }2,2,,4,,3 yx
68

As seen in Figure 5-3 the chaotic area has greatly decreased while the area where T is
stable has considerably increased with the new set of weights. Once again, instabilities occur
between T, P, and F but with less probability. Hence, this research will assume that Equation
5-2 represents a set of strategies that are more suitable for the task, than the ones represented
by Equation 5-1. By comparing the different strategies and the regions of chaos in Figure 5-2
and Figure 5-3 it can be conjectured that changes in movement coordination happened as a
result of an unstable strategy selection that ended up in a no-winner according to the Balancer
model.
5.3.1.3 Strategy C
While Strategy A and Strategy B were not adequate controllers for the Balancer, a new
strategy used in Session 3 was an adequate controller. This strategy, Strategy C with weights:
, heavily involved the torso during the balancing task. In fact, the Condorcet
procedure found that in this system T was driving the system. This result was not surprising
as previous analysis presented in this document had suggested that learning to balance had to
with learning to reduce body oscillations. However, finding that the Balancer could represent
actual strategies seen during the study suggests that the model proposed accounts both for
individual differences and average behavior.
{ 2,2,9,5,9,0 }
Like with previous strategies, the subject made minor modifications to Strategy C during
the last session of the study, but this time most of them were appropriate controllers for the
Balancer. It appears that Strategy C allowed the subject to make adjustments to the original
strategy without loosing control. Which presumably suggests that the vicinity of strategies
close to Strategy C contained good controllers as well. Further explanation of the role of a
vicinity of appropriate controllers (i.e. a vicinity of balance) is explored through a proposal of
how subjects might discern between strategies until they discover the vicinity that satisfies
the property of allowing for modifications without loosing control.
5.3.2 Balance conjectures
Let t be the value that corresponds to subject’s s threshold of displacement from the
balance board’s current position that will allow him/her to maintain balance at the time
kstgs,∂ε
tt ∂+ , where denotes the strategy used at time t, in this case Strategy k. Let t be kstg kstgsr ,∂
69

a function of such that t represents the radius of a two-dimensional sphere in
a strategy map that encloses adequate controllers for the Balancer model of subject s in the
time interval (t,
kstgst
,∂ε
tt
kstgsr ,∂
∂+ ]
,0>
kstg
stg ,,2 K
{X 1 ,
mY<<K
m
1-1 Conjecture 1: If t then subject s will be able to balance at time t, kstgsr∂ t∂+
whenever changes to Strategy k originate a Strategy k + 1 that falls within the border of
the sphere defined by t . sr ,∂
Let be m strategies each of which are adequate controllers for the
Balancer model at time t such that
mstgstg ,1
} { }mstgst
stgst
stgstm rrrXX ,,,
2 ,,,,, 21∂∂∂ KK = are their
respective radiuses.
1-2 Conjecture 2: If the radiuses of a set of adequate controllers for the Balancer at time t
are reorder so that Y Y< 21 , where Y and Y , then the best
balance strategy is given by Y .
jjXmin1 = jjm Xmax=
Conjecture 1 postulates a relationship between when the tilt is too much to actually be
able to control it and the boundaries of stable regions in a strategy map. The conjecture
claims that a subject will be able to balance if the new strategy chosen lies within the
boundaries of a stable sphere as shown by Figure 5-4. There might be cases in which the new
strategy might lie outside the sphere defined by t and the subject might be able to
balance. In those cases, it is expected that the new strategy will lie within another stable
region. However, there is no way to ensure that outside the stable sphere are non-chaotic
regions. In this way, it seems that subjects define by exploring different alternatives
during the learning process, and once they find a strategy that suits the task purpose, they
concentrate on exploring strategies similar to the one they have discovered as useful.
kstgsr ,∂
kstgst
,∂ε
70

Figure 5-4 Graphical representation of Conjecture 1
Subjects build strategy maps just like they build imaginary maps of cities and routes.
They all start with a first strategy and explore its vicinity. By doing so, they build a map in
their minds about possible stable and unstable areas. Some subjects drastically change
strategies, which means that they build a completely new strategy map. Hence, by having a
collection of different maps, given a strategy subjects are capable of defining that
allows them to change their strategy according to the task and the environmental demands.
Based on Conjecture 2, which claims that given m strategies the one with the largest radius is
the best strategy, the final goal might be to adopt the strategy that allows for the greatest
number of changes in the agents’ voting power and at the same time satisfies the subjects’
expected performance.
kstgst
,∂ε
5.3.3 Learning conjecture
1-3 Conjecture 3: Thinking about innate abilities for performance and learning, map-
building mechanisms that evolve from building own maps in real space are translated
into building maps in a balance-strategy space.
What this conjecture suggests is that, considering what is natural to people (i.e. building
maps), looking for correctibility and restorability of stability is related to learning boundary
conditions. Therefore, by using the Euclidian space, maps that result from the Balancer are
bringing continuity and the concept of a metric. They depict how much of the deviation of
71

the conditions a subject is adapted to can be tolerated by himself or herself. This concept
connects to genetics and the evolution of species theory. This theory states that survivability
occurs when there is sufficient diversity in the gene pool so that if conditions change they can
adapt and survive. In this sense, learning to balance is related to surviving and adapting to
changes.
5.4 Summary
A model and an algorithm were presented to explain how subjects in this study discovered
and chose between appropriate strategies for balance. The approach taken was to build an
Anigraf™, namely the Balancer, to build the framework for a description of the process of
correction by using strategy maps. To a first approximation, the representation problem was
constrained to a reduced-order six state system of the body. Despite this reduced
dimensionality, the model successfully represented individual and average behavior.
On the theoretical side, three conjectures were postulated to explain how subjects were
involved in building and exploring the strategy maps to determine how they chose which
strategy to use at the right time. In principle, the conjectures rely on subjects building their
own maps, just like they build imaginary maps of cities and routes, but one can imagine
aiding the learners in this construction process.
72

Chapter 6
Conclusion and future work
6.1 An overall summary
Now is time to sum up the ideas and results presented in this work. The first part of this
document (Chapter 3 and Chapter 4) analyzed the dynamics of trying to balance on a two-
degrees of freedom balance board under two experimental conditions: with feedback and
without feedback. The feedback system, which consisted of a visual display that was
controlled by the acceleration of the board in the pitch and roll axes, had no significant
impact in performance. Nevertheless, it positively affected the transfer of learning between
strategies and most importantly, it brought up a performance metric that was not perfectly
visible in the environment: how close people were to be balanced.
In this study, the experimental design allowed subjects to explore different strategies in a
constrained amount of time. Although real-practice time was limited to 12 minutes total, the
structure of the experiment allowed for the learning process to unfold progressively and fully
to the expected levels of performance. At the beginning of the study, subjects had the wrong
intuitions about balancing. But during practice, and as a result of the exploration of different
strategies, subjects learned not to counteract the dynamics of the board but rather exploit
them. Participants evolved from having fragmented constructions of the task to engaging
mechanisms that synthesized all the multiple executions allowing them to seek the most
useful information for regulating the action. Although all the mechanisms of selection have
yet to be deciphered, the study revealed at least one that was simple and efficient: reducing
body oscillations to balance on the board.
73

The second part of this study documented a model and an algorithm to describe the
process of correction. The approach taken was to build an Anigraf™ (Richards 2003),
namely the Balancer, which allows, in principle, for a personalized study of the learning
process since the weights for each node can be assigned according to the strategy used.
Although the Balancer is a simplified model of the task and the strategies, it demonstrated to
account both for individual differences and average behavior. The fact that as seen by the
data the effect of the difference on the control of the platform was through the body, leads to
believe that that Balancer is a good model for the task.
The novel approach taken in this document was describing the process of correction by
focusing on vicinities of balance in strategy maps (which is closely related to the concept of
attractors). The explanation of how subjects build strategy maps and therefore decide on
which strategy to use, was given by three conjectures which are the core of the algorithm.
The first one postulated a relationship between when the tilt is too much to actually be able to
control it and the boundaries of stable regions in a strategy map; and the second conjecture
defined a rule for choosing the best strategy from a set of n strategies. The final conjecture
postulated how learning boundary conditions in the strategy space evolve from our innate
ability to build maps. Hence, this work claims that thinking in terms of vicinities in strategy
maps is useful because, similar to what Peper et al. said in Catching Balls (Peper, Bootsma et
al. 1994), this information does not specify when to [chose what] but how to [chose] the right
[strategy] at the right time without worrying about [what combination] it will be (Berthoz
2000).
Defining suitable strategies, should comprise more than comparing regions of stability or
sets of weights. However, the approach presented in this document helped in understanding
how a subject achieved kinetic coherence. What this work has done is understand the process
of learning a physical skill from a map-like perspective. By building strategy maps that
capture the strategies’ consequences, the searching pattern for adequate controllers (optimal
combinations of motor patterns) can be clearly represented and could be predicted.
74

6.2 Two questions that remain unanswered
During the development of this thesis two main questions arose:
1. What would have been the effect in the chosen final strategy if subjects were told to
reduce body oscillations instead of asking them to change the placement of their feet?
2. Did the feedback provide with information that people could handle and manipulate?
Although no further studies were conducted to provide conclusive answers to these questions,
a couple of insights about possible answers can be extracted both from the data collected and
from the researchers’ thoughts.
It might be possible that what people learned so easily (to re-frame the objective to
balance their own body instead of the board itself and to reduce body oscillations as a result
of the placement of their feet) can become complicated if they are asked to do so consciously.
Changing the placement of the feet to improve stability is somehow intuitive, but thinking
about what to do with the torso for posture or balance is not. A deeper probe into how people
use deliberative and conscious strategies is needed in order to understand how the conscious
and unconscious play together in this particular balancing task.
Balance is a non-stationary process in which responses might be different whether the
feedback provided is about the platform or the body. Recall that the feedback system used in
the study provided error information about the board and not about the body. The visual
system was expected to generate a temporary visual map of the task by guiding the learner
through the action planning process. Unfortunately, there is only a weak statistical link that
supports this in terms of performance. In terms of learning, participants agreed on the
usefulness of the system but none of the ensemble variables was able to reflect this impact.
Therefore there is a need to run further studies to analyze the impact of corporal feedback in
this particular task.
75

6.3 Suggestions for further work
The study showed that learning to balance on the board was characterized by an important
development in the coordination of the system which included the platform and the body.
The torso became progressively involved in the coordinative structure that allowed a finer
control of the oscillations of the board. During the study, participants might have learned a
new skill, but more than that, they acquired new ways to use what they already knew about
balance.
For a better understanding of the learning process expansion of the research presented in
this thesis may proceed along two fronts: conducting studies to test different mapping
functions and different feedback modalities and/or incorporating indices or methodologies for
assigning weights to the Balancer. In the current feedback system there was no additional
way to control for the ability of the feedback to give localizing information; therefore other
researchers should pursue finding ways to control it. Doing so, performance might be
affected. In addition, the use of tactile or musical feedback as well as other mapping
functions should be investigated in this balancing task. Along the lines of the second
suggestion for further work, researchers might want to consider the use of anchoring indices
(Assaiante and Amblard 1993) to assign weights to the Balancer. The current model does not
provide a methodology to compare the stabilization of a body part with respect to the space or
with respect to another body part. The weights given to the model of one of the participants
in the study were based on interpretations of the recorded sessions. By using anchoring
indices, the assigned weights will be sensor-based and will not require subjectivity.
76

Appendix A
Balance Self Test
1. Have you fallen more than once in the past year due to an unexplained reason?
Yes No
2. Do you take medicine for two or more of the following diseases: heart disease, osteoporosis, hypertension, arthritis, anxiety, and depression?
Yes No
3. Do you feel dizzy or unsteady if you make sudden changes in movement such as bending down or quickly turning?
Yes No
4. Do you have black-outs or seizures?
Yes No
5. Have you experienced a stroke or other neurological problem that has
affected your balance?
Yes No
6. Do you experience numbness or loss of sensation in your legs and/or feet?
Yes No
7. Do you use a walker or wheel chair, or do you need assistance to get
around?
Yes No
8. Are you inactive? (Answer yes if you do not participate in a regular form of
exercise, such as walking or exercising 20-30 minutes at least three times a
Yes No
77
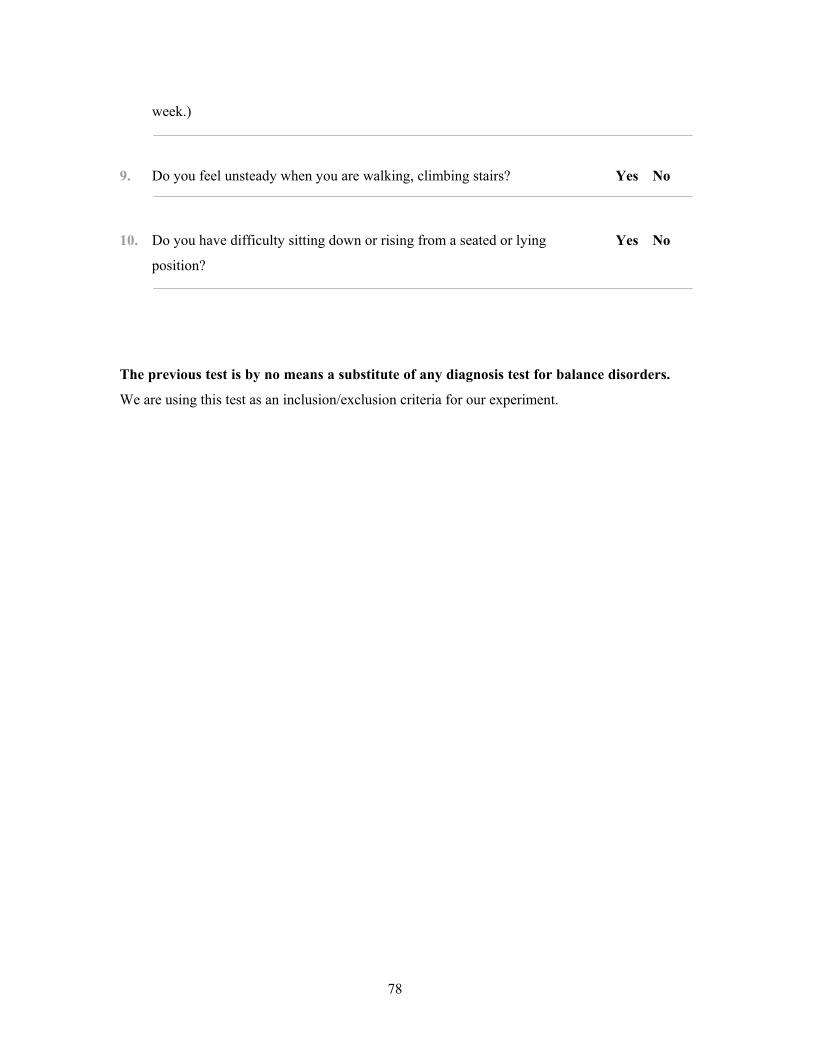
week.)
9. Do you feel unsteady when you are walking, climbing stairs?
Yes No
10. Do you have difficulty sitting down or rising from a seated or lying
position?
Yes No
The previous test is by no means a substitute of any diagnosis test for balance disorders.
We are using this test as an inclusion/exclusion criteria for our experiment.
78

Appendix B
Post-task questionnaire Session 1 I. YOUR STRATEGY 1. When you first saw the board, did you have any initial thought on where would you place your feet?
a. No b. Yes
If yes, please explain why did you think this would work. _____________________________________________________________ _____________________________________________________________ 2. Where did you place your feet on the first trial? Please sketch. 3. Did you consciously change the placement of your feet along the board during the trials?
a. Yes b. No c. I don’t recall
If yes, please explain why _____________________________________________________________ _____________________________________________________________
If yes, was it useful?
All the time Most of the time Sometimes Rarely Not at all
79

4. Where did you place your feet on later trials? Please sketch. 5. Besides the position of your feet on the platform, what other parts of your body do you remember using to control and maintain balance? Please circle all the body parts you used. If any part is not listed, include it.
a. Head b. Shoulders c. Arms d. Pelvis e. Knees f. Ankles g. Other_________________________ h. I don’t recall
6. Try to explain your strategy during the first trials.
6.1 What were you looking at (where were your eyes focused on) during the first trial?
a. My feet b. The floor c. The platform d. A spot in the room e. I was not looking at any specific place f. Other ____________________________ g. I don’t recall
6.2 What were you trying to control during the first trials? a. The platform Yes No Did you succeed? No, never Sometimes All the time
No, never Sometimes All the time
No, never Sometimes All the time
b. My body Yes No Did you succeed?
c. Both Yes No Did you succeed?
6.3 Was this strategy useful to maintain balance?
a. No b. Yes
Please explain why. _____________________________________________________________ _____________________________________________________________
80

7. Try to explain what was your strategy during the last trials. 7.1 What were you looking at (where were your eyes focused on) during the last trials?
a. My feet b. The floor c. The platform d. A spot in the room b. I was not looking at any specific place c. Other ____________________________ d. I don’t remember
7.2 What were you trying to control during the last trials? a. The platform Yes No Did you succeed? No, never Sometimes All the time
No, never Sometimes All the time
No, never Sometimes All the time
b. My body Yes No Did you succeed?
c. Both Yes No Did you succeed?
7.3 Was this strategy useful to maintain balance? a. No b. Yes
Please explain why. _____________________________________________________________ _____________________________________________________________
8. In General, what was easier to control?
a. The lateral movement of the platform b. The back and front movement of the platform c. Both of them were easy d. Neither of them were easy
Please explain why. _____________________________________________________________ _____________________________________________________________ II. THE TASK 1. How difficult was the task in this first session?
1 very easy 2 3 4 5 6 7 very difficult
81
2. How confident were you about a good performance before the first trial?
1 not at all 2 3 4 5 6 7 very confident 3. How confident are you right now about your ability to maintain balance on the platform?
1 not at all 2 3 4 5 6 7 very confident 4. How well did you perform on the task?
1 not well at all 2 3 4 5 6 7 very well 5. How satisfied are you with your performance?
1 not at all 2 3 4 5 6 7 completely 6. How afraid are you about trying different strategies to maintain the balance?
1 not at all 2 3 4 5 6 7 very afraid 7 How do you expect to perform on the next session?
1 not well at all 2 3 4 5 6 7 very well
82

Appendix C
Post-task questionnaire Session 2
I. YOUR STRATEGY
1. Where on the board was the placement of your feet that allowed you to better maintain balance? 2. Besides the position of your feet on the platform, what other parts of your body do you remember using to control and maintain balance? Please circle all the body parts you used. If any part is not listed, include it.
a. Head b. Shoulders c. Arms d. Pelvis e. Knees f. Ankles g. Other_________________________ h. I don’t recall
3. What was easier to control when you placed your feet on each end of the board?
a. The lateral movement of the platform b. The back and front movement of the platform c. Both of them were easy d. Neither of them were easy
Please explain why. _____________________________________________________________ _____________________________________________________________
83

4. What was easier to control when you placed your feet close to the middle? a. The lateral movement of the platform b. The back and front movement of the platform c. Both of them were easy d. Neither of them were easy
Please explain why. _____________________________________________________________ _____________________________________________________________ 5. After this session, where do you think you will be placing your feet in the next session?
Please explain why. _____________________________________________________________ _____________________________________________________________ II. THE TASK 1. How difficult was the task in this second session?
1 very easy 2 3 4 5 6 7 very difficult 2. How confident were you about a good performance before the first trial?
1 not at all 2 3 4 5 6 7 very confident 3. How confident are you right now about your ability to maintain balance on the platform?
1 not at all 2 3 4 5 6 7 very confident 4. Did you experience any improvement on your performance?
1 not at all 2 3 4 5 6 7 a lot 5 How well did you perform on the task?
1 not well at all 2 3 4 5 6 7 very well
84

6 How satisfied are you with your performance?
1 not at all 2 3 4 5 6 7 completely 7. How afraid are you about trying different strategies to maintain the balance?
1 not at all 2 3 4 5 6 7 very afraid 8 How do you expect to perform on the next session?
1 not well at all 2 3 4 5 6 7 very well
85

86

Appendix D
Post-task questionnaire Session 3 part I 1. Age : __________
2. Height: _____________ Weight: ______________
3. Do you have an arch or flat feet? Circle one.
4. Gender : Male Female l
5. What type of sport do you practice? ____________________________________
6. Have you ever tried to balance on a similar platform like this one before? (e.g. Bongo
board, Weeble boards, BOSU balance board, etc.) Yes ___ No ___
If yes, did you try during the first session of this study to use the same balance strategy that
you previously used with other boards? Yes ___ No____
II.YOUR STRATEGY 1. Where did you place your feet on the first trial of this session?
2. What was your reason to do so? Please explain. _____________________________________________________________ _____________________________________________________________ _____________________________________________________________
87

3. Did you consciously change the placement of your feet along the board during the trials? c. Yes d. No c. I don’t recall
If yes, please explain why. _____________________________________________________________ _____________________________________________________________ _____________________________________________________________
If yes, was it useful?
All the time Most of the time Sometimes Rarely Not at all
4. Where did you place your feet on later trials? 6. Besides the position of your feet on the platform, what other parts of your body do you remember using to control and maintain balance? Please circle all the body parts you used. If any part is not listed, include it.
a. Head b. Shoulders c. Arms d. Pelvis e. Knees f. Ankles g. Other_________________________ h. I don’t recall
II. THE TASK 1. How difficult was the task in this third session?
1 very easy 2 3 4 5 6 7 very difficult 2. How confident were you about a good performance before the first trial?
1 not at all 2 3 4 5 6 7 very confident
88
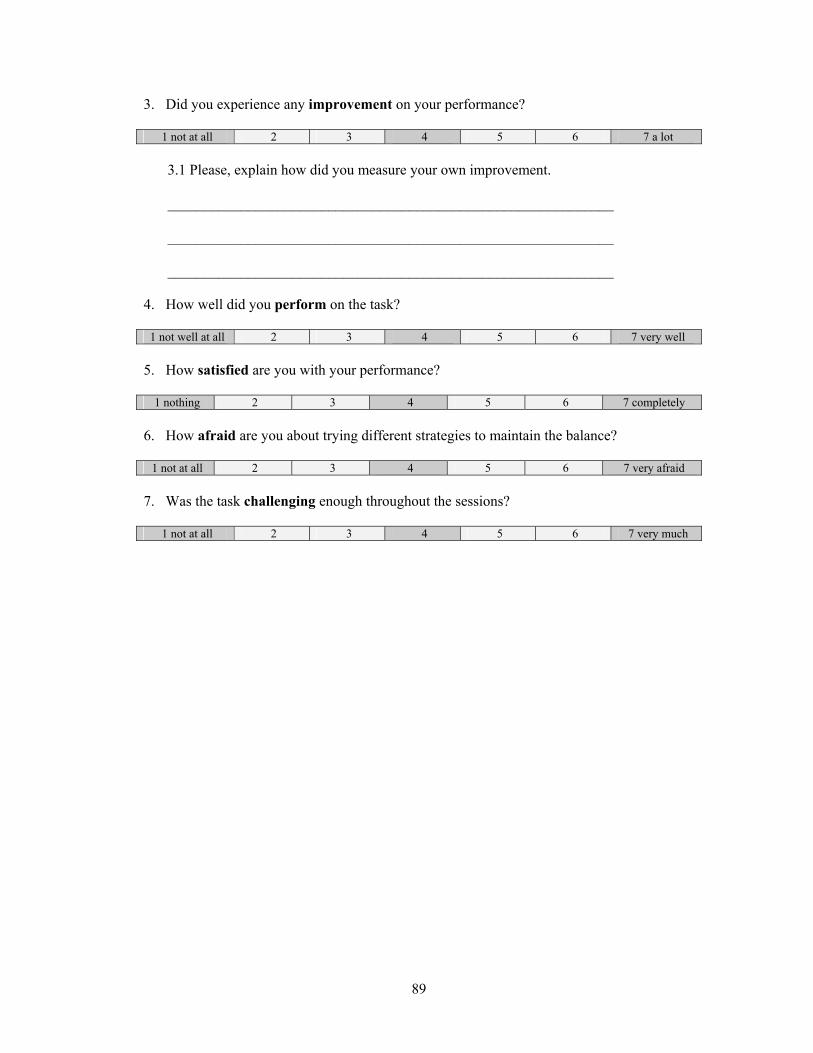
3. Did you experience any improvement on your performance?
1 not at all 2 3 4 5 6 7 a lot
3.1 Please, explain how did you measure your own improvement. _____________________________________________________________ _____________________________________________________________
_____________________________________________________________
4. How well did you perform on the task?
1 not well at all 2 3 4 5 6 7 very well 5. How satisfied are you with your performance?
1 nothing 2 3 4 5 6 7 completely 6. How afraid are you about trying different strategies to maintain the balance?
1 not at all 2 3 4 5 6 7 very afraid 7. Was the task challenging enough throughout the sessions?
1 not at all 2 3 4 5 6 7 very much
89

90

Appendix E
Post-task questionnaire Session 3 part II YOUR STRATEGY ON SESSION 1 AND SESSION 3 You will be asked to watch the videos we have recorded from you on Session 1 and Session 3 of this study. You will be required answer some questions related to them. Please read the following questions before you watch the videos. 1. What parts of your body, you saw you were using to balance during Session 1? Please circle all the body parts you used. If any part is not listed, include it.
a. Head b. Shoulders c. Arms d. Hip e. Knees f. Ankles g. Feet h. Other_________________________
2. Were you consciously aware you were using all of them? No Yes 3. What parts of you body you saw you were using to balance during Session 3? Please circle all the body parts you used. If any part is not listed, include it.
a. Head b. Shoulders c. Arms d. Hip e. Knees f. Ankles g. Feet h. Other_________________________
4. Were you consciously aware you were using them? No Yes
91
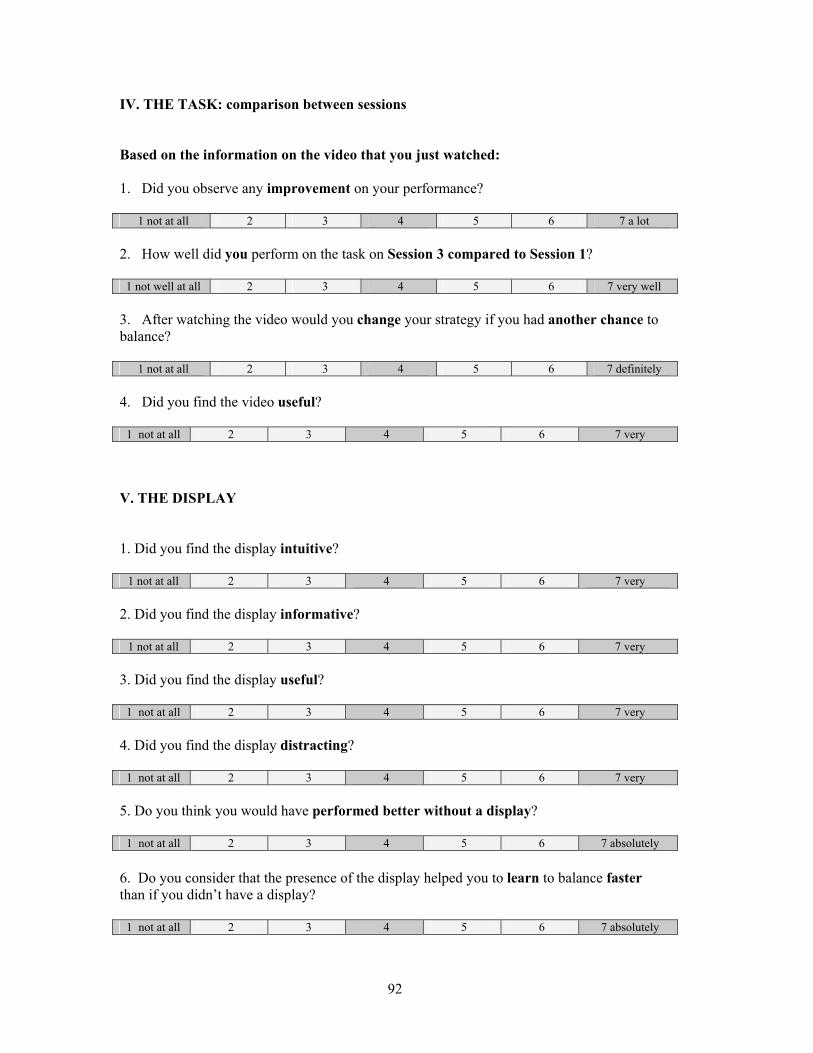
IV. THE TASK: comparison between sessions Based on the information on the video that you just watched: 1. Did you observe any improvement on your performance?
1 not at all 2 3 4 5 6 7 a lot 2. How well did you perform on the task on Session 3 compared to Session 1?
1 not well at all 2 3 4 5 6 7 very well 3. After watching the video would you change your strategy if you had another chance to balance?
1 not at all 2 3 4 5 6 7 definitely 4. Did you find the video useful?
1 not at all 2 3 4 5 6 7 very
V. THE DISPLAY 1. Did you find the display intuitive?
1 not at all 2 3 4 5 6 7 very 2. Did you find the display informative?
1 not at all 2 3 4 5 6 7 very 3. Did you find the display useful?
1 not at all 2 3 4 5 6 7 very 4. Did you find the display distracting?
1 not at all 2 3 4 5 6 7 very 5. Do you think you would have performed better without a display?
1 not at all 2 3 4 5 6 7 absolutely 6. Do you consider that the presence of the display helped you to learn to balance faster than if you didn’t have a display?
1 not at all 2 3 4 5 6 7 absolutely
92

7. Please select all the phrases that you consider are true. a. Trying to fall within a range of what is considered close to being balanced achieves
better performance than trying to perfectly balance b. Trying to perfectly balance achieves better performance than trying to fall within a
range of what is considered close to being balanced. c. It is easier to balance when you try to control the platform from moving. d. It is easier to balance when you try not to interfere with the natural movement of the
platform. e. To efficiently balance, a person has to learn to respond to acceleration as opposed to
the tilt of the board. f. To efficiently balance, a person has to learn to respond to the tilt of the board as
opposed to the acceleration experienced. V. THE TRIALS 1. The number of trials per session (8) were: Please circle one.
a. Not enough trials. How many trials per session would you suggest? ______ b. The right number of trials c. Too many trials. How many trials per session would you suggest? ______
2. 30 seconds of balancing time was: Please circle one. a. Not enough time. How much time would you suggest? ______ b. The right amount of time c. Too long. How much time would you suggest? ______
Thank you for your participation in the Balance Study!
93

94

References
Adkin, A. L., J. S. Frank, et al. (2002). Fear of falling modifies anticipatory postural control. Experimental Brain Research 143: 160-170. Assaiante, C. and B. Amblard (1993). Ontogenesis of head stabilization in space during locomotion in children: Influence of visual cues. Experimental Brain Research 93: 499-515. Bender, W. (2004). Color for communication. Personal communication. L. Welti-Santos. Cambridge. Berg, K. O., S. Wood-Dauphinee, et al. (1989). Measuring balance in the elderly: Preliminary development of an instrument. Physiotherapy Canada 41: 304-311. Bernstein, N. (1967). The coordination and regulation of movements. London, Pergamon Press. Berthoz, A. (2000). The brain's sense of movement. Cambridge, Harvard University Press. Brandt, T., W. Paulus, et al., Eds. (1986). Vision and posture. Disorders of posture and gait. Amsterdam, Elsevier Science Publishers Biomedical Division. Caillou, N., D. Nourrit, et al. (2002). Overcoming spontaneous patterns of coordination during the acquisition of a complex balancing task. Canadian Journal of Experimental Psychology 56: 284-294. cdc.gov. CDC/NCHS, National Hospital Discharge Survey. (2001). External cause of injury. Retrieved January 10, 2004 from http://www.cdc.gov/nchs/data/injuty/injury_cause.pdf Clapp, S. and A. M. Wing (1999). Light touch contribution to balance in normal bipedal stance. Experimental Brain Research 125: 521. Collins, J. J., A. A. Priplata, et al. (2003, March/April). Noise-enhanced human sensorimotor function. IEEE Engineering in Medicine and Biology Magazine: 76-86. Corbetta, D. and B. Vereijken (1999). Understanding development and learning of motor coordination in sport: The contribution of dynamic systems theory. International Journal of Sport Psychology 31: 515-521. COUHES. (2003). MIT committee on the use of humans as experimental subjects. Retrieved November, 23, 2003 from http://web.mit.edu/committees/couhes
95

Dault, M. C., M. de Haart, et al. (2003). Effects of visual center of pressure feedback on postural control in young and elderly healthy adults and in stroke patients. Human Movement Science 22(3): 221-236. Fry, B. and C. Reas. (2004). Processing. Retrieved March 2, 2004 from http://processing.org/ Kadkade, P. P., B. J. Benda, et al. (2003). Vibrotactile display coding for a balance prosthesis. IEEE Transaction on Neural Systems and Rehabilitation Engineering 11(4): 392-399. Kandel, E. R., J. H. Schwartz, et al., Eds. (2000). Principles of neural science. New York, Mc Graw Hill. Kelso, J. A. S. (1999). Dynamic patterns the self-organization of brain and behavior. Cambridge, The MIT Press. Ko, Y.-G., J. H. Challis, et al. (2003). Learning to coordinate redundant degrees of freedom in a dynamic balance task. Human Movement Science 22(3): 47-66. Kuo, A. D. (1995). An optimal control model for analyzing human postural balance. IEEE Transactions on Biomedical Engineering 42(1): 87-101. Magill, R. A. (1998). Motor learning: Concepts and applications. Dubuque, WCB McGraw-Hill. Magill, R. A., C. J. Chamberlin, et al. (1991). Verbal knowledge of results as redundant information for learning an anticipatory timing skill. Human Movement Science 10: 485-507. Mayagoitia, R. E., J. C. Lötters, et al. (2002). Standing balance evaluation using a triaxial accelerometer. Gait and Posture 16: 55-59. Mayagoitia, R. E., A. V. Nene, et al. (2002). Accelerometer and rate gyroscope measurement of kinematics: An inexpensive alternative to optical motion analysis systems. Journal of Biomechanics 35: 537-542. Medved, V. (2001). Measurement of human locomotion. Boca Raton, CRC Press LLC. Menz, H. B., S. R. Lord, et al. (2003). Acceleration patterns of the head and pelvis when walking on level and irregular surfaces. Gait and Posture 18: 35-46. Minsky, M. (2003). The emotion machine (draft). Retrieved February 15, 2004 from http://web.media.mit.edu/~minsky/. Moe-Nilssen, R. (1998). A new method for evaluating motor control in gait under real-life environmental conditions. Part 2: Gait analysis. Clinical Biomechanics 13: 328-335. Moe-Nilssen, R. and J. L. Helbostad (2001). Trunk accelerometry as a measure of balance control during quiet standing. Gait and Posture 16: 60-68.
96
Morris, S. (2004). A shoe-integrated sensor system for wireless gait analysis and real-time therapeutic feedback. Media Laboratory, School of Architecture and Planning. Cambridge, Massachusetts Institute of Technology. Munguia Tapia, E., N. Marmasse, et al. (2004). MITes: Wireless portable sensors for studying behavior. To appear in: Proceedings of UbiComp 2004. Nashner, L. M. (2001). Joel a goebel: Computerized dynamic posturography. Practical management of dizzy patient. Philadelphia, Lippicott Willliams & Wilkins: 143-170. onbalance.com. NeuroCom International Inc. (2003). Balance control. Retrieved November 11, 2003 from http://www.onbalance.com/clinical_info/BalanceControl.aspx Papert, S. (1993). Mindstorms: Children, computers, and powerful ideas. Cambridge, Basic Books. Papert, S. (2004). Changes in the learning process. Personal communication. L. Welti-Santos. Cambridge. Patton, J. L., W. A. Lee, et al. (2000). Relative stability improves with experience in a dynamic standing task. Experimental Brain Research 135: 117-126. Peper, L., R. J. Bootsma, et al. (1994). Catching balls: How to get the hand to the right place at the right time. Journal of Experimental Psychology: Human Perception and Performance 20(3): 591-612. Perruchet, P., S. Chambaron, et al. (2003). Learning from implicit learning literature: Comment on shea, wulf, whitacre, and park (2001). The Quarterly Journal of Experimental Psychology 56A(5): 769-778. Purtell, T. J. (2004). Purtell's quilts. Cambridge. Richards, W. (2003). Anigrafs: Mind games. Retrieved May 30, 2004 from http://www.ai.mit.edu/people/whit/contents.html Richards, W. (2004). Concept of Anigrafs. Personal communications. L. Welti-Santos. Cambridge. Rogers, M. W., D. L. Wardman, et al. (2001). Passive tactile sensory input improves stability during standing. Experimental Brain Research 136: 514-522. Sabelman, E. E. (2002). Accelerometric motion analysis to detect and minimize freezing episodes in parkinson's patients. Retrieved November 16, 2003 from http://guide.stanford.edu/People/sabelman/Parkinsons-Accel4.pdf Salmoni, A. W., R. A. Schmidt, et al. (1984). Knowledge of results and motor learning: A review and critical appraisal. Psychological Bulletin 95: 355-386. Saltzman, E. L. and J. A. S. Kelso (1985). Synergies: Stabilities and modes. Behavioral and Brain Science 8: 161-163.
97

98
Schmidt, R. A. and T. D. Lee (1999). Motor control and learning a behavioral emphasis. Champaign, Human Kinetics. Schmidt, R. A. and C. A. Wrisber (2000). Motor learning and performance: A problem-based learning approach. Champaign, Human Kinetics. Shea, C. H., Q. Lai, et al. (2000). Spacing practice sessions across days benefits the learning of motor skills. Human Movement science 19(5): 737-760. Shea, C. H. and G. Wulf (1999). Enhancing motor learning trough external-focus instructions and feedback. Human Movement Science 18(4): 553-571. Tinetti, M. E. (1986). Performance-oriented assessment of mobility problems in elderly patients. Journal of the American Geriatrics Society 34: 119-126. Vereijken, B. and H. T. A. Whiting (1990). In defense of discovery learning. Canadian Journal of Sport Science 15: 99-106. Vereijken, B., H. T. A. Whiting, et al. (1992). A dynamical systems approach to skill acquisition. The Quarterly Journal of Experimental Psychology 45A(2): 323-344. Wall III, C. and M. S. Weinberg (2003, March/April). Balance prostheses for postural control. IEEE Engineering in Medicine and Biology Magazine: 84-90. Whitney, S. L., J. L. Poole, et al. (1998). A review of balance instruments for older adults. The American Journal of Occupational Therapy 52(8): 666-671. Winter, D. A. (1990). Biomechanics and motor control of human movement. New York, Wiley-Interscience. John Wiley & Sons Inc. Winter, D. A. (1995). A.B.C (anatomy, biomechanics and control) of balance during standing and walking. Waterloo, Graphic Services, University of Waterloo. Winter, D. A. and A. E. Patla (1997). Signal processing and linear systems for the movement sciences. Waterloo, Graphic Services, University of Waterloo. Wulf, G., N. NcNevin, et al. (1999). Learning phenomena: Future challenges for the dynamical systems approach to understanding the learning of complex motor skills. International Journal of Sport Psychology 30: 531-557.


![Chapter 7 Correction of Errors [II]: Errors Affecting …proxy.flss.edu.hk/~flssmcwong/S5 Notes/Chapter 7...1 Chapter 7 Correction of Errors [II]: Errors Affecting Trial Balance Agreement](https://static.fdocuments.net/doc/165x107/5e919753b752cc557f0672e9/chapter-7-correction-of-errors-ii-errors-affecting-proxyflsseduhkflssmcwongs5.jpg)
