Tolk Water Situation
17
Tolk Water Situation Alan J. Davidson Director, Capital Projects November 9, 2017
Transcript of Tolk Water Situation
Tolk Water Situation
Alan J. Davidson Director, Capital Projects
November 9, 2017
What is an aquifer?
• Below a certain depth, the ground, if it is permeable enough
to hold water, is saturated with water
• The upper surface of this zone of saturation is called the
water table
• The saturated zone beneath the water table containing
sediment and rock is called an aquifer, and aquifers are huge
storehouses for water
• Wells can be drilled into the aquifers and water can be
pumped out
• Precipitation eventually can add water (recharge) into the
porous rock of the aquifer if the surface area is adaptive.
2
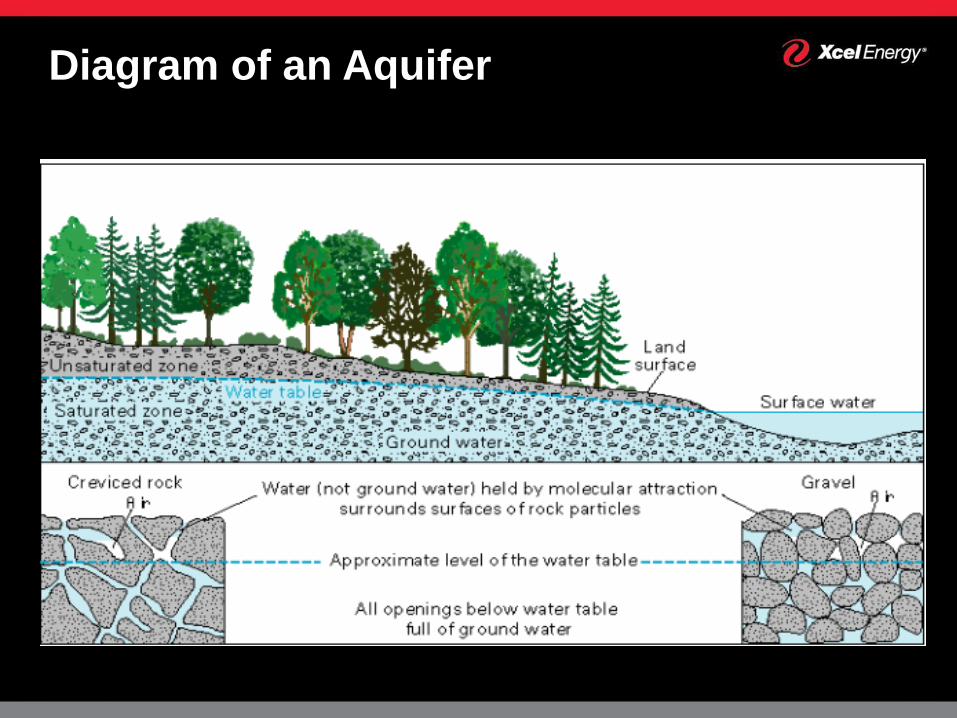
Diagram of an Aquifer
3
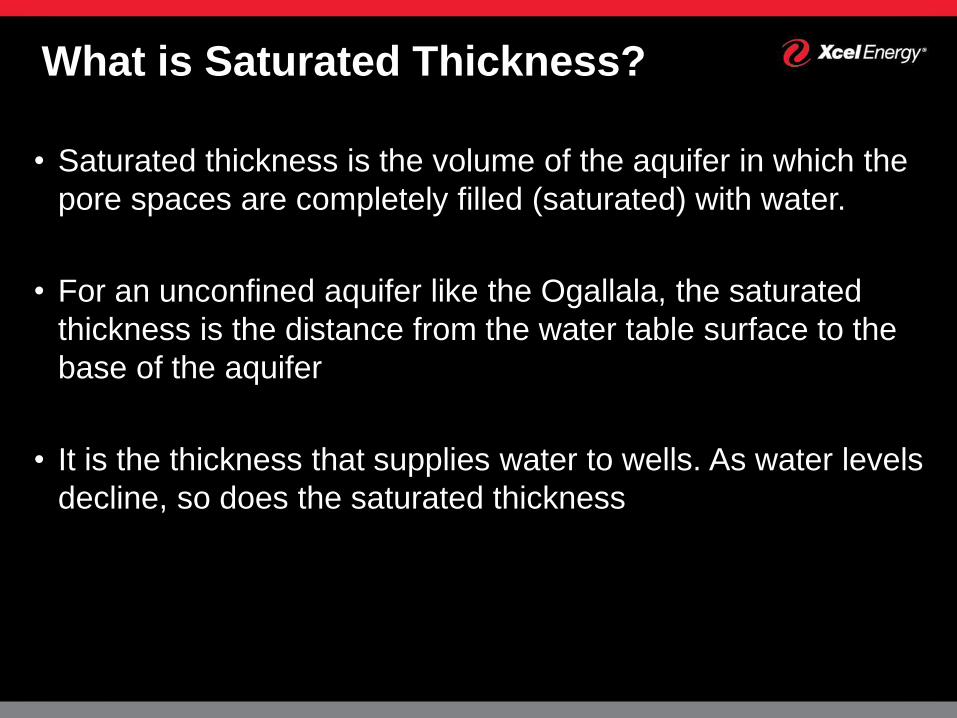
What is Saturated Thickness?
• Saturated thickness is the volume of the aquifer in which the
pore spaces are completely filled (saturated) with water.
• For an unconfined aquifer like the Ogallala, the saturated
thickness is the distance from the water table surface to the
base of the aquifer
• It is the thickness that supplies water to wells. As water levels
decline, so does the saturated thickness
4
5
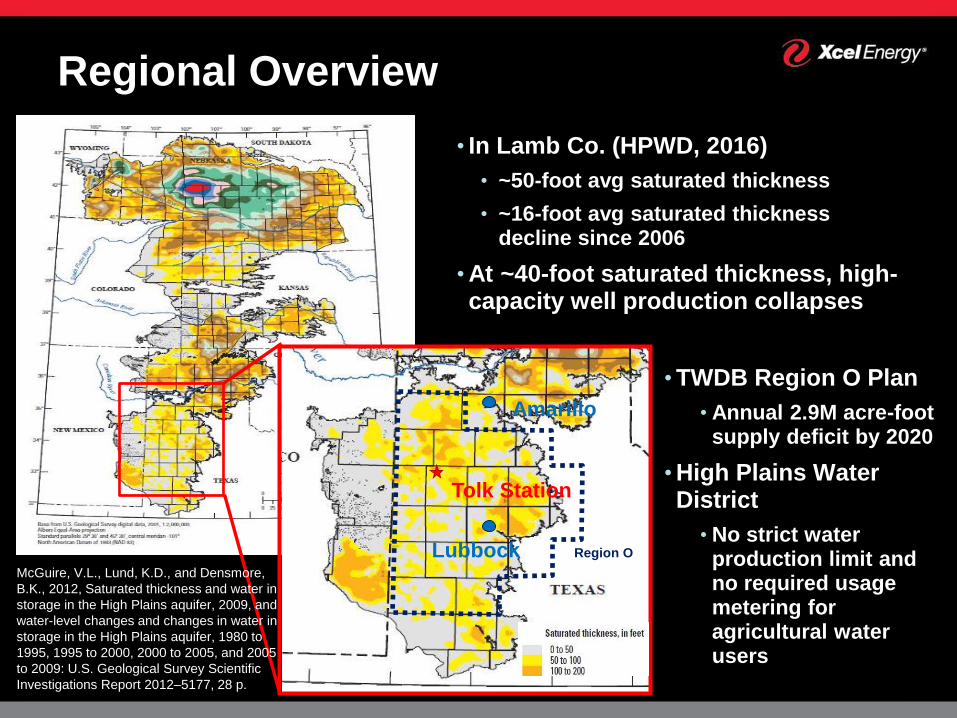
Regional Overview
• In Lamb Co. (HPWD, 2016)
• ~50-foot avg saturated thickness
• ~16-foot avg saturated thickness decline since 2006
•At ~40-foot saturated thickness, high-capacity well production collapses
Amarillo
Tolk Station
•TWDB Region O Plan
• Annual 2.9M acre-foot supply deficit by 2020
•High Plains Water District
• No strict water production limit and no required usage metering for agricultural water users
Region O Lubbock McGuire, V.L., Lund, K.D., and Densmore,
B.K., 2012, Saturated thickness and water in
storage in the High Plains aquifer, 2009, and
water-level changes and changes in water in
storage in the High Plains aquifer, 1980 to
1995, 1995 to 2000, 2000 to 2005, and 2005
to 2009: U.S. Geological Survey Scientific
Investigations Report 2012–5177, 28 p.
6
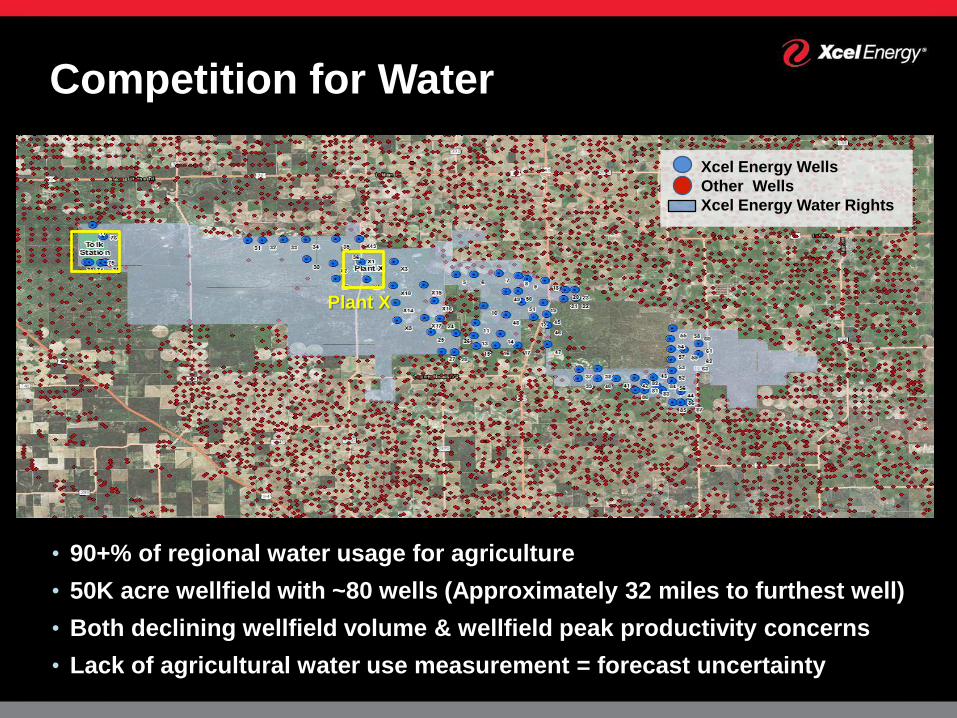
Competition for Water
• 90+% of regional water usage for agriculture
• 50K acre wellfield with ~80 wells (Approximately 32 miles to furthest well)
• Both declining wellfield volume & wellfield peak productivity concerns
• Lack of agricultural water use measurement = forecast uncertainty
Xcel Energy Wells
Other Wells
Xcel Energy Water Rights
Plant X
7 7
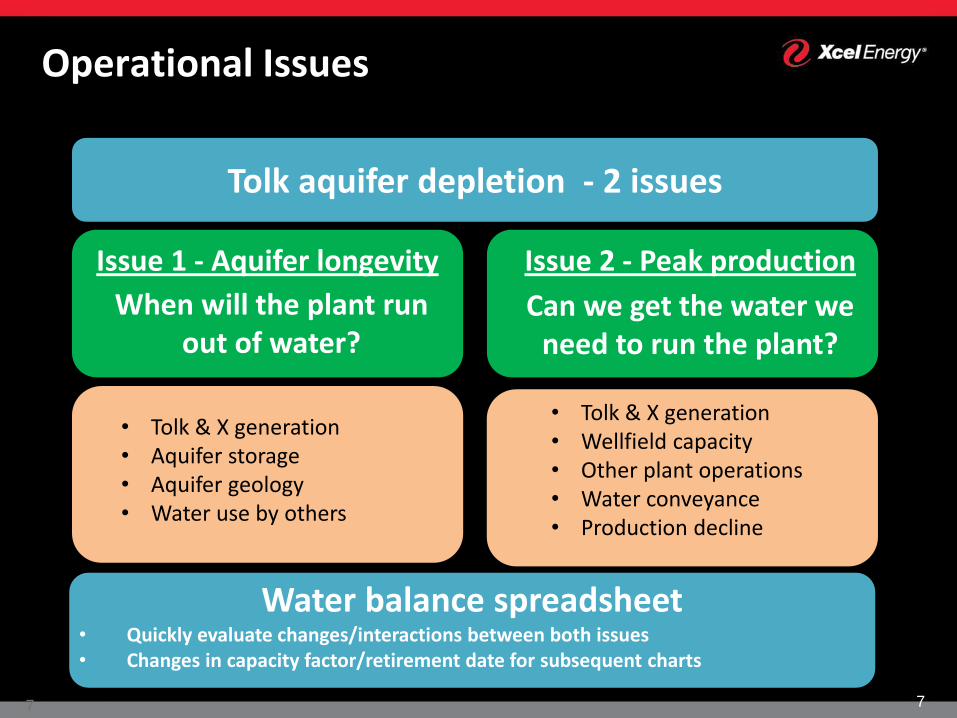
Operational Issues
Tolk aquifer depletion - 2 issues
Issue 2 - Peak production Issue 1 - Aquifer longevity
Can we get the water we need to run the plant?
When will the plant run out of water?
• Tolk & X generation • Aquifer storage • Aquifer geology • Water use by others
• Tolk & X generation • Wellfield capacity • Other plant operations • Water conveyance • Production decline
Water balance spreadsheet • Quickly evaluate changes/interactions between both issues • Changes in capacity factor/retirement date for subsequent charts
8
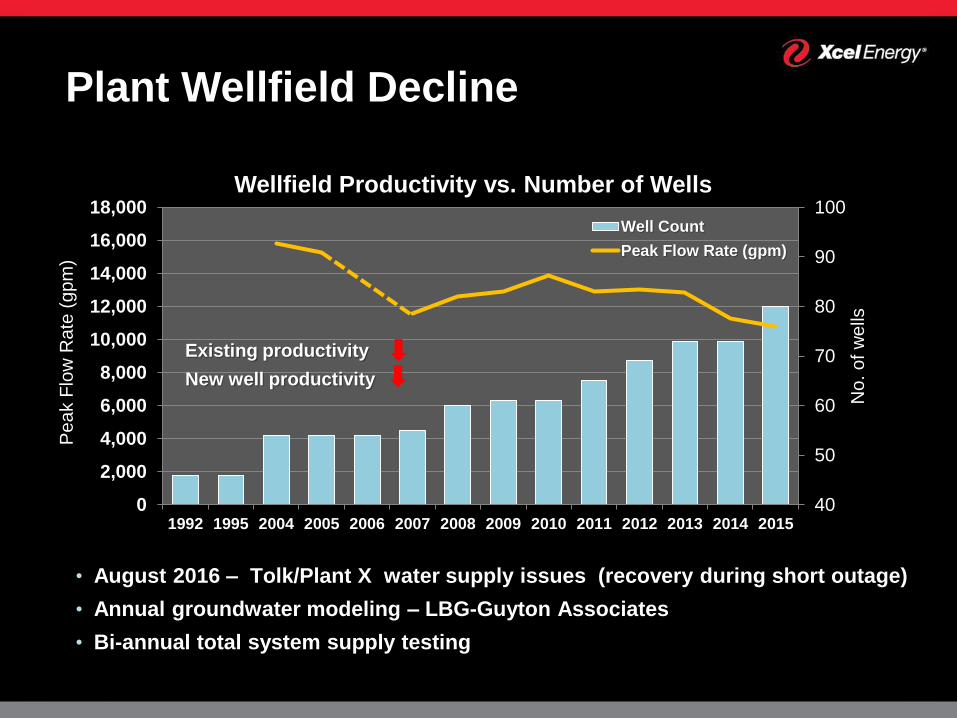
Plant Wellfield Decline
• August 2016 – Tolk/Plant X water supply issues (recovery during short outage)
• Annual groundwater modeling – LBG-Guyton Associates
• Bi-annual total system supply testing
40
50
60
70
80
90
100
0
2,000
4,000
6,000
8,000
10,000
12,000
14,000
16,000
18,000
1992 1995 2004 2005 2006 2007 2008 2009 2010 2011 2012 2013 2014 2015
No
. o
f w
ells
Pe
ak F
low
Ra
te (
gp
m)
Well Count
Peak Flow Rate (gpm)
Wellfield Productivity vs. Number of Wells
Existing productivity
New well productivity
9 9
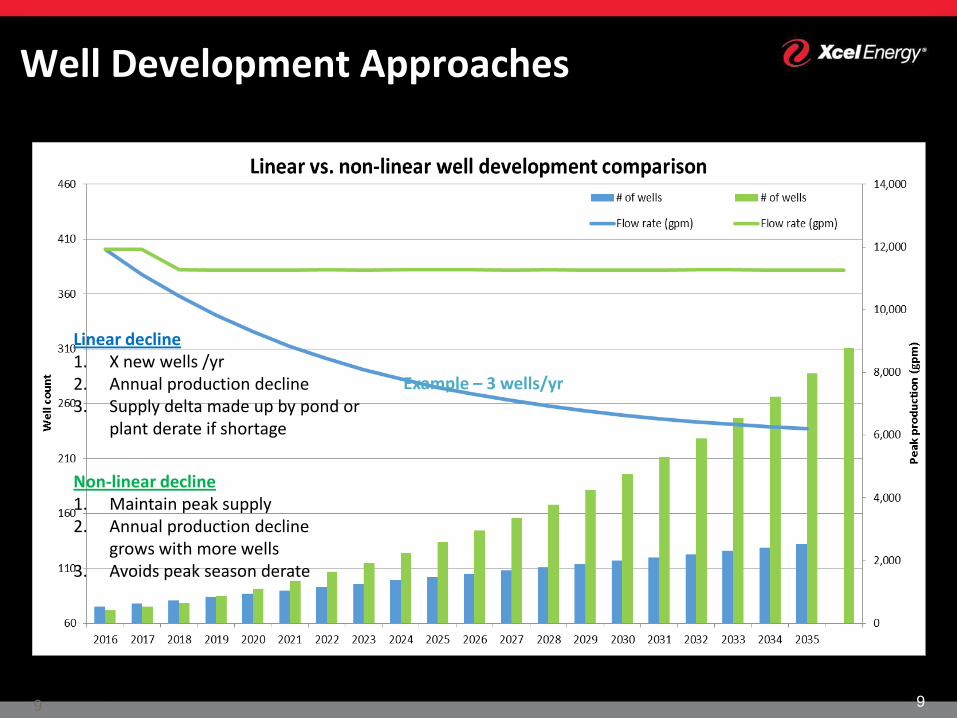
Well Development Approaches
Linear decline 1. X new wells /yr 2. Annual production decline 3. Supply delta made up by pond or
plant derate if shortage
Non-linear decline 1. Maintain peak supply 2. Annual production decline
grows with more wells 3. Avoids peak season derate
Example – 3 wells/yr
Adequate water supply
Concerns, may have peak production challenges
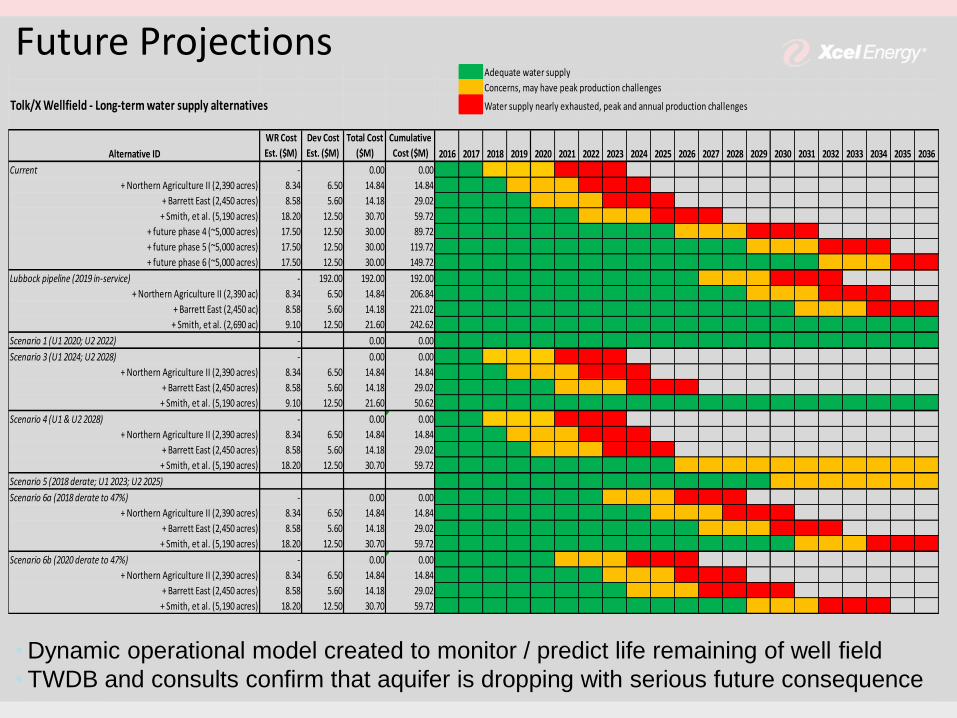
Tolk/X Wellfield - Long-term water supply alternatives Water supply nearly exhausted, peak and annual production challenges
Alternative ID
WR Cost
Est. ($M)
Dev Cost
Est. ($M)
Total Cost
($M)
Cumulative
Cost ($M) 2016 2017 2018 2019 2020 2021 2022 2023 2024 2025 2026 2027 2028 2029 2030 2031 2032 2033 2034 2035 2036
Current - 0.00 0.00
+ Northern Agriculture II (2,390 acres) 8.34 6.50 14.84 14.84
+ Barrett East (2,450 acres) 8.58 5.60 14.18 29.02
+ Smith, et al. (5,190 acres) 18.20 12.50 30.70 59.72
+ future phase 4 (~5,000 acres) 17.50 12.50 30.00 89.72
+ future phase 5 (~5,000 acres) 17.50 12.50 30.00 119.72
+ future phase 6 (~5,000 acres) 17.50 12.50 30.00 149.72
Lubbock pipeline (2019 in-service) - 192.00 192.00 192.00
+ Northern Agriculture II (2,390 ac) 8.34 6.50 14.84 206.84
+ Barrett East (2,450 ac) 8.58 5.60 14.18 221.02
+ Smith, et al. (2,690 ac) 9.10 12.50 21.60 242.62
Scenario 1 (U1 2020; U2 2022) - 0.00 0.00
Scenario 3 (U1 2024; U2 2028) - 0.00 0.00
+ Northern Agriculture II (2,390 acres) 8.34 6.50 14.84 14.84
+ Barrett East (2,450 acres) 8.58 5.60 14.18 29.02
+ Smith, et al. (5,190 acres) 9.10 12.50 21.60 50.62
Scenario 4 (U1 & U2 2028) - 0.00 0.00
+ Northern Agriculture II (2,390 acres) 8.34 6.50 14.84 14.84
+ Barrett East (2,450 acres) 8.58 5.60 14.18 29.02
+ Smith, et al. (5,190 acres) 18.20 12.50 30.70 59.72
Scenario 5 (2018 derate; U1 2023; U2 2025)
Scenario 6a (2018 derate to 47%) - 0.00 0.00
+ Northern Agriculture II (2,390 acres) 8.34 6.50 14.84 14.84
+ Barrett East (2,450 acres) 8.58 5.60 14.18 29.02
+ Smith, et al. (5,190 acres) 18.20 12.50 30.70 59.72
Scenario 6b (2020 derate to 47%) - 0.00 0.00
+ Northern Agriculture II (2,390 acres) 8.34 6.50 14.84 14.84
+ Barrett East (2,450 acres) 8.58 5.60 14.18 29.02
+ Smith, et al. (5,190 acres) 18.20 12.50 30.70 59.72
Future Projections
•Dynamic operational model created to monitor / predict life remaining of well field
•TWDB and consults confirm that aquifer is dropping with serious future consequence
11
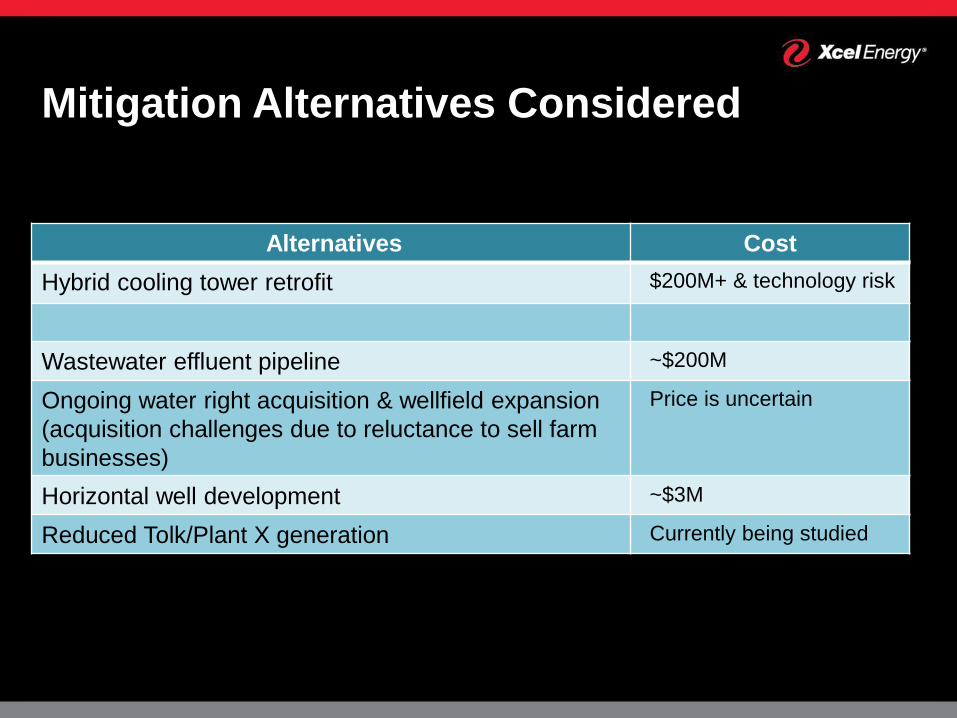
Mitigation Alternatives Considered
Alternatives Cost
Hybrid cooling tower retrofit $200M+ & technology risk
Wastewater effluent pipeline ~$200M
Ongoing water right acquisition & wellfield expansion
(acquisition challenges due to reluctance to sell farm
businesses)
Price is uncertain
Horizontal well development ~$3M
Reduced Tolk/Plant X generation Currently being studied
12
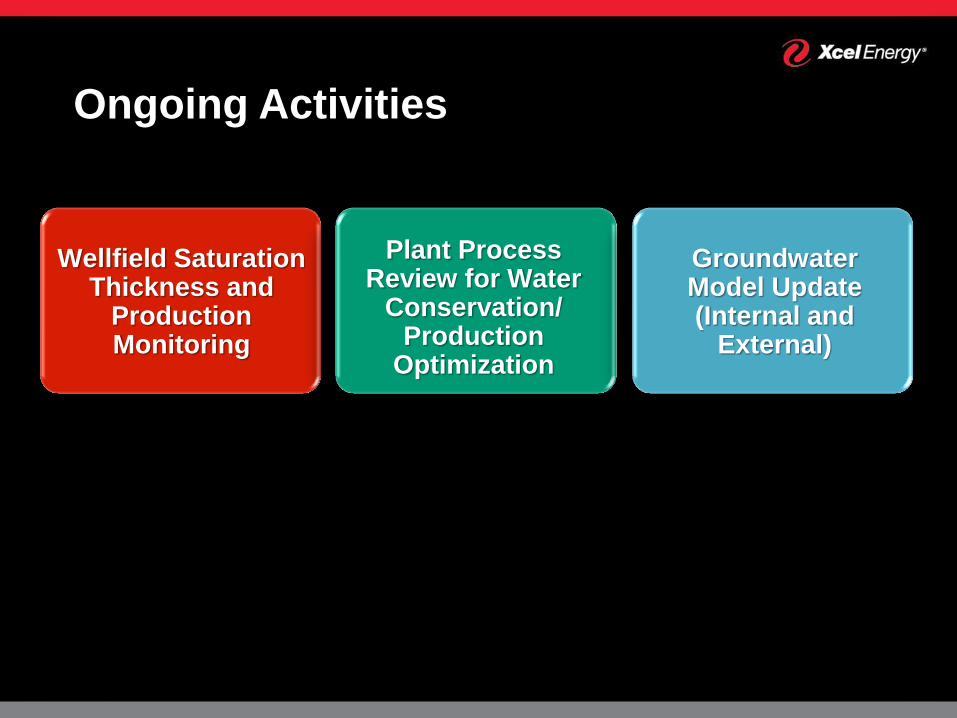
Ongoing Activities
Wellfield Saturation Thickness and
Production Monitoring
Plant Process Review for Water
Conservation/ Production
Optimization
Groundwater Model Update (Internal and
External)

Questions and Discussion
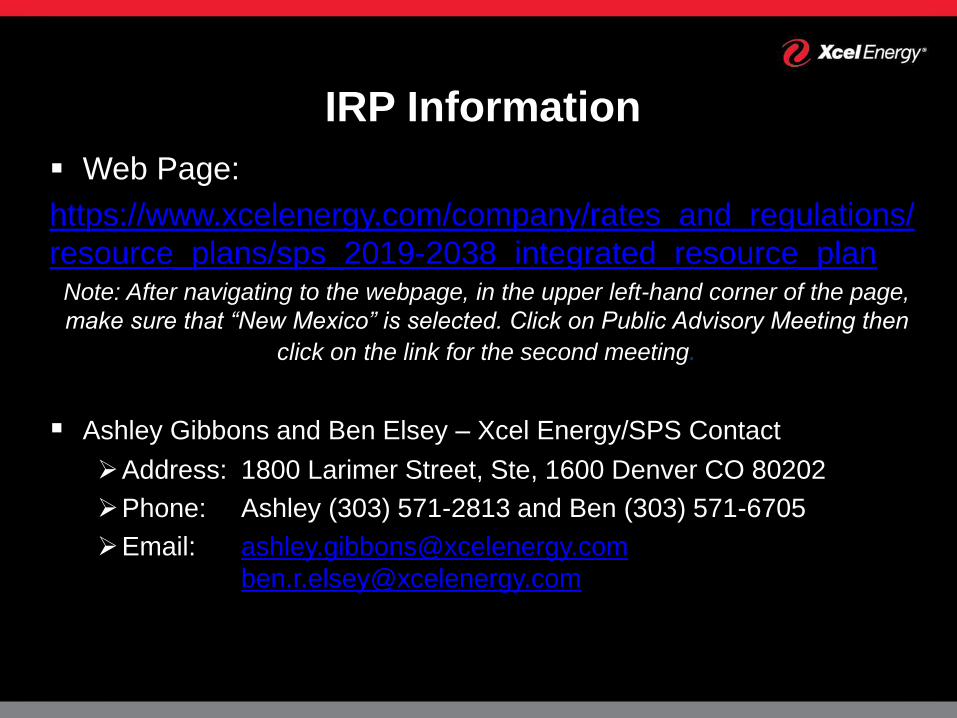
IRP Information
Web Page:
https://www.xcelenergy.com/company/rates_and_regulations/
resource_plans/sps_2019-2038_integrated_resource_plan Note: After navigating to the webpage, in the upper left-hand corner of the page,
make sure that “New Mexico” is selected. Click on Public Advisory Meeting then
click on the link for the second meeting.
Ashley Gibbons and Ben Elsey – Xcel Energy/SPS Contact
Address: 1800 Larimer Street, Ste, 1600 Denver CO 80202
Phone: Ashley (303) 571-2813 and Ben (303) 571-6705
Email: [email protected]
Topics For Future Meetings
Environmental Update
Aging Generation Fleet
Gas & Power Markets
Coal Supply
Demand-side Management and Energy Efficiency
Storage
Next Meeting
• Date:
Tuesday, January 30, 2018
• Time:
10:00am to 12:00pm (Mountain Time)
• Location:
Webinar meeting