Toba Company · PDF fileDisclaimer These materials have been prepared by PT Toba Bara Sejahtra...
34
1 PT Toba Bara Sejahtra Tbk (“Toba”) Company Presentation April 2017 PT Toba Bara Sejahtra Tbk (“Toba”) Company Presentation August 2017
Transcript of Toba Company · PDF fileDisclaimer These materials have been prepared by PT Toba Bara Sejahtra...

1
PT Toba Bara Sejahtra Tbk (“Toba”)
Company PresentationApril 2017
PT Toba Bara Sejahtra Tbk (“Toba”)
Company PresentationAugust 2017

Disclaimer
These materials have been prepared by PT Toba Bara Sejahtra Tbk (the “Company”).
These materials may contain statements that constitute forward-looking statements. These statements include
descriptions regarding the intent, belief or current expectations of the Company or its officers with respect to the
consolidated results of operations and financial condition of the Company. These statements can be recognized by
the use of words such as “expects,” “plan,” “will,” “estimates,” “projects,” “intends,” or words of similar meaning.
Such forward-looking statements are not guarantees of future performance and involve risks and uncertainties, and
actual results may differ from those in the forward-looking statements as a result of various factors and
assumptions. The Company has no obligation and does not undertake to revise forward-looking statements to
reflect future events or circumstances.
These materials are for information purposes only and do not constitute or form part of an offer, solicitation or
invitation of any offer to buy or subscribe for any securities of the Company, in any jurisdiction, nor should it or any
part of it form the basis of, or be relied upon in any connection with, any contract, commitment or investment
decision whatsoever. Any decision to purchase or subscribe for any securities of the Company should be made after
seeking appropriate professional advice.
2

Table of Contents
2
Company Profile
Performance Highlights
3
1
Strategy to Venture into Power
3
i Sulbagut-1 Project
ii Sulut-3 Project

4
Performance HighlightsPerformance Highlights2 Company Profile1

Location: Kutai, Kalimantan Timur
Hak Guna Usaha (“HGU”) covers 8,633 ha, where
2,701 ha has been planted
CPO mill with capacity of 30 tons Fresh Fruit Bunch
(“FFB”) per hour
GLP and MCL established in February 2016 and March
2017 respectively for development of steam (coal) fired
power plant project (“CFPP") with capacity of 2x50 MW
each
25 year Power Purchase Agreement (“PPA”) through
Independent Power Producer (“IPP”) scheme with PLN
as single offtaker
TBE established in December 2016 for investment in
power generation business5
Toba Bara Sejahtra In Brief
Location: Kutai Kartanegara, Kalimantan Timur
Total Concession: 7,087 ha
JORC-compliant proved and probable reserves of
147 MM tons and measured, indicated and inferred
resources of 236 MM tons
Coal brands with mid to upper range calorific values
ranging from 4,700-5,900 Kcal/kg GAR
Prime location provides operational cost edge to
grow as a logistical & operational center for the area
Coal Mining Palm Oil Plantation & Mill
Toba Bara Sejahtra(Toba) has 5 (“five”) subsidiaries engaged in:
Power Generation

Note:
1. PLN: PT Perusahaan Listrik Negara (Persero)
Ownership Structure
License
Area
Davit Togar
Pandjaitan
PT Bara Makmur
AbadiPT Toba Sejahtra Roby Budi Prakoso
PT Sinergi Sukses
Utama
61.91% 10.00% 6.25% 5.10%
PT Toba Bumi Energi
(“TBE”)
99.99%
99.99%
3.64%
51.00% 99.99%
Public *)
12.35%
90.00% 80.00%
Highland Strategic
Holdings Pte. Ltd.
0.75%
• On 25th January 2017, PT Toba Sejahtra (“TS”), the majority shareholder of PT Toba Bara Sejahtra Tbk (“Company”) with 71.79%
divested majority 61.79% share ownership to new shareholder, Highland Strategic Holdings Pte. Ltd. (“HSH”)
• HSH is a Singapore-based investment company, mainly focused in the energy sector
• With HSH and TS sharing the same business alignment, HSH is expected to add further value to the future development of the Company
6
*) Incl. Baring Private Equity
as anchor investor
90.00%
20-year Production
Operation Mining Permit
(“IUP-OP”) expiring in
December 2029
2,990 ha
IUP-OP extension was
completed in March
2013 (First out of 2
extensions: in 2023,
with tenor of 10 years
each)
683 ha
13-year IUP-OP expires
in December 2023
3,414 ha
Plantation permit of PT
Perkebunan Kaltim
Utama I (PKU) expires
in 2036
IUP-P for downstream
processing
8,633 ha (Right to Use
Land)
GLP’s PPA with PLN(1)
for 25- year contract
~60 ha
MCL’s PPA with PLN(1
for 25- year contract
~30 - 40 ha
Off-take (“take or pay”)
by PLN for 25 years
Planted Area: 2,701 ha Off-take (“take or pay”)
by PLN for 25 yearsReserveReserves: 117 MT - JORC
Resources: 156 MT - JORC
Reserve: 22 MT - JORC
Resources: 37 MT - JORC
Reserves : 8 MT - JORC
Resources: 43 MT - JORC
99.60%

Strategic Mine Locations
Muara Berau
Muara Jawa
Makassar Strait
~55 km
(total ~120 km)
Balikpapan
Samarinda
~65 km
Major
CityJetty Transhipment
Point
TMU – IM
Hauling Road
Kutai Energi
TMU
ABN
IM
Major city to north
is less than 50 km
Adjacent
locations for all
3 mines
Close proximity to
jetty and
transhipment point
of Muara Jawa
Distance from pit to
jetty, with closest one
~5 km and furthest ~25
km
~5 km
IM jetty
ABN jetty
Toba owns all infrastructures (coal processing plant, overland conveyors, and jetties), giving significant
operating leverage vs other concessions in surrounding areas
25 km
7

TMU IM
ABN
TMU
Overland & Barge
Loading Jetty: Speed
of 1,800 TPH
High Built CPP Cap
up to 10 Mn TPA
Short Coal Hauling
Distance < 5km
Hauling Road to
Connect with ABN
CPP Capacity : 6 Mn
Tons/Annum (TPA)Conveyor to Jetty
Short Coal Hauling
Distance ~4km
Infrastructure & Operational Capabilities
Toba’s Concessions
ROM Stockpile
8
Note: PT Adimitra Baratama Nusantara (ABN)
PT Indomining (IM)
PT Trisensa Mineral Utama (TMU)

PPA signing with
PLN for Sulut-3
Power Project
Engineering Procurement Contract
(EPC) signing with SEPC* for
Sulbagut-1 Power Project
Contracts and Awards Earned in 1H17
7 April 2 May 7 July 11 July 14 July
Project Financing Signing with
Bank Mandiri worth US$ 171.8 mn
for Sulbagut-1 Power Project
Material Information
9
Financing Date with
PLN for Sulbagut-1
Power Project
Special Transaction Loan Facility
and Non-Cash Loan of US$ 50 mn
with Bank Mandiri
* Shanghai Electric Power Construction Co. Ltd.
ABN received Gold PROPER
Enviromental Award from
Provincial Govt for 3 consecutive
years
IM and TMU received Green
PROPER Enviromental Award for 2
consecutive years
IM received certificates for ISO
14001, OHSAS 18001 and ISO 9001
ABN received Award from
Customs Office of East
Kalimantan as “Ideal”
Company
TMU received Pratama Award
from Ministry of Energy, Mines,
& Resoucres (MEMR)

10
Performance Highlights2

4.1 Mt
5.2 Mt5.6 Mt
6.5 Mt
8.1 Mt
6.1 Mt5.5 Mt
5.0-6.0 Mt
$99 $121 $97
$85
$71
$59$66
$65-70
0
20
40
60
80
100
120
140
0
1
2
3
4
5
6
7
8
9
10
2010 2011 2012 2013 2014 2015 2016 2017 est.
Toba Consolidated NEWC Price
30.1% 32.9%
5.7%13.9% 13.5% 15.4% 15.2%
Stablemargin
EBITDA Margin
Production Profile
11
Source: Coal price from GlobalCoal
Amidst coal price volatility over the past several years and to sustain the Company’s survival mode, Toba
has undergone cost efficiency initiatives as shown by stable EBITDA margin

Operational Performance
Quarterly Production & SRProduction in Thousand Tons
Production SummaryMT: Million Ton
2Q16 2Q17 Change Comment
Sales Volume
SR (x)
1.7 1.1
13.8 14.3
(35.3)%
10.5%
Sales volume tracked its 2Q17 production volume
SR edged up due to impact from mining operations during
prolonged wet weather conditions
1.3 1.2Production volume in 2Q17 was below guidance due to
prolonged rainfall during the period(17.9)%Production
Volume
Production SummaryMT: Million Tons
Quarterly production volume of 1.2
mn tons in 2Q17 came in below 2017
quarterly guidance of 1.25 -1.50 mn
tons
2Q17 SR rose to 14.3x from 13.7x in
1Q17 due primarily to heavier than
expected rainfall, which impacted
production
Production should normalize in
subsequent quarters
2017 guidance for SR is estimated at
12x - 13x in line with mine plan
12
13.8x12.8x 12.6x
13.7x 14.3x12.0x - 13.0x
0.0
0.1
0.1
0.2
0.2
0.3
2Q16 3Q16 4Q16 1Q17 2Q17 QuarterlyGuidance
TMU IM ABN SR (Consolidated)
1.3 1.41.2
1.1
1.41.25 - 1.50
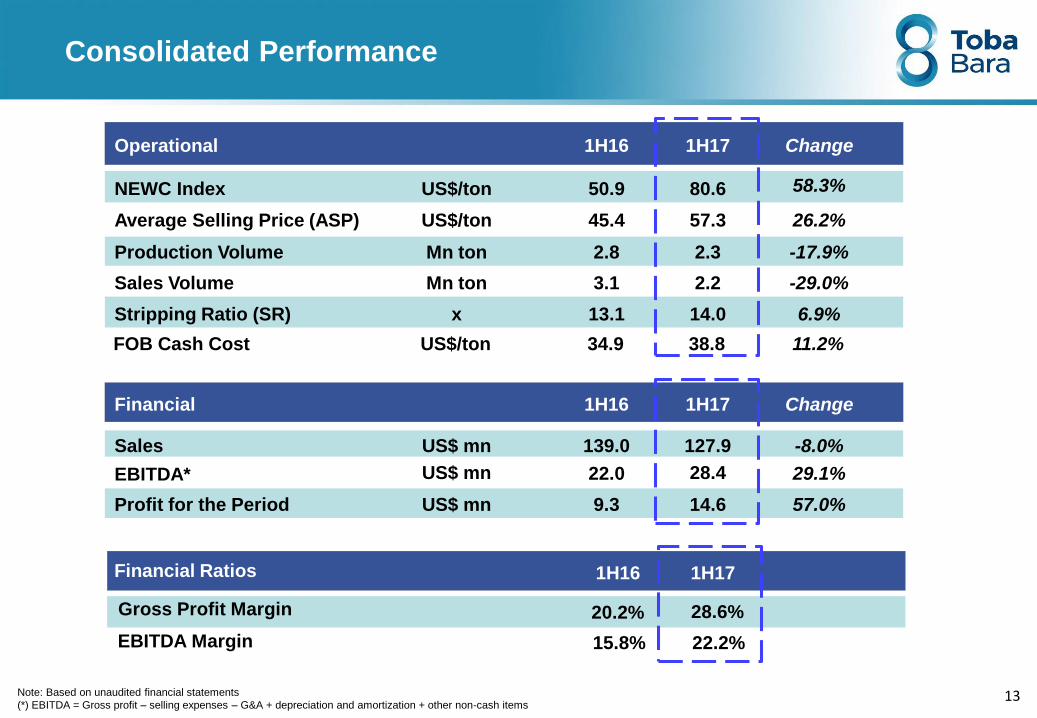
Consolidated Performance
Operational 1H16 1H17 Change
Production Volume 2.8 2.3 -17.9%
Sales Volume 3.1 2.2 -29.0%
Stripping Ratio (SR) 13.1 14.0 6.9%
Sales 139.0 127.9 -8.0%
EBITDA* 22.0 28.4 29.1%
Profit for the Period 9.3 14.6 57.0%
Financial 1H16 1H17 Change
Note: Based on unaudited financial statements
(*) EBITDA = Gross profit – selling expenses – G&A + depreciation and amortization + other non-cash items
45.4
13
NEWC Index 80.6 58.3%50.9
Average Selling Price (ASP) 57.3 26.2%
Mn ton
Mn ton
x
US$/ton
US$/ton
US$ mn
US$ mn
US$ mn
FOB Cash Cost 34.9 38.8 11.2%US$/ton
15.8%EBITDA Margin 22.2%
Gross Profit Margin
Financial Ratios 1H16 1H17
28.6%20.2%

14
Sales Volume, NEWC Index & ASP (million tons and US$/ton)
Sales, Cost of Goods Sold and Gross Profit
Margin (US$ million and %)
EBITDA/ton and EBITDA Margin(US$/ton and %)
Increase in ASP per ton directly filters to higher
gross profit margin and EBITDA margin
ASP Positively Impacts Margins
3.33.1
2.262.7
50.9
80.6
57.3
45.4
57.3
1H15 1H16 1H17
Sales Volume
NEWC Index
ASP
190.8139.0
127.9
154.7
110.991.2
18.9% 20.2%
28.6%
1H15 1H16 1H17
Sales
Cost of GoodsSold
Gross ProfitMargin
9.07.2
12.9
15.6% 15.8%
22.2%
1H15 1H16 1H17
EBITDA/ton
EBITDA Margin

Balance Sheet
Consolidated Balance SheetIn Million US$
Net Debt to EBITDA2)
In Million US$
Total assets and total liabilities rose similarly due to rise in interest bearing debt from Bank Mandiri’s US$ 50 mn
loan facility. This was for refinancing syndicated loan, investment, and corporate purposes where US$ 40 mn of
proceeds was used by June 2017
Total equity value improved due to current earnings over the period
Net Debt to EBITDA ratio has constantly recorded stability from quarter to quarter at < 0.5x
Note:
(1) Interest Bearing Debt: Bank loans + Financing lease
(2) EBITDA : Based on last 12 months15
276.3Total Assets 261.6 5.6%
Interest Bearing Debt1) 61.351.3 19.5%
Total Liabilities 120.8113.8 6.1%
Shareholders Equity 154.8147.7 5.2%
Balance Sheet Dec’ 16 ChangeJun’ 17
Cash and Cash Equivalent 37.6 31.6%49.5

Capital Expenditure
CAPEX Realization until June 2017
16
Realized CAPEX as of 1H17 :
US$ 5.3 mn in mining-related
activity and power project from
2017 target : US$ 60 – 65 mn (inc.
Investment in power project)
Advance for purchase of fixed
asset 75%
Exploration and land
acquisition15%
Vehicles4%
Machinery and heavy equipment
3%
Conveyor2%
Others1%

96%
63%
71%77%
4%
37%
29%
23%
Traders End-users
30
40
50
60
70
80
90
100
110
120
2014 2015 2016 1H17
NEWC ASP HBA
Rise in 1H17 ASP vs full year 2016 ASP
> rise in NEWC over same period due
to better contracted prices mainly
secured in 2H16
ASP Performance vs Benchmark
17
US$/ton
In 2014-2015, spread between NEWC and ASP narrowed due to optimizing marketing initiative at mainly
fixed price to premium customers in Japan, Korea, Taiwan, and Malaysia
Majority of 2016 sales volume was fixed at price during 1H16 period. Sudden coal price surge in 2H16
beyond market prediction was not reflected in the 2016 ASP, causing widened spread between NEWC
and ASP

Diversified Export Market Base
18
10%
7%5%
30%
26%
31%
4%
10%
24%
18%
6%
11%
6% 6% 7%
1H15 1H16 1H17
China Korea Thailand Taiwan Japan
30.8%
23.6%
11.4%
7.9%
7.0%
5.5%
3.8%
3.4%
2.9%
2.0%
1.7%
0.0 0.2 0.4 0.6
Korea
Thailand
Taiwan
Malaysia
Japan
China
India
Vietnam
Hong Kong
Bangladesh
Others
Million tons
Export Market Focus 1H15 - 1H17 1H17 Export Market - More ASEAN Driven
Given China’s economic situation in 2015, focus shifted towards export markets whose economies showed
stable demand prospects ie. Korea, Japan, Taiwan, India, and at later stages ASEAN ie. Thailand, Malaysia, and
Vietnam (showing positive traction)
Diversification towards countries ex.China remained a highlight for 2016
In 1H17 and going forward, ASEAN markets will play more important role in sourcing coal from its proximate
supplier ie. Indonesia

19
In 1H15 and 1H16, sales constribution consistently derived from mainly 5600 GAR products
Rescheduling of partial sales delivery of 5600 GAR products to 2H17 period has contributed to
decline in the 5600 GAR in 1H17 product composition as compared to previous periods
Product Composition (GAR) by % - 1H17 Product Composition (GAR) : 1H15 - 1H17
Product Composition by Quality
24.8%
23.4%
22.3%
11.4%
10.0%
7.0%
1.1%
0.0 0.2 0.4 0.6
4800 & 5000
5600 HS
5200
5600 RS
5800
5900 LS
Others
Million Tons
32%36%
23%
39%
30%
11%
0%
10% 10%
29%
24%
56%
1H15 1H16 1H17
5600 HS 5600 RS 5800 Others

Snapshot of 2017F
Operation
Prod Vol (mn ton)
SR (x) 12x - 13x
5 - 6
2015
12.3x
6.1
NEWC Coal Price (US$/ton) 66.159.2
Mine Plan Execution
2017 production and SR are targeted similar to those in 2016 of 5 - 6 million tons and 12x
- 13x respectively
Marketing Strategy
The Company continues managing well-diversified market destinations and customer
base, maintaining product quality and timely delivery, as well as optimizing the current
favorable coal price into the Company’s ASP
Capital Expenditure
Total CAPEX for 2017 is estimated at US$ 60 - 65 million, of which 85% - 90% will be
allocated for EPC phase of the power project (Sulbagut-1), with the balance for the mining
business, i.e. land acquisition, and infrastructure/heavy equipment
Sourcing of Other Power Projects
In translating the Company’s vision, the Company will continuously seek for opportunities
in sourcing new power projects (fossil fuel and non fossil fuel based such as renewables)
through participation in IPP tenders as well as through acquisition of existing power assets 20
12x - 13x
5 - 6
2017 F
65 - 70
2016
Building, Infra, Heavy Equip
~5%
Land Acquisition
~6%
Exploration~1%
Power~88%
2017 CAPEX : Significantly into Power Project

21
Performance HighlightsPerformance Highlights2Strategy to Venture into Power3

Business Growth and Sustainabiity
Transformation
• Acquisition of mine(s)
around existing mining
concessions
• Acquisition of mine(s)
to support coal-related
power projects
• Active participation as
IPP* in PLN tenders
• Assessment of
developing renewables
• Identification of
strategic partner with
vast track record
• Expansion of power
project capacity (MW)
Coal Mine
• Optimization of existing mine plan
• Optimization of infrastructure sharing
• Cost management
• Diversification of markets and
customer base
• Active participation in CSR
Company Strategy
Integrated
Energy
Company Fossil Fuel and
Renewables Power
Present Future Company Initiatives
Coal
Mining
Company
* Independent Power Producer 22

23
Why Toba Can Realize this Goal?
Extensive experience in executing project from greenfield to brownfield in
coal mining, CFPP and gas-fired power plant development and operation
Sulbagut-1 CFPP project (2x50 MW) – Financial close was reached on 14
July 2017, the first reached on schedule this year by any IPP. Expected
COD in mid 2020
Second 2x50 MW Sulut-3 CFPP project was signed on 7 April 2017 with
expected COD in 2020
Our partners for the projects are well established and vastly experienced
in construction and operation of power plants in many countries
Having strong partners enable us to de-risk the construction phase of
the projects
Substantial
Power-Related
Milestones
Have Been
Achieved
Experienced
Partners with
Proven Track
Record
Currently, Toba Sejahtra (Toba’s Shareholder) has one operating power
plant asset: 2 x 41 MW Senipah Gas Power Plant, COD in 1Q-2015; and
previously 2 x 15 MW Palu CFPP; reached COD in 2007 (already divested
in 4Q16)
Possessing vast learning curve of knowing what to and not to do in
planning to execution of project management. This enables Toba to
mitigate and minimize project risk
Leveraging
Toba Sejahtra
Group’s
experience

Toba Participation Process in IPP Tenders
IPP Tender Participation 2014-2015
• Toba has actively participated in PLN tenders including 6 IPP bidding projects initiated in 2014-2015. For
gas-fired projects, Toba decided not to continue with the bidding process due to IRR calculation
• Going forward, Toba is targeting non-coal projects, including gas and renewables-based projects
24
Project Name Company Name Capacity
Toba
Stake (%) Status
Sulbagut -1 PT Gorontalo Listrik Perdana 2 x 50 80% Signed PPA in July 2016
Sulut-3 PT Minahasa Cahaya Lestari 2 x 50 90% Signed PPA in April 2017
Gas-fired Power Plant 1 x 500 5% Refrained from bidding process
Gas-fired Power Plant 1 x 250 5% Refrained from bidding process
Gas-fired Power Plant 1 x 100 24% Refrained from bidding process
Gas-fired Power Plant 2 x 800 5% Refrained from bidding process

25
Our Project Selection Process
Targeting return of equity IRR and Project IRR
Ability to identify, assess, and manage completion risk, technical and non-technical risk such as
social assessment for land acquisition to ensure the project can be completed within specified time
schedule
Financial capability to participate in targeted tender projects where PLN sets specific requirements
to meet
Majority control for certain size of IPP projects
Appetite to have minority portion with good and credible partner in larger size projects
• Credible partner with vast experience and proven technology
• Can bring long-term value-add to organization and local people including transfer knowledge
• Have good networking capability with PLN and power stakeholders
Parameters for Project Selection
Parameters for Partner Selection

Leveraging Toba Sejahtra Group’s
Experience in Power Plant Development
Sumatra
Kalimantan
Java
Sulawesi
Malaysia
East Kalimantan
Senipah Power Plant
Central Sulawesi
Palu Power Plant
PLTG Senipah
2 x 41 MW
PJPP *)
2x15 + 2x18 MW
In operation, COD in Q1
2015
Combined Cycle
System is under PPA
finalization for additional
35 MW
Total potential supply:
115 MW
In operation, COD in
2007
Expansion 2x18 MW is
COD 2016
Total potential supply:
66 MW
26
SULBAGUT-1
2 x 50 MW
Financial Close: 14
July 2017, the first
reached on schedule
this year by any IPP
NEW PROJECTS
(Expected COD in 2020)
* Dviested to private buyer in 4Q 2016
SULUT-3
2 x 50 MW
PPA in place, in
process for
Commencement of
Work

Sulbagut-1 Projecti

28
General Description of Sulbagut-1 Project
Project
Location :
North
Gorontalo
Regency,
Sulawesi
Sulbagut-1 Coal-Fired Power Project is part of 35 GW Program
• 2 x 50 MW Capacity
(Nett)
• Build-Own-Operate-Transfer
(BOOT)
Contract Scheme
• 25 YearsContract Period
• MiD 2020COD
Target
• SEPCEPC
• US$ 210-220 million
Project Value

29
Financial Close of Sulbagut-1 Project
Principle License
Land Acquisition
Tariff Approval
EPC Contract
Financing Agreement
Financal Close
Reception
attended by
BoD of PLN
Achievement of
Financing Date with
PLN, 14 July 2017

30
2017 2020
Site
Preparation
2018 2019
Construction
Next after Financial Close...
Commercial
Operation
Date (COD)
Commissioning

Sulut-3 Projectii

32
Project
Location :
North
Minahasa
Regency,
Sulawesi
Sulut-3 Coal-Fired Power Project is part of 35 GW Program
• 2 x 50 MW Net
Capacity
• Build-Own-Operate-Transfer
(BOOT)
Contract Scheme
• 25 YearsContract Period
• 33 months post Commencement
of Work
COD Target
• US$ 205-215 million
Project Value
General Description of Sulut-3 Project

33
Signing of PPA for Sulut-3 Project
Handing of Token of Appreciation to
PLN, 7 April 2017
PPA signing for Sulut -3 Project
7 April 2017

THANK YOU