
TO A - LINCOLN ELECTRIC
87
TO A 2019 PROXY STATEMENT WELD AUTOMATE EDUCATE CONSERVE MENU
Transcript of TO A - LINCOLN ELECTRIC

TO A
2019 PROXY STATEMENT
WELD AUTOMATE EDUCATE CONSERVEOPERATE JOIN BUILD DESIGN CUT ENGAGE
MENU

OUR PURPOSE:
OUR GUIDING PRINCIPLE—THE GOLDEN RULE:
O P E R A T I N G B Y A H I G H E R S T A N D A R D T O B U I L D A B E T T E R W O R L D
T R E A T O T H E R S H O W Y O U W O U L D L I K E T O B E T R E A T E D
EMPLOYEE DEVELOPMENTWe provide
opportunities for growthand development.
CUSTOMER FOCUSEDWe prioritize our customers
needs first and deliver exceptional service.
COMMITMENTWe honor our
commitments, are dependable and
operate responsibly.
INTEGRITYWe follow the
“Golden Rule” and treat others with respect and dignity.
PERFORMANCEWe strive for excellence in
all that we do and recognize
and reward success.
QUALITYWe provide world-class
solutions and continuouslyimprove our operations.
THE GOLDEN RULE
ANNUAL MEETING LOCATION MAP
Lincoln Electric’s Welding Technology & Training Center, 22800 St. Clair Avenue, Cleveland, Ohio 44117, [216] 481-8100
MENU
DEAR SHAREHOLDER:You are cordially invited to attend the Annual Meeting of Shareholders of Lincoln Electric Holdings, Inc., which will be held at 11:00am ET on Wednesday, April 24, 2019 at Lincoln Electric’s Welding Technology & Training Center, 22800 St. Clair Avenue, Cleveland, Ohio. A map of the location is printed on the inside back cover of this proxy statement.
At the meeting, you will be asked to:
• Elect eleven Director nominees named in the proxy
statement to serve until the 2020 Annual Meeting
• Ratify the appointment of our independent auditors
for the year ending December 31, 2019
• Approve, on an advisory basis, the compensation of
our named executive officers
• Address any other business that properly comes
before the meeting
Shareholders of record on the close of business on
February 28, 2019, the record date, are entitled to vote
at the Annual Meeting. Your vote is very important!
Please vote your shares promptly in one of the four
ways noted on page 5. We appreciate your continued
confidence in Lincoln Electric and we look forward to
seeing you at the Annual Meeting!
Sincerely,
Christopher L. Mapes Chairman, President and Chief Executive Officer
Jennifer I. AnsberryExecutive Vice President,General Counsel and Secretary
WE WILL BEGIN MAILING THIS PROXY STATEMENT ON OR ABOUT MARCH 22, 2019.
Important Notice Regarding the Availability of Proxy Materials for the Shareholder Meeting to Be Held on April 24, 2019:
This proxy statement and the related form of proxy, along with our 2018 Annual Report and Form 10-K, are available free of
charge at www.lincolnelectric.com/proxymaterials.
/ 0 1L I N C O L N E L E C T R I C : 2 0 1 9 P R O X Y S TA T E M E N T
MENU

/ 0 2
BUSINESS OVERVIEW
BUSINESS OVERVIEW //Lincoln Electric is the world leader in the design, develop-
ment and manufacture of arc welding products, robotic
arc welding systems, plasma and oxyfuel cutting equip-
ment and has a leading global position in the brazing and
soldering alloys market. Headquartered in Cleveland,
Ohio, U.S., we operate 60 manufacturing locations in 19
countries and distribute to over 160 countries. In 2018, we
generated a record $3.0 billion in sales.
As an innovation leader with the broadest portfolio of
solutions and the industry’s largest team of technical
sales representatives and application experts, we are
known as the Welding Experts®. Our portfolio of welding
and cutting solutions are designed to help customers
achieve greater productivity and quality in their manu-
facturing and fabrication processes. We leverage our
global presence and broad distribution network to serve
an array of customers across various end markets includ-
ing: general metal fabrication, energy, structural steel
construction and infrastructure (commercial buildings
and bridges), heavy industries (agricultural, mining, con-
struction and rail equipment, as well as shipbuilding),
and automotive/transportation.
Cleveland, Ohio USAGlobal Headquarters
LOCATIONS
Manufacturing
Weld Tech Centers
Sales Of f ices
FOUNDED 1895
EMPLOYEES WORLDWIDE
11,000
CORPORATE HEADQUARTERS Cleveland, OH
NASDAQ STOCK
SYMBOL LECO
COUNTRY FOOTPRINT/
DISTRIBUTION 19/160+
MANUFACTURING
FACILITIES 60
2018 REVENUE
$3.0 billion
MOST EXTENSIVE SOLUTIONS PORTFOLIO Globally
COMMERCIAL & TECHNICAL TEAM
Largest
LONGEST RUNNING
WELDING SCHOOL Founded 1917
PATENT FILER IN THE INDUSTRY #1 or #2
(ranking based on application)
NEW PRODUCT VITALITY INDEX1
34%
FAST FACTS
OUR GLOBAL FOOTPRINT
(1) Vitality index represents the percent of sales from new products launched in the last five years, and excludes the International Welding segment.
MENU

/ 0 3L I N C O L N E L E C T R I C : 2 0 1 9 P R O X Y S TA T E M E N T
For nearly 125 years, we have achieved success through a balanced approach and our focus in providing:
• Customers with a market leading product offering and
superior technical application capability,
• Employees with an incentive and results driven
culture, and
• Shareholders with above market returns.
In 2010, we mobilized the organization around a ten year “2020 Vision and Strategy” that focuses on expanding
our position as a valued, technical solutions-provider in our industry by accelerating innovation, operational
excellence, and achieving best-in-class financial results through an economic cycle. The strategy is founded on
our values and organizes commercial and operational initiatives around six core capabilities and competitive
advantages to drive growth and improved margin and return performance: welding process expertise, commer-
cial excellence, product development, global network and reach, operational excellence and financial discipline.
In executing our “2020 Vision and Strategy,” we have pursued an aggressive acquisi-
tion strategy, accelerated our investments in R&D to enhance the value proposition
and positioning of our solutions, and have emphasized engineered solutions for
mission-critical applications. Additionally, we have focused on expanding our
brand’s geographic and channel reach into attractive areas such as automation. Our
efforts have been successful. Contributions from acquisitions, a strong vitality
index of new products, and expanded market presence have helped improve margin
performance and returns. Our focus on operational excellence, safety and sustainability initiatives have helped
structurally improve our operations and have contributed to improved margins, cash flow generation and returns.
We are well positioned for improved long-term operating performance of the business through the economic cycle.
Our financial performance against our “2020 Vision & Strategy” goals reflects steady progress across most metrics:
Key Financial Metrics 2020 Goal 2009–2018 Achievement1 Key Initiatives and Focus
Sales Growth CAGR10% CAGRthrough the cycle
6.4% Reported Sales CAGR8% CAGR (Excludes FX andVenezuela results)
• Increased investment in R&D, increasing our new product vitality index
• Active acquisition program
Operating Income Margin15% Averagethrough the cycle
12.0% Average Reported12.9% Average Adjusted (Achieved a 5-year average 14.1% adjusted margin)
• Targeted growth opportunities• Richening the portfolio mix through differentiated technologies and applications
• Operational excellence
Return on Invested
Capital (ROIC)15% Averagethrough the cycle
17.1% Average
• Disciplined acquisition program with stringent ROIC and IRR goals
• Margin expansion• Cash management
Average OperatingWorking Capital Ratio
15% at 202016.5% at 2018 (670 bps improvement vs. 2009)
• Effective cash cycle management• Inventory management
(1) See Appendix A for definitions and/or reconciliations of these metrics to results reported in accordance with generally accepted accounting principles (GAAP).
MENU

In 2019, the Company will transition to a new long-term strategy, the “Higher
Standard 2025 Strategy” (HS2025). HS2025 builds upon the financial and sustain-
ability achievements from our “2020 Vision and Strategy” to ensure Lincoln Electric
continues to deliver superior value to its stakeholders. The growth strategy lever-
ages an active acquisition program and organic growth across our global footprint
emphasizing differentiated, value-added solutions and technologies. The strategy
will continue to focus on achieving best-in-class financial and sustainability perfor-
mance, as well as amplifying employee engagement. The strategy will focus invest-
ments and initiatives in four areas:
• Customer Focused: Enhance our value proposition and the ease of doing business
with us by leveraging our leading CRM system and investments in industry-segment
market-facing teams, product portfolios and international technical centers.
• Employee Development: Improve opportunities for our employees to learn and
grow through new development programs, resource groups, engagement initia-
tives, and enhanced HR systems and tools.
• Solutions & Value: Develop solutions that improve customers’ ability to make
their products better, safer and easier. Key initiatives include accelerated growth
in automated solutions and additive services, enhanced software (IoT and AI), and
designing greater efficiency and sustainability into new products.
• Operational Excellence: Improve our quality, costs and processes by maximizing
continuous improvement through our Lincoln Business System, further digitization
of our operations and processes, and achievement of our sustainability goals.
BUSINESS OVERVIEW
/ 0 4
MENU
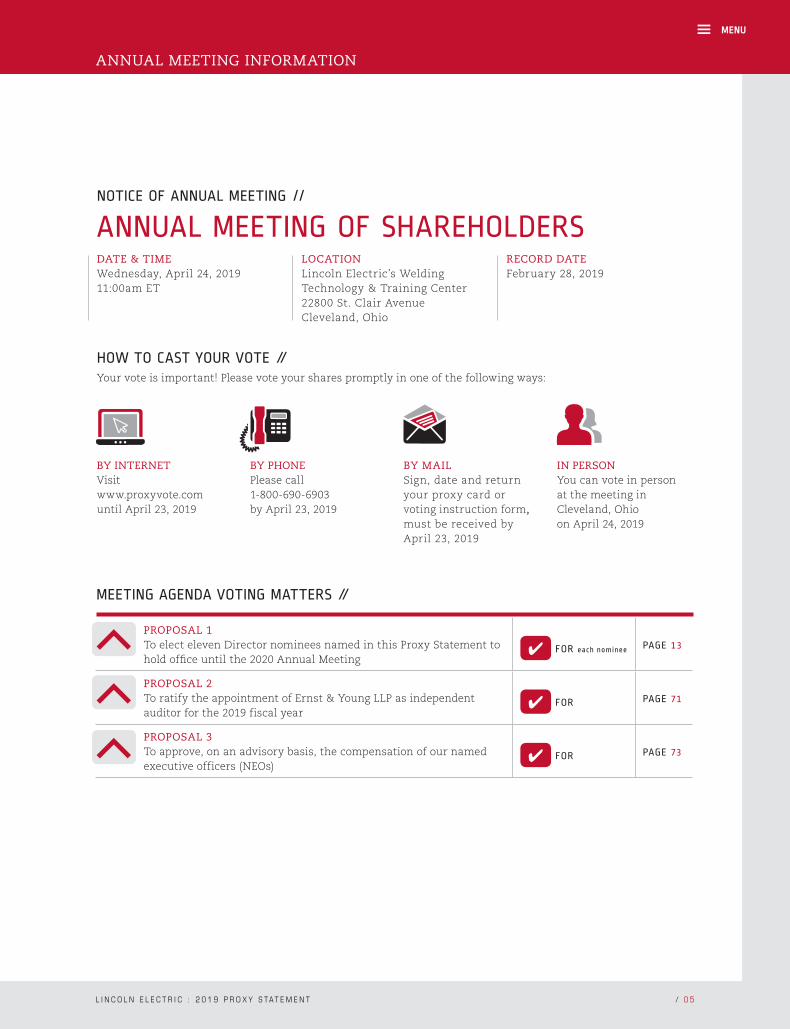
NOTICE OF ANNUAL MEETING //
ANNUAL MEETING OF SHAREHOLDERS DATE & TIME Wednesday, April 24, 2019 11:00am ET
LOCATION Lincoln Electric’s Welding Technology & Training Center22800 St. Clair AvenueCleveland, Ohio
RECORD DATE February 28, 2019
BY INTERNET Visit www.proxyvote.com until April 23, 2019
BY PHONE Please call 1-800-690-6903 by April 23, 2019
BY MAIL Sign, date and return your proxy card or voting instruction form, must be received by April 23, 2019
IN PERSON You can vote in person at the meeting in Cleveland, Ohio on April 24, 2019
HOW TO CAST YOUR VOTE // Your vote is important! Please vote your shares promptly in one of the following ways:
MEETING AGENDA VOTING MATTERS //
PROPOSAL 1 To elect eleven Director nominees named in this Proxy Statement to hold office until the 2020 Annual Meeting
✔ FOR each nominee PAGE 13
PROPOSAL 2 To ratify the appointment of Ernst & Young LLP as independent auditor for the 2019 fiscal year
✔ FOR PAGE 71
PROPOSAL 3 To approve, on an advisory basis, the compensation of our named executive officers (NEOs)
✔ FOR PAGE 73
/ 0 5L I N C O L N E L E C T R I C : 2 0 1 9 P R O X Y S TA T E M E N T
ANNUAL MEETING INFORMATION
MENU
PROXY SUMMARY //This section provides an overview of important items related to this proxy statement and the Annual Meeting. We encourage you to read the entire proxy statement for more information before voting.
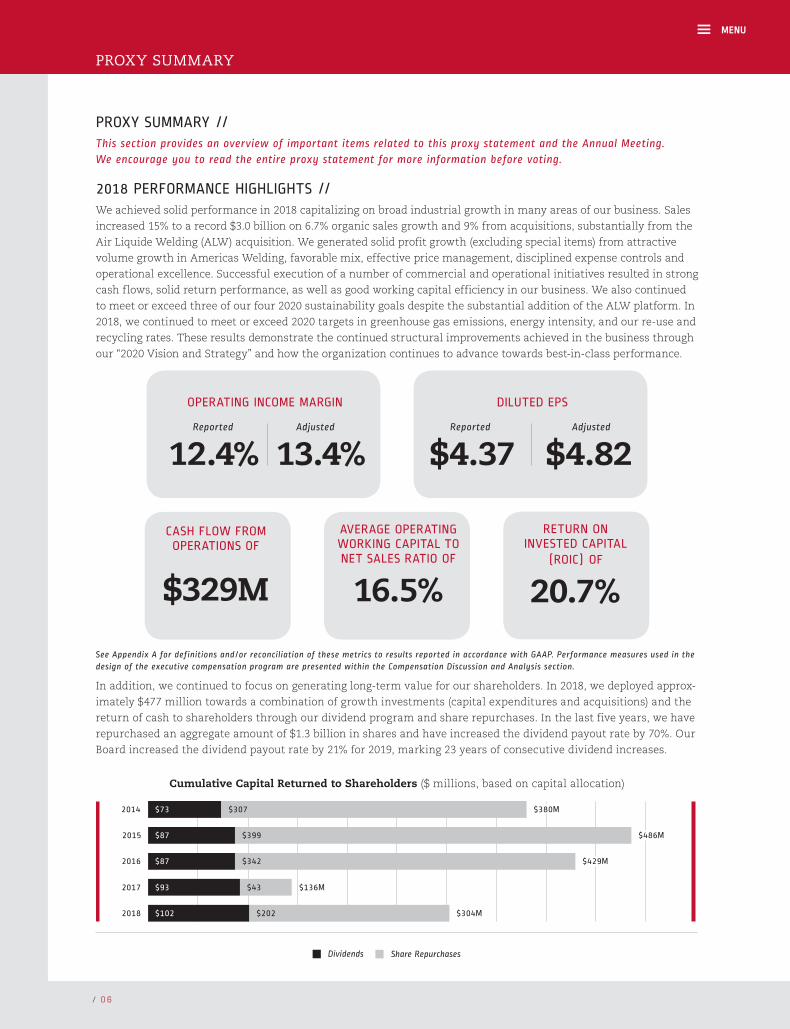
2018 PERFORMANCE HIGHLIGHTS //We achieved solid performance in 2018 capitalizing on broad industrial growth in many areas of our business. Sales
increased 15% to a record $3.0 billion on 6.7% organic sales growth and 9% from acquisitions, substantially from the
Air Liquide Welding (ALW) acquisition. We generated solid profit growth (excluding special items) from attractive
volume growth in Americas Welding, favorable mix, effective price management, disciplined expense controls and
operational excellence. Successful execution of a number of commercial and operational initiatives resulted in strong
cash flows, solid return performance, as well as good working capital efficiency in our business. We also continued
to meet or exceed three of our four 2020 sustainability goals despite the substantial addition of the ALW platform. In
2018, we continued to meet or exceed 2020 targets in greenhouse gas emissions, energy intensity, and our re-use and
recycling rates. These results demonstrate the continued structural improvements achieved in the business through
our “2020 Vision and Strategy” and how the organization continues to advance towards best-in-class performance.
DILUTED EPS
Reported Adjusted
$4.37 $4.82
OPERATING INCOME MARGIN
Reported Adjusted
12.4% 13.4%
CASH FLOW FROM OPERATIONS OF
$329M
AVERAGE OPERATING WORKING CAPITAL TO NET SALES RATIO OF
16.5%
RETURN ON INVESTED CAPITAL
(ROIC) OF
20.7%
See Appendix A for definitions and/or reconciliation of these metrics to results reported in accordance with GAAP. Performance measures used in the design of the executive compensation program are presented within the Compensation Discussion and Analysis section.
In addition, we continued to focus on generating long-term value for our shareholders. In 2018, we deployed approx-
imately $477 million towards a combination of growth investments (capital expenditures and acquisitions) and the
return of cash to shareholders through our dividend program and share repurchases. In the last five years, we have
repurchased an aggregate amount of $1.3 billion in shares and have increased the dividend payout rate by 70%. Our
Board increased the dividend payout rate by 21% for 2019, marking 23 years of consecutive dividend increases.
Cumulative Capital Returned to Shareholders ($ millions, based on capital allocation)
0 50 100 150
Dividends Share Repurchases
200 250 300 350 400 450 500
$73 $307 $380M
$486M
$429M
$136M
$304M
$399
$342
$43
$2022018
2017
2016
2015
2014
$87
$87
$93
$102
0 50 100 150
Dividends Share Repurchases
200 250 300 350 400 450 500
$73 $307 $380M
$486M
$429M
$136M
$304M
$399
$342
$43
$2022018
2017
2016
2015
2014
$87
$87
$93
$102
/ 0 6
PROXY SUMMARY
MENU
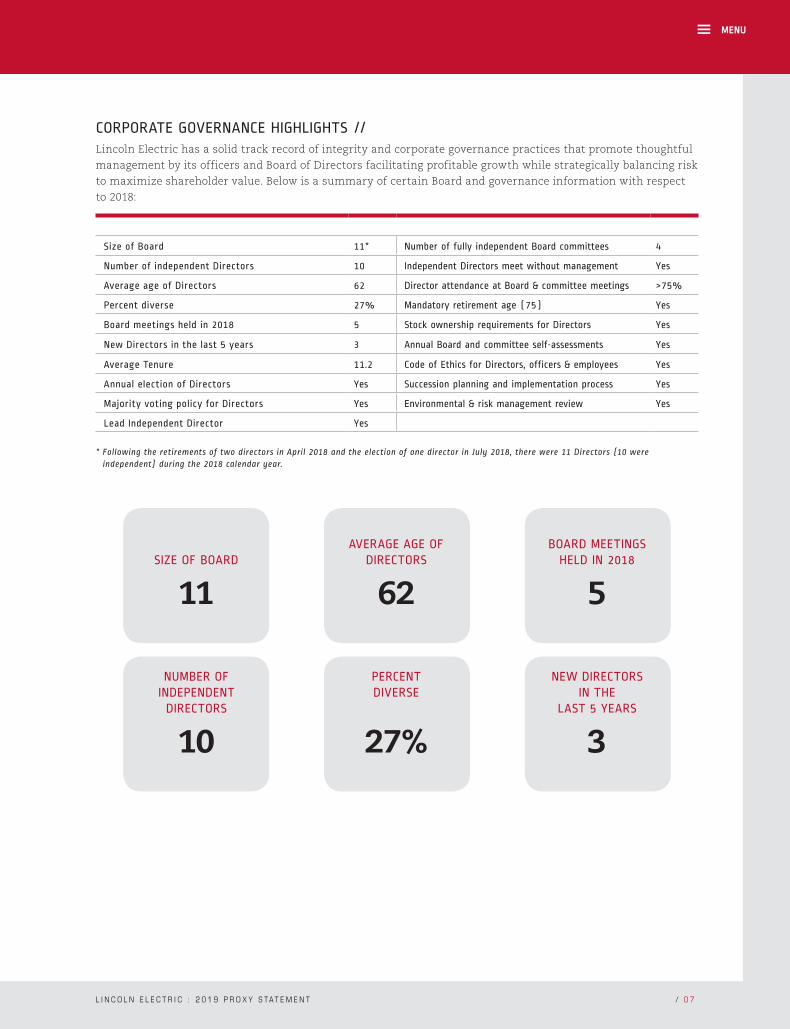
CORPORATE GOVERNANCE HIGHLIGHTS //Lincoln Electric has a solid track record of integrity and corporate governance practices that promote thoughtful
management by its officers and Board of Directors facilitating profitable growth while strategically balancing risk
to maximize shareholder value. Below is a summary of certain Board and governance information with respect
to 2018:
Size of Board 11* Number of fully independent Board committees 4
Number of independent Directors 10 Independent Directors meet without management Yes
Average age of Directors 62 Director attendance at Board & committee meetings >75%
Percent diverse 27% Mandatory retirement age (75) Yes
Board meetings held in 2018 5 Stock ownership requirements for Directors Yes
New Directors in the last 5 years 3 Annual Board and committee self-assessments Yes
Average Tenure 11.2 Code of Ethics for Directors, officers & employees Yes
Annual election of Directors Yes Succession planning and implementation process Yes
Majority voting policy for Directors Yes Environmental & risk management review Yes
Lead Independent Director Yes
* Following the retirements of two directors in April 2018 and the election of one director in July 2018, there were 11 Directors (10 were independent) during the 2018 calendar year.
SIZE OF BOARD
11
AVERAGE AGE OF
DIRECTORS
62
BOARD MEETINGS
HELD IN 2018
5
NUMBER OF INDEPENDENT DIRECTORS
10
PERCENTDIVERSE
27%
NEW DIRECTORS IN THE
LAST 5 YEARS
3
/ 0 7L I N C O L N E L E C T R I C : 2 0 1 9 P R O X Y S TA T E M E N T
MENU
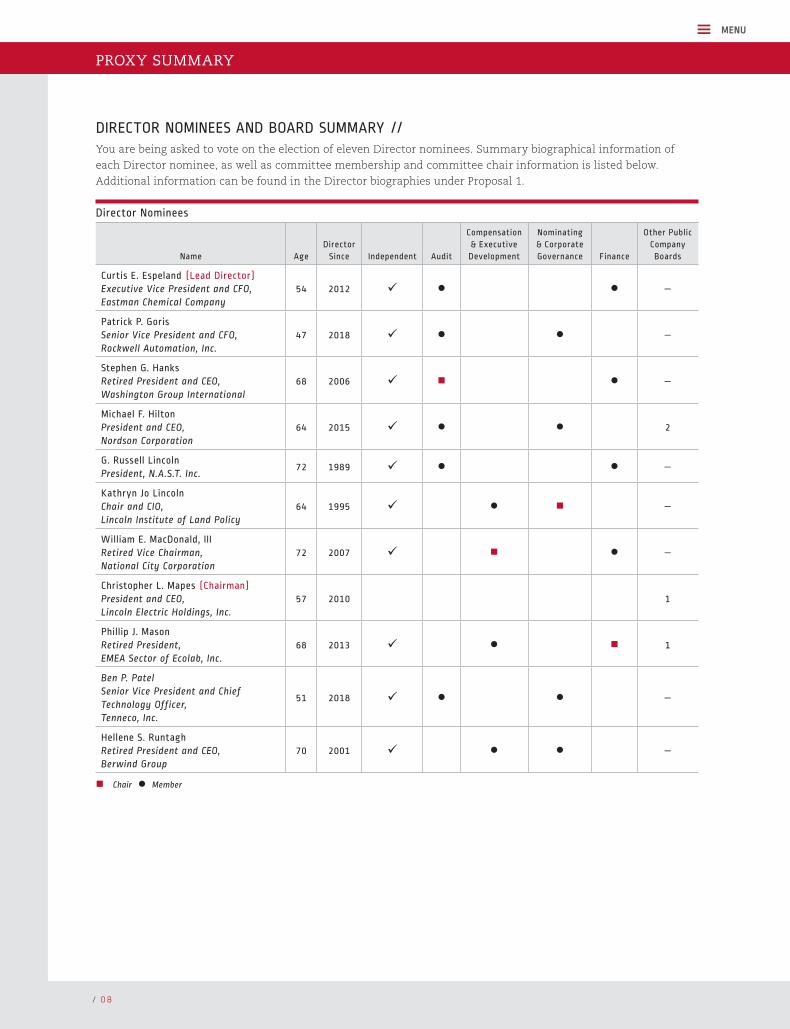
DIRECTOR NOMINEES AND BOARD SUMMARY //You are being asked to vote on the election of eleven Director nominees. Summary biographical information of
each Director nominee, as well as committee membership and committee chair information is listed below.
Additional information can be found in the Director biographies under Proposal 1.
Director Nominees
Name Age Director
Since Independent Audit
Compensation & Executive Development
Nominating & Corporate Governance Finance
Other Public Company Boards
Curtis E. Espeland (Lead Director)Executive Vice President and CFO,Eastman Chemical Company
54 2012 ¸ l l —
Patrick P. Goris Senior Vice President and CFO,Rockwell Automation, Inc.
47 2018 ¸ l l —
Stephen G. Hanks Retired President and CEO,Washington Group International
68 2006 ¸ n l —
Michael F. HiltonPresident and CEO,Nordson Corporation
64 2015 ¸ l l 2
G. Russell LincolnPresident, N.A.S.T. Inc.
72 1989 ¸ l l —
Kathryn Jo LincolnChair and CIO,Lincoln Institute of Land Policy
64 1995 ¸ l n —
William E. MacDonald, IIIRetired Vice Chairman,National City Corporation
72 2007 ¸ n l —
Christopher L. Mapes (Chairman)President and CEO, Lincoln Electric Holdings, Inc.
57 2010 1
Phillip J. MasonRetired President,EMEA Sector of Ecolab, Inc.
68 2013 ¸ l n 1
Ben P. PatelSenior Vice President and Chief Technology Officer, Tenneco, Inc.
51 2018 ¸ l l —
Hellene S. RuntaghRetired President and CEO,Berwind Group
70 2001 ¸ l l —
n Chair l Member
PROXY SUMMARY
/ 0 8
MENU

EXECUTIVE COMPENSATION PROGRAM HIGHLIGHTS //We have a long history of driving an incentive management culture, emphasizing pay for performance to align
compensation with the achievement of enterprise, segment and individual goals.
We believe our compensation program and practices provide an appropriate balance between profitability, cash
flow and returns, on the one hand, and suitable levels of risk-taking, on the other. This balance, in turn, aligns
compensation strategies with shareholder interests, as reflected by the consistent high level of shareholders vot-
ing for the compensation of our named executive officers (NEOs).
ACTIONS TO FURTHER ALIGN EXECUTIVE COMPENSATION WITH SHAREHOLDER INTERESTS
The Compensation and Executive Development Committee of the Board reviews the framework of our executive
compensation program to ensure executive pay aligns with our pay for performance philosophy. Our Compensation
and Executive Development Committee has made a number of changes over the last few years to ensure corporate
performance alignment with shareholder interests, which has been reflected in the strong results on our “say-on-pay”
proposals on the compensation of our NEOs. In 2018, the overall design of our executive compensation program
was held consistent with policies developed in prior years.
2018 Executive Compensation Practices
What We Do What We Don’t Do
We have long-term compensation programs focused on profitability, net income growth, ROIC and total shareholder returns
¸ We do not allow hedging or pledging of our shares ✘
We use targeted performance metrics to align pay with performance
¸We do not reprice stock options and do not issue discounted stock options
✘
We maintain stock ownership requirements (5x base salary for CEO; 3x base salary for other NEOs)
¸ We do not provide excessive perquisites ✘
We have shareholder-approved incentive plans ¸
We do not have multi-year guaranteesfor compensation increases
✘ We have a broad clawback policy ¸
We have a double-trigger change in control policy ¸
/ 0 9L I N C O L N E L E C T R I C : 2 0 1 9 P R O X Y S TA T E M E N T
MENU
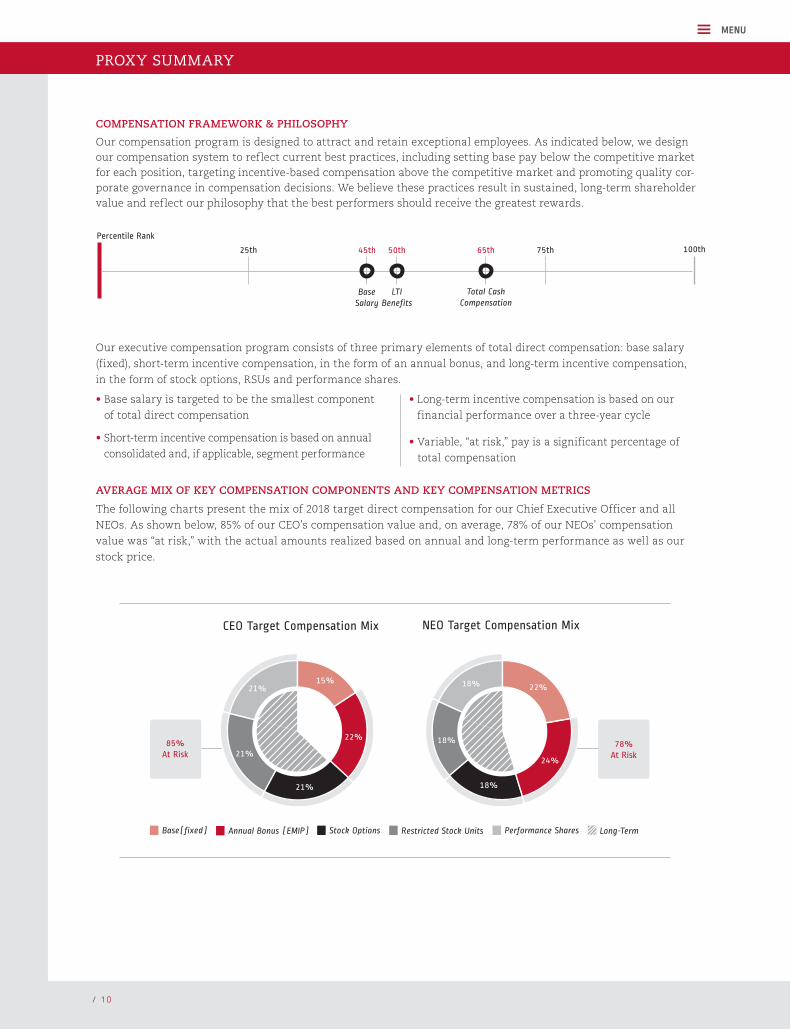
COMPENSATION FRAMEWORK & PHILOSOPHY
Our compensation program is designed to attract and retain exceptional employees. As indicated below, we design our compensation system to reflect current best practices, including setting base pay below the competitive market for each position, targeting incentive-based compensation above the competitive market and promoting quality cor-porate governance in compensation decisions. We believe these practices result in sustained, long-term shareholder value and reflect our philosophy that the best performers should receive the greatest rewards.
AVERAGE MIX OF KEY COMPENSATION COMPONENTS AND KEY COMPENSATION METRICS
The following charts present the mix of 2018 target direct compensation for our Chief Executive Officer and all
NEOs. As shown below, 85% of our CEO’s compensation value and, on average, 78% of our NEOs’ compensation
value was “at risk,” with the actual amounts realized based on annual and long-term performance as well as our
stock price.
85%At Risk
78%At Risk
21% 18%
18%
24%
22%
21%
21%
22%
CEO Target Compensation Mix
Base(fixed) Annual Bonus (EMIP) Stock Options Restricted Stock Units Performance Shares Long-Term
NEO Target Compensation Mix
15%
18%85%At Risk
78%At Risk
21% 18%
18%
24%
22%
21%
21%
22%
CEO Target Compensation Mix
Base(fixed) Annual Bonus (EMIP) Stock Options Restricted Stock Units Performance Shares Long-Term
NEO Target Compensation Mix
15%
18%
85%At Risk
78%At Risk
21% 18%
18%
24%
22%
21%
21%
22%
CEO Target Compensation Mix
Base(fixed) Annual Bonus (EMIP) Stock Options Restricted Stock Units Performance Shares Long-Term
NEO Target Compensation Mix
15%
18%
Percentile Rank
75th25th
BaseSalary
LTIBenefits
Total CashCompensation
100th45th 50th 65th
PROXY SUMMARY
/ 1 0
• Base salary is targeted to be the smallest component
of total direct compensation
• Short-term incentive compensation is based on annual
consolidated and, if applicable, segment performance
• Long-term incentive compensation is based on our
financial performance over a three-year cycle
• Variable, “at risk,” pay is a significant percentage of
total compensation
Our executive compensation program consists of three primary elements of total direct compensation: base salary
(fixed), short-term incentive compensation, in the form of an annual bonus, and long-term incentive compensation,
in the form of stock options, RSUs and performance shares.
MENU

We use the following six key financial performance measures to evaluate results across short-term and long-term
periods.
Key Performance Metrics Tied to Executive Compensation
MetricAnnual
CompensationLong-Term Incentive Programs
(3-yr Performance Cycle)
EBITB1,2 (Earnings before interest, taxes and bonus) ¸
Average Operating Working Capital to Sales2 ratio ¸
Consolidated, segment and individual performance ¸
Adjusted Net Income2 growth ¸
Return on Invested Capital (ROIC)2¸
Total Shareholder Return (TSR)2¸
(1) EBITB is an internal measure which tracks our adjusted operating income.
(2) Performance measures used in the design of the executive compensation program are defined in Appendix A.
AUDITOR //We ask our shareholders to ratify the selection of Ernst & Young LLP as our independent registered public accounting
firm for the year ending December 31, 2019. Below is summary information about fees paid to Ernst & Young LLP for
services provided during fiscal years 2018 and 2017.
2018 2017
Audit Fees $3,318,000 $3,474,000
Audit-Related Fees 72,000 14,000
Tax Fees 436,000 235,000
All Other Fees 0 0
Total Fees $3,826,000 $3,723,000
/ 1 1L I N C O L N E L E C T R I C : 2 0 1 9 P R O X Y S TA T E M E N T
MENU
TABLE OF CONTENTS
BUSINESS OVERVIEW 2
NOTICE OF ANNUAL MEETING 5
PROXY SUMMARY 6
PROPOSAL 1—ELECTION OF DIRECTORS 13
DIRECTOR NOMINEES 14 CORPORATE GOVERNANCE 20 COMPENSATION-RELATED RISK 23 RELATED PARTY TRANSACTIONS 23 OUR BOARD COMMITTEES 23 DIRECTOR COMPENSATION 27
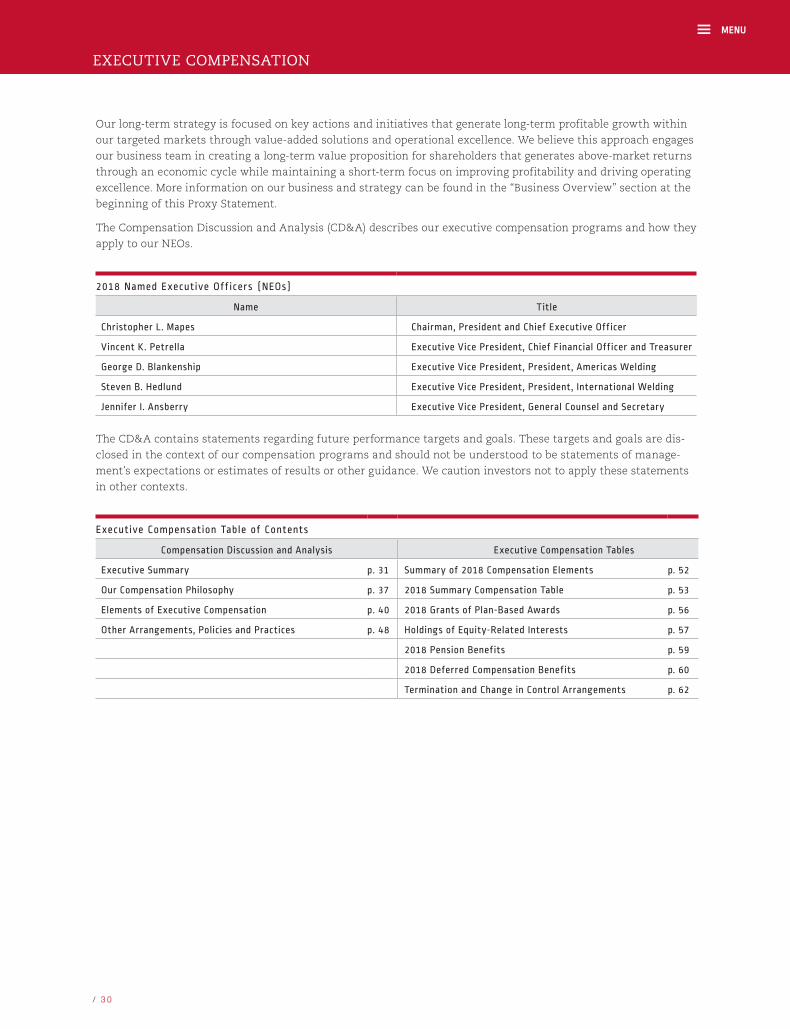
EXECUTIVE COMPENSATION 30
COMPENSATION DISCUSSION AND ANALYSIS 31 COMPENSATION COMMITTEE REPORT 51 EXECUTIVE COMPENSATION TABLES 52 TERMINATION AND CHANGE IN CONTROL ARRANGEMENTS 62 PAY RATIO 66
MANAGEMENT OWNERSHIP OF SHARES 67
BENEFICIAL OWNERSHIP TABLE 67 EQUITY COMPENSATION PLAN INFORMATION 68SECTION 16(A) BENEFICIAL OWNERSHIP REPORTING COMPLIANCE 68
OTHER OWNERSHIP OF SHARES 69
COMPENSATION COMMITTEE INTERLOCKS AND INSIDER PARTICIPATION 70
EXECUTIVE BIOGRAPHIES 71
BOARD PROPOSALS 71
PROPOSAL 1—ELECTION OF DIRECTORS 71 PROPOSAL 2—RATIFICATION OF INDEPENDENT AUDITORS 71 PROPOSAL 3—ADVISORY VOTE ON EXECUTIVE COMPENSATION 73
AUDIT COMMITTEE REPORT 75
FAQS 76
APPENDIX A—DEFINITIONS AND NON-GAAP FINANCIAL MEASURES A-1
PROPOSAL 1—ELECTION OF DIRECTORS
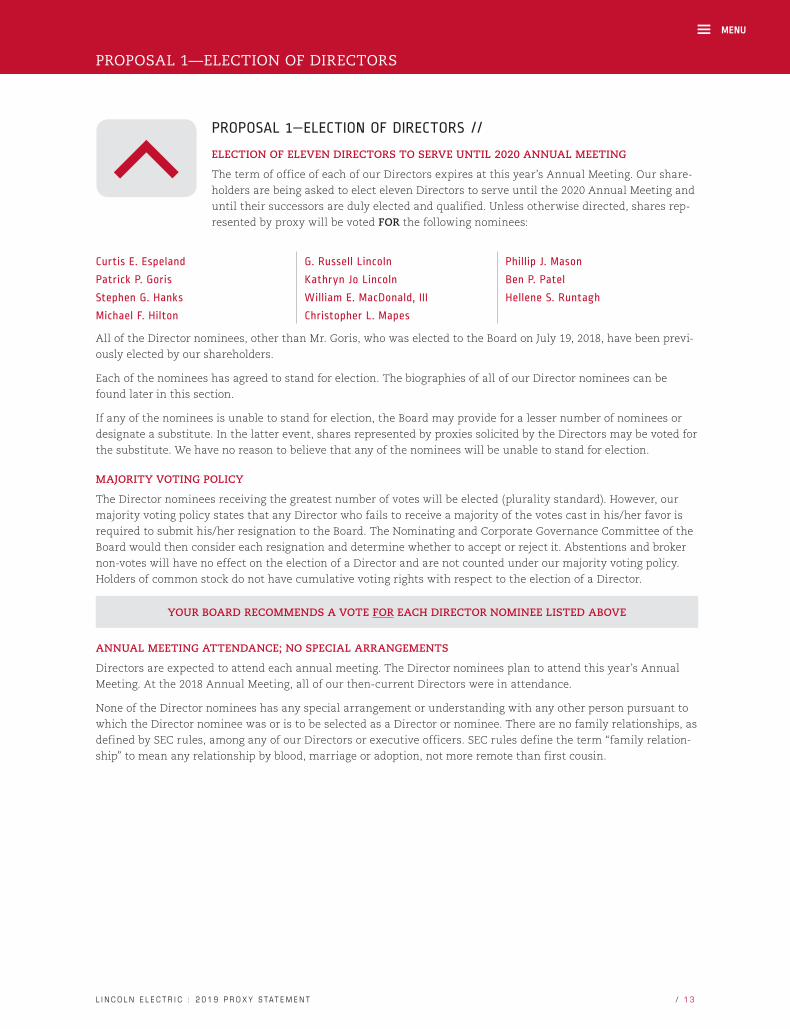
PROPOSAL 1—ELECTION OF DIRECTORS //
ELECTION OF ELEVEN DIRECTORS TO SERVE UNTIL 2020 ANNUAL MEETING
The term of office of each of our Directors expires at this year’s Annual Meeting. Our share-
holders are being asked to elect eleven Directors to serve until the 2020 Annual Meeting and
until their successors are duly elected and qualified. Unless otherwise directed, shares rep-
resented by proxy will be voted FOR the following nominees:
Curtis E. Espeland G. Russell Lincoln Phillip J. Mason
Patrick P. Goris Kathryn Jo Lincoln Ben P. Patel
Stephen G. Hanks William E. MacDonald, III Hellene S. Runtagh
Michael F. Hilton Christopher L. Mapes
All of the Director nominees, other than Mr. Goris, who was elected to the Board on July 19, 2018, have been previ-
ously elected by our shareholders.
Each of the nominees has agreed to stand for election. The biographies of all of our Director nominees can be
found later in this section.
If any of the nominees is unable to stand for election, the Board may provide for a lesser number of nominees or
designate a substitute. In the latter event, shares represented by proxies solicited by the Directors may be voted for
the substitute. We have no reason to believe that any of the nominees will be unable to stand for election.
MAJORITY VOTING POLICY
The Director nominees receiving the greatest number of votes will be elected (plurality standard). However, our
majority voting policy states that any Director who fails to receive a majority of the votes cast in his/her favor is
required to submit his/her resignation to the Board. The Nominating and Corporate Governance Committee of the
Board would then consider each resignation and determine whether to accept or reject it. Abstentions and broker
non-votes will have no effect on the election of a Director and are not counted under our majority voting policy.
Holders of common stock do not have cumulative voting rights with respect to the election of a Director.
YOUR BOARD RECOMMENDS A VOTE FOR EACH DIRECTOR NOMINEE LISTED ABOVE
ANNUAL MEETING ATTENDANCE; NO SPECIAL ARRANGEMENTS
Directors are expected to attend each annual meeting. The Director nominees plan to attend this year’s Annual
Meeting. At the 2018 Annual Meeting, all of our then-current Directors were in attendance.
None of the Director nominees has any special arrangement or understanding with any other person pursuant to
which the Director nominee was or is to be selected as a Director or nominee. There are no family relationships, as
defined by SEC rules, among any of our Directors or executive officers. SEC rules define the term “family relation-
ship” to mean any relationship by blood, marriage or adoption, not more remote than first cousin.
MENU
/ 1 3L I N C O L N E L E C T R I C : 2 0 1 9 P R O X Y S TA T E M E N T
PROPOSAL 1—ELECTION OF DIRECTORS
DIRECTOR NOMINEES
Recent Business Experience:Executive Vice President and Chief Financial Officer of Eastman Chemical Company (an advanced materials and specialty additives manufacturer) since January 2014. Prior to his service as Executive Vice President and Chief Financial Officer, Mr. Espeland was Senior Vice President and Chief Financial Officer from 2008 to January 2014 and Vice President, Finance and Chief Accounting Officer of Eastman Chemical from 2005 to 2008.
Qualifications:Mr. Espeland has extensive experience in corporate finance and accounting, having served in various finance and accounting roles, and ultimately as the Chief Financial Officer, at a large publicly-traded company (Eastman Chemical) for the past several years. Mr. Espeland also has significant experience in the areas of mergers and acquisitions, taxation and enter-prise risk management. Mr. Espeland also served as an independent auditor at Arthur Andersen LLP having worked in both the United States and abroad (Europe and Australia). The Board has determined Mr. Espeland’s extensive accounting and finance experience qualifies him as an “audit committee financial expert.” This expertise makes Mr. Espeland an import-ant member of the Audit Committee and the Finance Committee. In addition, Mr. Espeland’s international business experience is a valued asset for our global operations.
Recent Business Experience:Senior Vice President and Chief Financial Officer of Rockwell Automation (a global industrial automation and information solutions provider) since February 2017. Previously, Mr. Goris was Vice President, Investor Relations and Vice President, Finance, Architecture and Software from 2015 to 2017 and Vice President, Finance, Architecture and Software and Operations and Engineering Services from 2013 to 2015 at Rockwell Automation.
Qualifications:Mr. Goris’ financial expertise as the Chief Financial Officer of a publicly- traded, multinational organization adds value to the Board and qualifies him as an “audit committee financial expert.” Mr. Goris has extensive experience in accounting, financial planning and analysis and investor relations. In addition, Mr. Goris’ experience with a global industrial automation and infor-mation solutions company provides him with broad exposure to digital oper-ations and “smart” manufacturing solutions using data and analytics, which enhances operational intelligence, productivity and risk management in manufacturing processes. These are key initiatives for our business and our customers’ businesses. This makes him an important member of the Board, as well as the Audit and Nominating and Corporate Governance Committees.
CURTIS E. ESPELAND
AGE: 54
Director since 2012Lead Director since 2018
PATRICK P. GORIS
AGE: 47
Director since 2018
/ 1 4
MENU

DIRECTOR NOMINEES
Recent Business Experience:Mr. Hanks spent 30 years with global engineering and construction com-pany Morrison Knudsen Corporation and its successor, Washington Group International, Inc., serving the last eight years as President, CEO and a member of its Board of Directors, retiring in January 2008.
Directorships:McDermott International, Inc. (NYSE: MDR) from 2009 to May 2018, Babcock & Wilcox Enterprises, Inc. (NYSE: BW) from 2010 to March 2018, The Washington Companies (privately owned).
Qualifications:Mr. Hanks’ executive leadership of a U.S. publicly-held company with international reach has provided him with extensive experience dealing with the issues that these companies confront. His diverse professional skill set, including finance (having served as CFO of Morrison Knudsen) and legal competencies (such as enterprise risk management, corporate compliance and legal strategy), make him a valuable member of the Board, the Audit Committee (where he is the Chair) and the Finance Committee. Mr. Hanks’ experience as a Chief Executive Officer and Chief Financial Officer of a publicly-held company qualifies him as an “audit committee financial expert.”
Recent Business Experience:President and Chief Executive Officer of Nordson Corporation (a company that engineers, manufactures and markets differentiated products and systems used for the precision dispensing of adhesives, coatings, sealants, biomaterials, polymers, plastics and other materials, fluid management, test and inspection, UV curing and plasma surface treatment), since 2010. Prior to joining Nordson, Mr. Hilton was the Senior Vice President and General Manager for Air Products and Chemicals, Inc. (a company that pro-vides a unique portfolio of atmospheric gases, process and specialty gases, performance materials, and equipment and services) with specific respon-sibility for leading its $2 billion global Electronics and Performance Materials segment. Air Products serves customers in industrial, energy, technology and healthcare markets globally.
Directorships:Ryder System, Inc. (NYSE: R) since 2012, Nordson Corporation (Nasdaq: NDSN) since 2010.
Qualifications:With over 30 years of global manufacturing experience, Mr. Hilton brings to the Board an intimate understanding of management leadership, strat-egy development and day-to-day operations of a multi-national company, including product line management, new product technology, talent devel-opment, manufacturing, distribution and other sales channels, business processes, international operations and global markets expertise. This experience makes Mr. Hilton a valued member of the Audit Committee and the Nominating and Corporate Governance Committee.
STEPHEN G. HANKS
AGE: 68
Director since 2006
MICHAEL F. HILTON
AGE: 64
Director since 2015
/ 1 5
MENU
L I N C O L N E L E C T R I C : 2 0 1 9 P R O X Y S TA T E M E N T

PROPOSAL 1—ELECTION OF DIRECTORS
DIRECTOR NOMINEES
Recent Business Experience:President of N.A.S.T. Inc. (a personal investment firm), since 1996. Prior to joining N.A.S.T. Inc., Mr. Lincoln served as the Chairman and Chief Executive Officer of Algan, Inc.
Qualifications:As an entrepreneurial businessman with experience, including 25 years running a $50 million business, Mr. Lincoln understands business risk and the importance of hands-on management. As the grandson of James F. Lincoln and as a long-term trustee, Mr. Lincoln provides the Board with his historic perspective on the Company’s unique culture and especially its incentive management system. His leadership role and his investment experience serve Lincoln Electric well as a member of the Audit Committee and Finance Committee.
Recent Business Experience:Chair and Chief Investment Officer of the Lincoln Institute of Land Policy (a leading educational institution teaching land economics and taxation). She has held this position since 1996, and in her role as Chief Investment Officer currently manages and directs all aspects of the Institute’s $550 million endowment. In her role as Chair, she is responsible for all Board development and governance and takes a leadership position in stra-tegic planning. From 1999 through 2006, Ms. Lincoln previously served as President of the Lincoln Foundation, the non-profit foundation that sup-ported the Lincoln Institute until the two entities merged in 2006.
Directorships:Advisory Board Member of the Johnson Bank, Arizona Region since 2006, and Board member of Johnson Bank Arizona, N.A. from 2001 to 2006. Co-Chair of the International Center for Land Policy Studies and Training in Taiwan.
Qualifications:Ms. Lincoln’s leadership experience with the Lincoln Institute, where she plays a crucial role in strategic planning and asset allocation, as well as her extensive experience with the Chautauqua Institution in New York, a major Arizona health care provider, and an international non-profit organization related to land use and policy, make Ms. Lincoln a valuable contributor to a well-rounded Board. Ms. Lincoln serves as a member of the Compensation and Executive Development Committee and as Chair of the Nominating and Corporate Governance Committee. In addition, as a Lincoln family member and long-standing Director of Lincoln Electric, Ms. Lincoln has a keen sense of knowledge about Lincoln Electric, its culture and the found-ing principles.
G. RUSSELL LINCOLN
AGE: 72
Director since 1989
KATHRYN JO LINCOLN
AGE: 64
Director since 1995
MENU
/ 1 6
WILLIAM E. MACDONALD, III
DIRECTOR NOMINEES
Recent Business Experience:Former Vice Chairman of National City Corporation (a diversified financial holding company), a position he held from 2001 until his retirement in 2006, where he was responsible for its seven-state regional and national corporate banking businesses, the Risk Management and Credit Administration unit, Capital Markets and the Private Client Group. Mr. MacDonald joined National City in 1968 and, during his tenure, held a number of key management posi-tions, including Senior Executive Vice President of National City Corporation and President and Chief Executive Officer of National City’s Ohio bank.
Qualifications:Mr. MacDonald brings experience in leading a large corporate organization with over 35,000 employees and structuring complex financing solutions for large and middle-market businesses to the Board and its Compensation and Executive Development Committee (where he is Chair) and Finance Committee. In addition to his expertise in economic issues, Mr. MacDonald appreciates the human resources and development challenges facing a global, publicly-traded company.
Recent Business Experience:Chairman, President and Chief Executive Officer of Lincoln Electric. Mr. Mapes has served as President and Chief Executive Officer since December 31, 2012. On December 21, 2013, Mr. Mapes was appointed as Chairman of the Board in addition to his other responsibilities. From September 2011 to December 31, 2012, Mr. Mapes served as the Chief Operating Officer of Lincoln Electric. From 2004 to August 2011, Mr. Mapes served as an Executive Vice President of A.O. Smith Corporation (a global manufacturer with a water heating and water treatment technologies business, which has residential, commercial, industrial and consumer applications) and the President of its former Electrical Products unit. Prior to joining A.O. Smith, he was the President, Motor Sales and Marketing of Regal Beloit Corporation (a manufacturer of electrical and mechanical motion control products).
Directorships:The Timken Company (NYSE: TKR) since 2014.
Qualifications:As an experienced executive officer of Lincoln Electric as well as other large, global public companies engaged in manufacturing operations for over thirty years, Mr. Mapes understands the manufacturing industry and the challenges of global growth. In addition to his business management experience, Mr. Mapes has an MBA and a law degree.
AGE: 72
Director since 2007
CHRISTOPHER L. MAPES
AGE: 57
Director since 2010
WILLIAM E. MACDONALD, III
MENU
/ 1 7L I N C O L N E L E C T R I C : 2 0 1 9 P R O X Y S TA T E M E N T
PROPOSAL 1—ELECTION OF DIRECTORS
DIRECTOR NOMINEES
Recent Business Experience:Former President of the Europe, Middle East & Africa Sector (EMEA Sector) of Ecolab, Inc. (a leading provider of food safety, public health and infection prevention products and services), a position he held from 2010 until his retirement in 2012. Prior to leading Ecolab’s EMEA Sector, Mr. Mason had responsibility for Ecolab’s Asia Pacific and Latin America businesses as President of Ecolab’s International Sector from 2005 to 2010 and as Senior Vice President, Strategic Planning in 2004.
Directorships:GCP Applied Technologies (NYSE: GCP). GCP Applied Technologies was spun off from W.R. Grace & Co. as of February 3, 2016.
Qualifications:Mr. Mason has over 35 years of international business experience with experience in establishing businesses in China, South Korea, Southeast Asia, Brazil, India, Russia, Africa and the Middle East. Mr. Mason’s execu-tive leadership of an international business sector for a U.S. publicly-held company provides him with extensive international business expertise, including starting, developing and growing businesses abroad in both mature and emerging markets, and in a business-to-business environment, including industrial sectors. Additionally, he brings a strong finance and strategic planning background, including merger and acquisition experi-ence, along with significant experience working with and advising boards on diverse issues confronting companies with international operations. Mr. Mason brings experience in international business to the Finance Committee (where he is Chair) and the Compensation and Executive Development Committee.
Recent Business Experience:Senior Vice President and Chief Technology Officer of Tenneco, Inc. (a manufacturer of automotive emission control and ride control products and systems). Since joining Tenneco in 2011, Mr. Patel has held roles lead-ing regional advanced technology development to establishing a global research and development organization. Prior to joining Tenneco, Mr. Patel held numerous positions with increasing responsibility, including senior scientist, at the General Electric Company during his thirteen-year tenure with the organization.
Qualifications:Mr. Patel has over 20 years of experience serving with publicly-traded, global products and technology companies. Mr. Patel has broad expertise in material science, automation and “smart” systems, as well as extensive research and development experience. Mr. Patel has been a leader in global innovation and research initiatives. This lends tremendous support to our focus on being an innovation leader in our industry and our advanced man-ufacturing growth strategy, which helps customers identify value and effi-ciencies in their welding and cutting operations. Mr. Patel in an important member of the Audit and Nominating and Corporate Governance Committees.
PHILLIP J. MASON
AGE: 68
Director since 2013
BEN P. PATEL
AGE: 51
Director since 2018
MENU
/ 1 8

DIRECTOR NOMINEES
Recent Business Experience:Former President and Chief Executive Officer of the Berwind Group (a diversi-fied pharmaceutical services, industrial manufacturing and real estate com-pany), a position she held in 2001. From 1997 through 2001, Ms. Runtagh was Executive Vice President of Universal Studios (a media and entertainment company). Prior to joining Universal Studios, Ms. Runtagh spent 27 years at General Electric Company (a diversified industrial company) in a variety of leadership positions.
Directorships:Former member of the Board of Directors of Harman International Industries, Inc. from 2008 to 2017, NeuStar, Inc. from 2006 to 2017, IKON Office Solutions Inc., Avaya Inc. and Covad Communications Groups.
Qualifications:Ms. Runtagh has over 30 years of experience in management positions with global companies. Ms. Runtagh’s responsibilities in management have ranged from marketing and sales to finance, as well as engineering and manufacturing. Ms. Runtagh’s diverse management experience, including growing those businesses while maintaining high corporate gov-ernance standards, and her extensive experience as a director of public companies, make her well-positioned for her role as a Director, member of the Compensation and Executive Development Committee and member of the Nominating and Corporate Governance Committee.
HELLENE S. RUNTAGH
AGE: 70
Director since 2001
MENU
/ 1 9L I N C O L N E L E C T R I C : 2 0 1 9 P R O X Y S TA T E M E N T
PROPOSAL 1—ELECTION OF DIRECTORS
CORPORATE GOVERNANCE
Governance Framework
At Lincoln Electric, we are committed to effective corporate governance and high ethical standards. We adhere to
our ethical commitments in every aspect of our business, including our commitments to each other, in the mar-
ketplace and in the global, governmental and political arenas. These commitments are spelled out in our Code of
Corporate Conduct and Ethics, which applies to all of our employees (including our principal executive and senior
financial officers) and Directors.
We encourage you to visit our website where you can find detailed information about our corporate governance
programs/policies including:
• Code of Corporate Conduct and Ethics
• Governance Guidelines
• Charters for our Board Committees
• Director Independence Standards
Corporate Governance Highlights
Board of Directors
• Our Board held five meetings in 2018
• During 2018, each of our Directors attended at least
75% of the total full Board meetings and meetings of
committees on which he or she served during the time
he or she served as a Director
• Size of Board—11
• Plurality vote with director resignation policy for
failures to receive a majority vote in uncontested
director elections
• Combined Chairman and CEO
• Lead Independent Director
• All Directors are expected to attend the Annual
Meeting
Board Composition
• Number of independent Directors—10
• Diverse Board including different backgrounds,
experiences and expertise, as well as balanced mix of
ages and tenure of service
• Several current and former CEOs
• Audit Committee has multiple financial experts
Board Processes
• Independent Directors meet without management
present
• Annual Board and Committee self-assessments
• Board orientation/evaluation program
• Governance Guidelines approved by Board
• Board plays active role in risk oversight
• Full Board review of succession planning
Board Alignment with Shareholders
• Annual equity grants align interests of Directors and
officers with shareholders
• Annual advisory approval of executive compensation
• No poison pill
• Stock ownership requirements for Directors and
officers
Compensation
• No employment agreements
• Executive compensation is tied to performance—85%
of CEO target pay and 78% of all NEO target pay is
performance-based (at risk)
• Anti-hedging and anti-pledging policies for Directors
and officers
• Recoupment/clawback policy
Integrity and Compliance
• Code of Conduct for employees, officers and Directors
• Environmental, health and safety guidelines and goals,
including long-term sustainability goals
• Annual training on ethical behavior
MENU
/ 2 0
Our Board of Directors
Our Board oversees management in the long-term interest of Lincoln Electric and our shareholders. The Board’s
major responsibilities include:
• Overseeing the conduct of our business
• Reviewing and approving key financial objectives,
strategic and operating plans and other significant
actions
• Evaluating CEO and senior management performance
and determining executive compensation
• Planning for CEO succession and monitoring manage-
ment’s succession planning for other key executives
• Establishing an appropriate governance structure,
including appropriate Board composition and succes-
sion planning
• Overseeing enterprise risk management
How We Select Director Nominees
In evaluating Director candidates, including persons nominated by shareholders, the Nominating and Corporate
Governance Committee expects that any candidate must have these minimum qualifications:
• Demonstrated character, integrity and judgment
• High-level managerial experience or experience deal-
ing with complex problems
• Ability to work effectively with others
• Sufficient time to devote to the affairs of Lincoln Electric
• Specialized experience and background that will add
to the depth and breadth of the Board
• Independence as defined by the Nasdaq listing
standards
• Financial literacy
In evaluating candidates to recommend to the Board, including the Director nominees, the Nominating and
Corporate Governance Committee also considers whether the candidate enhances the diversity of the Board. Such
diversity includes professional background and capabilities, knowledge of specific industries and geographic expe-
rience, as well as race, gender and national origin.
Lincoln Electric is also committed to having Director candidates that can provide perspective on the industry
challenges that we face and our long-term commitment to a pay for performance culture.
During 2018, two new directors were elected to the Board in light of two retirements from the Board. In February 2018,
Mr. Ben Patel was elected to the Board and, in July 2018, Mr. Patrick Goris was elected to the Board. In recruiting Messrs.
Patel and Goris, the Nominating and Corporate Governance Committee retained a recognized search firm to help identify
director prospects, perform candidate outreach, assist in reference and background checks and provide other related ser-
vices. In recruiting Mr. Patel, the Korn Ferry search firm was retained and in recruiting Mr. Goris, the Heidrick & Struggles
search firm was retained. The recruiting process typically involves, and for these searches did involve, the search firm,
the CEO or a member of the Nominating and Corporate Governance Committee (usually, the Chair) contacting the pro-
spective director to gauge his or her interest and availability. The candidate will then meet with several members of the
Board, including our Lead Director. At the same time, the search firm will contact references for the prospect. A back-
ground check is completed before a final recommendation is made to the Board to appoint a candidate to the Board.
In identifying Mr. Patel, the Board targeted senior executives who had experience in managing global businesses
where the ability to drive collaborative technologies to various markets and global customers is a critical portion
of the strategy. Experience in leadership and management of technologies, whether through exposure to automa-
tion capabilities, “internet of things” (IoT), internet-based marketing or data analytics, was a key focus for the
search. Mr. Patel’s technology-based experience at a global, publicly-traded company was determined to be a good
fit for the Board and he was elected to the Board on February 21, 2018.
In identifying Mr. Goris, the Board targeted senior executives who had experience in managing the finance function
in a large, global business. As the Chief Financial Officer of a publicly-traded company and with his extensive
finance and accounting experience, Mr. Goris is considered an “audit committee financial expert.” In addition,
Mr. Goris’ position as a senior executive at a global industrial automation and information solutions company pro-
vides him with broad exposure to digital operations and “smart” manufacturing solutions using data and analytics
that enhance operational intelligence, productivity and risk management in manufacturing processes. These are
key initiatives in our long-term strategic objectives. Accordingly, Mr. Goris was elected to the Board on July 19, 2018.
Shareholders may nominate one or more persons for election as Director of Lincoln Electric. The process for doing
so is set forth in the FAQs section of this Proxy Statement.
MENU
/ 2 1L I N C O L N E L E C T R I C : 2 0 1 9 P R O X Y S TA T E M E N T

PROPOSAL 1—ELECTION OF DIRECTORS
Director Independence
Each of our non-employee Directors meets the independence standards set forth in the Nasdaq listing standards,
which are reflected in our Director Independence Standards. To be considered independent, the Nominating and
Corporate Governance Committee must affirmatively determine that the director has no material relationship
with Lincoln Electric.
During 2018, the independent Directors met in regularly scheduled Executive Sessions in conjunction with each
of the Board meetings. The Lead Director presided over these sessions.
Board Leadership
Our Chairman, President and CEO is responsible for planning, formulating and coordinating the development
and execution of our corporate strategy, policies, goals and objectives. He is accountable for Lincoln Electric’s
performance and:
• reports directly to our Board;
• works closely with our management to develop our
strategic plan;
• works with our management on transactional matters
by networking with strategic relationships;
• promotes and monitors the Board’s fulfillment of its
oversight and governance responsibilities;
• encourages the Board to set and implement our goals
and strategies;
• establishes procedures to govern our Board’s work;
• oversees the execution of the financial and other deci-
sions of our Board;
• makes available to all members of our Board opportu-
nities to acquire sufficient knowledge and under-
standing of our business to enable them to make
informed judgments;
• presides over meetings of our shareholders; and
• sets the agenda for, and presides over, Board meetings.
Mr. Mapes, our President and CEO, serves as Chairman in addition to his other responsibilities. Our Board
believes having one individual serve as Chairman and CEO is beneficial to us because the dual role enhances
Mr. Mapes’ ability to provide direction and insight on strategic initiatives impacting us and our shareholders. The
Board also believes the dual role is consistent with good corporate governance practices because it is
complemented by a Lead Director.
Lead Director
Our Lead Director is appointed each year by the independent Directors and serves as a liaison between the
Chairman of the Board and the independent Directors. The Lead Director collaborates with the Chairman, the
Secretary and senior management on the format and adequacy of the information that Directors receive and on
the effectiveness of the Board meeting process. The Lead Director acts independently of the Chairman to review
and approve Board meeting agendas and schedules. The Lead Director also acts as a sounding board to the
Chairman of the Board on key aspects of the business, and assists in promoting sound corporate governance
practices. In addition, the Lead Director may call meetings of the independent Directors as he or she sees fit and
presides over such meetings. During 2018, the independent Directors met in conjunction with each of the Board
meetings. The Lead Director may also speak on behalf of Lincoln Electric, as the Board determines necessary.
Mr. Curtis Espeland currently serves as our Lead Director, a position he has held since the 2018 Annual Meeting.
Board Role in Enterprise Risk Management
In the ordinary course of business, we face various strategic, operating and compliance risks. Our enterprise risk
management process seeks to identify and address risks to the organization. Our Board oversees the management
of these risks on an enterprise-wide basis, and the Lead Director promotes our Board’s engagement in this pro-
cess. A fundamental part of the process is to understand the Company’s risks, and to provide oversight as to how
management is addressing these risks. The full Board reviews with management its process for enterprise risk
management. In addition, the Audit Committee is charged with overseeing the Company’s risk assessment and
management process each year, including ensuring that management has instituted processes to identify critical
risks and has developed plans to manage such risks.
MENU
/ 2 2
The Company maintains a risk management review process where risk is assessed throughout our entire organi-
zation, and is reported to a corporate risk committee comprised of members of our various business units and
control functions. Each year, the committee identifies critical risks to the organization and those that are deter-
mined to be “high priority” risks are reported to the executive management committee and the Audit Committee.
Thereafter, “high priority” risks are assigned, as appropriate, to various Board Committees, or to the Board as a
whole, for further review, analysis and development of appropriate plans for management and mitigation. The
Board also has broad oversight with respect to the Company’s strategic planning process, including reviewing the
steps taken to develop strategic plans and approving the final plans.
COMPENSATION-RELATED RISK
We regularly assess risks related to our compensation and benefit programs, including our executive compensation
programs, and our Compensation and Executive Development Committee is actively involved in those assessments.
In addition, Willis Towers Watson, a compensation consultant engaged by management, has provided a risk assess-
ment of our executive compensation programs in the past. Although we have a long history of pay for performance
and incentive-based compensation, we believe our compensation programs contain many mitigating factors to
ensure that our employees are not encouraged to take unnecessary risks.
As a result of all these efforts, we do not believe the risks arising from our executive compensation policies and
practices are reasonably likely to have a material adverse effect on Lincoln Electric.
RELATED PARTY TRANSACTIONS
Any related party transactions concerning Lincoln Electric and any of its Directors, officers or other employees (or
any of their immediate family members) are to be disclosed to and approved by the Chief Compliance Officer and
the Audit Committee. We define “related party transactions” generally as transactions in which the self-interest of
the employee, officer or Director may be at odds or conflict with the interests of Lincoln Electric, such as doing
business with entities that are or may be controlled or significantly influenced by such persons or their immediate
family members. Our related party transaction policies can be found in our Code of Corporate Conduct and Ethics,
as well as the Audit Committee Charter, both of which are available on our website at www.lincolnelectric.com in
the Investor Relations section.
In February 2019, the Audit Committee considered and approved a related party transaction involving P&R
Specialty, Inc., a supplier to Lincoln Electric. Greg D. Blankenship, the brother of George D. Blankenship, is the sole
stockholder and President of P&R Specialty, Inc. During 2018, we purchased approximately $2.5 million worth of
products from P&R Specialty in ordinary course of business transactions. George D. Blankenship has no ownership
interest in or any involvement with P&R Specialty. We believe that the transactions with P&R Specialty were, and
are, on terms no less favorable to us than those that could have been obtained from unaffiliated parties.
OUR BOARD COMMITTEES
We have separately designated standing Audit, Compensation and Executive Development, and Nominating and
Corporate Governance Committees established in accordance with applicable provisions of the Securities
Exchange Act of 1934 (the “Exchange Act”) and Securities and Exchange Commission (“SEC”) and Nasdaq rules.
The Board also has designated a standing Finance Committee. The number of meetings held by each committee
during 2018 is set forth below.
Audit
Compensation &
Executive
Development
Nominating &
Corporate
Governance Finance
Number of Committee Meetings 6 6 5 5
MENU
/ 2 3L I N C O L N E L E C T R I C : 2 0 1 9 P R O X Y S TA T E M E N T

PROPOSAL 1—ELECTION OF DIRECTORS
The following summaries set forth the principal responsibilities of each of the Board’s separately designated
standing committees, as well as other information regarding their makeup and operations. A copy of each
committee’s charter may be found on our website at www.lincolnelectric.com.
Audit Committee
Members
Messrs. Hanks (Chair),
Espeland, Goris, Hilton, Lincoln and Patel
• Appoints and determines whether to retain or
terminate the independent auditors
• Approves all audit engagement fees, terms and
services
• Approves any non-audit engagements with the
independent auditors
• Reviews and discusses the independent auditors’
quality control
• Reviews and discusses the independence of the
auditors, the audit plan, the conduct of the audit and
the results of the audit
• Reviews and discusses with management Lincoln
Electric’s financial statements and disclosures, its
interim financial reports and its earnings press releases
• Reviews with our General Counsel legal matters that
might have a significant impact on our financial
statements
• Oversees compliance with our Code of Corporate
Conduct and Ethics, including annual reports from
compliance officers
• Reviews with management the appointment,
replacement, reassignment or dismissal of the Senior
Vice President, Internal Audit, the internal audit
charter, internal audit plans and reports
• Reviews with management the adequacy of internal
control over financial reporting
• Oversees risk assessment and risk management
Each of the members of our Audit Committee meets the independence standards set forth in the Nasdaq listing
standards and have likewise been determined by the Board to have the financial competency required by the
listing standards. In addition, because of the professional training and past employment experience of Messrs.
Hanks, Espeland, Goris and Hilton, the Board has determined that they are financially sophisticated Audit
Committee Members under the Nasdaq listing standards and qualify as “audit committee financial experts” in
accordance with SEC rules. Shareholders should understand that the designation of Messrs. Hanks, Espeland,
Goris and Hilton as “audit committee financial experts” is a disclosure requirement and that it does not impose
upon them any duties, obligations or liabilities that are greater than those generally imposed on them as
members of the Audit Committee and the Board.
MENU
/ 2 4
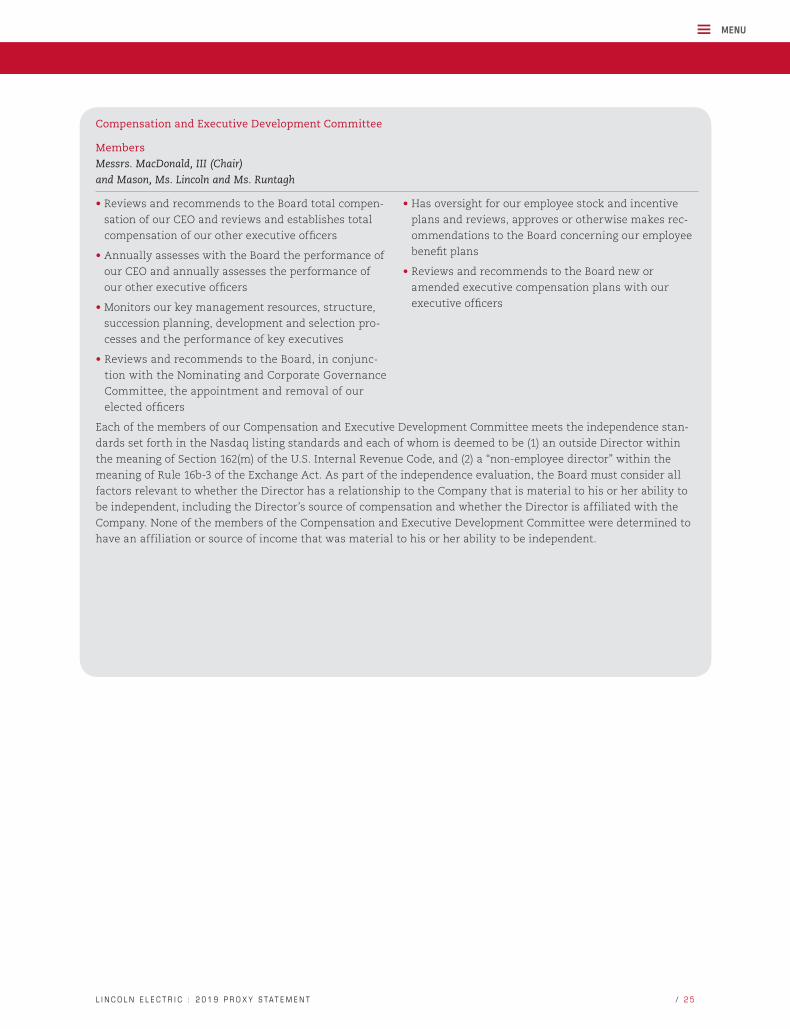
Compensation and Executive Development Committee
Members
Messrs. MacDonald, III (Chair)
and Mason, Ms. Lincoln and Ms. Runtagh
• Reviews and recommends to the Board total compen-
sation of our CEO and reviews and establishes total
compensation of our other executive officers
• Annually assesses with the Board the performance of
our CEO and annually assesses the performance of
our other executive officers
• Monitors our key management resources, structure,
succession planning, development and selection pro-
cesses and the performance of key executives
• Reviews and recommends to the Board, in conjunc-
tion with the Nominating and Corporate Governance
Committee, the appointment and removal of our
elected officers
• Has oversight for our employee stock and incentive
plans and reviews, approves or otherwise makes rec-
ommendations to the Board concerning our employee
benefit plans
• Reviews and recommends to the Board new or
amended executive compensation plans with our
executive officers
Each of the members of our Compensation and Executive Development Committee meets the independence stan-
dards set forth in the Nasdaq listing standards and each of whom is deemed to be (1) an outside Director within
the meaning of Section 162(m) of the U.S. Internal Revenue Code, and (2) a “non-employee director” within the
meaning of Rule 16b-3 of the Exchange Act. As part of the independence evaluation, the Board must consider all
factors relevant to whether the Director has a relationship to the Company that is material to his or her ability to
be independent, including the Director’s source of compensation and whether the Director is affiliated with the
Company. None of the members of the Compensation and Executive Development Committee were determined to
have an affiliation or source of income that was material to his or her ability to be independent.
MENU
/ 2 5L I N C O L N E L E C T R I C : 2 0 1 9 P R O X Y S TA T E M E N T
PROPOSAL 1—ELECTION OF DIRECTORS
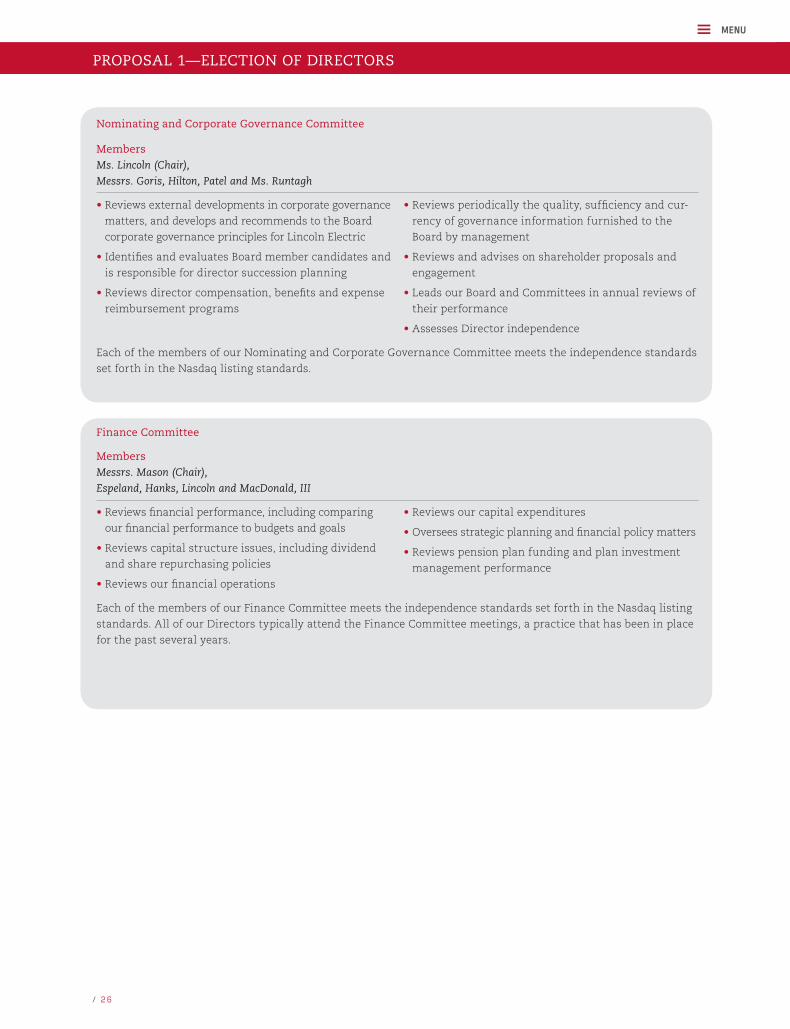
Nominating and Corporate Governance Committee
Members
Ms. Lincoln (Chair),
Messrs. Goris, Hilton, Patel and Ms. Runtagh
• Reviews external developments in corporate governance
matters, and develops and recommends to the Board
corporate governance principles for Lincoln Electric
• Identifies and evaluates Board member candidates and
is responsible for director succession planning
• Reviews director compensation, benefits and expense
reimbursement programs
• Reviews periodically the quality, sufficiency and cur-
rency of governance information furnished to the
Board by management
• Reviews and advises on shareholder proposals and
engagement
• Leads our Board and Committees in annual reviews of
their performance
• Assesses Director independence
Each of the members of our Nominating and Corporate Governance Committee meets the independence standards
set forth in the Nasdaq listing standards.
Finance Committee
Members
Messrs. Mason (Chair),
Espeland, Hanks, Lincoln and MacDonald, III
• Reviews financial performance, including comparing
our financial performance to budgets and goals
• Reviews capital structure issues, including dividend
and share repurchasing policies
• Reviews our financial operations
• Reviews our capital expenditures
• Oversees strategic planning and financial policy matters
• Reviews pension plan funding and plan investment
management performance
Each of the members of our Finance Committee meets the independence standards set forth in the Nasdaq listing
standards. All of our Directors typically attend the Finance Committee meetings, a practice that has been in place
for the past several years.
MENU
/ 2 6
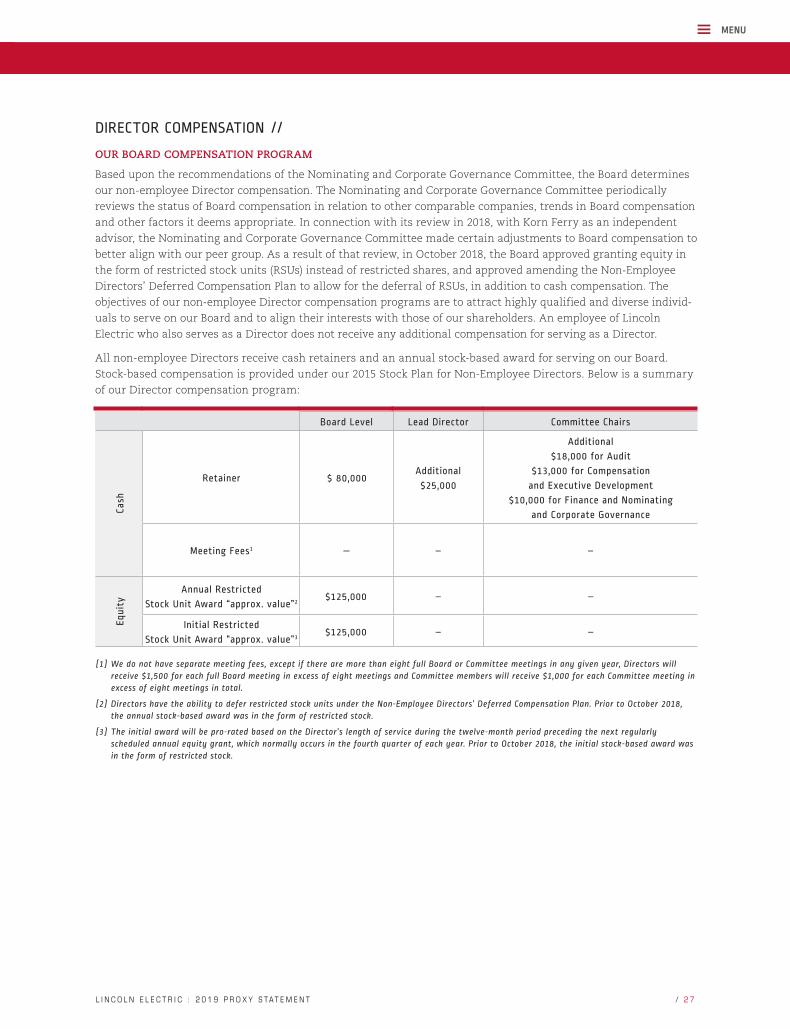
DIRECTOR COMPENSATION //
OUR BOARD COMPENSATION PROGRAM
Based upon the recommendations of the Nominating and Corporate Governance Committee, the Board determines
our non-employee Director compensation. The Nominating and Corporate Governance Committee periodically
reviews the status of Board compensation in relation to other comparable companies, trends in Board compensation
and other factors it deems appropriate. In connection with its review in 2018, with Korn Ferry as an independent
advisor, the Nominating and Corporate Governance Committee made certain adjustments to Board compensation to
better align with our peer group. As a result of that review, in October 2018, the Board approved granting equity in
the form of restricted stock units (RSUs) instead of restricted shares, and approved amending the Non-Employee
Directors’ Deferred Compensation Plan to allow for the deferral of RSUs, in addition to cash compensation. The
objectives of our non-employee Director compensation programs are to attract highly qualified and diverse individ-
uals to serve on our Board and to align their interests with those of our shareholders. An employee of Lincoln
Electric who also serves as a Director does not receive any additional compensation for serving as a Director.
All non-employee Directors receive cash retainers and an annual stock-based award for serving on our Board.
Stock-based compensation is provided under our 2015 Stock Plan for Non-Employee Directors. Below is a summary
of our Director compensation program:
Board Level Lead Director Committee Chairs
Cash
Retainer $ 80,000Additional
$25,000
Additional
$18,000 for Audit
$13,000 for Compensation
and Executive Development
$10,000 for Finance and Nominating
and Corporate Governance
Meeting Fees1 — – –
Equi
ty
Annual Restricted
Stock Unit Award “approx. value”2 $125,000 – –
Initial Restricted
Stock Unit Award “approx. value”3 $125,000 – –
(1) We do not have separate meeting fees, except if there are more than eight full Board or Committee meetings in any given year, Directors will receive $1,500 for each full Board meeting in excess of eight meetings and Committee members will receive $1,000 for each Committee meeting in excess of eight meetings in total.
(2) Directors have the ability to defer restricted stock units under the Non-Employee Directors’ Deferred Compensation Plan. Prior to October 2018, the annual stock-based award was in the form of restricted stock.
(3) The initial award will be pro-rated based on the Director’s length of service during the twelve-month period preceding the next regularly scheduled annual equity grant, which normally occurs in the fourth quarter of each year. Prior to October 2018, the initial stock-based award was in the form of restricted stock.
MENU
/ 2 7L I N C O L N E L E C T R I C : 2 0 1 9 P R O X Y S TA T E M E N T

PROPOSAL 1—ELECTION OF DIRECTORS
Director Compensation Table
Director
Fees Earned or
Paid in Cash
Stock
Awards1
All Other
Compensation Total
Curtis E. Espeland2 $ 115,5144 $124,948 — $240,462
Patrick P. Goris3 36,0874 175,270 — 211,357
David H. Gunning3 31,731 — — 31,731
Stephen G. Hanks2 92,000 124,948 — 216,948
Michael Hilton 80,000 124,948 — 204,948
G. Russell Lincoln 80,000 124,948 — 204,948
Kathryn Jo Lincoln 90,0004 124,948 — 214,948
William E. MacDonald, III 93,000 124,948 — 217,948
Phillip J. Mason2 82,500 124,948 — 207,448
Ben P. Patel3 68,667 225,897 — 294,564
Hellene S. Runtagh 80,000 124,948 — 204,948
George H. Walls, Jr.3 24,1764 — — 24,176
(1) On December 13, 2018, 1,542 restricted stock units were granted to each non-employee Director under our 2015 Stock Plan for Non-Employee
Directors. For Mr. Goris, 549 shares of restricted stock were also granted to him in July 2018 upon his initial election to the Board. For Mr. Patel,
1,113 shares of restricted stock were also granted to him in February 2018 upon his initial election to the Board.
The Stock Awards column represents the grant date fair value under Accounting Standards Codification (ASC) Topic No. 718 based on a closing price of $81.03 per share on December 13, 2018, and, with respect to the awards granted to Mr. Goris and Mr. Patel, a closing price of $91.66 per share on July 19, 2018 and $90.70 per share on February 21, 2018, respectively. Assumptions used in the calculation of these amounts are included in footnote 10 to our audited financial statements for the fiscal year ended December 31, 2018 included in our Annual Report on Form 10-K filed with the SEC on February 27, 2019.
As of December 31, 2018, the aggregate number of shares of restricted stock held by each non-employee Director was 1,347 shares, except for Mr. Goris, who held 549 shares of restricted stock and Mr. Patel, who held 1,113 shares of restricted stock. As of December 31, 2018, the aggregate number of restricted stock units held by each non-employee Director was 1,542.
(2) Mr. Espeland was appointed Lead Director on April 19, 2018, following Mr. Gunning’s retirement from the Board. Due to Committee Chair rotations in July 2018, the Audit Committee Chair retainer amounts are prorated for Messrs. Espeland and Hanks, and the Finance Committee Chair retainer amounts are prorated for Messrs. Hanks and Mason.
(3) Messrs. Gunning and Walls resigned from the Board on April 19, 2018, the date of our 2018 Annual Meeting in accordance with our Governance Guidelines due to each attaining the age of 75 prior to such meeting. Mr. Patel was elected to the Board on February 21, 2018 and Mr. Goris was elected to the Board on July 19, 2018.
(4) All of Messrs. Espeland’s and Walls’ and Ms. Lincoln’s Board fees were deferred, as well as $20,000 of Mr. Goris’ Board fees were deferred, under our Non-Employee Directors’ Deferred Compensation Plan.
Other Arrangements
We reimburse Directors for reasonable out-of-pocket expenses incurred in connection with attendance at Board
meetings, or when traveling in connection with the performance of their services for Lincoln Electric.
Continuing Education
Directors are reimbursed ($5,000 is used as a guideline) for continuing education expenses (inclusive of travel
expenses) for programs each Director may elect to attend.
MENU
/ 2 8

Stock Ownership Guidelines
In keeping with the philosophy that Directors’ interests should be aligned with the shareholders’ and as part of the
Board’s continued focus on corporate governance, all of our non-employee Directors must adhere to our stock
ownership guidelines. Restricted stock awards and restricted stock unit awards count toward the stock ownership
guidelines; common shares underlying stock options and shares held in another person’s name (including a
relative) do not. The stock ownership guidelines can be met by satisfying one of the two thresholds noted in the
chart below. As of December 31, 2018, all of our non-employee Directors had satisfied the stock ownership
guidelines, with the exception of Mr. Goris and Mr. Patel due to their recent election to the Board in 2018. Directors
have five years from the date of election to the Board to satisfy the stock ownership guidelines. The Nominating
and Corporate Governance Committee reviews the guidelines at least every two-and-a-half years to ensure that
the components and values are appropriate—a review was conducted during 2017, with the assistance of Korn
Ferry as an independent advisor, and it was determined that the guidelines should be adjusted to better align with
our peer group. The next review is anticipated to occur in 2019.
Retainer Multiple Number of Shares
Shares valued at 5x annual Board retainer ($400,000) OR 4,368*
* Represents shares equal to $400,000 based on the closing price of Lincoln Electric stock as of December 29, 2017 (the last trading day of the calendar year) of $91.58.
Equity Awards
The 2015 Stock Plan for Non-Employee Directors is the vehicle for the annual and initial grants of stock-based
awards.
Under the terms of the awards, shares of restricted stock and restricted stock unit awards vest in full one year after
the date of grant, with accelerated vesting in the event of a change in control of Lincoln Electric if the Director’s
service is terminated or if the award is not assumed upon the change in control, or upon the death or disability of
the Director. Shares of restricted stock also provide for accelerated vesting of a pro-rata portion of the award upon
retirement based on the Director’s length of service during the 1-year term. During the period in which the shares
of restricted stock remain forfeitable, dividends are paid to the Directors in cash. During the period in which
restricted stock units remain unvested, dividend equivalents accrue and will pay out in cash upon vesting of the
underlying award.
Deferred Compensation Plan
Adopted in 1995, the Non-Employee Directors’ Deferred Compensation Plan allows the non-employee Directors to
defer payment of all or a portion of their annual cash compensation. Amended in 2018, the plan also allows
non-employee Directors to defer restricted stock units granted to them. This plan allows each participating
non-employee Director to elect to begin payment of the deferred amounts as of the earlier of termination of ser-
vices as a Director, death or a date not less than one full calendar year after the year the fees are initially deferred.
The investment elections available under the plan for cash compensation deferred are the same as those available
to executives under our Top Hat Plan, which is discussed below in the narrative under 2018 Deferred Compensation
Benefits. RSU deferrals are invested solely in a Lincoln Electric Stock fund, and no other plan deferrals are eligible
for investment into that fund.
MENU
/ 2 9L I N C O L N E L E C T R I C : 2 0 1 9 P R O X Y S TA T E M E N T
Our long-term strategy is focused on key actions and initiatives that generate long-term profitable growth within
our targeted markets through value-added solutions and operational excellence. We believe this approach engages
our business team in creating a long-term value proposition for shareholders that generates above-market returns
through an economic cycle while maintaining a short-term focus on improving profitability and driving operating
excellence. More information on our business and strategy can be found in the “Business Overview” section at the
beginning of this Proxy Statement.
The Compensation Discussion and Analysis (CD&A) describes our executive compensation programs and how they
apply to our NEOs.
2018 Named Executive Officers (NEOs)
Name Title
Christopher L. Mapes Chairman, President and Chief Executive Officer
Vincent K. Petrella Executive Vice President, Chief Financial Officer and Treasurer
George D. Blankenship Executive Vice President, President, Americas Welding
Steven B. Hedlund Executive Vice President, President, International Welding
Jennifer I. Ansberry Executive Vice President, General Counsel and Secretary
The CD&A contains statements regarding future performance targets and goals. These targets and goals are dis-
closed in the context of our compensation programs and should not be understood to be statements of manage-
ment’s expectations or estimates of results or other guidance. We caution investors not to apply these statements
in other contexts.
Executive Compensation Table of Contents
Compensation Discussion and Analysis Executive Compensation Tables
Executive Summary p. 31 Summary of 2018 Compensation Elements p. 52
Our Compensation Philosophy p. 37 2018 Summary Compensation Table p. 53
Elements of Executive Compensation p. 40 2018 Grants of Plan-Based Awards p. 56
Other Arrangements, Policies and Practices p. 48 Holdings of Equity-Related Interests p. 57
2018 Pension Benefits p. 59
2018 Deferred Compensation Benefits p. 60
Termination and Change in Control Arrangements p. 62
EXECUTIVE COMPENSATION
MENU
/ 3 0
EXECUTIVE COMPENSATION //
COMPENSATION DISCUSSION AND ANALYSIS
Executive Summary
Our approach to executive compensation is generally the same as our approach to employee-wide compensation,
with a strong belief in pay for performance and a long-standing commitment to incentive-based compensation.
While maintaining our performance-driven culture, our executive compensation program is designed to achieve
the following objectives:
• Incentivize our executives to deliver above-market
financial results;
• Align management interests with the long-term
interests of our shareholders;
• Define performance drivers which support key
financial and strategic business objectives;
• Address specific business challenges; and
• Maintain good governance practices in the design
and operation of our executive compensation pro-
grams, including consideration of the risks associ-
ated with those practices.
OVERVIEW
• We maintain a performance-driven culture, with
pay for performance compensation programs
• 85% of CEO target pay was “at risk” and, on aver-
age, 78% of all NEO target pay was “at risk”
• Of the shareholders who voted on “say-on-pay,”
98% voted for the compensation of our NEOs at
last year’s Annual Meeting
• Mindful of our shareholders’ strong support, we
have retained our general approach and emphasis on incentive compensation
Key Financial Performance
We have a strong track record of delivering increased value to our shareholders and we have typically deliv-
ered above-market performance across various financial metrics over many economic cycles. Our long-term
strategy seeks to achieve profitable sales growth both organically and through acquisitions by emphasizing
value-added solutions and differentiated technologies to our mix. We anticipate this strategy will yield
improved profit margins and returns, and will generate best-in-class financial performance measured against
our peer group.
In 2018, sales increased approximately 15% to $3.0 billion from 6.7% organic growth and 9% primarily from our
acquisition of Air Liquide Welding, which substantially increased our European business. Our strategic emphasis
on improving our mix, mitigating inflation, achieving operational excellence and maintaining diligent cost man-
agement resulted in operating income growth, double-digit percent earnings per share growth, strong operating
working capital and cash flows and a solid return on invested capital. Highlights include:
• Reported operating income margin was 12.4%.
Excluding special items, Adjusted operating income
margin was 13.4% reflecting strong organic sales
growth, including effective price management to miti-
gate inflation;
• Cash flow from operations of $329 million;
• Average operating working capital (AOWC) to net sales
ratio of 16.5%;
• ROIC of 20.7%; and
• Cash returned to shareholders of $304 million—
through an 11.4% increase in the dividend payout rate
and $202 million in share repurchases.
2018 Diluted earnings per common share (EPS) was $4.37, including special item after-tax net charges of $0.45 per
diluted share. On an adjusted basis, 2018 EPS increased 27.2% to $4.82, as compared with $3.79 in 2017.
MENU
/ 3 1L I N C O L N E L E C T R I C : 2 0 1 9 P R O X Y S TA T E M E N T

We continued to pursue the development of innovative solutions and acquisitions. In 2018, we increased R&D
spend by 13%, which represents approximately 1.8% of revenue. Our investments in innovation generated a sales
vitality index from new products launched in the last five years of 34%, and we achieved a 52% vitality index in
equipment systems. The vitality index represents the percent of sales from new products launched in the last five
years, excluding the International Welding Segment.
Financial Measures Used For Compensation Purposes
We consider various types of widely reported financial metrics, each of which is related to our executive compensa-
tion programs in some way. Some of these financial metrics directly impact our executive compensation programs,
while others are the closest approximation to the metrics that we use in our programs. We believe that all of these
financial metrics are critical to the short-term and long-term growth and performance of our organization.
Short-term financial metrics used to evaluate operational performance and used in our annual bonus design are:
• Adjusted earnings before interest, taxes and bonus
(EBITB), and
• Average operating working capital to net sales ratio
(AOWC/Sales) for compensation purposes.
The following charts illustrate our performance in these or comparable metrics.
Financial metrics considered in long-term compensation programs include:
• Growth of Adjusted Net Income for Compensation
Purposes (over a three-year cycle),
• Three-year average ROIC for Compensation Purposes
indexed to peer performance, and
• Share price appreciation, including dividends (TSR),
versus various indices over a three-year period.
(1) Excluding special items where applicable. Definitions and a reconciliation of non-GAAP results to our most closely comparable GAAP results are included in Appendix A.
(2) See Appendix A for definitions of AOWC/Sales for Compensation Purposes.
‘14
$418
$372
$318
$353
$405
‘15 ‘16 ‘17 ‘18
22.9
%
‘14
21.9
%
‘15
21.2
%
‘1619
.8%
‘17
21.7
%
‘18
Adjusted Operating Income1
Representative of EBITB ($ in millions)
AOWC/Sales for CompensationPurposes2
0
85
170
255
340
425
0
6
12
18
24
EXECUTIVE COMPENSATION
MENU
/ 3 2

The following tables illustrate Lincoln Electric’s Adjusted Net Income for Compensation Purposes, ROIC for
Compensation Purposes and TSR performance. ROIC for Compensation Purposes and TSR results are compared to
our peer group, S&P 400 Midcap Index (in which we participate), S&P 400 Midcap Manufacturing Index and the S&P
500 Index. The ROIC for Compensation Purposes and TSR percentile rankings show the position of our financial
results compared to the particular group, with a 50th percentile ranking indicating median (or market) perfor-
mance. Percentiles below 50 indicate below-market performance, while percentiles above 50 indicate above-market
performance. Information is based on the most recently available public information (as accumulated by an inde-
pendent third party), as of January 2019 when the analysis was performed.
(1) Excludes certain items as approved by the Compensation and Executive Development Committee where applicable. See discussion and definitions on page 45 in the “Long-Term Incentive Plan (LTIP)” section in Performance Measures and in Appendix A.
(2) As of September 30, 2018.
‘14
LincolnElectric
Peers
77th 84th 82nd
Peers PeersS&P Midcap400
S&P Midcap400
S&P Midcap400
S&P 500S&P Midcap 400 Mfg
S&P Midcap 400 Mfg
S&P Midcap 400 Mfg
‘15 ‘16 ‘17 ‘18 ‘14 ‘15 ‘16 ‘17 ‘18
$302
$256
$218
$248
19.8
%
14.9
%
10.2
%
6.9%
8.5%
77th
77th
73rd
74th
15.7
%
16.0
%
15.1
%
18.1
%
$311
3 Year Performance
’18 v. ’15 21.7%
Adjusted Net Income for Compensation Purposes1
($ in millions)
Return on Invested Capital for Compensation Purposes1
3-Year Average ROIC for Compensation Purposes1,2 Performance and Percentile Rank
to Peers and Select Indices
3-Year (2016-2018) TSR Performance Percentile Rank to Peers and Select Indices1
3-Year (2016–2018) Average ROIC1,2 Performance Percentile Rank to Peers and Select Indices
MENU
/ 3 3L I N C O L N E L E C T R I C : 2 0 1 9 P R O X Y S TA T E M E N T
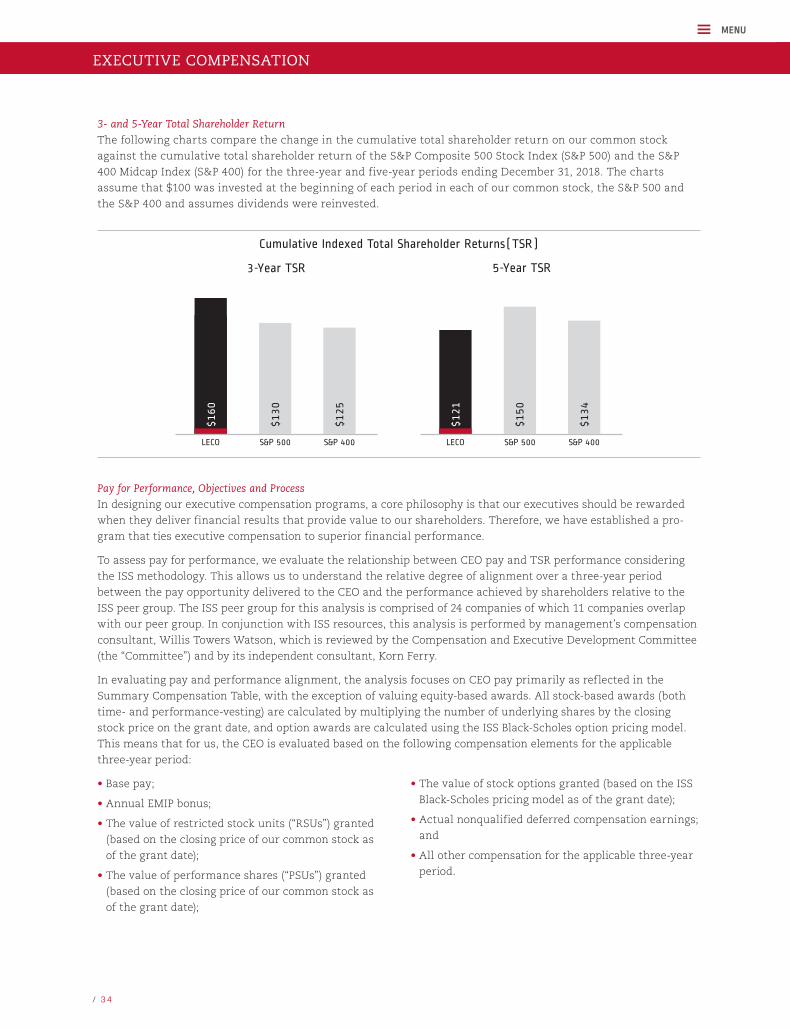
EXECUTIVE COMPENSATION
3- and 5-Year Total Shareholder Return
The following charts compare the change in the cumulative total shareholder return on our common stock
against the cumulative total shareholder return of the S&P Composite 500 Stock Index (S&P 500) and the S&P
400 Midcap Index (S&P 400) for the three-year and five-year periods ending December 31, 2018. The charts
assume that $100 was invested at the beginning of each period in each of our common stock, the S&P 500 and
the S&P 400 and assumes dividends were reinvested.
Pay for Performance, Objectives and Process
In designing our executive compensation programs, a core philosophy is that our executives should be rewarded
when they deliver financial results that provide value to our shareholders. Therefore, we have established a pro-
gram that ties executive compensation to superior financial performance.
To assess pay for performance, we evaluate the relationship between CEO pay and TSR performance considering
the ISS methodology. This allows us to understand the relative degree of alignment over a three-year period
between the pay opportunity delivered to the CEO and the performance achieved by shareholders relative to the
ISS peer group. The ISS peer group for this analysis is comprised of 24 companies of which 11 companies overlap
with our peer group. In conjunction with ISS resources, this analysis is performed by management’s compensation
consultant, Willis Towers Watson, which is reviewed by the Compensation and Executive Development Committee
(the “Committee”) and by its independent consultant, Korn Ferry.
In evaluating pay and performance alignment, the analysis focuses on CEO pay primarily as reflected in the
Summary Compensation Table, with the exception of valuing equity-based awards. All stock-based awards (both
time- and performance-vesting) are calculated by multiplying the number of underlying shares by the closing
stock price on the grant date, and option awards are calculated using the ISS Black-Scholes option pricing model.
This means that for us, the CEO is evaluated based on the following compensation elements for the applicable
three-year period:
• Base pay;
• Annual EMIP bonus;
• The value of restricted stock units (“RSUs”) granted
(based on the closing price of our common stock as
of the grant date);
• The value of performance shares (“PSUs”) granted
(based on the closing price of our common stock as
of the grant date);
• The value of stock options granted (based on the ISS
Black-Scholes pricing model as of the grant date);
• Actual nonqualified deferred compensation earnings;
and
• All other compensation for the applicable three-year
period.
Cumulative Indexed Total Shareholder Returns(TSR)
3-Year TSR 5-Year TSR
LECO S&P 400S&P 500 LECO S&P 400S&P 500
$160
$130
$125
$121
$150
$134
MENU
/ 3 4
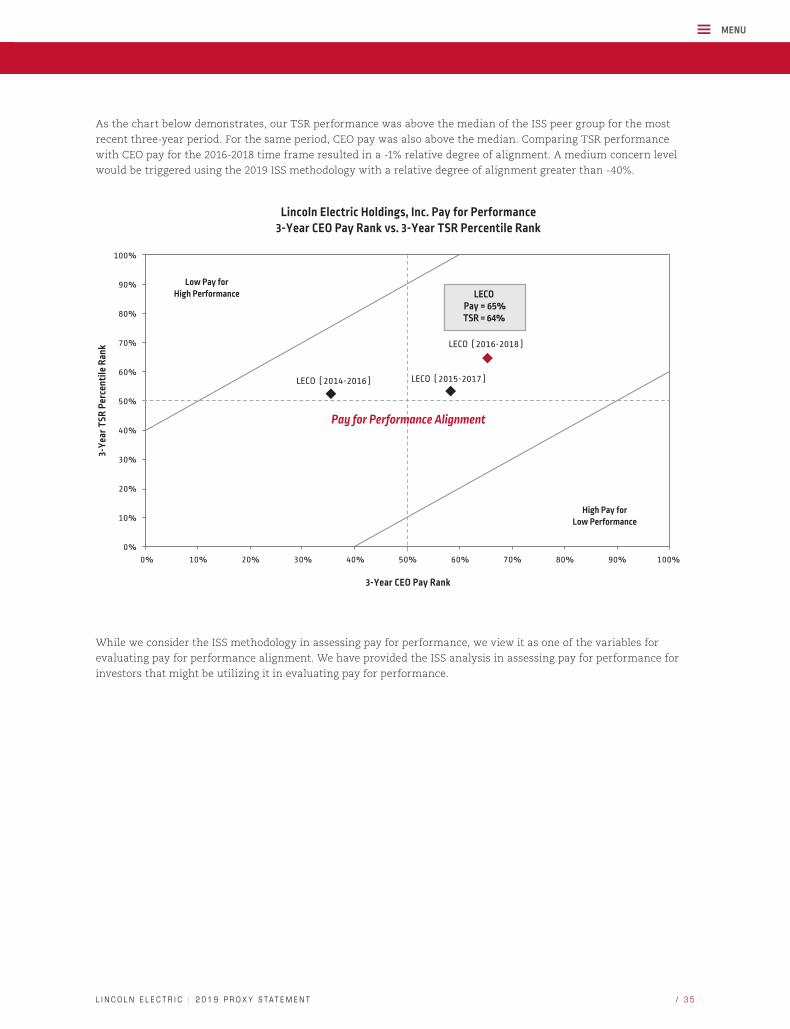
As the chart below demonstrates, our TSR performance was above the median of the ISS peer group for the most
recent three-year period. For the same period, CEO pay was also above the median. Comparing TSR performance
with CEO pay for the 2016-2018 time frame resulted in a -1% relative degree of alignment. A medium concern level
would be triggered using the 2019 ISS methodology with a relative degree of alignment greater than -40%.
While we consider the ISS methodology in assessing pay for performance, we view it as one of the variables for
evaluating pay for performance alignment. We have provided the ISS analysis in assessing pay for performance for
investors that might be utilizing it in evaluating pay for performance.
LECO (2014-2016) LECO (2015-2017)
LECO (2016-2018)
3-Ye
ar T
SR P
erce
ntile
Ran
k
3-Year CEO Pay Rank
Lincoln Electric Holdings, Inc. Pay for Performance3-Year CEO Pay Rank vs. 3-Year TSR Percentile Rank
Low Pay forHigh Performance
High Pay forLow Performance
LECOPay = 65%TSR = 64%
0%0%
10%
20%
30%
40%
50%
60%
70%
80%
90%
100%
10% 20% 30% 40% 50% 60% 70% 80% 90% 100%
Pay for Performance Alignment
MENU
/ 3 5L I N C O L N E L E C T R I C : 2 0 1 9 P R O X Y S TA T E M E N T

EXECUTIVE COMPENSATION
2018 Executive Compensation Actions
During 2018, the Committee reviewed the design of our executive compensation programs to ensure consistency
with our pay for performance philosophy. The Committee has taken a number of actions over the last few years to
better align executive compensation to value drivers in line with our financial performance and shareholder inter-
ests. In 2018, the overall design of our executive compensation program was held consistent with the policies
developed in prior years.
Good Governance Practices
In addition to our emphasis on above-market financial performance and pay for performance, we design our exec-
utive compensation programs to be current with best practices and good corporate governance. We also consider
the risks associated with any particular program, design or compensation decision. We believe these assessments
result in sustained, long-term shareholder value. Some of those governance practices are described in the
Compensation-Related Risk portion of the Corporate Governance section above. Other such practices include:
What We Do What We Don’t Do
Pay for Performance Focus
(Compensation programs weighted heavily toward vari-
able, “at risk,” compensation; perform annual reviews of
market competitiveness and the relationship of compen-
sation to financial performance)
✔
No Guaranteed Pay
(No multi-year guarantees for compensation increases,
including base pay, and no guaranteed bonuses) ✘
Balanced Compensation
(Compensation opportunities linked to both short-term
and long-term periods of time, while aligning compen-
sation with several financial performance metrics that
are critical to achievement of sustained growth and
shareholder value creation)
✔
No Repricing or Replacement of Underwater Stock Options
without Prior Shareholder Approval
✘
Double Trigger Provisions for Change in Control✔
No Payment of Dividends on Unvested Equity✘
Stock Ownership Policy✔
No Excessive Perquisites✘
Clawback Policy
(Applies to all recent incentive awards for officers) ✔
No Excise Tax Gross-Ups or Tax Reimbursements
✘
Independent Compensation Committee and Consultant✔
No Hedging or Pledging of Lincoln Electric Stock✘
MENU
/ 3 6
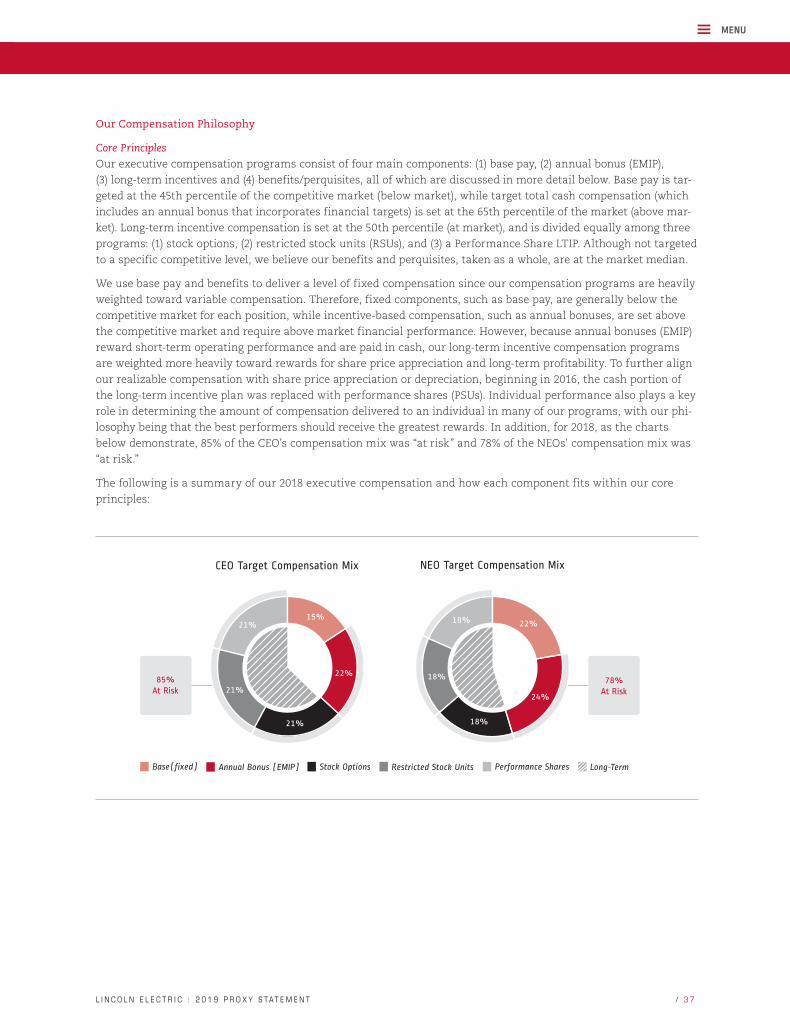
Our Compensation Philosophy
Core Principles
Our executive compensation programs consist of four main components: (1) base pay, (2) annual bonus (EMIP),
(3) long-term incentives and (4) benefits/perquisites, all of which are discussed in more detail below. Base pay is tar-
geted at the 45th percentile of the competitive market (below market), while target total cash compensation (which
includes an annual bonus that incorporates financial targets) is set at the 65th percentile of the market (above mar-
ket). Long-term incentive compensation is set at the 50th percentile (at market), and is divided equally among three
programs: (1) stock options, (2) restricted stock units (RSUs), and (3) a Performance Share LTIP. Although not targeted
to a specific competitive level, we believe our benefits and perquisites, taken as a whole, are at the market median.
We use base pay and benefits to deliver a level of fixed compensation since our compensation programs are heavily
weighted toward variable compensation. Therefore, fixed components, such as base pay, are generally below the
competitive market for each position, while incentive-based compensation, such as annual bonuses, are set above
the competitive market and require above market financial performance. However, because annual bonuses (EMIP)
reward short-term operating performance and are paid in cash, our long-term incentive compensation programs
are weighted more heavily toward rewards for share price appreciation and long-term profitability. To further align
our realizable compensation with share price appreciation or depreciation, beginning in 2016, the cash portion of
the long-term incentive plan was replaced with performance shares (PSUs). Individual performance also plays a key
role in determining the amount of compensation delivered to an individual in many of our programs, with our phi-
losophy being that the best performers should receive the greatest rewards. In addition, for 2018, as the charts
below demonstrate, 85% of the CEO’s compensation mix was “at risk” and 78% of the NEOs’ compensation mix was
“at risk.”
The following is a summary of our 2018 executive compensation and how each component fits within our core
principles:
85%At Risk
78%At Risk
21% 18%
18%
24%
22%
21%
21%
22%
CEO Target Compensation Mix
Base(fixed) Annual Bonus (EMIP) Stock Options Restricted Stock Units Performance Shares Long-Term
NEO Target Compensation Mix
15%
18%
MENU
/ 3 7L I N C O L N E L E C T R I C : 2 0 1 9 P R O X Y S TA T E M E N T
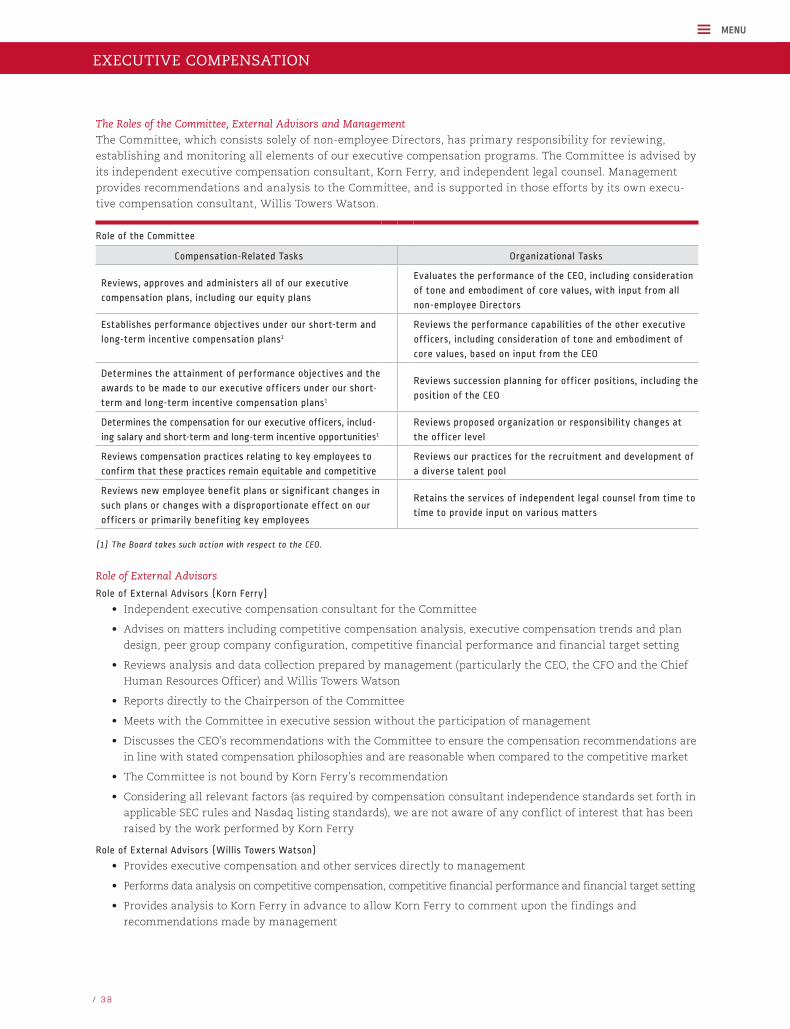
EXECUTIVE COMPENSATION
The Roles of the Committee, External Advisors and Management
The Committee, which consists solely of non-employee Directors, has primary responsibility for reviewing,
establishing and monitoring all elements of our executive compensation programs. The Committee is advised by
its independent executive compensation consultant, Korn Ferry, and independent legal counsel. Management
provides recommendations and analysis to the Committee, and is supported in those efforts by its own execu-
tive compensation consultant, Willis Towers Watson.
Role of the Committee
Compensation-Related Tasks Organizational Tasks
Reviews, approves and administers all of our executive
compensation plans, including our equity plans
Evaluates the performance of the CEO, including consideration
of tone and embodiment of core values, with input from all
non-employee Directors
Establishes performance objectives under our short-term and
long-term incentive compensation plans1
Reviews the performance capabilities of the other executive
officers, including consideration of tone and embodiment of
core values, based on input from the CEO
Determines the attainment of performance objectives and the
awards to be made to our executive officers under our short-
term and long-term incentive compensation plans1
Reviews succession planning for officer positions, including the
position of the CEO
Determines the compensation for our executive officers, includ-
ing salary and short-term and long-term incentive opportunities1
Reviews proposed organization or responsibility changes at
the officer level
Reviews compensation practices relating to key employees to
confirm that these practices remain equitable and competitive
Reviews our practices for the recruitment and development of
a diverse talent pool
Reviews new employee benefit plans or significant changes in
such plans or changes with a disproportionate effect on our
officers or primarily benefiting key employees
Retains the services of independent legal counsel from time to
time to provide input on various matters
(1) The Board takes such action with respect to the CEO.
Role of External Advisors
Role of External Advisors (Korn Ferry)
• Independent executive compensation consultant for the Committee
• Advises on matters including competitive compensation analysis, executive compensation trends and plan
design, peer group company configuration, competitive financial performance and financial target setting
• Reviews analysis and data collection prepared by management (particularly the CEO, the CFO and the Chief
Human Resources Officer) and Willis Towers Watson
• Reports directly to the Chairperson of the Committee
• Meets with the Committee in executive session without the participation of management
• Discusses the CEO’s recommendations with the Committee to ensure the compensation recommendations are
in line with stated compensation philosophies and are reasonable when compared to the competitive market
• The Committee is not bound by Korn Ferry’s recommendation
• Considering all relevant factors (as required by compensation consultant independence standards set forth in
applicable SEC rules and Nasdaq listing standards), we are not aware of any conflict of interest that has been
raised by the work performed by Korn Ferry
Role of External Advisors (Willis Towers Watson)
• Provides executive compensation and other services directly to management
• Performs data analysis on competitive compensation, competitive financial performance and financial target setting
• Provides analysis to Korn Ferry in advance to allow Korn Ferry to comment upon the findings and
recommendations made by management
MENU
/ 3 8

Role of CEO and Management
• Provides compensation-related recommendations to the Committee
• The CEO recommends the compensation for other executive management positions and provides the
Committee with assessments of their individual performance (both of which are subject to Committee review)
• Performs individual performance assessments based on achievement of various financial and leadership
objectives set by the CEO
• Receives suggestions from the Committee for modifications to financial and leadership objectives where
warranted
Our Methodologies
Selection of Compensation Elements
As part of its annual review, the Committee evaluates whether changes in the philosophy or structure are war-
ranted in light of emerging trends, business needs and/or financial performance. The Committee then uses com-
petitive market data, performance assessments and management recommendations to set the pay components
along the targets described above (for example, 45th percentile for base pay). Actual pay for executive management
will generally fall within a range of these targets (plus or minus 20%). Absent significant increases due to promo-
tion, increases for break-through individual performance or significant changes in the competitive market data,
pay increases are generally in line with national trends.
Market Comparison Data
We collect competitive market compensation data from multiple nationally published surveys, from proxy data for
a peer group of companies and from proxy data for companies in the S&P 400. Nationally published survey market
compensation data is statistically determined (through regression analysis) to approximate our revenue size and
aged to approximate more current data.
Peer Group
We use a peer group of publicly traded industrial companies that are headquartered in the U.S. that serve a number
of different market segments and that have significant foreign operations. These are companies for which Lincoln
Electric competes for talent and shareholder investment. In addition, we only select companies with solid historical
financial results (removing companies from the peer group when their financial performance has consistently
fallen below an acceptable level) and companies with sales that are within 2.5 times that of Lincoln Electric, with
the exception of Illinois Tool Works (ITW), as ITW is a global competitor with its largest presence in the U.S. The
Committee conducts an annual review of our peer group. As compared to our 2017 peer group, the Company modi-
fied its peer group by eliminating Rockwell Automation as its revenues were almost at the maximum of our guide-
lines and adding Snap-On, Inc., which is in the ISS peer group.
For 2018, our peer group consisted of the following 18 publicly traded industrial corporations:
Ametek Inc. Flowserve Corporation Kennametal Inc. SPX Corporation
Carlisle Companies Incorporated Graco Inc. Nordson Corporation The Timken Company
Colfax Corporation IDEX Corporation Regal Beloit Corporation The Toro Company
Crane Co. Illinois Tool Works Inc. Roper Technologies, Inc.
Donaldson Company, Inc. ITT Inc. Snap-On, Incorporated
MENU
/ 3 9L I N C O L N E L E C T R I C : 2 0 1 9 P R O X Y S TA T E M E N T

EXECUTIVE COMPENSATION
Executive Compensation Structure
Business Needs. The Committee’s independent compensation consultant (Korn Ferry) assists in presenting informa-
tion about emerging trends in executive compensation, along with Committee members’ own reading and study.
These trends are considered in light of our compensation philosophies and various business needs. Business needs
that are evaluated can include: talent attraction or retention strategies, growth expectations, strategic programs,
cost-containment initiatives, management development needs and our company culture. No single factor guides
whether changes will be made. Instead, the Committee uses a holistic approach, considering a variety of factors.
Individual Performance. Individual performance is a significant factor in determining annual changes (up or down) to
pay components. In addition, the annual bonus includes an individual performance component in determining the
percentage of target to be paid (described below and as noted in the annual bonus (EMIP) matrix). Individual per-
formance is measured against how well an executive demonstrates proficiency in key leadership competencies as
well as the executive’s achievement against objectives established for him or her at the beginning of the year. For
the past three years, individual performance ratings for the annual bonus for officers have ranged from 110 to 130.
Pay for Performance Review. In determining whether changes will be made to the existing philosophy or structure and
before setting compensation levels for the upcoming year, the Committee conducts its annual assessment of our
financial performance and pay for performance (both of which are described above). These reviews are used to
evaluate whether executive compensation is properly aligned with our financial performance.
Timing of Compensation Determination and Payouts
Base pay, annual bonus targets and long-term incentive awards are set at a regularly scheduled Committee meeting
held in the first quarter of the year. Payout amounts for the annual EMIP (bonus), the Cash LTIP and Performance
Share LTIP are determined after year-end, at the first available Committee meeting of the following year (normally
in February) or a subsequent special meeting (normally in March), once final financial results are available. As men-
tioned above, beginning with the 2016 to 2018 performance cycle, the Performance Share LTIP replaced the Cash
LTIP. Compensation associated with the Cash LTIP is disclosed in the Summary Compensation Table when realized
(at the end of the cycle) and compensation associated with the Performance Share LTIP is disclosed when granted
(at the beginning of the cycle). Therefore, with respect to 2016 and 2017, compensation associated with the Cash
LTIP and the Performance Share LTIP are both disclosed in the 2018 Summary Compensation Table.
Elements of Executive Compensation
Each compensation component for our NEOs is described below, with specific actions that were taken during 2018
noted. For 2018 compensation amounts, please refer to the Summary Compensation Table and other accompanying
tables below.
Base Pay
Base salary is provided to our executives to compensate them for their time and proficiency in their positions, as
well as the value of their job relative to other positions at Lincoln Electric. Base salaries are set based on the
executive’s experience, expertise, level of responsibility, leadership qualities, individual accomplishments and
other factors. That being said, we aim to set base salaries at approximately the 45th percentile of the market
(slightly below market) in keeping with our philosophy that greater emphasis should be placed on variable
compensation.
MENU
/ 4 0
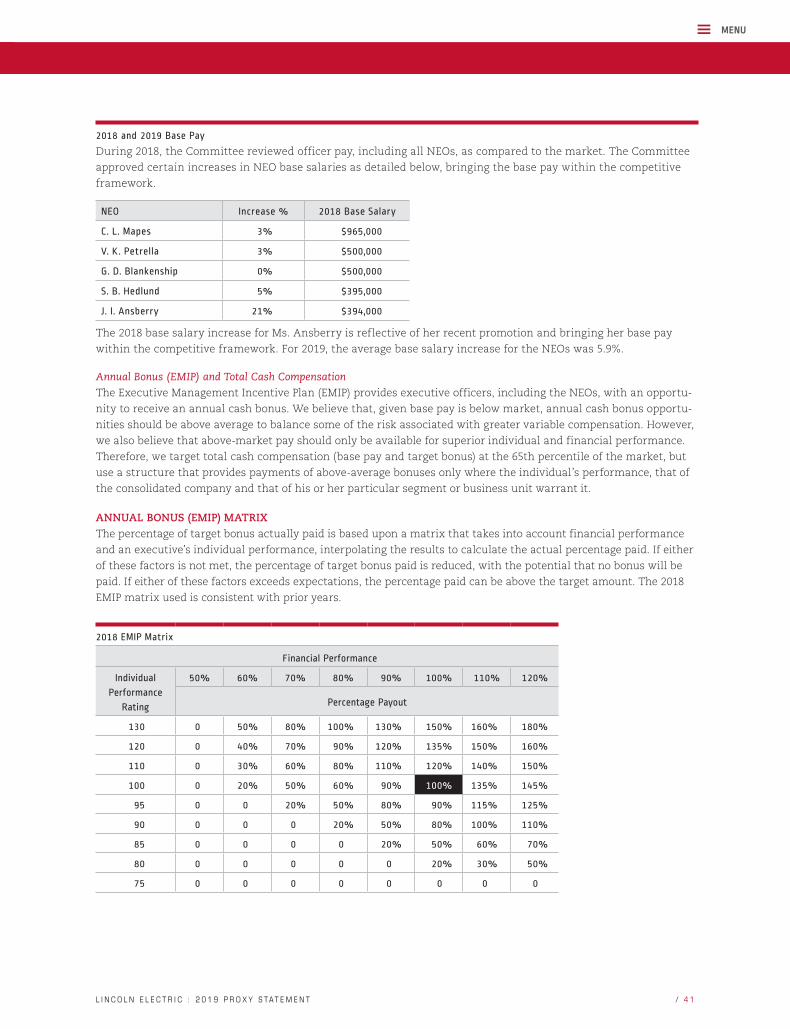
2018 and 2019 Base Pay
During 2018, the Committee reviewed officer pay, including all NEOs, as compared to the market. The Committee
approved certain increases in NEO base salaries as detailed below, bringing the base pay within the competitive
framework.
NEO Increase % 2018 Base Salary
C. L. Mapes 3% $965,000
V. K. Petrella 3% $500,000
G. D. Blankenship 0% $500,000
S. B. Hedlund 5% $395,000
J. I. Ansberry 21% $394,000
The 2018 base salary increase for Ms. Ansberry is reflective of her recent promotion and bringing her base pay
within the competitive framework. For 2019, the average base salary increase for the NEOs was 5.9%.
Annual Bonus (EMIP) and Total Cash Compensation
The Executive Management Incentive Plan (EMIP) provides executive officers, including the NEOs, with an opportu-
nity to receive an annual cash bonus. We believe that, given base pay is below market, annual cash bonus opportu-
nities should be above average to balance some of the risk associated with greater variable compensation. However,
we also believe that above-market pay should only be available for superior individual and financial performance.
Therefore, we target total cash compensation (base pay and target bonus) at the 65th percentile of the market, but
use a structure that provides payments of above-average bonuses only where the individual’s performance, that of
the consolidated company and that of his or her particular segment or business unit warrant it.
ANNUAL BONUS (EMIP) MATRIXThe percentage of target bonus actually paid is based upon a matrix that takes into account financial performance
and an executive’s individual performance, interpolating the results to calculate the actual percentage paid. If either
of these factors is not met, the percentage of target bonus paid is reduced, with the potential that no bonus will be
paid. If either of these factors exceeds expectations, the percentage paid can be above the target amount. The 2018
EMIP matrix used is consistent with prior years.
2018 EMIP Matrix
Financial Performance
Individual
Performance
Rating
50% 60% 70% 80% 90% 100% 110% 120%
Percentage Payout
130 0% 50% 80% 100% 130% 150% 160% 180%
120 0% 40% 70% 90% 120% 135% 150% 160%
110 0% 30% 60% 80% 110% 120% 140% 150%
100 0% 20% 50% 60% 90% 100% 135% 145%
95 0% 0% 20% 50% 80% 90% 115% 125%
90 0% 0% 0% 20% 50% 80% 100% 110%
85 0% 0% 0% 0% 20% 50% 60% 70%
80 0% 0% 0% 0% 0% 20% 30% 50%
75 0% 0% 0% 0% 0% 0% 0% 0%
MENU
/ 4 1L I N C O L N E L E C T R I C : 2 0 1 9 P R O X Y S TA T E M E N T
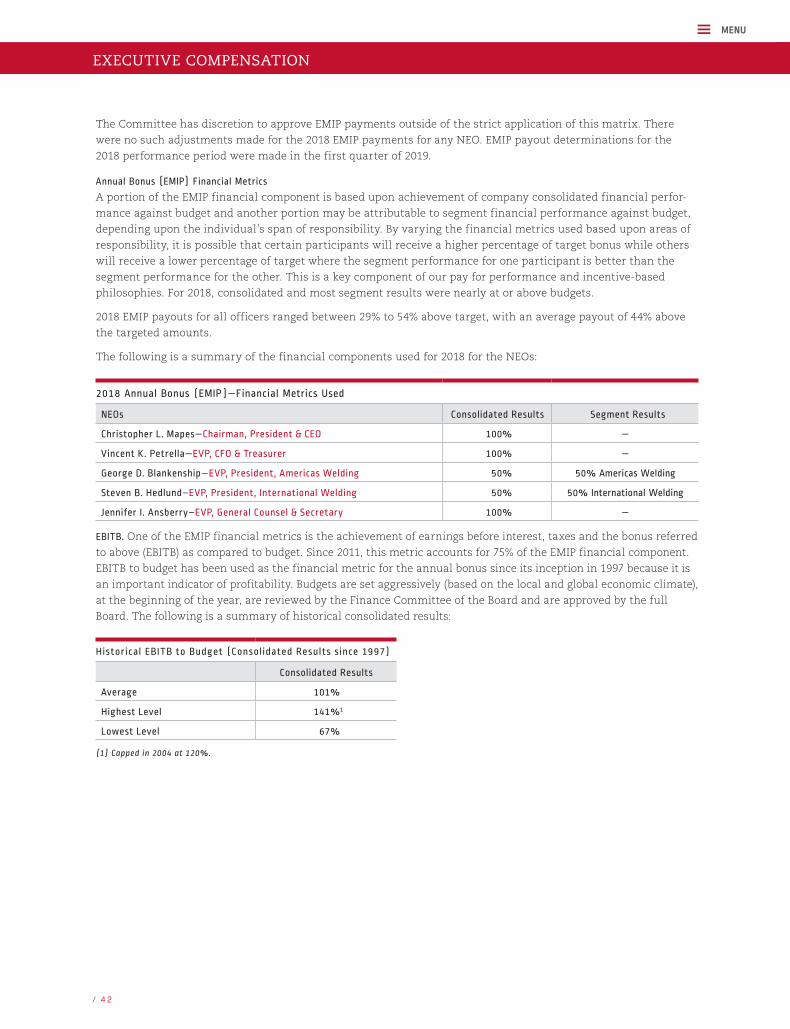
The Committee has discretion to approve EMIP payments outside of the strict application of this matrix. There
were no such adjustments made for the 2018 EMIP payments for any NEO. EMIP payout determinations for the
2018 performance period were made in the first quarter of 2019.
Annual Bonus (EMIP) Financial Metrics
A portion of the EMIP financial component is based upon achievement of company consolidated financial perfor-
mance against budget and another portion may be attributable to segment financial performance against budget,
depending upon the individual’s span of responsibility. By varying the financial metrics used based upon areas of
responsibility, it is possible that certain participants will receive a higher percentage of target bonus while others
will receive a lower percentage of target where the segment performance for one participant is better than the
segment performance for the other. This is a key component of our pay for performance and incentive-based
philosophies. For 2018, consolidated and most segment results were nearly at or above budgets.
2018 EMIP payouts for all officers ranged between 29% to 54% above target, with an average payout of 44% above
the targeted amounts.
The following is a summary of the financial components used for 2018 for the NEOs:
2018 Annual Bonus (EMIP)—Financial Metrics Used
NEOs Consolidated Results Segment Results
Christopher L. Mapes—Chairman, President & CEO 100% —
Vincent K. Petrella—EVP, CFO & Treasurer 100% —
George D. Blankenship—EVP, President, Americas Welding 50% 50% Americas Welding
Steven B. Hedlund–EVP, President, International Welding 50% 50% International Welding
Jennifer I. Ansberry–EVP, General Counsel & Secretary 100% —
EBITB. One of the EMIP financial metrics is the achievement of earnings before interest, taxes and the bonus referred
to above (EBITB) as compared to budget. Since 2011, this metric accounts for 75% of the EMIP financial component.
EBITB to budget has been used as the financial metric for the annual bonus since its inception in 1997 because it is
an important indicator of profitability. Budgets are set aggressively (based on the local and global economic climate),
at the beginning of the year, are reviewed by the Finance Committee of the Board and are approved by the full
Board. The following is a summary of historical consolidated results:
Historical EBITB to Budget (Consolidated Results since 1997)
Consolidated Results
Average 101%
Highest Level 141%1
Lowest Level 67%
(1) Capped in 2004 at 120%.
EXECUTIVE COMPENSATION
MENU
/ 4 2
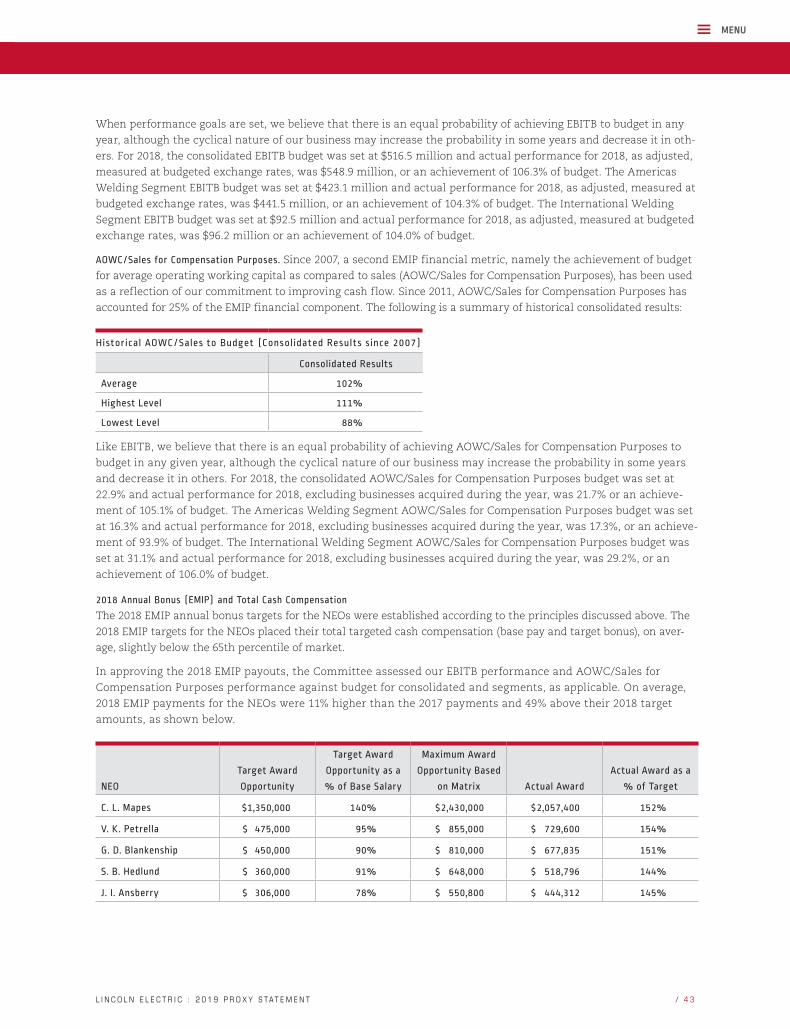
When performance goals are set, we believe that there is an equal probability of achieving EBITB to budget in any
year, although the cyclical nature of our business may increase the probability in some years and decrease it in oth-
ers. For 2018, the consolidated EBITB budget was set at $516.5 million and actual performance for 2018, as adjusted,
measured at budgeted exchange rates, was $548.9 million, or an achievement of 106.3% of budget. The Americas
Welding Segment EBITB budget was set at $423.1 million and actual performance for 2018, as adjusted, measured at
budgeted exchange rates, was $441.5 million, or an achievement of 104.3% of budget. The International Welding
Segment EBITB budget was set at $92.5 million and actual performance for 2018, as adjusted, measured at budgeted
exchange rates, was $96.2 million or an achievement of 104.0% of budget.
AOWC/Sales for Compensation Purposes. Since 2007, a second EMIP financial metric, namely the achievement of budget
for average operating working capital as compared to sales (AOWC/Sales for Compensation Purposes), has been used
as a reflection of our commitment to improving cash flow. Since 2011, AOWC/Sales for Compensation Purposes has
accounted for 25% of the EMIP financial component. The following is a summary of historical consolidated results:
Historical AOWC/Sales to Budget (Consolidated Results since 2007)
Consolidated Results
Average 102%
Highest Level 111%
Lowest Level 88%
Like EBITB, we believe that there is an equal probability of achieving AOWC/Sales for Compensation Purposes to
budget in any given year, although the cyclical nature of our business may increase the probability in some years
and decrease it in others. For 2018, the consolidated AOWC/Sales for Compensation Purposes budget was set at
22.9% and actual performance for 2018, excluding businesses acquired during the year, was 21.7% or an achieve-
ment of 105.1% of budget. The Americas Welding Segment AOWC/Sales for Compensation Purposes budget was set
at 16.3% and actual performance for 2018, excluding businesses acquired during the year, was 17.3%, or an achieve-
ment of 93.9% of budget. The International Welding Segment AOWC/Sales for Compensation Purposes budget was
set at 31.1% and actual performance for 2018, excluding businesses acquired during the year, was 29.2%, or an
achievement of 106.0% of budget.
2018 Annual Bonus (EMIP) and Total Cash Compensation
The 2018 EMIP annual bonus targets for the NEOs were established according to the principles discussed above. The
2018 EMIP targets for the NEOs placed their total targeted cash compensation (base pay and target bonus), on aver-
age, slightly below the 65th percentile of market.
In approving the 2018 EMIP payouts, the Committee assessed our EBITB performance and AOWC/Sales for
Compensation Purposes performance against budget for consolidated and segments, as applicable. On average,
2018 EMIP payments for the NEOs were 11% higher than the 2017 payments and 49% above their 2018 target
amounts, as shown below.
NEO
Target Award
Opportunity
Target Award
Opportunity as a
% of Base Salary
Maximum Award
Opportunity Based
on Matrix Actual Award
Actual Award as a
% of Target
C. L. Mapes $1,350,000 140% $ 2,430,000 $ 2,057,400 152%
V. K. Petrella $ 475,000 95% $ 855,000 $ 729,600 154%
G. D. Blankenship $ 450,000 90% $ 810,000 $ 677,835 151%
S. B. Hedlund $ 360,000 91% $ 648,000 $ 518,796 144%
J. I. Ansberry $ 306,000 78% $ 550,800 $ 444,312 145%
MENU
/ 4 3L I N C O L N E L E C T R I C : 2 0 1 9 P R O X Y S TA T E M E N T
2019 Annual Bonus (EMIP) and Total Cash Compensation
The 2019 EMIP targets for the NEOs, approved in the first quarter of 2019, were established by the Committee in
consultation with Korn Ferry, based on our compensation philosophies as well as competitive market data as dis-
cussed above. The 2019 bonus targets reflect an increase from the 2018 target amounts of, on average 5.4%, for the
NEOs. Even with the increases, the NEOs were still, on average, slightly below the 65th percentile on targeted total
cash compensation.
Long-Term Incentives
We believe that long-term incentive opportunities should be provided to focus rewards on factors that deliver long-
term sustainability and should be established at the median (or 50th percentile) of the market. We have targeted
the median of the market, in keeping with our pay for performance philosophy, because we believe that superior
long-term financial growth itself should be the main driver of above-market long-term incentive compensation.
We also believe that different financial metrics help drive long-term performance. Therefore, we have established
a structure for long-term incentives that combines several different long-term metrics, with the greatest emphasis
placed on share appreciation and non-cash awards.
For 2018, our long-term incentive program is made up of three components: (1) stock options, (2) RSUs and (3) a
Performance Share LTIP. The value of each is weighted equally. This provides an even balance with respect to the
different attributes and timing associated with each type of award. Annual awards of all three components are
made to EMIP participants, including the NEOs. Starting with the 2016 long-term incentive program, the Cash LTIP
was replaced with a Performance Share LTIP.
Long-term incentive awards are set at regularly-scheduled Committee meetings held in the first quarter of the year.
Payout amounts for the Performance Share LTIP are determined after year-end at the first available Committee meet-
ing of the following year (normally in February) or a subsequent special meeting (normally in March), once final finan-
cial results are available. Compensation associated with the Cash LTIP is disclosed in the Summary Compensation
Table when realized (at the end of the cycle) and compensation associated with the Performance Share LTIP is disclosed
when granted (at the beginning of the cycle). With respect to 2016 and 2017, compensation associated with the Cash
LTIP and the Performance Share LTIP are both disclosed in the 2018 Summary Compensation Table and discussed in
more detail below. The last year that the Cash LTIP paid out was 2017.
Stock Options
All EMIP participants (including the NEOs) and other senior leaders receive an annual stock option award. A total
of 24 employees received stock options during our annual grant in February 2018. Stock options vest ratably over a
three-year period.
Restricted Stock Units
All EMIP participants (including the NEOs) receive an annual RSU award. Recognizing that equity awards are a
valuable compensation tool, we also extend RSUs to senior leaders, managers and significant contributors, regard-
less of their position within Lincoln Electric. A total of 350 employees (including our NEOs) received RSUs during
the annual grant in February 2018. Beginning with grants awarded after October 2015, RSUs vest in full after three
years of continuous service.
Long-Term Incentive Plan (LTIP)
A cash long-term incentive plan, or Cash LTIP, has been in place for officers (EMIP participants) since 1997. As pre-
viously discussed, during 2015, the Committee modified the executive compensation program to replace the cash
incentive with performance shares, or the Performance Share LTIP. The terms of the awards mirror the perfor-
mance objectives tied to the Cash LTIP but payouts will be in shares of Lincoln Electric common stock.
EXECUTIVE COMPENSATION
MENU
/ 4 4

The Performance Share LTIP is designed to offer reward opportunities aligned with the long-term performance of
Lincoln Electric. Target share amounts for the plan are set each year at the beginning of a three-year performance
cycle based on a 7-day historical average of the stock price, up to and including the grant date, as mentioned above.
Because awards are made each year and because each award relates to a three-year performance cycle, three differ-
ent cycles will be running at any point in time. The percentage of the target shares actually paid at the end of the
applicable three-year cycle will be based upon achievement of three-year company performance as interpolated
against pre-established performance thresholds. Each plan has six to seven performance thresholds with percentage
payouts attributable to those thresholds ranging from 0% to 200% of target. The Committee retains discretion to
modify payments to any participant, to modify targets and/or to modify the performance thresholds (up or down).
A total of 15 employees (including our NEOs) received performance shares during the annual grant in February 2018.
Performance Measures. Since its inception, the LTIP has used a performance measure of growth in Adjusted Net
Income for Compensation Purposes over the three-year cycle. Beginning in 2009, the Committee added a second
metric of ROIC for Compensation Purposes and gave these two financial metrics a 50/50 weighting. The Adjusted
Net Income for Compensation Purposes metric is an absolute metric. For the 2016 to 2018 performance cycle, the
growth in Adjusted Net Income for Compensation Purposes over the three-year cycle is based on growth above
$255,644,000 (which was the Adjusted Net Income for Compensation Purposes for 2015 when the 2016 to 2018 per-
formance cycle was set). As the 2016 to 2018 Performance Share LTIP table below demonstrates, to pay 100% of tar-
get, Adjusted Net Income for Compensation Purposes over the three-year cycle must be at or above 140% of
$255,644,000 (or $357,902,000).
From time to time, the Committee has considered and approved certain limited adjustments to reported net
income (both positive and negative) in determining Adjusted Net Income for Compensation Purposes to evaluate
achievement of performance against the thresholds. Each adjustment is reviewed in detail before it is made. The
types of adjustments the Committee has considered include: rationalization charges, certain asset impairment
charges, the gains and losses on certain transactions including the disposal of certain assets and other special
items. To the extent an adjustment relates to restructuring or rationalization charges that are intended to improve
organizational efficiency, a corresponding charge (equal to the adjustment) is amortized against future years’
adjusted net income until that adjustment is fully offset against the intended savings (generally this amortization
occurs over a three-year period).
The ROIC for Compensation Purposes metric for the 2016 to 2018 performance cycle is a relative value that is
derived based on our performance as compared to our proxy peer group (as opposed to an absolute value). In this
2016 to 2018 performance cycle, certain adjustments have been approved by the Committee in comparably mea-
suring performance. For the 2014-2016 performance cycle, the ROIC for Compensation Purposes calculation was
adjusted in 2016 to exclude the incremental balance in cash and marketable securities as of December 31, 2016
compared with the December 31, 2013 balance, as well as interest expense, associated with the long-term notes
drawn as a result of the execution of our capital allocation strategy.
Performance Thresholds. In setting the performance thresholds for a new three-year period, the Committee considers
various factors, including historical performance against established thresholds, to try to achieve a 50% probability
of the target thresholds for any cycle. For the 2016 to 2018 Plan, the Committee did not make any modifications to
the three-year adjusted net income growth performance thresholds or the three-year average ROIC relative to peer
thresholds.
Timing for Setting Performance Measure and Performance Thresholds. Performance targets are set at the beginning of the
first fiscal year in the cycle. This timing allows the Committee to see our final financial results for the prior year
and allows for more current macro-economic projections to be used.
MENU
/ 4 5L I N C O L N E L E C T R I C : 2 0 1 9 P R O X Y S TA T E M E N T
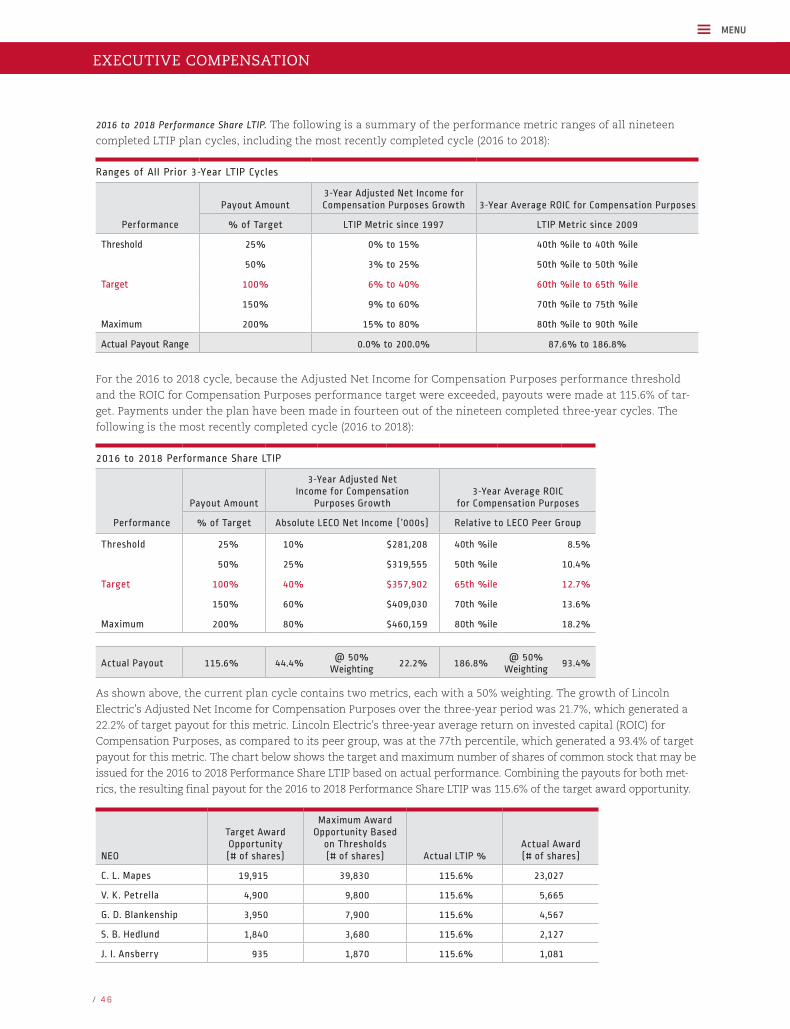
2016 to 2018 Performance Share LTIP. The following is a summary of the performance metric ranges of all nineteen
completed LTIP plan cycles, including the most recently completed cycle (2016 to 2018):
Ranges of All Prior 3-Year LTIP Cycles
Payout Amount3-Year Adjusted Net Income for Compensation Purposes Growth 3-Year Average ROIC for Compensation Purposes
Performance % of Target LTIP Metric since 1997 LTIP Metric since 2009
Threshold 25% 0% to 15% 40th %ile to 40th %ile
50% 3% to 25% 50th %ile to 50th %ile
Target 100% 6% to 40% 60th %ile to 65th %ile
150% 9% to 60% 70th %ile to 75th %ile
Maximum 200% 15% to 80% 80th %ile to 90th %ile
Actual Payout Range 0.0% to 200.0% 87.6% to 186.8%
For the 2016 to 2018 cycle, because the Adjusted Net Income for Compensation Purposes performance threshold
and the ROIC for Compensation Purposes performance target were exceeded, payouts were made at 115.6% of tar-
get. Payments under the plan have been made in fourteen out of the nineteen completed three-year cycles. The
following is the most recently completed cycle (2016 to 2018):
2016 to 2018 Performance Share LTIP
Payout Amount
3-Year Adjusted Net Income for Compensation
Purposes Growth3-Year Average ROIC
for Compensation Purposes
Performance % of Target Absolute LECO Net Income (’000s) Relative to LECO Peer Group
Threshold 25% 10% $281,208 40th %ile 8.5%
50% 25% $319,555 50th %ile 10.4%
Target 100% 40% $357,902 65th %ile 12.7%
150% 60% $409,030 70th %ile 13.6%
Maximum 200% 80% $460,159 80th %ile 18.2%
Actual Payout 115.6% 44.4%@ 50%
Weighting22.2% 186.8%
@ 50% Weighting
93.4%
As shown above, the current plan cycle contains two metrics, each with a 50% weighting. The growth of Lincoln
Electric’s Adjusted Net Income for Compensation Purposes over the three-year period was 21.7%, which generated a
22.2% of target payout for this metric. Lincoln Electric’s three-year average return on invested capital (ROIC) for
Compensation Purposes, as compared to its peer group, was at the 77th percentile, which generated a 93.4% of target
payout for this metric. The chart below shows the target and maximum number of shares of common stock that may be
issued for the 2016 to 2018 Performance Share LTIP based on actual performance. Combining the payouts for both met-
rics, the resulting final payout for the 2016 to 2018 Performance Share LTIP was 115.6% of the target award opportunity.
NEO
Target Award Opportunity (# of shares)
Maximum Award Opportunity Based
on Thresholds (# of shares) Actual LTIP %
Actual Award (# of shares)
C. L. Mapes 19,915 39,830 115.6% 23,027
V. K. Petrella 4,900 9,800 115.6% 5,665
G. D. Blankenship 3,950 7,900 115.6% 4,567
S. B. Hedlund 1,840 3,680 115.6% 2,127
J. I. Ansberry 935 1,870 115.6% 1,081
EXECUTIVE COMPENSATION
MENU
/ 4 6
2018 Long-Term Incentives
In evaluating 2018 long-term incentive compensation (at the beginning of 2018), the Committee reviewed 2016 and
2017 compensation versus the competitive benchmarks. The Committee concluded that overall the long-term
incentives for the NEOs were below our 50th percentile target when compared to both survey and peer proxy data.
At the February meeting, the Committee adjusted 2018 long-term incentives for the NEOs on average 10%, exclud-
ing Ms. Ansberry, who received a 42% increase due to her promotion, still placing her award below the 50th per-
centile. This average also excludes a special RSU award to Mr. Hedlund and Ms. Ansberry of $50,000 in recognition
of each executive’s leadership associated with the acquisition and initial integration of Air Liquide Welding. All of
these awards are subject to our Recovery of Funds Policy, which is discussed below.
2019 Long-Term Incentives
In evaluating 2019 long-term incentive compensation (at the beginning of 2019), the Committee reviewed 2017
and 2018 compensation versus the competitive benchmarks. The Committee concluded that overall the long-term
incentives for the NEOs were below our 50th percentile target when compared to both survey and peer proxy
data and adjusted 2018 long-term incentives for the NEOs on average 11%, still placing their LTI targets slightly
below the 50th percentile.
Valuation of Equity Awards. Beginning with the 2016 annual grant, for shares under our 2015 Equity and Incentive
Compensation Plan, the Committee established set valuation methods in order to convert the approved long-term
incentive compensation values to shares upon the grant date. These methods consider a 7-day historical average
of the stock price, up to and including the grant date, for RSUs and performance shares and the grant date Black-
Scholes valuation for stock options.
Normal Cycle and Out-of-Cycle Equity Awards. The Committee has discretion in awarding grants to EMIP participants
and does not delegate its authority to management, nor does management select or influence the award dates.
Occasionally, the Committee may approve limited, out-of-cycle special awards for specific business purposes or in
connection with executive promotions or the hiring of new executive employees. However, the date used for
awards to all EMIP participants, including the NEOs, is the date of a regularly scheduled Committee meeting,
which is fixed well in advance and generally occurs at the same time each year.
The Committee has approved delegated authority to the CEO to designate awards through 2019 to certain employ-
ees under the 2015 Equity and Incentive Compensation Plan, subject to specific limits established. The CEO can
only grant RSU awards and cannot grant awards to any executive officers, Section 16 officers or greater-
than-10% beneficial owners of the Company, and must be granted per the agreements and vesting terms already
approved by the Committee.
MENU
/ 4 7L I N C O L N E L E C T R I C : 2 0 1 9 P R O X Y S TA T E M E N T
Other Arrangements, Policies and Practices
Overview of Benefits
We intend to provide a competitive group of benefits for all of our employees targeted at the 50th percentile of the
market. Some aspects of our benefit programs are considered non-traditional due to their relationship with our pay
for performance and incentive-based philosophies. For example, the premiums for Lincoln Electric-provided medical
coverage are 100% paid by employees, including the NEOs, on a pre-tax basis. Premiums for dental coverage, which is
a voluntary benefit, are also 100% paid by employees. Life insurance coverage paid fully by Lincoln Electric is set at
$10,000 per employee, including the NEOs, although employees may purchase additional insurance at their own cost.
The NEOs participate in this same cost-sharing approach. We attempt to balance our various non-traditional pro-
grams (such as those with a significant portion of the cost borne by the employee) with more traditional programs.
We also provide accidental death and dismemberment benefits to officers, due to the significant amount of travel
required in their jobs. Under this program, the premiums of which are paid by us, a participant’s beneficiary
would receive a payment of five times annual total cash compensation up to a maximum of $3,000,000 for execu-
tive officers and $2,000,000 for other officers upon an officer’s accidental death. The policy also provides dismem-
berment benefits of up to 100% of the death benefit in the event an officer is permanently and totally disabled as a
result of an accident, and it provides for medical evacuation coverage in the event of an accident.
Retirement Programs
Retirement benefits are provided to our NEOs through the following programs:
The Lincoln Electric Company Retirement Annuity Program (RAP)
• Frozen to new entrants effective January 1, 2006 (no new employees eligible to join the RAP after January 1, 2006;
participate in The Lincoln Electric Company Employee Savings Plan described below)
• Benefit accruals frozen effective as of December 31, 2016 (participants will not earn any additional benefits under
the RAP after December 31, 2016)
• Estimated retirement benefits under the RAP for the NEOs that are shown in the Pension Benefits Table below are
based on the NEOs frozen benefit under the RAP as of December 31, 2018
Supplemental Executive Retirement Plan (SERP)
• Frozen to new entrants since 2005
• Effective as of December 1, 2016, the value of the frozen accrued vested benefit of each SERP participant was
converted to a notional balance, calculated by projecting to December 31, 2016 the participant’s SERP benefit and
calculating the present value of that projected benefit
• Participants’ account balances are credited with earnings, gains and losses in accordance with each participant’s
investment elections which will be made in a manner similar to that undertaken by participants in the amended
and restated 2005 Deferred Compensation Plan for Executives
The Lincoln Electric Company Employee Savings Plan (401(k) Plan)
• All of the NEOs deferred amounts under the 401(k) Plan in 2018
• Each eligible employee of The Lincoln Electric Company and certain affiliated companies is eligible to receive up
to 6% of annual compensation in Company contributions through:
(1) matching employer contributions equal to 100% of before-tax (401(k)) contributions made to the 401(k) Plan,
but not in excess of 3% of annual compensation; and
(2) automatic employer contributions equal to 3% of annual compensation
• Matching and automatic contributions are 100% vested when made
• Certain employees affected by the RAP freeze are also eligible to receive employer contributions equal to 6% of
annual compensation for a minimum period of five years, up to the end of the year in which they complete 30
years of service
EXECUTIVE COMPENSATION
MENU
/ 4 8
Restoration Plan
• Created effective January 1, 2017, primarily for the purpose of providing deferred compensation for eligible employ-
ees of The Lincoln Electric Company and certain affiliated companies whose annual compensation is expected to
be in excess of the Internal Revenue Code limit on compensation (Code Limit) applicable to the 401(k) Plan
• Each participant’s account under the Restoration Plan is credited each year with deferred amounts generally
as follows:
(1) matching employer contributions equal to 3% of annual compensation that is in excess of the Code Limit; and
(2) non-elective employer contribution equal to 3% of annual compensation that is in excess of the Code Limit
• All amounts deferred under the Restoration Plan are fully vested at all times
• Certain employees affected by the RAP freeze are also eligible to receive employer contributions equal to 6% of
annual compensation in excess of the Code Limit for a minimum period of five years, up to the end of the year in
which they complete 30 years of service
• Amounts credited to participants’ accounts under the Restoration Plan will be payable in cash in accordance with
the distribution provisions of the Restoration Plan
• All NEOs participated in the Restoration Plan in 2018
Amended and Restated 2005 Deferred Compensation Plan for Executives (Top Hat Plan)
• The Top Hat Plan allows participants to defer their current income on a pre-tax basis and to receive a tax-
deferred return on those deferrals. There are no Company contributions or match.
• Participation in the Top Hat Plan is limited to individuals approved by the Committee.
• As of December 31, 2018, there were 18 active employee participants in the Top Hat Plan.
More information on these programs can be found below in the 2018 Pension Benefits section and 2018 Deferred
Compensation Benefits section.
MENU
/ 4 9L I N C O L N E L E C T R I C : 2 0 1 9 P R O X Y S TA T E M E N T
Perquisites
We offer limited perquisites. For example, we pay for an annual physical for officers and other senior management.
We also make available financial planning services to certain officers. However, the cost of these financial planning
services is included in the income of the participants. The physical and financial planning programs are optional
programs. We also pay the cost of certain club dues for some officers. All personal expenses are borne entirely by the
executive and the club dues are included in the income of the participants. Initiation fees for club memberships are
paid by the executive. Different perquisites are provided from time to time to non-U.S. based executives; however,
they are customary and reasonable in nature and amount relative to local market practices (for example, a car lease).
Change in Control Arrangements
We have entered into change in control agreements with all of our NEOs. The agreements are designed generally
to assure continued management in the event of a change in control of Lincoln Electric.
The change in control agreements are operative only if a change in control occurs and payments are made if the
officer’s employment is terminated (or if the officer terminates employment due to certain adverse employment
changes). The agreements provide our NEOs with the potential for continued employment following a change in
control, which help retain these executives and provide for management continuity in the event of an actual or
threatened change in control of Lincoln Electric. They also help ensure that our executives’ interests remain aligned
with shareholders’ interests during a time when their continued employment may be in jeopardy. For a more
detailed discussion of our change in control agreements, see Termination and Change in Control Arrangements
below. Outside of these change in control agreements, we do not maintain written employment or other severance
agreements for U.S.-based employees.
Recovery of Funds Policy
We have adopted a Recovery of Funds Policy (clawback policy) consistent with the requirements of the Dodd-Frank
Wall Street Reform and Consumer Protection Act (Dodd-Frank). Our policy is more extensive than what Dodd-
Frank requires and is applicable to all of our officers, including our NEOs. The policy applies in the event that there
is an accounting restatement involving our financial statements due to material non-compliance with the financial
reporting requirements under the U.S. federal securities laws. The policy applies to both current and former offi-
cers and covers incentive compensation received by the officers in the 3-year period prior to the restatement.
Awards of incentive compensation would include annual bonus payments, stock option awards, restricted stock
awards, RSUs, performance shares and Cash LTIP awards, unless Dodd-Frank regulations provide otherwise. Under
the policy, in the event of an accounting restatement of our financial statements, the Committee would review all
incentive compensation received during the 3-year covered period and would seek recovery of the amount of
incentive compensation paid in excess of what would have been paid if the accounts had been properly stated. We
believe that this policy is in the best interests of Lincoln Electric and its shareholders.
Anti-Hedging/Pledging Policy
Consistent with our philosophy to encourage long-term investment in our common stock, our Directors and execu-
tive officers are prohibited from engaging in any speculative or hedging transactions involving our common stock,
including buying or selling puts or calls, short sales or margin purchases. In addition, our insider trading policy
prohibits future pledging of Lincoln Electric securities by our executive officers and Directors. There are no pledges
of our common stock in place for any of our Directors or executive officers.
EXECUTIVE COMPENSATION
MENU
/ 5 0

Share Ownership
As with the Directors, in keeping with our philosophy that officers should maintain an equity interest in Lincoln
Electric and based on our view that such ownership is a component of good corporate governance, we initially
adopted stock ownership guidelines for officers in 2006 and increased the guidelines in 2012. The revised guide-
lines were proposed based on a review of our peer group and corporate governance best practices. Under the cur-
rent guidelines, our officers are required to own and hold a certain number of our common shares, currently at
the levels set forth in the table below:
Executive Group Ownership Guideline
Chief Executive Officer1 5 times base salary
Management Committee Members2 3 times base salary
Other Officers3 2 times base salary
(1) Mr. Mapes.
(2) Includes Messrs. Petrella, Blankenship, Hedlund and Ms. Ansberry as well as 8 other officers at 12/31/18.
(3) Includes other EMIP participants.
The Committee reviewed the stock ownership guidelines in December 2016 at the end of the five years and
concluded that they were at appropriate levels when compared to the peer group and market. The guidelines were
reset January 1, 2017 and established in the same manner as above. Officers have five years to satisfy the guidelines
either by holding (1) shares aggregating the dollar amount specified above (valued at the then current stock price),
or (2) that number of shares needed to satisfy the ownership guidelines tied to the base salaries in effect on January
1, 2017 divided by the closing price of a common share on December 30, 2016 ($76.67). RSU awards count towards
the stock ownership guidelines; common shares underlying stock options and shares held in another person’s name
(including a relative) do not. As of December 31, 2018, all of our NEOs met the stock ownership guidelines, with the
exception of Ms. Ansberry due to her promotion in 2017.
Deductibility of Compensation
Our general philosophy has historically been to qualify future compensation for tax deductibility wherever applica-
ble and appropriate. Qualification is sought to the extent practicable and only to the extent that it is consistent with
our overall compensation objectives. Although a portion of the amount we recorded as compensation to Mr. Mapes
in 2018 was non-deductible, this does not cause substantial impact to our income tax position. All of the compensa-
tion paid to the other NEOs during 2018 was tax deductible by Lincoln Electric for federal income tax purposes.
As part of the 2017 Tax Cuts and Jobs Act (the “Tax Reform Act”), the ability to rely on the performance-based
compensation exception under Section 162(m) of the U.S. Internal Revenue Code ("Section 162(m)") was elimi-
nated, and the limitation on deductibility generally was expanded to include all NEOs. As a result of the Tax
Reform Act, going forward and subject to certain grandfathered provisions, we will no longer be able to deduct
any compensation paid to our NEOs in excess of $1 million. The Committee continues to assess the impact of the
amendments to Section 162(m) to determine what adjustments to our executive compensation practices, if any, it
considers appropriate.
COMPENSATION COMMITTEE REPORT //The Compensation and Executive Development Committee has reviewed and discussed the Compensation
Discussion and Analysis contained in this Proxy Statement with our management and, based on this review and
discussion, recommends that it be included in our Annual Report on Form 10-K for the year ended December 31,
2018 and this Proxy Statement.
By the Compensation & Executive Development Committee:
William E. MacDonald, III, Chair
Kathryn Jo Lincoln
Phillip J. Mason
Hellene S. Runtagh
MENU
/ 5 1L I N C O L N E L E C T R I C : 2 0 1 9 P R O X Y S TA T E M E N T
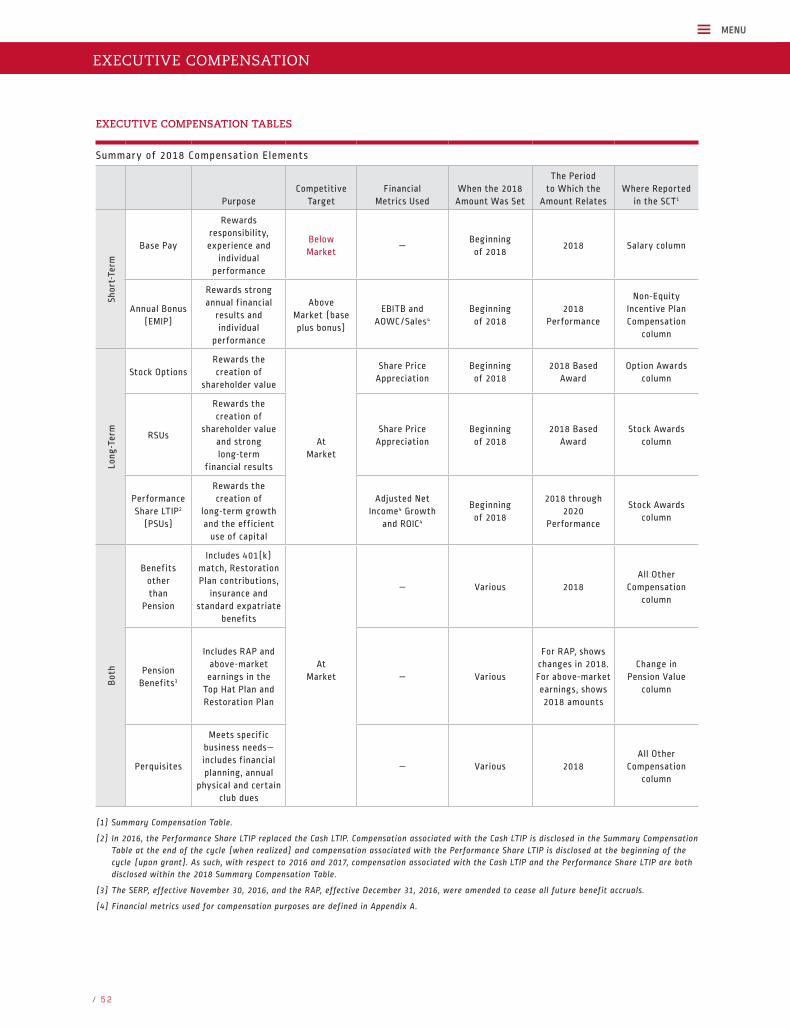
EXECUTIVE COMPENSATION TABLES
Summary of 2018 Compensation Elements
PurposeCompetitive
TargetFinancial
Metrics UsedWhen the 2018 Amount Was Set
The Period to Which the
Amount RelatesWhere Reported
in the SCT1
Shor
t-Te
rm
Base Pay
Rewards responsibility, experience and
individual performance
Below Market
—Beginning of 2018
2018 Salary column
Annual Bonus (EMIP)
Rewards strong annual financial
results and individual
performance
Above Market (base plus bonus)
EBITB and AOWC/Sales4
Beginning of 2018
2018 Performance
Non-Equity Incentive Plan Compensation
column
Long
-Ter
m
Stock OptionsRewards the creation of
shareholder value
At Market
Share Price Appreciation
Beginning of 2018
2018 Based Award
Option Awards column
RSUs
Rewards the creation of
shareholder value and strong long-term
financial results
Share Price Appreciation
Beginning of 2018
2018 Based Award
Stock Awards column
Performance Share LTIP2
(PSUs)
Rewards the creation of
long-term growth and the efficient
use of capital
Adjusted Net Income4 Growth
and ROIC4
Beginning of 2018
2018 through 2020
Performance
Stock Awards column
Bot
h
Benefits other than
Pension
Includes 401(k) match, Restoration Plan contributions,
insurance and standard expatriate
benefits
At
Market
— Various 2018All Other
Compensation column
Pension Benefits3
Includes RAP and above-market earnings in the
Top Hat Plan and Restoration Plan
— Various
For RAP, shows changes in 2018. For above-market earnings, shows 2018 amounts
Change in Pension Value
column
Perquisites
Meets specific business needs—includes financial planning, annual
physical and certain club dues
— Various 2018All Other
Compensation column
(1) Summary Compensation Table.
(2) In 2016, the Performance Share LTIP replaced the Cash LTIP. Compensation associated with the Cash LTIP is disclosed in the Summary Compensation Table at the end of the cycle (when realized) and compensation associated with the Performance Share LTIP is disclosed at the beginning of the cycle (upon grant). As such, with respect to 2016 and 2017, compensation associated with the Cash LTIP and the Performance Share LTIP are both disclosed within the 2018 Summary Compensation Table.
(3) The SERP, effective November 30, 2016, and the RAP, effective December 31, 2016, were amended to cease all future benefit accruals.
(4) Financial metrics used for compensation purposes are defined in Appendix A.
EXECUTIVE COMPENSATION
MENU
/ 5 2
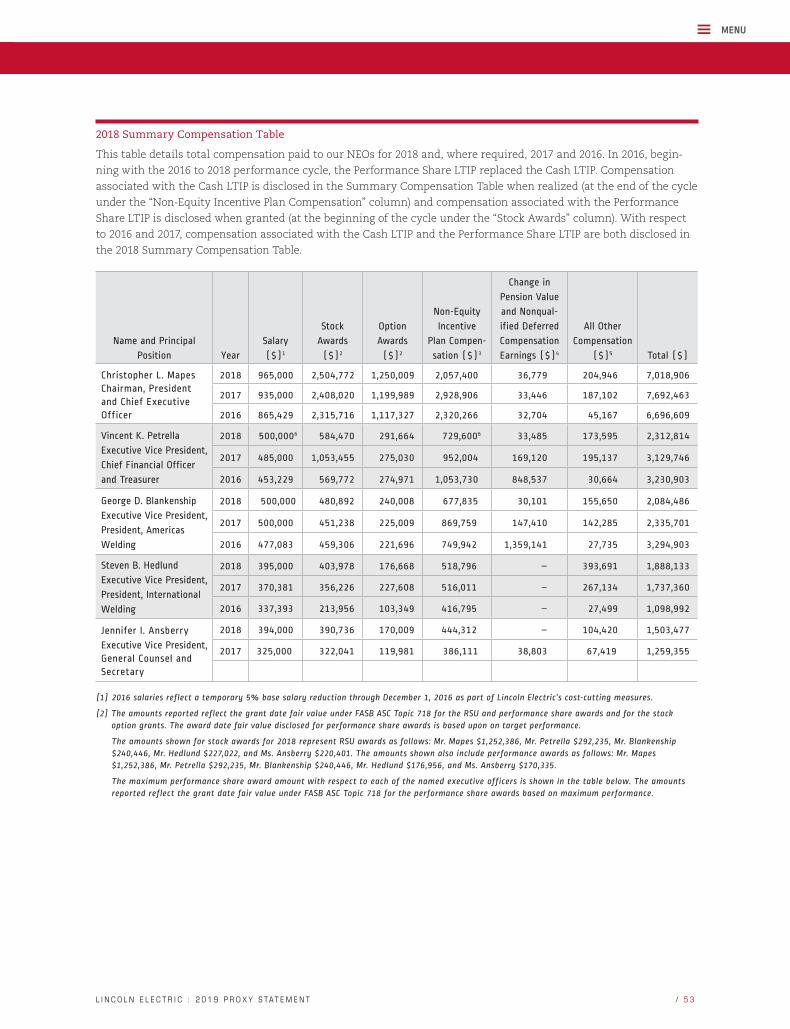
2018 Summary Compensation Table
This table details total compensation paid to our NEOs for 2018 and, where required, 2017 and 2016. In 2016, begin-
ning with the 2016 to 2018 performance cycle, the Performance Share LTIP replaced the Cash LTIP. Compensation
associated with the Cash LTIP is disclosed in the Summary Compensation Table when realized (at the end of the cycle
under the “Non-Equity Incentive Plan Compensation” column) and compensation associated with the Performance
Share LTIP is disclosed when granted (at the beginning of the cycle under the “Stock Awards” column). With respect
to 2016 and 2017, compensation associated with the Cash LTIP and the Performance Share LTIP are both disclosed in
the 2018 Summary Compensation Table.
Name and Principal
Position Year
Salary
($)1
Stock
Awards
($)2
Option
Awards
($)2
Non-Equity
Incentive
Plan Compen-
sation ($)3
Change in
Pension Value
and Nonqual-
ified Deferred
Compensation
Earnings ($)4
All Other
Compensation
($)5 Total ($)
Christopher L. Mapes Chairman, President and Chief Executive Officer
2018 965,000 2,504,772 1,250,009 2,057,400 36,779 204,946 7,018,906
2017 935,000 2,408,020 1,199,989 2,928,906 33,446 187,102 7,692,463
2016 865,429 2,315,716 1,117,327 2,320,266 32,704 45,167 6,696,609
Vincent K. Petrella
Executive Vice President,
Chief Financial Officer
and Treasurer
2018 500,0006 584,470 291,664 729,6006 33,485 173,595 2,312,814
2017 485,000 1,053,455 275,030 952,004 169,120 195,137 3,129,746
2016 453,229 569,772 274,971 1,053,730 848,537 30,664 3,230,903
George D. Blankenship
Executive Vice President,
President, Americas
Welding
2018 500,000 480,892 240,008 677,835 30,101 155,650 2,084,486
2017 500,000 451,238 225,009 869,759 147,410 142,285 2,335,701
2016 477,083 459,306 221,696 749,942 1,359,141 27,735 3,294,903
Steven B. Hedlund
Executive Vice President,
President, International
Welding
2018 395,000 403,978 176,668 518,796 – 393,691 1,888,133
2017 370,381 356,226 227,608 516,011 – 267,134 1,737,360
2016 337,393 213,956 103,349 416,795 – 27,499 1,098,992
Jennifer I. Ansberry
Executive Vice President,General Counsel and Secretary
2018 394,000 390,736 170,009 444,312 – 104,420 1,503,477
2017 325,000 322,041 119,981 386,111 38,803 67,419 1,259,355
(1) 2016 salaries reflect a temporary 5% base salary reduction through December 1, 2016 as part of Lincoln Electric’s cost-cutting measures.
(2) The amounts reported reflect the grant date fair value under FASB ASC Topic 718 for the RSU and performance share awards and for the stock option grants. The award date fair value disclosed for performance share awards is based upon on target performance.
The amounts shown for stock awards for 2018 represent RSU awards as follows: Mr. Mapes $1,252,386, Mr. Petrella $292,235, Mr. Blankenship $240,446, Mr. Hedlund $227,022, and Ms. Ansberry $220,401. The amounts shown also include performance awards as follows: Mr. Mapes $1,252,386, Mr. Petrella $292,235, Mr. Blankenship $240,446, Mr. Hedlund $176,956, and Ms. Ansberry $170,335.
The maximum performance share award amount with respect to each of the named executive officers is shown in the table below. The amounts reported reflect the grant date fair value under FASB ASC Topic 718 for the performance share awards based on maximum performance.
MENU
/ 5 3L I N C O L N E L E C T R I C : 2 0 1 9 P R O X Y S TA T E M E N T
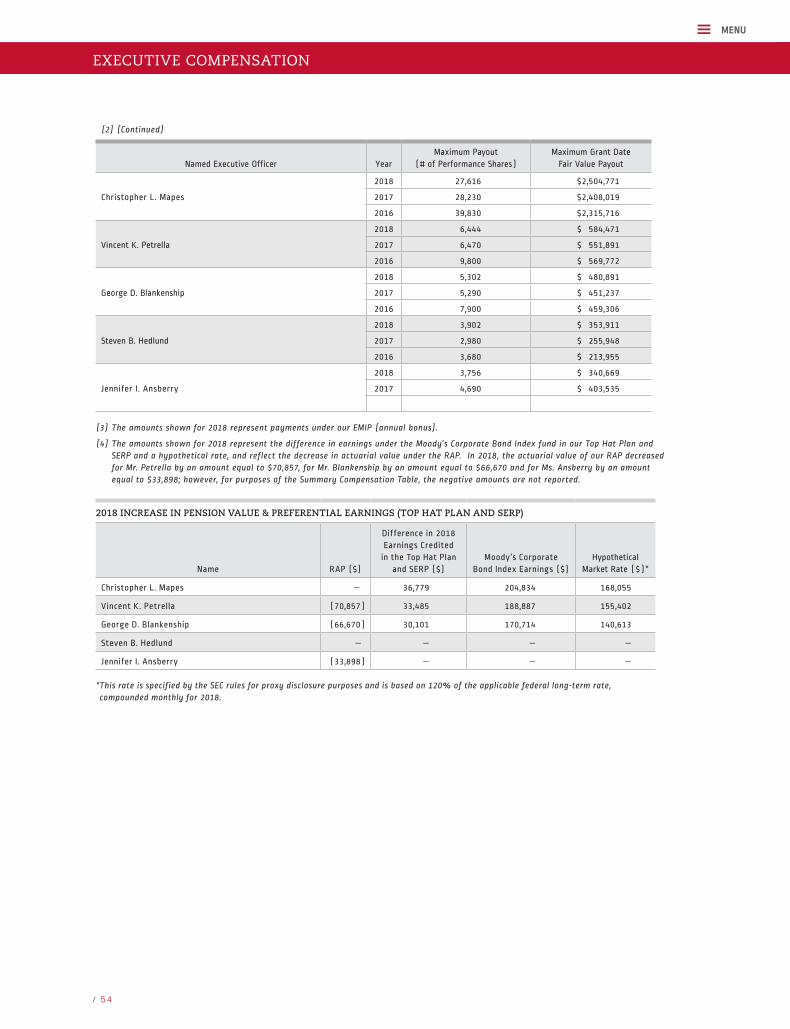
(2) (Continued)
Named Executive Officer YearMaximum Payout
(# of Performance Shares)Maximum Grant Date
Fair Value Payout
Christopher L. Mapes
2018 27,616 $2,504,771
2017 28,230 $2,408,019
2016 39,830 $2,315,716
Vincent K. Petrella
2018 6,444 $ 584,471
2017 6,470 $ 551,891
2016 9,800 $ 569,772
George D. Blankenship
2018 5,302 $ 480,891
2017 5,290 $ 451,237
2016 7,900 $ 459,306
Steven B. Hedlund
2018 3,902 $ 353,911
2017 2,980 $ 255,948
2016 3,680 $ 213,955
Jennifer I. Ansberry
2018 3,756 $ 340,669
2017 4,690 $ 403,535
(3) The amounts shown for 2018 represent payments under our EMIP (annual bonus).
(4) The amounts shown for 2018 represent the difference in earnings under the Moody’s Corporate Bond Index fund in our Top Hat Plan and SERP and a hypothetical rate, and reflect the decrease in actuarial value under the RAP. In 2018, the actuarial value of our RAP decreased for Mr. Petrella by an amount equal to $70,857, for Mr. Blankenship by an amount equal to $66,670 and for Ms. Ansberry by an amount equal to $33,898; however, for purposes of the Summary Compensation Table, the negative amounts are not reported.
2018 INCREASE IN PENSION VALUE & PREFERENTIAL EARNINGS (TOP HAT PLAN AND SERP)
Name RAP ($)
Difference in 2018Earnings Creditedin the Top Hat Plan
and SERP ($)Moody’s Corporate
Bond Index Earnings ($)Hypothetical
Market Rate ($)*
Christopher L. Mapes — 36,779 204,834 168,055
Vincent K. Petrella (70,857) 33,485 188,887 155,402
George D. Blankenship (66,670) 30,101 170,714 140,613
Steven B. Hedlund — — — —
Jennifer I. Ansberry (33,898) — — —
* This rate is specified by the SEC rules for proxy disclosure purposes and is based on 120% of the applicable federal long-term rate, compounded monthly for 2018.
EXECUTIVE COMPENSATION
MENU
/ 5 4

(5) The amounts shown for 2018 are comprised of the following:
2018 ALL OTHER COMPENSATION
Perquisites*
Name
Company Retirement
Contributions ($)(a)
Travel Insurance Premiums
($)
Financial Planning
($)
Physical Examination
($)Club Dues
($)
Spousal Travel ($)
Standard Expatriate Benefits
($)(b)
Total All Other Compensation
($)
Christopher L. Mapes 175,042 1,235 12,327 — 14,302 2,040 — 204,946
Vincent K. Petrella 145,390 1,235 12,318 3,000 11,262 390 — 173,595
George D. Blankenship 141,081 1,235 11,103 — — 2,231 — 155,650
Steven B. Hedlund 49,258 1,235 10,765 — — 2,188 330,245 393,691
Jennifer I. Ansberry 89,416 1,235 13,491 — — 278 — 104,420
*The methodology for computing the aggregate incremental cost for the perquisites is the amount that is imputed to the individual as taxable income.
(a) Includes amounts contributed to both the 401(k) Plan and the Restoration Plan.
(b) The expatriate benefits shown relate to Mr. Hedlund’s current international assignment and are provided to all U.S. employees who take an international assignment. Amounts are converted to U.S. dollars on a monthly basis based on a month-end conversion price, in local currency, as reported by Bloomberg. The conversion price for Pound Sterling was between £1.2756 to £1.4192 to $1.00 during the period in 2018 that Mr. Hedlund was receiving expatriate benefits. Mr. Hedlund’s international assignment included housing, education, taxes and standard allow-ances related to relocation and other assignment payments under our standard expatriate package for all employees. The portion of such amount that relates to tax equalization payments is $93,343.
(6) Mr. Petrella deferred 25% of his 2018 base salary and 50% of his 2018 EMIP bonus under our Top Hat Plan.
Additional Employment Terms for the CEO
Upon joining Lincoln Electric in 2011, Mr. Mapes received certain compensation, a portion of which consisted of
RSUs (52,498 RSUs) that represented a special executive retention and retirement replacement award valued at
$1,650,000. Mr. Mapes is not a participant in either our RAP or SERP.
On December 31, 2012, Mr. Mapes was appointed President and CEO. In connection with his appointment,
Mr. Mapes received a special retirement replacement and executive retention award of 33,161 RSUs valued at
$1,608,000 and we increased his Cash LTIP targets, on a pro-rata basis.
The value of Mr. Mapes’ awards discussed above was intended to provide comparable, competitive retention and
retirement benefits for a senior level executive of a manufacturing company but were delivered in a form (namely
RSUs) that require strong financial performance (share price appreciation) to deliver the intended value. This differs
from the RAP and SERP which require only continuous service. The special retirement replacement and executive
retention awards for both 2011 and 2012 vested at a rate of 20% over five years. They were not eligible for acceler-
ated vesting upon achievement of company performance objectives. Upon vesting, these RSU awards were deferred
into our Top Hat Plan until Mr. Mapes’ retirement from Lincoln Electric.
The remainder of the RSU awards and the stock options provided to Mr. Mapes are subject to our ordinary terms.
For 2018, Mr. Mapes’ salary and bonus accounted for 43.1% of his compensation reported in the 2018 Summary
Compensation Table, based on the value of his 2018 base salary and 2018 actual EMIP (or bonus).
Additional Employment Terms for the Other NEOs
For 2018, Mr. Petrella’s salary and bonus accounted for 53.2% of his compensation reported in the 2018 Summary
Compensation Table, Mr. Blankenship’s salary and bonus accounted for 56.5% of his compensation reported in the
2018 Summary Compensation Table, Mr. Hedlund’s salary and bonus accounted for 48.4% of his compensation
reported in the 2018 Summary Compensation Table and Ms. Ansberry’s salary and bonus accounted for 55.8% of
her compensation reported in the 2018 Summary Compensation Table. The above percentages were based, in each
case, on the value of the executive’s 2018 base salary and 2018 actual EMIP (or bonus).
MENU
/ 5 5L I N C O L N E L E C T R I C : 2 0 1 9 P R O X Y S TA T E M E N T
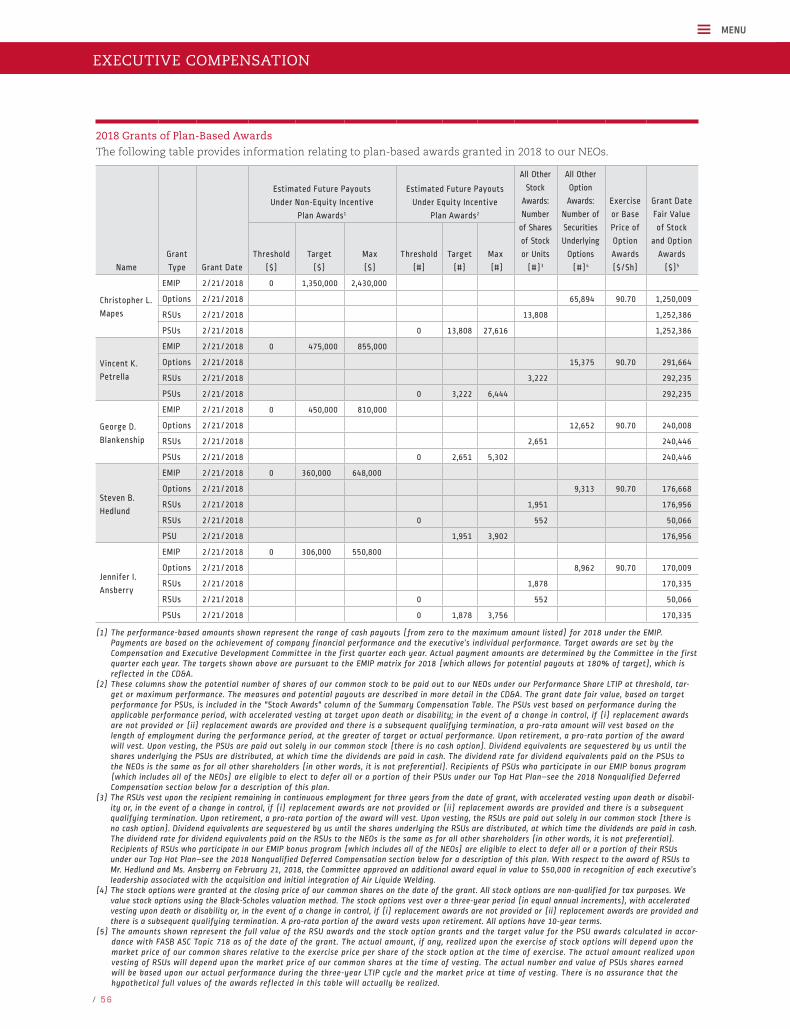
2018 Grants of Plan-Based Awards
The following table provides information relating to plan-based awards granted in 2018 to our NEOs.
Estimated Future Payouts
Under Non-Equity Incentive
Plan Awards1
Estimated Future Payouts
Under Equity Incentive
Plan Awards2
All Other
Stock
Awards:
Number
of Shares
of Stock
or Units
(#)3
All Other
Option
Awards:
Number of
Securities
Underlying
Options
(#)4
Exercise
or Base
Price of
Option
Awards
($/Sh)
Grant Date
Fair Value
of Stock
and Option
Awards
($)5Name
Grant
Type Grant Date
Threshold
($)
Target
($)
Max
($)
Threshold
(#)
Target
(#)
Max
(#)
Christopher L.
Mapes
EMIP 2/21/2018 0 1,350,000 2,430,000
Options 2/21/2018 65,894 90.70 1,250,009
RSUs 2/21/2018 13,808 1,252,386
PSUs 2/21/2018 0 13,808 27,616 1,252,386
Vincent K.
Petrella
EMIP 2/21/2018 0 475,000 855,000
Options 2/21/2018 15,375 90.70 291,664
RSUs 2/21/2018 3,222 292,235
PSUs 2/21/2018 0 3,222 6,444 292,235
George D.
Blankenship
EMIP 2/21/2018 0 450,000 810,000
Options 2/21/2018 12,652 90.70 240,008
RSUs 2/21/2018 2,651 240,446
PSUs 2/21/2018 0 2,651 5,302 240,446
Steven B.
Hedlund
EMIP 2/21/2018 0 360,000 648,000
Options 2/21/2018 9,313 90.70 176,668
RSUs 2/21/2018 1,951 176,956
RSUs 2/21/2018 0 552 50,066
PSU 2/21/2018 1,951 3,902 176,956
Jennifer I.
Ansberry
EMIP 2/21/2018 0 306,000 550,800
Options 2/21/2018 8,962 90.70 170,009
RSUs 2/21/2018 1,878 170,335
RSUs 2/21/2018 0 552 50,066
PSUs 2/21/2018 0 1,878 3,756 170,335
(1) The performance-based amounts shown represent the range of cash payouts (from zero to the maximum amount listed) for 2018 under the EMIP. Payments are based on the achievement of company financial performance and the executive’s individual performance. Target awards are set by the Compensation and Executive Development Committee in the first quarter each year. Actual payment amounts are determined by the Committee in the first quarter each year. The targets shown above are pursuant to the EMIP matrix for 2018 (which allows for potential payouts at 180% of target), which is reflected in the CD&A.
(2) These columns show the potential number of shares of our common stock to be paid out to our NEOs under our Performance Share LTIP at threshold, tar-get or maximum performance. The measures and potential payouts are described in more detail in the CD&A. The grant date fair value, based on target performance for PSUs, is included in the "Stock Awards" column of the Summary Compensation Table. The PSUs vest based on performance during the applicable performance period, with accelerated vesting at target upon death or disability; in the event of a change in control, if (i) replacement awards are not provided or (ii) replacement awards are provided and there is a subsequent qualifying termination, a pro-rata amount will vest based on the length of employment during the performance period, at the greater of target or actual performance. Upon retirement, a pro-rata portion of the award will vest. Upon vesting, the PSUs are paid out solely in our common stock (there is no cash option). Dividend equivalents are sequestered by us until the shares underlying the PSUs are distributed, at which time the dividends are paid in cash. The dividend rate for dividend equivalents paid on the PSUs to the NEOs is the same as for all other shareholders (in other words, it is not preferential). Recipients of PSUs who participate in our EMIP bonus program (which includes all of the NEOs) are eligible to elect to defer all or a portion of their PSUs under our Top Hat Plan–see the 2018 Nonqualified Deferred Compensation section below for a description of this plan.
(3) The RSUs vest upon the recipient remaining in continuous employment for three years from the date of grant, with accelerated vesting upon death or disabil-ity or, in the event of a change in control, if (i) replacement awards are not provided or (ii) replacement awards are provided and there is a subsequent qualifying termination. Upon retirement, a pro-rata portion of the award will vest. Upon vesting, the RSUs are paid out solely in our common stock (there is no cash option). Dividend equivalents are sequestered by us until the shares underlying the RSUs are distributed, at which time the dividends are paid in cash. The dividend rate for dividend equivalents paid on the RSUs to the NEOs is the same as for all other shareholders (in other words, it is not preferential). Recipients of RSUs who participate in our EMIP bonus program (which includes all of the NEOs) are eligible to elect to defer all or a portion of their RSUs under our Top Hat Plan–see the 2018 Nonqualified Deferred Compensation section below for a description of this plan. With respect to the award of RSUs to Mr. Hedlund and Ms. Ansberry on February 21, 2018, the Committee approved an additional award equal in value to $50,000 in recognition of each executive’s leadership associated with the acquisition and initial integration of Air Liquide Welding.
(4) The stock options were granted at the closing price of our common shares on the date of the grant. All stock options are non-qualified for tax purposes. We value stock options using the Black-Scholes valuation method. The stock options vest over a three-year period (in equal annual increments), with accelerated vesting upon death or disability or, in the event of a change in control, if (i) replacement awards are not provided or (ii) replacement awards are provided and there is a subsequent qualifying termination. A pro-rata portion of the award vests upon retirement. All options have 10-year terms.
(5) The amounts shown represent the full value of the RSU awards and the stock option grants and the target value for the PSU awards calculated in accor-dance with FASB ASC Topic 718 as of the date of the grant. The actual amount, if any, realized upon the exercise of stock options will depend upon the market price of our common shares relative to the exercise price per share of the stock option at the time of exercise. The actual amount realized upon vesting of RSUs will depend upon the market price of our common shares at the time of vesting. The actual number and value of PSUs shares earned will be based upon our actual performance during the three-year LTIP cycle and the market price at time of vesting. There is no assurance that the hypothetical full values of the awards reflected in this table will actually be realized.
EXECUTIVE COMPENSATION
MENU
/ 5 6

Holdings of Equity-Related Interests
The following provides information relating to exercisable and unexercisable stock options, RSUs and performance
shares at December 31, 2018.
Outstanding Equity Awards at December 31, 2018
Option Awards Stock Awards
Name Grant Date
Number of
Securities
Underlying
Unexercised
Options (#)
Exercisable1
Number of
Securities
Underlying
Unexercised
Options (#)
Unexercisable1
Equity
Incentive
Plan
Awards
No. of
Securities
Underlying
Unexercised
Unearned
Options
Option
Exercise
Price
($/sh)
Option
Expiration
Date
Number of
Shares or
Units of
Stock That
Have Not
Vested
(#)2
Market
Value of
Shares or
Units of
Stock That
Have Not
Vested
($)3
Equity
Incentive
Plan
Awards:
Number of
Unearned
Shares,
Units or
Other
Rights that
Have Not
Vested
(#)4
Equity
Incentive
Plan
Awards:
Market or
Payout
Value of
Unearned
Shares,
Units, or
Other
Rights That
Have Not
Vested ($)3
Christopher L.
Mapes
11/2/2011 28,500 — — $35.55 11/2/2021 – – – –
12/13/2012 47,480 — — 47.91 12/13/2022 – – – –
12/16/2013 44,040 — — 71.30 12/16/2023 – – – –
2/5/2015 66,550 — — 69.67 2/5/2025 16,340 1,288,409 – –
2/17/2016 59,352 29,678 — 58.14 2/17/2026 19,915 1,570,298 19,915 1,570,298
2/22/2017 22,870 45,740 — 85.30 2/22/2027 14,115 1,112,968 14,115 1,112,968
2/21/2018 65,894 90.70 2/21/2028 13,808 1,088,761 13,808 1,088,761
Vincent K.
Petrella
11/2/2011 19,250 – – 35.55 11/2/2021 – – – –
12/13/2012 16,620 – – 47.91 12/13/2022 – – – –
12/16/2013 13,440 – – 71.30 12/16/2023 – – – –
2/5/2015 16,380 – – 69.67 2/5/2025 4,020 316,977 – –
2/17/2016 14,606 7,304 – 58.14 2/17/2026 4,900 386,365 4,900 386,365
2/22/2017 5,241 10,484 – 85.30 2/22/2027 9,115 718,718 3,235 255,080
2/21/2018 15,375 90.70 2/21/2028 3,222 254,055 3,222 254,055
George D.
Blankenship
12/13/2012 11,870 – – 47.91 12/13/2022 – – – –
12/16/2013 10,570 – – 71.30 12/16/2023 – – – –
2/5/2015 13,200 — – 69.67 2/5/2025 3,240 255,474 – –
2/17/2016 11,776 5,889 – 58.14 2/17/2026 3,950 311,458 3,950 311,458
2/22/2017 4,288 8,577 – 85.30 2/22/2027 2,645 208,558 2,645 208,558
2/21/2018 12,652 90.70 2/21/2028 2,651 209,031 2,651 209,031
Steven B.
Hedlund
11/2/2011 6,010 – – 35.55 11/2/2021 – – – –
12/13/2012 6,530 – – 47.91 12/13/2022 – – – –
4/24/2013 – – – – 4/24/2023 6,410 505,429 – –
12/16/2013 5,860 – – 71.30 12/16/2023 – – – –
2/5/2015 6155 — – 69.67 2/5/2025 1,510 119,064 – –
2/17/2016 5,490 2,745 – 58.14 2/17/2026 1,840 145,084 1,840 145,084
2/22/2017 2,001 4,004 – 85.30 2/22/2027 1,235 97,380 1,235 97,380
5/24/2017 2,291 4,584 – 88.74 5/24/2027 1,385 109,207 255 20,107
2/21/2018 9,313 90.70 2/21/2028 2,503 197,362 1,951 153,836
Jennifer I.
Ansberry
12/16/2013 2,440 – – 71.30 12/16/2023 – – – –
7/24/2014 442 – – 67.18 7/24/2024 112 8,831 – –
2/5/2015 3,720 – – 69.67 2/5/2025 915 72,148 – –
2/17/2016 1,991 1,993 – 58.14 2/17/2026 1,335 105,265 – –
2/22/2017 2,286 4,574 – 85.30 2/22/2027 1,410 111,179 1,410 111,179
3/3/2017 – – – – – – – 935 73,725
2/21/2018 – 8,962 – 90.70 2/21/2028 2,430 191,606 1,878 148,080
MENU
/ 5 7L I N C O L N E L E C T R I C : 2 0 1 9 P R O X Y S TA T E M E N T

(1) Stock options vest in three equal annual installments, commencing on the first anniversary of the date of the grant.
(2) Amounts shown in this column represent RSU awards. 2016 RSU awards, 2017 RSU awards and 2018 RSU awards vest in full three years from the date of grant. The RSU awards granted prior to 2016 generally vest in full five years from the date of grant, but are subject to accelerated vesting in three years if the targets are met for the applicable LTIP cycle. The RSU award granted to Mr. Hedlund in 2013 vests over seven years following his attainment of age 55. For more information on our RSU awards under our 2006 and 2015 Equity and Performance Incentive Plans, see the dis-cussion provided in the Grants of Plan-Based Award Table.
(3) The amounts shown in this column represent RSU and PSU awards pursuant to our 2006 and 2015 Equity and Performance Incentive Plans. Value is calculated using the close price of our common stock on the last trading day of 2018.
(4) This column shows the target number of performance shares (PSUs) awarded in 2016, 2017 and 2018. The payout can range from 0 to 200% of the target and is based upon performance during the three-year cycle ending on December 31, 2018 (with respect to PSUs awarded in 2016), December 31, 2019 (with respect to PSUs awarded in 2017), and December 31, 2020 (with respect to PSUs awarded in 2018), as determined by the Compensation and Executive Development Committee. See the CD&A on how performance share payouts are determined.
2018 Stock Option Exercises and Stock Vested Table
The following table provides information on stock options exercised, as well as RSUs that vested during 2018.
Option Awards Stock Awards
Name
Number of Shares
Acquired on Exercise (#)
Value Realized on
Exercise ($)
Number of Shares Acquired
on Vesting (#)
Value Realized on
Vesting ($)
Christopher L. Mapes — — 10,7201 927,6022
Vincent K. Petrella — — 3,2703 282,9534
George D. Blankenship — — 2,5705 222,3826
Steven B. Hedlund — — 1,4307 123,7388
Jennifer I. Ansberry — — 5909 51,05310
(1) Mr. Mapes remitted 4,900 shares to us in satisfaction of his tax withholding obligations.
(2) Total includes $67,780 in cash attributable to dividends earned on RSUs paid directly to Mr. Mapes.
(3) Mr. Petrella remitted 1,495 shares to us in satisfaction of his tax withholding obligations.
(4) Total includes $20,666 in cash attributable to dividends earned on RSUs paid directly to Mr. Petrella.
(5) Mr. Blankenship remitted 1,126 shares to us in satisfaction of his tax withholding obligations.
(6) Total includes $16,242 in cash attributable to dividends earned on RSUs paid directly to Mr. Blankenship.
(7) Mr. Hedlund remitted 486 shares to us in satisfaction of his tax withholding obligations.
(8) Total includes $9,038 in cash attributable to dividends earned on RSUs paid directly to Mr. Hedlund.
(9) Ms. Ansberry remitted 182 shares to us in satisfaction of her tax withholding obligations.
(10) Total includes $3,729 in cash attributable to dividends earned on RSUs paid directly to Ms. Ansberry.
EXECUTIVE COMPENSATION
MENU
/ 5 8
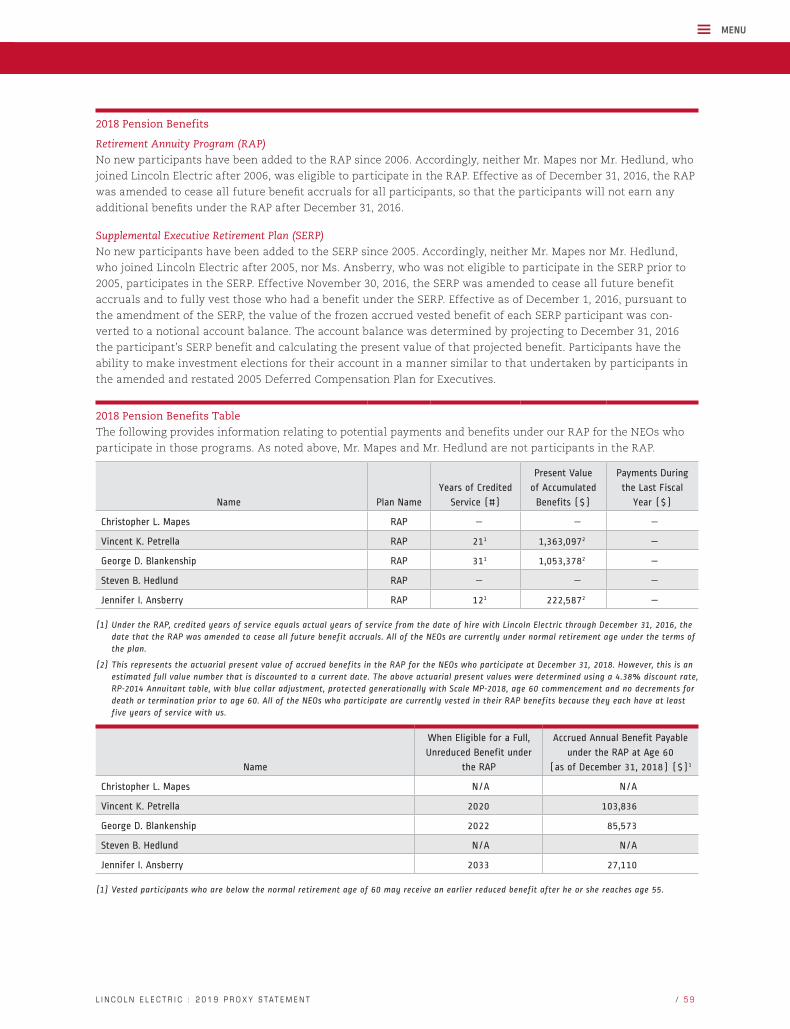
2018 Pension Benefits
Retirement Annuity Program (RAP)
No new participants have been added to the RAP since 2006. Accordingly, neither Mr. Mapes nor Mr. Hedlund, who
joined Lincoln Electric after 2006, was eligible to participate in the RAP. Effective as of December 31, 2016, the RAP
was amended to cease all future benefit accruals for all participants, so that the participants will not earn any
additional benefits under the RAP after December 31, 2016.
Supplemental Executive Retirement Plan (SERP)
No new participants have been added to the SERP since 2005. Accordingly, neither Mr. Mapes nor Mr. Hedlund,
who joined Lincoln Electric after 2005, nor Ms. Ansberry, who was not eligible to participate in the SERP prior to
2005, participates in the SERP. Effective November 30, 2016, the SERP was amended to cease all future benefit
accruals and to fully vest those who had a benefit under the SERP. Effective as of December 1, 2016, pursuant to
the amendment of the SERP, the value of the frozen accrued vested benefit of each SERP participant was con-
verted to a notional account balance. The account balance was determined by projecting to December 31, 2016
the participant’s SERP benefit and calculating the present value of that projected benefit. Participants have the
ability to make investment elections for their account in a manner similar to that undertaken by participants in
the amended and restated 2005 Deferred Compensation Plan for Executives.
2018 Pension Benefits Table
The following provides information relating to potential payments and benefits under our RAP for the NEOs who
participate in those programs. As noted above, Mr. Mapes and Mr. Hedlund are not participants in the RAP.
Name Plan Name
Years of Credited
Service (#)
Present Value
of Accumulated
Benefits ($)
Payments During
the Last Fiscal
Year ($)
Christopher L. Mapes RAP — — —
Vincent K. Petrella RAP 211 1,363,0972 —
George D. Blankenship RAP 311 1,053,3782 —
Steven B. Hedlund RAP — — —
Jennifer I. Ansberry RAP 121 222,5872 —
(1) Under the RAP, credited years of service equals actual years of service from the date of hire with Lincoln Electric through December 31, 2016, the date that the RAP was amended to cease all future benefit accruals. All of the NEOs are currently under normal retirement age under the terms of the plan.
(2) This represents the actuarial present value of accrued benefits in the RAP for the NEOs who participate at December 31, 2018. However, this is an estimated full value number that is discounted to a current date. The above actuarial present values were determined using a 4.38% discount rate, RP-2014 Annuitant table, with blue collar adjustment, protected generationally with Scale MP-2018, age 60 commencement and no decrements for death or termination prior to age 60. All of the NEOs who participate are currently vested in their RAP benefits because they each have at least five years of service with us.
Name
When Eligible for a Full,
Unreduced Benefit under
the RAP
Accrued Annual Benefit Payable
under the RAP at Age 60
(as of December 31, 2018) ($)1
Christopher L. Mapes N/A N/A
Vincent K. Petrella 2020 103,836
George D. Blankenship 2022 85,573
Steven B. Hedlund N/A N/A
Jennifer I. Ansberry 2033 27,110
(1) Vested participants who are below the normal retirement age of 60 may receive an earlier reduced benefit after he or she reaches age 55.
MENU
/ 5 9L I N C O L N E L E C T R I C : 2 0 1 9 P R O X Y S TA T E M E N T

2018 Deferred Compensation Benefits
Deferred Compensation Plan (Top Hat Plan)
Our amended and restated Deferred Compensation Plan for Executives (Top Hat Plan) is designed to be a “top-hat”
plan that complies with Section 409A of the Internal Revenue Code. Participation is limited to management and
highly compensated employees as approved by the Committee. Key elements of the Top Hat Plan are as follows:
• A participant may elect to defer a specified dollar amount or percentage of compensation, up to eighty percent
(80%) of his or her base salary and bonus amounts for a deferral period.
• A participant may elect to defer a specified percentage of RSUs or performance shares, provided the amount can-
not exceed one hundred percent (100%) of his or her RSUs or performance shares for the deferral period. Any
RSUs or performance shares that are deferred are paid out in common shares (not cash) when distributed from
the plan, subject to a participant’s right to diversify RSUs or performance shares deferred, as discussed below.
• Deferrals are credited to participant accounts based on their elections, and accounts are credited with earnings
based on the investment elections made by the participant.
• There are currently 28 investment options, 27 of which mirror the third-party managed investment funds avail-
able under our 401(k) Plan and one, Moody’s Corporate Bond Average Index, which preserves an investment
option previously available under our old deferred compensation plan. All of the third-party managed investment
options track precisely with the returns reported by the investment managers for the funds to which they are
associated. The Moody’s Corporate Bond Average Index is derived from pricing data for approximately 100 corpo-
rate bonds in the U.S. market, each with current outstandings of over $100 million.
• RSUs and performance shares deferrals are initially invested solely in a Lincoln Electric Stock fund, with no other
plan deferrals eligible for investment into that fund. The plan permits a participant to re-allocate RSUs and perfor-
mance shares that are deferred on the later of 6 months after the date on which the amounts are allocated to the
participant’s account or the date that the participant has satisfied his or her stock ownership guidelines for officers.
• The plan includes a recovery of funds provision consistent with the requirements of Dodd-Frank.
• Plan distributions are permitted only in the event of separation from service, disability, death, a change in con-
trol of the employer or an unforeseeable emergency. Distributions also can be made at a specified time or under
a fixed schedule, as stated in the plan at the time of the deferral.
• Amounts deferred under the plan are distributed when a participant terminates employment with us or elects to
receive an in-service distribution, which is available to assist participants in meeting shorter-term financial
needs. In-service distributions are payable in a lump-sum payment on a date that is at least one calendar year
after the date of the applicable deferral period/plan year. Distributions following death or retirement may be
made by payment in five, ten or fifteen annual installments or by payment of a single lump sum, except that
accounts valued at less than $35,000 are distributed in a single lump-sum payment. The retirement distribution
is available for participants starting at age 55. The plan administrator, in its sole discretion, may also allow for
financial hardship distributions in certain circumstances. Loans are not permitted under the plan.
Restoration Plan
Our Restoration Plan is designed to provide deferred compensation for eligible employees whose annual compensa-
tion is expected to be in excess of the Internal Revenue Code limit on compensation (Code Limit) applicable to the
401(k) Plan. Key elements of the Restoration Plan are as follows:
• Each participant’s account is credited each year with deferred amounts of (1) a matching employer contribution
equal to 3% of annual compensation that is in excess of the Code Limit; and (2) a non-elective employer contribu-
tion of 3% of annual compensation that is in excess of the Code Limit.
• Certain employees affected by the RAP freeze are also eligible to receive employer contributions equal to 6% of
annual compensation in excess of the Code Limit for a minimum period of five years, up to the end of the year in
which they complete 30 years of service.
• All amounts deferred under the Restoration Plan are fully vested at all times. Amounts credited to participants’
accounts under the Restoration Plan will be payable in cash in accordance with the distribution provisions of the
Restoration Plan.
EXECUTIVE COMPENSATION
MENU
/ 6 0

• Upon a participant’s separation from service prior to age 55, distribution of the amount credited to the partici-
pant’s account will be made to the participant in a single lump sum payment on the first business day of the sev-
enth month immediately following the participant’s separation from service. Upon a participant’s separation
from service on or after age 55, distribution of the amount credited to the participant’s account will be made or
commence on the first business day of the seventh month immediately following the participant’s separation
from service in the form of (1) a single lump sum payment; or (2) substantially equal annual installments over a
period of at least two but not more than 15 years, as elected by the participant.
• If a participant’s death occurs prior to the distribution of the entire amount credited to his or her account, distribution
of the participant’s account will be made to the participant’s beneficiary in the form of a single lump sum payment.
• Distributions under the Restoration Plan may also be made on account of a participant’s unforeseeable emergency.
• Distributions under the Restoration Plan will be made upon a change in control event within the meaning of
Section 409A of the Internal Revenue Code.
2018 Nonqualified Deferred Compensation Tables
The following three tables provide deferred compensation information for 2018 for the NEOs.
Top Hat Plan
Name
Executive
Contributions in
Last Fiscal Year ($)
Registrant
Contributions in
Last Fiscal Year ($)
Aggregate Earnings in
Last Fiscal Year ($)
Aggregate
Withdrawals/
Distributions ($)
Aggregate
Balance at Last
Fiscal Year-End ($)
Christopher L. Mapes 878,671 — (838,656)1 — 12,412,2342
Vincent K. Petrella 425,000 — 39,2993 — 2,638,5522
George D. Blankenship 540,540 — (59,850) — 614,3602
Steven B. Hedlund — — (3,096) — 39,6542
Jennifer I. Ansberry — — — — —
(1) Of the amount reported, $36,779 is included as compensation for 2018 in the “Change in Pension Value and Nonqualified Deferred Compensation Earnings” column of the Summary Compensation Table above and is described in its footnotes.
(2) The portions of the amount reported that relate to deferral contributions in prior years have all been reported in the Summary Compensation Table in those years to the extent the individual was a NEO for those years.
(3) Of the amount reported, $16,083 is included as compensation for 2018 in the “Change in Pension Value and Nonqualified Deferred Compensation Earnings” column of the Summary Compensation Table above and is described in its footnotes.
SERP
Effective November 30, 2016, the SERP was amended to cease all future benefit accruals and to fully vest the
benefits to each participant who had a benefit under the SERP. The value of the frozen accrued vested benefit
was converted into an account balance as of December 1, 2016. The table below reflects the earnings during 2018
related to the SERP. Each participant has the ability to make investment elections for their account balance in a
manner similar to that undertaken by participants in the Top Hat Plan.
Name
Executive
Contributions in
Last Fiscal Year ($)
Registrant
Contributions in
Last Fiscal Year ($)
Aggregate Earnings in
Last Fiscal Year ($)
Aggregate
Withdrawals/
Distributions ($)
Aggregate
Balance at Last
Fiscal Year-End ($)
Christopher L. Mapes — — — — —
Vincent K. Petrella — — 98,8051 — 2,373,1783
George D. Blankenship — — 170,7142 — 4,099,4363
Stephen B. Hedlund — — — — —
Jennifer I. Ansberry — — — — —
(1) Of the amount reported, $17,402 is included as compensation for 2018 in the “Change in Pension Value and Nonqualified Deferred Compensation Earnings” column of the Summary Compensation Table above and is described in its footnotes.
(2) Of the amount reported, $30,101 is included as compensation for 2018 in the “Change in Pension Value and Nonqualified Deferred Compensation Earnings” column of the Summary Compensation Table above and is described in its footnotes.
(3) The portions of the amount reported that relate to deferral contributions in prior years have all been reported in the Summary Compensation Table in those years to the extent the individual was a NEO for those years.
MENU
/ 6 1L I N C O L N E L E C T R I C : 2 0 1 9 P R O X Y S TA T E M E N T
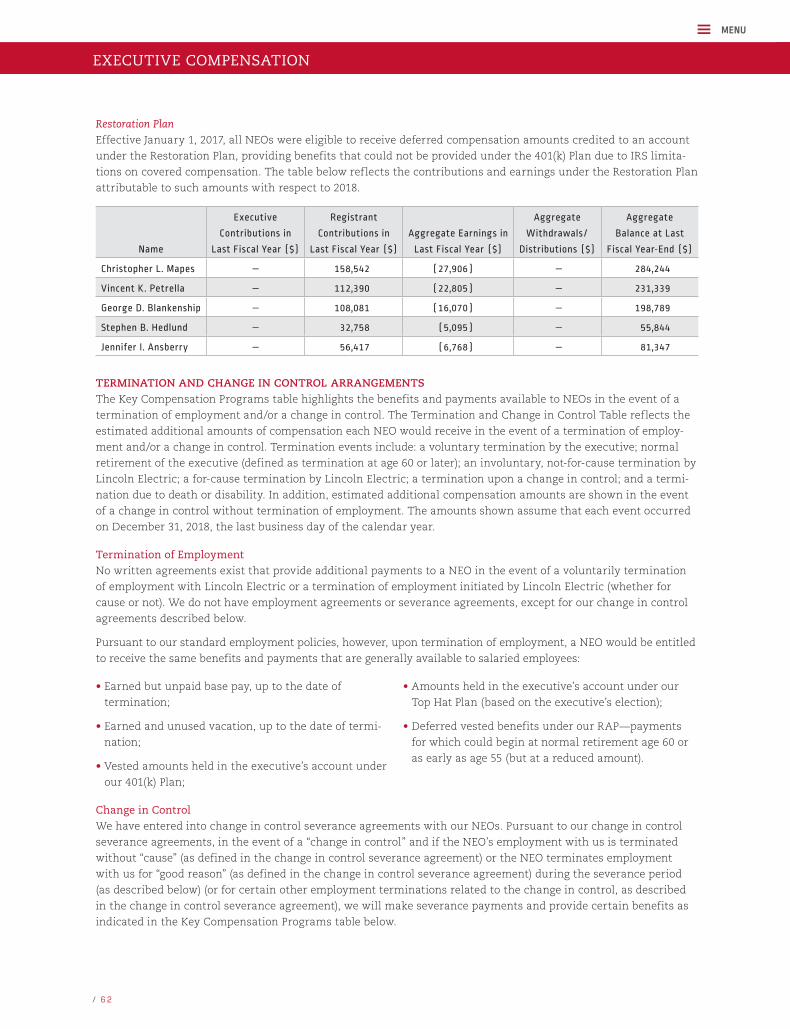
Restoration Plan
Effective January 1, 2017, all NEOs were eligible to receive deferred compensation amounts credited to an account
under the Restoration Plan, providing benefits that could not be provided under the 401(k) Plan due to IRS limita-
tions on covered compensation. The table below reflects the contributions and earnings under the Restoration Plan
attributable to such amounts with respect to 2018.
Name
Executive
Contributions in
Last Fiscal Year ($)
Registrant
Contributions in
Last Fiscal Year ($)
Aggregate Earnings in
Last Fiscal Year ($)
Aggregate
Withdrawals/
Distributions ($)
Aggregate
Balance at Last
Fiscal Year-End ($)
Christopher L. Mapes — 158,542 (27,906) — 284,244
Vincent K. Petrella — 112,390 (22,805) — 231,339
George D. Blankenship — 108,081 (16,070) — 198,789
Stephen B. Hedlund — 32,758 (5,095) — 55,844
Jennifer I. Ansberry — 56,417 (6,768) — 81,347
TERMINATION AND CHANGE IN CONTROL ARRANGEMENTSThe Key Compensation Programs table highlights the benefits and payments available to NEOs in the event of a
termination of employment and/or a change in control. The Termination and Change in Control Table reflects the
estimated additional amounts of compensation each NEO would receive in the event of a termination of employ-
ment and/or a change in control. Termination events include: a voluntary termination by the executive; normal
retirement of the executive (defined as termination at age 60 or later); an involuntary, not-for-cause termination by
Lincoln Electric; a for-cause termination by Lincoln Electric; a termination upon a change in control; and a termi-
nation due to death or disability. In addition, estimated additional compensation amounts are shown in the event
of a change in control without termination of employment. The amounts shown assume that each event occurred
on December 31, 2018, the last business day of the calendar year.
Termination of Employment
No written agreements exist that provide additional payments to a NEO in the event of a voluntarily termination
of employment with Lincoln Electric or a termination of employment initiated by Lincoln Electric (whether for
cause or not). We do not have employment agreements or severance agreements, except for our change in control
agreements described below.
Pursuant to our standard employment policies, however, upon termination of employment, a NEO would be entitled
to receive the same benefits and payments that are generally available to salaried employees:
• Earned but unpaid base pay, up to the date of
termination;
• Earned and unused vacation, up to the date of termi-
nation;
• Vested amounts held in the executive’s account under
our 401(k) Plan;
• Amounts held in the executive’s account under our
Top Hat Plan (based on the executive’s election);
• Deferred vested benefits under our RAP—payments
for which could begin at normal retirement age 60 or
as early as age 55 (but at a reduced amount).
Change in Control
We have entered into change in control severance agreements with our NEOs. Pursuant to our change in control
severance agreements, in the event of a “change in control” and if the NEO’s employment with us is terminated
without “cause” (as defined in the change in control severance agreement) or the NEO terminates employment
with us for “good reason” (as defined in the change in control severance agreement) during the severance period
(as described below) (or for certain other employment terminations related to the change in control, as described
in the change in control severance agreement), we will make severance payments and provide certain benefits as
indicated in the Key Compensation Programs table below.
EXECUTIVE COMPENSATION
MENU
/ 6 2
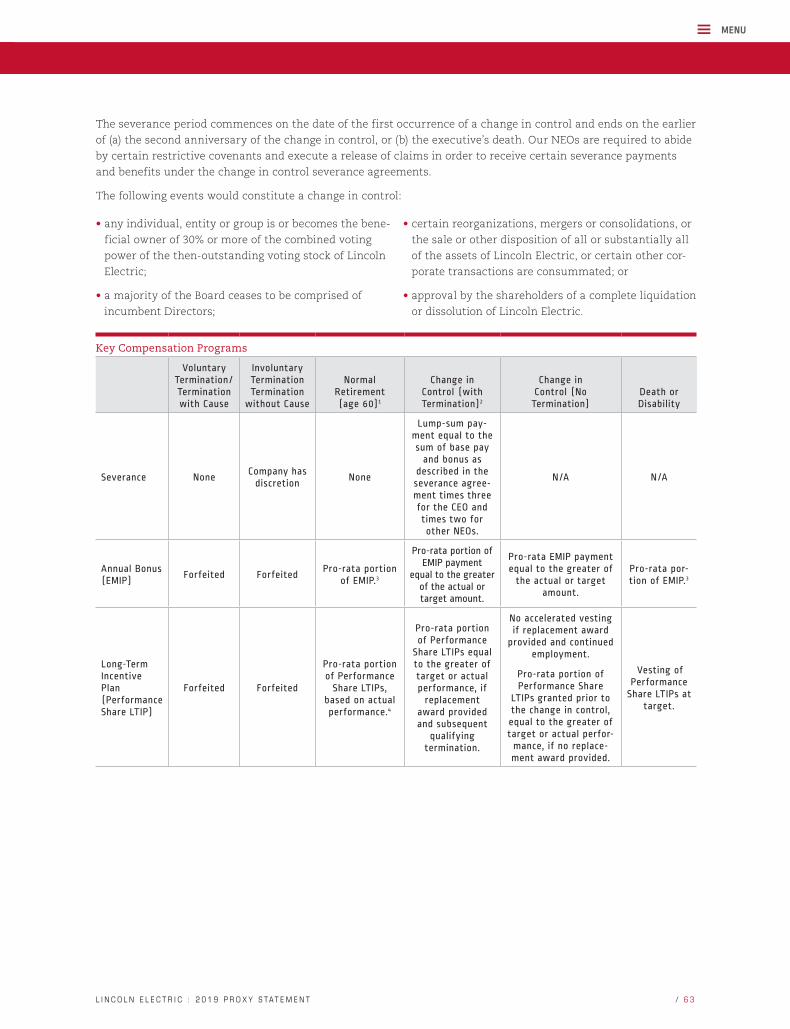
The severance period commences on the date of the first occurrence of a change in control and ends on the earlier
of (a) the second anniversary of the change in control, or (b) the executive’s death. Our NEOs are required to abide
by certain restrictive covenants and execute a release of claims in order to receive certain severance payments
and benefits under the change in control severance agreements.
The following events would constitute a change in control:
• any individual, entity or group is or becomes the bene-
ficial owner of 30% or more of the combined voting
power of the then-outstanding voting stock of Lincoln
Electric;
• a majority of the Board ceases to be comprised of
incumbent Directors;
• certain reorganizations, mergers or consolidations, or
the sale or other disposition of all or substantially all
of the assets of Lincoln Electric, or certain other cor-
porate transactions are consummated; or
• approval by the shareholders of a complete liquidation
or dissolution of Lincoln Electric.
Key Compensation Programs
Voluntary Termination/ Termination with Cause
Involuntary Termination Termination
without Cause
Normal Retirement (age 60)1
Change in Control (with Termination)2
Change in Control (No Termination)
Death or Disability
Severance NoneCompany has
discretionNone
Lump-sum pay-ment equal to the sum of base pay
and bonus as described in the severance agree-ment times three for the CEO and times two for other NEOs.
N/A N/A
Annual Bonus (EMIP)
Forfeited ForfeitedPro-rata portion
of EMIP.3
Pro-rata portion of EMIP payment
equal to the greater of the actual or target amount.
Pro-rata EMIP payment equal to the greater of
the actual or target amount.
Pro-rata por-tion of EMIP.3
Long-Term Incentive Plan (Performance Share LTIP)
Forfeited Forfeited
Pro-rata portion of Performance
Share LTIPs, based on actual performance.4
Pro-rata portion of Performance
Share LTIPs equal to the greater of target or actual performance, if
replacement award provided and subsequent
qualifying termination.
No accelerated vesting if replacement award
provided and continued employment.
Pro-rata portion of Performance Share
LTIPs granted prior to the change in control, equal to the greater of target or actual perfor-mance, if no replace-ment award provided.
Vesting of Performance
Share LTIPs at target.
MENU
/ 6 3L I N C O L N E L E C T R I C : 2 0 1 9 P R O X Y S TA T E M E N T

Voluntary Termination/ Termination with Cause
Involuntary Termination Termination
without Cause
Normal Retirement (age 60)1
Change in Control (with
Termination)2
Change in Control (No Termination)
Death or Disability
Stock Options
Unvested stock options
forfeited.
Entitled to exercise
vested stock options for a
period of three months
after termination.6,7
Unvested stock options
forfeited.
Entitled to exercise
vested stock options for a
period of three months
after termination.6,7
Pro-rata vesting of any unvested stock options for all awards on or
after December 1, 2010 with right to exercise such vested options
for the remaining period of the
original 10-year term.5,6
Accelerated vesting of
unvested stock options, if
replacement award provided and subsequent
qualifying termination.
Entitled to exer-cise vested stock
options for a period of three months after termination.6,7
No accelerated vesting if replacement award
provided and continued employment.
Accelerated vesting of unvested stock options granted prior to change in control, if no replace-ment award provided.
Accelerated vesting of unvested
stock options.
Entitled to exercise stock options for a period of one
year after death or three
years after disability.6
RSUs Forfeited ForfeitedPro-rata vesting of RSU awards.
Accelerated vesting of RSU
awards, if replacement
award provided and subsequent
qualifying termination.
No accelerated vesting if replacement award
provided and continued employment.
Accelerated vesting of RSU awards granted
prior to change in con-trol, if no replacement
award provided.
Vesting of RSU awards.
Outplacement None None N/A
Maximum of $100,000 for CEO and $50,000 for the Other NEOs.
N/A N/A
280G Treatment
N/A N/A N/A 8 N/A N/A
Other
Continuing medical and/
or dental coverage
under COBRA, for which the executive would pay
102% of the applicable premium.
Continuing medical and/
or dental coverage
under COBRA, for which the
executive would pay
102% of the applicable premium.
Continuing medical and/or dental coverage as a retiree, with
100% of the premium paid by the executive.
Normal vesting of benefits under
the SERP, pro-vided the execu-
tive is a participant.11
Continuing medical insurance (100% of the premium
paid by the execu-tive) and life insurance for
a period of three years following
the NEO’s termina-tion date.9, 10
9
Continuing medical and/
or dental coverage with 100% of the premium paid by the execu-tive (or his or her surviving dependents).
(1) Subject to any 409A deferred payment requirements.
(2) Termination without Cause or termination for Good Reason. With respect to the Performance Shares LTIP, Stock Options and RSUs, such termination without Cause or termination for Good Reason must occur within a period of two years after the Change in Control to receive the accelerated vesting treatment.
(3) Based on the executive’s period of employment during the calendar year, subject to achievement of the applicable personal and financial goals.
(4) Based on the executive’s periods of employment during each of the open three-year cycles and upon completion of each cycle, subject to achieve-ment of the applicable financial goals.
(5) For awards made prior to December 1, 2010, NEO is entitled to exercise stock options for a period of three years after retirement (after which time the options would expire).
(6) After which time the vested stock options would expire.
(7) Vested options canceled if the executive is terminated for cause or the executive engaged in competitive conduct within six months of termination.
(8) Severance payments reduced to the 280G (excess parachute payment) safe harbor limit, unless the executive would achieve a better after-tax result paying the excise tax imposed on excess parachute payments. No payment, net of taxes, to compensate for any excise tax imposed.
(9) Amounts and/or shares (from vested RSUs or performance shares) held in executives’ accounts under the Top Hat Plan automatically paid out.
(10) No age or service credit under the severance agreement.
(11) Financial planning services for the year of retirement and for one calendar year thereafter.
EXECUTIVE COMPENSATION
MENU
/ 6 4

Termination and Change in Control Table
The following table sets forth estimates of the potential incremental payments to each of our NEOs upon the
specified termination events and upon a change in control without termination of employment, assuming that
each such event took place on the last business day of 2018.
The table does not quantify benefits under plans that are generally available to salaried employees that do not
discriminate in favor of NEOs, including the RAP, the 401(k) Plan, the health care plan and the life insurance plan.
The 2018 annual bonus (EMIP) amounts represent the difference between target EMIP and actual EMIP payments
(as disclosed in the Non-Equity Incentive Plan Compensation column of the 2018 Summary Compensation Table) if
target EMIP exceeds actual EMIP in connection with a hypothetical change in control as of the last business day of
2018. Similarly, the PSU LTIP amounts for 2018 represent the difference between target PSU LTIP and actual PSU
LTIP if target PSU LTIP exceeds actual PSU LTIP if a change in control occurred on the last business day of 2018. For
2018, the PSU LTIP amounts below include the pro-rata portion of the target amounts for the two cycles of the PSU
LTIP (2017-2019 cycle and 2018-2020 cycle) that were open as of the last business day of 2018. The LTIP amounts
below do not include any value for the 2016-2018 actual PSU LTIP, since the cycle paid out above target.
The table below assumes, in the event of a change in control, replacement awards are provided pursuant to the
2015 Equity and Incentive Compensation Plan’s respective Stock Option Agreement, Restricted Stock Unit
Agreement, and Performance Share Agreement (“Agreements”). Pursuant to the Agreements, if the respective
equity awards are not replaced, all outstanding equity awards will accelerate as of the closing date of the change
in control. In the event of a change in control where no replacement awards are provided, the accelerated equity
values are consistent with the accelerated equity values under Change in Control (Replacement Awards; Qualified
Termination), shown below.
In addition, the table includes all equity that is accelerated as a result of termination but does not include the
value of outstanding equity awards that have previously vested, such as stock options, which awards are set forth
above in the Outstanding Equity Awards at December 31, 2018 table. For descriptions of the compensation plans
and agreements that provide for the payments set forth in the following table, including our change in control
agreements, see the “Elements of Executive Compensation” discussion contained in the CD&A.
Christopher L.
Mapes
Vincent K.
Petrella
George D.
Blankenship
Steven B.
Hedlund
Jennifer I.
Ansberry
Involuntary Termination/Termination without Cause before Normal Retirement $ 0 $ 0 $ 0 $ 0 $ 0
Normal Retirement (Age 60): Not Eligible Not Eligible Not Eligible Not Eligible Not Eligible
Long-Term Incentive Plan (PSU LTIP) $ 0 $ 0 $ 0 $ 0 $ 0
Stock Options—Accelerated Vesting $ 0 $ 0 $ 0 $ 0 $ 0
RSUs—Accelerated Vesting $ 0 $ 0 $ 0 $ 0 $ 0
Change in Control (Replacement Awards; Qualified Termination): $ 14,049,404 $ 4,783,489 $ 3,688,576 $ 3,034,027 $ 2,1 2 7,4 52
Severance $ 8,324,110 $ 2,566,025 $ 2,268,910 $ 1,545,888 $ 1,400,000
2018 Annual Bonus (EMIP) $ 0 $ 0 $ 0 $ 0 $ 0
Long-Term Incentive Plan (PSU LTIP) $ 1,140,062 $ 262,825 $ 215,336 $ 133,489 $ 127,228
Stock Options—Accelerated Vesting $ 614,604 $ 151,252 $ 121,947 $ 56,849 $ 41,247
RSUs–Accelerated Vesting $ 5,305,107 $ 1,753,387 $ 1,032,383 $ 1,247,801 $ 508,977
Outplacement Estimate $ 100,000 $ 50,000 $ 50,000 $ 50,000 $ 50,000
280G Cutback $ (1,434,479) $ 0 $ 0 $ 0 $ 0
MENU
/ 6 5L I N C O L N E L E C T R I C : 2 0 1 9 P R O X Y S TA T E M E N T
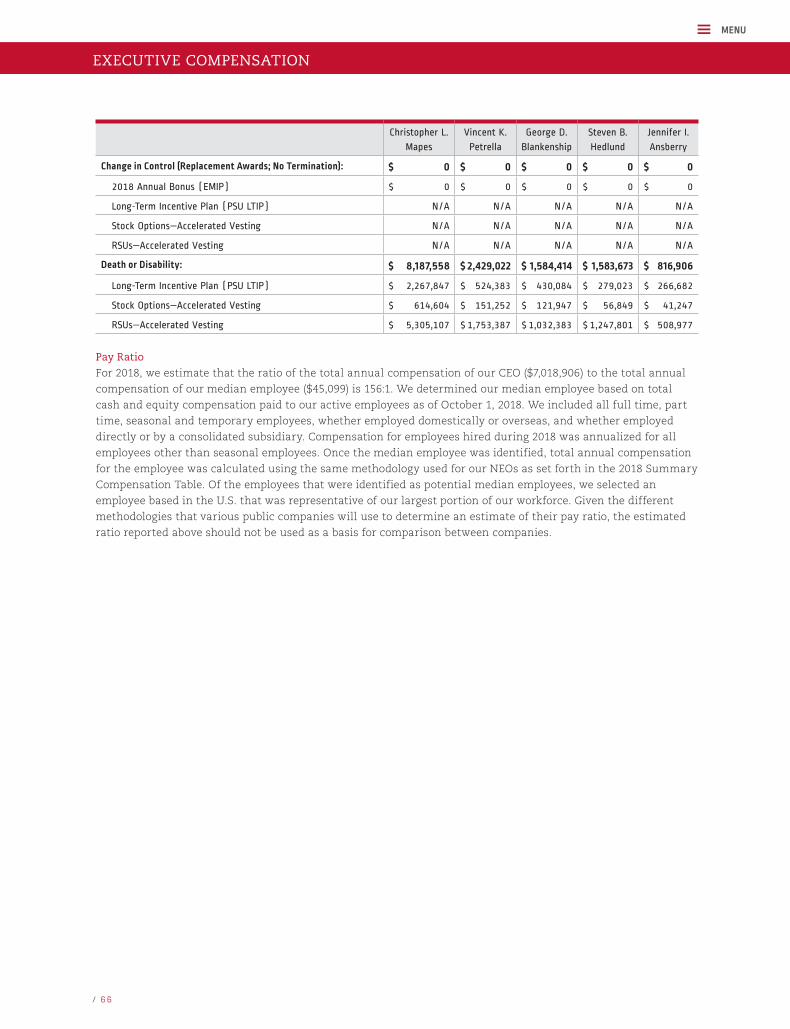
Christopher L.
Mapes
Vincent K.
Petrella
George D.
Blankenship
Steven B.
Hedlund
Jennifer I.
Ansberry
Change in Control (Replacement Awards; No Termination): $ 0 $ 0 $ 0 $ 0 $ 0
2018 Annual Bonus (EMIP) $ 0 $ 0 $ 0 $ 0 $ 0
Long-Term Incentive Plan (PSU LTIP) N/A N/A N/A N/A N/A
Stock Options—Accelerated Vesting N/A N/A N/A N/A N/A
RSUs—Accelerated Vesting N/A N/A N/A N/A N/A
Death or Disability: $ 8,187,558 $ 2,429,022 $ 1,584,414 $ 1,583,673 $ 816,906
Long-Term Incentive Plan (PSU LTIP) $ 2,267,847 $ 524,383 $ 430,084 $ 279,023 $ 266,682
Stock Options—Accelerated Vesting $ 614,604 $ 151,252 $ 121,947 $ 56,849 $ 41,247
RSUs—Accelerated Vesting $ 5,305,107 $ 1,753,387 $ 1,032,383 $ 1,247,801 $ 508,977
Pay Ratio
For 2018, we estimate that the ratio of the total annual compensation of our CEO ($7,018,906) to the total annual
compensation of our median employee ($45,099) is 156:1. We determined our median employee based on total
cash and equity compensation paid to our active employees as of October 1, 2018. We included all full time, part
time, seasonal and temporary employees, whether employed domestically or overseas, and whether employed
directly or by a consolidated subsidiary. Compensation for employees hired during 2018 was annualized for all
employees other than seasonal employees. Once the median employee was identified, total annual compensation
for the employee was calculated using the same methodology used for our NEOs as set forth in the 2018 Summary
Compensation Table. Of the employees that were identified as potential median employees, we selected an
employee based in the U.S. that was representative of our largest portion of our workforce. Given the different
methodologies that various public companies will use to determine an estimate of their pay ratio, the estimated
ratio reported above should not be used as a basis for comparison between companies.
EXECUTIVE COMPENSATION
MENU
/ 6 6
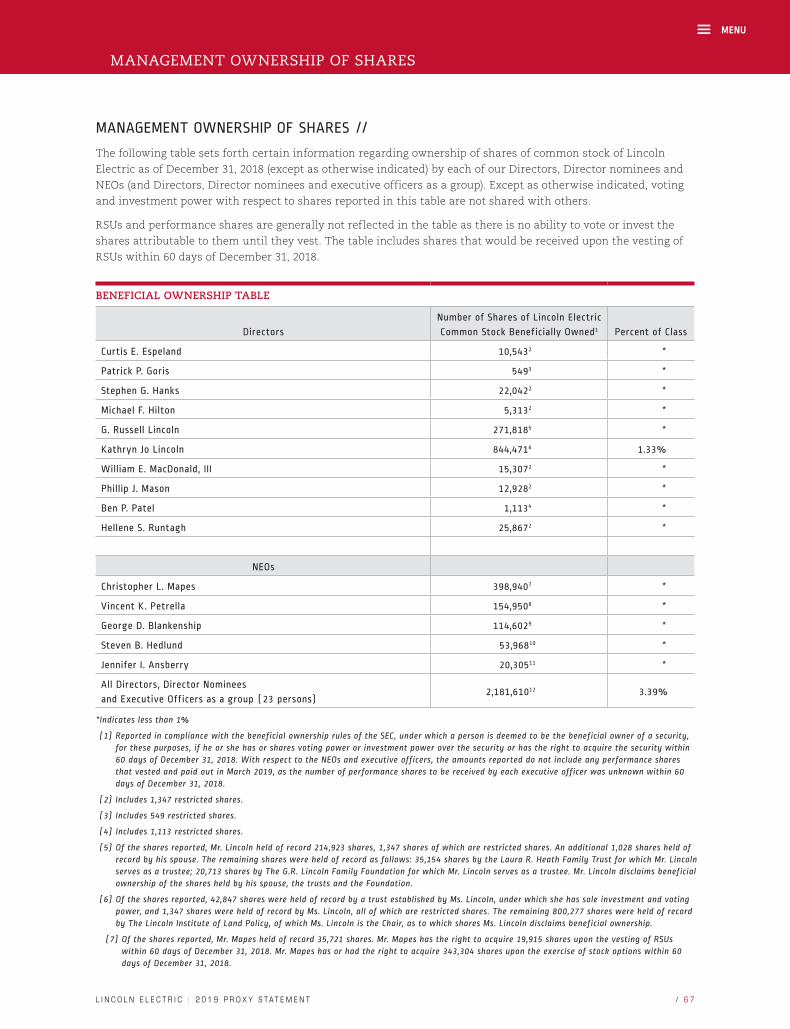
MANAGEMENT OWNERSHIP OF SHARES //
The following table sets forth certain information regarding ownership of shares of common stock of Lincoln
Electric as of December 31, 2018 (except as otherwise indicated) by each of our Directors, Director nominees and
NEOs (and Directors, Director nominees and executive officers as a group). Except as otherwise indicated, voting
and investment power with respect to shares reported in this table are not shared with others.
RSUs and performance shares are generally not reflected in the table as there is no ability to vote or invest the
shares attributable to them until they vest. The table includes shares that would be received upon the vesting of
RSUs within 60 days of December 31, 2018.
BENEFICIAL OWNERSHIP TABLE
Directors
Number of Shares of Lincoln Electric
Common Stock Beneficially Owned1 Percent of Class
Curtis E. Espeland 10,5432 *
Patrick P. Goris 5493 *
Stephen G. Hanks 22,0422 *
Michael F. Hilton 5,3132 *
G. Russell Lincoln 271,8185 *
Kathryn Jo Lincoln 844,4716 1.33%
William E. MacDonald, III 15,3072 *
Phillip J. Mason 12,9282 *
Ben P. Patel 1,1134 *
Hellene S. Runtagh 25,8672 *
NEOs
Christopher L. Mapes 398,9407 *
Vincent K. Petrella 154,9508 *
George D. Blankenship 114,6029 *
Steven B. Hedlund 53,96810 *
Jennifer I. Ansberry 20,30511 *
All Directors, Director Nominees
and Executive Officers as a group (23 persons)2,181,61012 3.39%
*Indicates less than 1%
(1) Reported in compliance with the beneficial ownership rules of the SEC, under which a person is deemed to be the beneficial owner of a security, for these purposes, if he or she has or shares voting power or investment power over the security or has the right to acquire the security within 60 days of December 31, 2018. With respect to the NEOs and executive officers, the amounts reported do not include any performance shares that vested and paid out in March 2019, as the number of performance shares to be received by each executive officer was unknown within 60 days of December 31, 2018.
(2) Includes 1,347 restricted shares.
(3) Includes 549 restricted shares.
(4) Includes 1,113 restricted shares.
(5) Of the shares reported, Mr. Lincoln held of record 214,923 shares, 1,347 shares of which are restricted shares. An additional 1,028 shares held of record by his spouse. The remaining shares were held of record as follows: 35,154 shares by the Laura R. Heath Family Trust for which Mr. Lincoln serves as a trustee; 20,713 shares by The G.R. Lincoln Family Foundation for which Mr. Lincoln serves as a trustee. Mr. Lincoln disclaims beneficial ownership of the shares held by his spouse, the trusts and the Foundation.
(6) Of the shares reported, 42,847 shares were held of record by a trust established by Ms. Lincoln, under which she has sole investment and voting power, and 1,347 shares were held of record by Ms. Lincoln, all of which are restricted shares. The remaining 800,277 shares were held of record by The Lincoln Institute of Land Policy, of which Ms. Lincoln is the Chair, as to which shares Ms. Lincoln disclaims beneficial ownership.
(7) Of the shares reported, Mr. Mapes held of record 35,721 shares. Mr. Mapes has the right to acquire 19,915 shares upon the vesting of RSUs within 60 days of December 31, 2018. Mr. Mapes has or had the right to acquire 343,304 shares upon the exercise of stock options within 60 days of December 31, 2018.
MANAGEMENT OWNERSHIP OF SHARES
MENU
/ 6 7L I N C O L N E L E C T R I C : 2 0 1 9 P R O X Y S TA T E M E N T
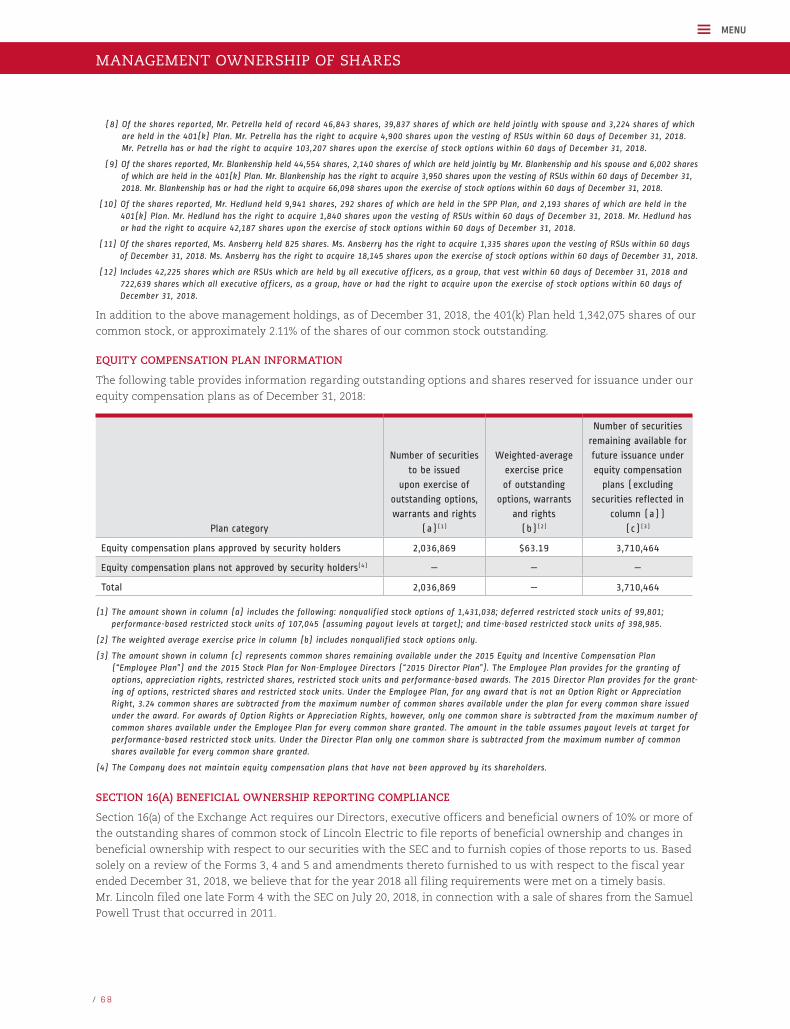
(8) Of the shares reported, Mr. Petrella held of record 46,843 shares, 39,837 shares of which are held jointly with spouse and 3,224 shares of which are held in the 401(k) Plan. Mr. Petrella has the right to acquire 4,900 shares upon the vesting of RSUs within 60 days of December 31, 2018. Mr. Petrella has or had the right to acquire 103,207 shares upon the exercise of stock options within 60 days of December 31, 2018.
(9) Of the shares reported, Mr. Blankenship held 44,554 shares, 2,140 shares of which are held jointly by Mr. Blankenship and his spouse and 6,002 shares of which are held in the 401(k) Plan. Mr. Blankenship has the right to acquire 3,950 shares upon the vesting of RSUs within 60 days of December 31, 2018. Mr. Blankenship has or had the right to acquire 66,098 shares upon the exercise of stock options within 60 days of December 31, 2018.
(10) Of the shares reported, Mr. Hedlund held 9,941 shares, 292 shares of which are held in the SPP Plan, and 2,193 shares of which are held in the 401(k) Plan. Mr. Hedlund has the right to acquire 1,840 shares upon the vesting of RSUs within 60 days of December 31, 2018. Mr. Hedlund has or had the right to acquire 42,187 shares upon the exercise of stock options within 60 days of December 31, 2018.
(11) Of the shares reported, Ms. Ansberry held 825 shares. Ms. Ansberry has the right to acquire 1,335 shares upon the vesting of RSUs within 60 days of December 31, 2018. Ms. Ansberry has the right to acquire 18,145 shares upon the exercise of stock options within 60 days of December 31, 2018.
(12) Includes 42,225 shares which are RSUs which are held by all executive officers, as a group, that vest within 60 days of December 31, 2018 and 722,639 shares which all executive officers, as a group, have or had the right to acquire upon the exercise of stock options within 60 days of December 31, 2018.
In addition to the above management holdings, as of December 31, 2018, the 401(k) Plan held 1,342,075 shares of our
common stock, or approximately 2.11% of the shares of our common stock outstanding.
EQUITY COMPENSATION PLAN INFORMATION
The following table provides information regarding outstanding options and shares reserved for issuance under our
equity compensation plans as of December 31, 2018:
Plan category
Number of securities
to be issued
upon exercise of
outstanding options,
warrants and rights
(a)(1)
Weighted-average
exercise price
of outstanding
options, warrants
and rights
(b)(2)
Number of securities
remaining available for
future issuance under
equity compensation
plans (excluding
securities reflected in
column (a))
(c)(3)
Equity compensation plans approved by security holders 2,036,869 $63.19 3,710,464
Equity compensation plans not approved by security holders(4) — — —
Total 2,036,869 — 3,710,464
(1) The amount shown in column (a) includes the following: nonqualified stock options of 1,431,038; deferred restricted stock units of 99,801; performance-based restricted stock units of 107,045 (assuming payout levels at target); and time-based restricted stock units of 398,985.
(2) The weighted average exercise price in column (b) includes nonqualified stock options only.
(3) The amount shown in column (c) represents common shares remaining available under the 2015 Equity and Incentive Compensation Plan (“Employee Plan”) and the 2015 Stock Plan for Non-Employee Directors (“2015 Director Plan”). The Employee Plan provides for the granting of options, appreciation rights, restricted shares, restricted stock units and performance-based awards. The 2015 Director Plan provides for the grant-ing of options, restricted shares and restricted stock units. Under the Employee Plan, for any award that is not an Option Right or Appreciation Right, 3.24 common shares are subtracted from the maximum number of common shares available under the plan for every common share issued under the award. For awards of Option Rights or Appreciation Rights, however, only one common share is subtracted from the maximum number of common shares available under the Employee Plan for every common share granted. The amount in the table assumes payout levels at target for performance-based restricted stock units. Under the Director Plan only one common share is subtracted from the maximum number of common shares available for every common share granted.
(4) The Company does not maintain equity compensation plans that have not been approved by its shareholders.
SECTION 16(A) BENEFICIAL OWNERSHIP REPORTING COMPLIANCE
Section 16(a) of the Exchange Act requires our Directors, executive officers and beneficial owners of 10% or more of
the outstanding shares of common stock of Lincoln Electric to file reports of beneficial ownership and changes in
beneficial ownership with respect to our securities with the SEC and to furnish copies of those reports to us. Based
solely on a review of the Forms 3, 4 and 5 and amendments thereto furnished to us with respect to the fiscal year
ended December 31, 2018, we believe that for the year 2018 all filing requirements were met on a timely basis.
Mr. Lincoln filed one late Form 4 with the SEC on July 20, 2018, in connection with a sale of shares from the Samuel
Powell Trust that occurred in 2011.
MANAGEMENT OWNERSHIP OF SHARES
MENU
/ 6 8

OTHER OWNERSHIP OF SHARES //Set forth below is information about the number of shares held by any person (including any “group” as that term is
used in Section 13(d)(3) of the Exchange Act) known to us to be an owner of more than 5% of the shares of our com-
mon stock as of December 31, 2018.
Name and Address of Beneficial Owner
No. of Shares and Nature of
Beneficial Ownership
Percent of
Class
BlackRock, Inc. 55 East 52nd Street New York, New York 10055
6,023,1221 9.48%
The Vanguard Group 100 Vanguard Boulevard Malvern, Pennsylvania 19355
6,151,1952 9.68%
State Street Corporation One Lincoln Street Boston, Massachusetts 02111
3,477,0343 5.47%
(1) According to its Schedule 13G/A filed on February 6, 2019, BlackRock, Inc. has sole voting power over 5,775,138 shares and sole dispositive power over 6,023,122 shares. In its Schedule 13G/A filing, BlackRock states that the shares of our common stock reported in the filing were acquired and are held in the ordinary course of business and were not acquired and are not held for the purpose of or with the effect of changing or influencing the con-trol of the issuer of the securities and were not acquired and are not held in connection with or as a participant in any transaction having that purpose or effect.
(2) According to its Schedule 13G/A filed on February 12, 2019, The Vanguard Group has sole voting power over 34,988 shares, shared voting power over 7,666 shares, sole dispositive power over 6,114,795 shares and shared dispositive power over 36,400 shares. In its Schedule 13G/A filing, Vanguard Group states that the shares of our common stock reported in the filing were acquired in the ordinary course of business and were not acquired for the purpose of and do not have the effect of changing or influencing the control of the issuer of such securities and were not acquired in connection with or as a participant in any transaction having such purpose or effect.
(3) According to its Schedule 13G/A filed on February 14, 2019, State Street Corporation has shared voting power over 3,382,338 shares and shared dispositive power over 3,477,034 shares. In its Schedule 13G/A filing, State Street Cor poration states that the shares of our common stock reported in the filing were acquired in the ordi-nary course of business and were not acquired for the purpose of and do not have the effect of changing or influencing the control of the issuer of such securities and were not acquired in connection with or as a partici-
pant in any transaction having such purpose or effect.
OTHER OWNERSHIP OF SHARES
MENU
/ 6 9L I N C O L N E L E C T R I C : 2 0 1 9 P R O X Y S TA T E M E N T
COMPENSATION COMMITTEE INTERLOCKS AND INSIDER PARTICIPATION //During 2018, none of the Compensation and Executive Development Committee members were employees of
Lincoln Electric or any of its subsidiaries, and there were no reportable business relationships between Lincoln
Electric and the Compensation and Executive Development Committee members. None of our executive officers
serves as a member of the board of directors or compensation committee of any entity that has one or more of its
executive officers serving as a member of our Compensation and Executive Development Committee. In addition,
none of our executive officers serves as a member of the compensation committee of any entity that has one or
more of its executive officers serving as a member of our Board.
COMPENSATION COMMITTEE INTERLOCKS AND INSIDER PARTICIPATION
MENU
/ 7 0

EXECUTIVE BIOGRAPHIES //The biographies of our executive officers are hereby incorporated by reference from our Form 10-K for the fiscal
year ended December 31, 2018, filed on February 27, 2019 on page 9.
BOARD PROPOSALS //
PROPOSAL 1—ELECTION OF DIRECTORS
Proposal 1 can be found beginning on page 13 of this Proxy Statement.
PROPOSAL 2—RATIFICATION OF INDEPENDENT AUDITORS
A proposal will be presented at the Annual Meeting to ratify the appointment of Ernst & Young LLP as our
independent auditors to examine our books of account and other records and our internal control over
financial reporting for the fiscal year ending December 31, 2019.
Fees for professional services provided by Ernst & Young LLP as our independent auditors in each of the last two
fiscal years, in each of the following categories are:
2018 2017
Audit Fees $3,318,000 $3,474,000
Audit-Related Fees 72,000 14,000
Tax Fees 436,000 235,000
All Other Fees 0 0
Total Fees $3,826,000 $3,723,000
Audit Fees include fees associated with the annual integrated audit of the financial statements and internal control
over financial reporting in 2018 and 2017, the reviews of our quarterly reports on Form 10-Q, certain statutory
audits required for our international subsidiaries and services provided in connection with regulatory filings with
the SEC. Audit-Related Fees for 2018 and 2017 primarily relate to audit-related services associated with audits of
employee benefit plans, acquisitions and other audit-related requirements with international statutory audits. Tax
Fees include tax compliance and tax advisory services. All Other Fees include the fees billed for products and
services provided other than the services reported under Audit Fees, Audit-Related Fees and Tax Fees.
Audit Committee Pre-Approval Policies and Procedures
The Audit Committee has established a policy regarding pre-approval of all audit and non-audit services
performed by our independent auditors, including the scope of and fees for such services. Generally, requests for
audit, audit-related and tax services, each as defined in the policy, must be presented for approval prior to the
performance of such services, to the extent known at that time. For 2018, the Audit Committee has resolved that
four specific categories of services, namely audit services, audit-related services related to acquisitions, new
accounting pronouncements and other international statutory requirements, tax advisory services, and tax
compliance services, are permissible without itemized pre-approval in an amount not to exceed for each service:
Pre-Approval Amount Services
$200,000Audit, and Audit-Related services for acquisitions, new accounting pronouncements and
other international statutory requirements
$800,000 Tax Advisory and Tax Compliance services
(For 2017, the Pre-Approval Amount for the four categories of services was $200,000 for each service)
Itemized detail of all such services performed is subsequently provided to the Audit Committee. In addition, our
independent auditors are prohibited from providing certain services described in the policy as prohibited services.
All of the fees included in Audit Fees, Audit-Related Fees and Tax Fees shown above were pre-approved by the Audit
Committee (or included in the $200,000 or $800,000 limits, as applicable, for certain services as detailed above).
EXECUTIVE BIOGRAPHIES
MENU
/ 7 1L I N C O L N E L E C T R I C : 2 0 1 9 P R O X Y S TA T E M E N T

Generally, requests for independent auditor services are submitted to the Audit Committee by our Executive Vice
President, CFO and Treasurer (or other member of our senior financial management) and our independent auditors
for consideration at the Audit Committee’s regularly scheduled meetings. Requests for additional services in the
categories mentioned above may be approved at subsequent Audit Committee meetings to the extent that none of
such services is performed prior to its approval (unless such services are included in the categories of services that
fall within the dollar limits detailed above). The Chairman of the Audit Committee is also delegated the authority
to approve independent auditor services requests under certain dollar thresholds provided that the pre-approval is
reported at the next meeting of the Audit Committee. All requests for independent auditor services must include a
description of the services to be provided and the fees for such services.
Representatives of Ernst & Young LLP are expected to be present at the Annual Meeting, will have an opportunity
to make a statement if they so desire and are expected to be available to respond to appropriate shareholder
questions. Although ratification of the appointment of the independent auditors is not required by law, the Audit
Committee and the Board believe that shareholders should be given the opportunity to express their views on the
subject. While not binding on the Audit Committee or the Board, the failure of the shareholders to ratify the
appointment of Ernst & Young LLP as our independent auditors would be considered by the Board in determining
whether or not to continue the engagement of Ernst & Young LLP. Ultimately, the Audit Committee retains full
discretion and will make all determinations with respect to the appointment of independent auditors, whether or
not our shareholders ratify the appointment.
Majority Vote Needed
Ratification requires the affirmative vote of the majority of the shares of our common stock present or represented
and entitled to vote on the matter at the Annual Meeting. Unless otherwise directed, shares represented by proxy
will be voted FOR ratification of the appointment of Ernst & Young LLP. Abstentions will have the same effect as a
vote “against” the proposal.
YOUR BOARD OF DIRECTORS RECOMMENDS A VOTE FOR RATIFICATION OF THE APPOINTMENT OF ERNST & YOUNG LLP AS OUR INDEPENDENT AUDITORS
BOARD PROPOSALS
/ 7 2
MENU
PROPOSAL 3—ADVISORY VOTE ON EXECUTIVE COMPENSATION
At our 2018 Annual Meeting, approximately 98% of the shareholders who voted on the “say-on-pay”
proposal voted for the compensation of our NEOs. The Compensation and Executive Development
Committee believes that the shareholder vote reinforces the philosophy and objectives of our executive
compensation program. Our next say-on-pay vote will be held at the 2020 Annual Meeting.
Our compensation philosophy is to pay for performance, a philosophy that has been rooted in our history and tra-
dition for nearly 125 years. Our compensation program consists of elements designed to complement one another
and focus on both short-term and long-term performance. The Compensation and Executive Development
Committee regularly reviews peer group data and best practices and trends related to executive compensation to
ensure that our programs are properly aligned with our business strategy and philosophy, as well as promote
shareholder value. The Committee receives advice from independent consultants. In addition to the information
provided earlier in the CD&A section above, we believe shareholders should consider the following in determining
whether to approve this proposal:
Our Culture and Performance
To maintain a performance-driven culture, we:
• expect our executives to deliver above-market financial
results;
• provide systems that tie executive compensation to
superior financial performance;
• take action when needed to address specific business
challenges; and
• maintain good governance practices in the design and
operation of our executive compensation programs.
We have a long track record of delivering increased value to our shareholders.
Pay for Performance
In designing our executive compensation programs, a core philosophy is that our executives should be rewarded
when they deliver financial results that provide value to our shareholders. Therefore, we have established a
program that ties executive compensation to superior financial performance.
We have a balanced pay mix between short-term and long-term incentives:
• Base Salaries. Base salaries for our NEOs are gener-
ally targeted at the 45th percentile of benchmark
data (below market median). For 2018, the average
base salary increase for the NEOs was 6.5%, largely
as a result of recent promotions. Excluding promo-
tions, the average base salary increase was 2.8%.
• Annual Bonus Awards Are Aligned with Our
Performance and Contain a Balanced Mix of
Metrics. The total cash compensation for our NEOs,
which includes base pay and the annual bonus
(EMIP), is targeted at the 65th percentile of bench-
mark data (above market median). The EMIP is based
on a balance of metrics—both financial and per-
sonal—with the financial components based on
EBITB and AOWC/Sales for Compensation Purposes
and with a mix of consolidated and, if applicable,
segment performance. For 2018, annual bonus pay-
ments for the NEOs increased 11%, largely as a result
of recent promotions. Excluding promotions, annual
bonus payments increased 3%.
• Performance Share LTIP Payouts Were Above
Targets. For the 2016-2018 performance cycle, the
Performance Share LTIP paid out above target, as a
result of ROIC for Compensation Purposes perfor-
mance above target and Adjusted Net Income for
Compensation Purposes performance above
threshold.
• Long-Term Incentives Are Aligned with the
Interests of Our Shareholders. We believe that
incentives should be based on factors that deliver
long-term sustainability for Lincoln Electric. Therefore,
the NEOs receive three types of long-term incentives.
The three components are: (1) stock options, (2) RSUs
and (3) a Performance Share LTIP. Total awards are
targeted at the 50th percentile of benchmark data
(at market median).
/ 7 3L I N C O L N E L E C T R I C : 2 0 1 9 P R O X Y S TA T E M E N T
MENU
Good Governance Practices
In addition to our emphasis on pay for performance, we design our programs to be current with best practices and
good corporate governance. We also consider the risks associated with any particular program, design or compen-
sation decision. We believe these assessments result in sustained, long-term shareholder value. Some of the gover-
nance practices include:
• Officers Are Subject to Stock Ownership Guidelines
• Compensation and Executive Development
Committee Receives Regular Updates
• Compensation and Executive Development
Committee Retains Independent Advisors
• No Compensation Consultant Conflicts of Interest
• No Multi-Year Guarantees on Compensation
• No Dividends on Unvested RSUs
• Broad Clawback Policy
• Change in Control Agreements Require a
Double-Trigger
• No Tax Gross-Ups
• No Hedging or Pledging of Lincoln Electric stock
by officers
• Limited Perquisites
As illustrated above, the Compensation and Executive Development Committee has and will continue to take
action to structure our executive compensation program in a manner that is performance-based, current with
best practices and good corporate governance and aimed at sustaining long-term shareholder value. The Board
believes that the executive compensation disclosed in the CD&A section, tabular disclosures (including the 2018
Summary Compensation Table) and other narrative disclosures in this proxy statement aligns with our peer
group pay practices and compensation philosophy.
Upon the recommendation of the Board, and for the reasons stated above, we ask shareholders to consider the
following resolution:
RESOLVED, that the compensation awarded to our NEOs, as disclosed pursuant to Item 402 of Regulation S-K
in the Compensation Discussion and Analysis and the tabular disclosure (together with the accompanying
narrative disclosure) in this Proxy Statement, as required by the rules of the Securities and Exchange
Commission, is hereby approved on an advisory basis.
Your Vote Matters to Us
As an advisory vote, this proposal is not binding on us. However, the Compensation and Executive Development
Committee, which is responsible for designing and administering our executive compensation programs, values
the opinions expressed by shareholders in their vote on this proposal and will consider the outcome of the vote
when making future compensation decisions for NEOs.
Majority Vote Needed
A favorable vote of a majority of the shares of our common stock present or represented by proxy and entitled to
vote on the matter is necessary for approval of the proposal. Abstentions will have the same effect as a vote
“against” the proposal and broker non-votes will not be counted for determining whether the proposal is
approved.
YOUR BOARD OF DIRECTORS RECOMMENDS A VOTE, ON AN ADVISORY BASIS, FOR APPROVAL OF THE
COMPENSATION OF OUR NAMED EXECUTIVE OFFICERS
BOARD PROPOSALS
MENU
/ 7 4

AUDIT COMMITTEE REPORT //The Audit Committee consists solely of independent Directors within the meaning of the Nasdaq listing standards.
The Audit Committee oversees our financial reporting process on behalf of the Board of Directors. Management has
the primary responsibility for the financial statements and the reporting process, including the systems of internal
control over financial reporting. In fulfilling its oversight responsibilities, the Committee reviewed and discussed
with management the audited financial statements in the Annual Report, including a discussion of the quality, not
just the acceptability, of the accounting principles, the reasonableness of significant judgments and the clarity of
disclosures in the financial statements.
The Audit Committee discussed with the independent auditors, who are responsible for expressing an opinion on
the conformity of those audited financial statements with U.S. generally accepted accounting principles, their
judgments as to the quality, not just the acceptability, of our accounting principles and such other matters as are
required to be discussed with the Audit Committee under PCAOB Auditing Standard No. 1301, Communications with
Audit Committees. In addition, the Audit Committee has received and discussed with the independent auditors writ-
ten disclosures regarding their independence as required by PCAOB Ethics and Independence Rule 3526,
Communication with Audit Committees Concerning Independence.
The Audit Committee discussed with our internal and independent auditors the overall scope and plan for their
respective audits. The Audit Committee met with the internal and independent auditors, with and without man-
agement present, to discuss the results of their examinations, their evaluations of our internal controls, and the
overall quality of our financial reporting.
In reliance on the reviews and discussions referred to above, the Audit Committee recommended to the Board of
Directors (and the Board approved) that the audited financial statements be included in the Annual Report on
Form 10-K for the year ended December 31, 2018 for filing with the SEC. The Audit Committee and the Board have
also recommended the selection of Ernst & Young LLP as our independent auditors for the year ending
December 31, 2019 and the ratification thereof by the shareholders.
By the Audit Committee:
Stephen G. Hanks, Chair
Curtis E. Espeland
Patrick P. Goris
Michael F. Hilton
G. Russell Lincoln
Ben P. Patel
AUDIT COMMITTEE REPORT
MENU
/ 7 5L I N C O L N E L E C T R I C : 2 0 1 9 P R O X Y S TA T E M E N T

FAQS //
Who is soliciting proxies and why? Who is paying for the cost of this proxy solicitation?
Your proxy is being solicited by our Board and we will pay the cost of the solicitation. Certain of our officers and
other employees may also solicit proxies, but will not receive any additional compensation for these activities. In
addition, we reimburse custodians, nominees and fiduciaries for reasonable expenses incurred in forwarding
proxy materials to beneficial owners and obtaining their proxies.
How do we distribute proxy materials to shareholders sharing the same address?
To reduce the expense of delivering duplicate voting materials, we have taken advantage of “householding” rules.
These rules permit us to deliver only one set of voting materials to shareholders who share the same address;
meaning only one copy of the Annual Report, proxy statement and any other shareholder communications will be
sent to those households. Each shareholder will, however, receive a separate proxy card.
How do I obtain a separate set of proxy materials?
If you share an address with another shareholder and have received only one copy of the proxy materials, you may
request that we send a separate copy to you at no cost. You may also request that we send only one set of these
materials to you if you are receiving multiple copies. You may make these requests by sending a written notice to
the Corporate Secretary at Lincoln Electric Holdings, Inc., 22801 St. Clair Avenue, Cleveland, Ohio 44117.
Who may vote?
Record holders as of the close of business on February 28, 2019, the record date, are entitled to vote at the Annual
Meeting. On that date, 63,097,077 shares of our common stock were outstanding. Each share is entitled to one vote
on each proposal brought before the meeting.
What is required for there to be a quorum at the Annual Meeting?
Holders of at least a majority of the shares of our common stock issued and outstanding on the record date
(February 28, 2019) must be present, in person or by proxy, for there to be a quorum in order to conduct business
at the meeting.
May I attend the Annual Meeting in person?
Registered holders of our common shares, as well as beneficial owners of our common shares who submit appro-
priate documentation, as described below, may attend the Annual Meeting in person if they held their shares as
of the record date (February 28, 2019). If you plan to attend the Annual Meeting and are a registered holder, please
check the attendance box on the proxy card or indicate so when prompted if you are voting by telephone or over
the Internet.
What is the difference between holding shares as a shareholder of record and as a beneficial holder?
• Shareholder of Record. If your shares are registered in your name with our transfer agent/registrar, you are
considered the shareholder of record and these proxy materials have been sent directly to you. You may vote
in person at the meeting. You may also grant us your proxy to vote your shares by telephone, via the Internet
or by mailing your signed proxy card in the envelope provided.
• Beneficial Holder of Shares Held in “Street Name.” If your shares are held in a brokerage account, by a
trustee, or by another nominee, then that person is considered the shareholder of record and the shares are
considered held in “street name.” We sent these proxy materials to that other person, and they have been for-
warded to you with a voting instruction card. As a beneficial owner, you have the right to direct your nominee
on how to vote your shares and you are also invited to attend the meeting. However, you are not the share-
holder of record and you may not vote in person at the meeting unless you obtain a legal proxy from the nom-
inee that holds your shares. Please refer to the information your nominee provided to see what voting options
are available to you. If you have not heard from your nominee, please contact them as soon as possible.
FAQS
/ 7 6
MENU

What shares are included on the proxy card?
If you are both a registered shareholder and a participant in The Lincoln Electric Company Employee Savings Plan
(401(k) Plan), you may have received one proxy card that shows all the shares registered in your name, including
any dividend reinvestment plan shares, and all shares you have credited to your 401(k) Plan account. Accordingly,
your proxy card also serves as your voting directions to the 401(k) Plan Trustee.
Please note, however, that unless the identical name(s) appeared on all your accounts, we were not able to
consolidate your share information. If that was the case, you received more than one proxy card and must vote
each one separately.
If your shares are held through a nominee, you will receive either a voting form or a proxy card from them,
instructing you on how to vote your shares.
If you are both a record holder of shares and a beneficial holder of additional shares, you will receive a proxy
card(s) directly from us as well as a voting instruction card from your nominee.
What is a broker non-vote and what effect does it have?
Brokers or other nominees who hold our common stock for a beneficial owner have the discretion to vote on routine
proposals when they have not received voting instructions from the beneficial owner. However, your nominee is not
permitted to vote on your behalf on the election of Directors (Proposal 1) and other non-routine matters (Proposal 3)
unless you provide specific voting instructions to them by following the instructions provided to you.
A broker non-vote occurs when a broker or other nominee does not receive voting instructions from the beneficial
owner and does not have the discretion to direct the voting of the shares. Therefore, if you hold your shares benefi-cially through a nominee, you must communicate your voting instructions to them to have your shares voted.
Broker non-votes, as well as abstentions, will be counted for purposes of calculating whether a quorum is present at
the Annual Meeting, but broker non-votes will not be counted for purposes of determining the number of votes
present in person or represented by proxy and entitled to vote (i.e., it will not be considered a vote “cast”) with
respect to a particular proposal.
How do I vote?
Registered Holders
If your shares are registered in your name, you may vote in person or by proxy in any one of four ways outlined
in the Proxy Summary section of this Proxy Statement.
Participants in the 401(k) Plan
If you participate in the 401(k) Plan, the plan’s independent Trustee, Fidelity Management Trust Company, will
vote your 401(k) Plan shares according to your voting directions. You may give your voting directions to the plan
Trustee by Internet, by telephone or by mail. If you do not return your voting instruction card or do not vote
over the Internet or by telephone, the Trustee will not vote your plan shares. Because 401(k) Plan shares are
held in a qualified plan, you are not able to vote 401(k) Plan shares in person at the Annual Meeting.
Beneficial Holders of Shares Held in “Street Name”
If your shares are held by a bank, broker, trustee or some other nominee (in street name), that entity will give
you separate voting instructions.
If you hold your shares in street name, and you also wish to vote at the Annual Meeting, you must obtain a
proxy, executed in your favor, from your nominee.
/ 7 7L I N C O L N E L E C T R I C : 2 0 1 9 P R O X Y S TA T E M E N T
MENU

What happens if I sign, date and return my proxy but do not specify how I want my shares voted on the proposals?
Registered Shareholders
If you sign, date and return your proxy card but do not specify how you want to vote your shares, your shares
will be voted FOR the election of all of the Director nominees, FOR the ratification of the appointment of our
independent auditors, and FOR the approval of the compensation of our NEOs.
“Street Name” Shareholders
Your nominee may vote your uninstructed shares only on those proposals on which it has discretion to vote.
Your nominee does not have discretion to vote your uninstructed shares on non-routine matters such as
Proposal 1 (election of Directors) and Proposal 3 (advisory vote on executive compensation). However, your nom-
inee does have discretion to vote your uninstructed shares on routine matters such as Proposal 2 (ratification of
independent auditors).
May I revoke my proxy or change my vote?
Yes. If you are a registered holder, you may change or revoke your proxy prior to the closing of the polls in any one
of the following FOUR ways:
1. By sending a written notice to our Corporate Secretary stating that you want to revoke your proxy;
2. By submitting a properly completed and signed proxy card with a later date (which will automatically revoke the
earlier proxy);
3. By entering later-dated voting instructions by telephone or Internet (which will automatically revoke the earlier
proxy); or
4. By voting in person at the Annual Meeting after requesting that the earlier proxy be revoked. Because 401(k)
plan shares are held in a qualified plan, you are not able to revoke or change your vote on 401(k) plan shares at
the Annual Meeting.
If your shares are held by a nominee, you will have to check with your nominee to determine how to change
your vote.
Who counts the votes?
We have engaged Broadridge Financial Solutions, Inc. as our independent agent to receive and tabulate the votes.
Broadridge will also act as our inspector of elections at the Annual Meeting.
May I receive future shareholder communications over the Internet?
If you are a registered shareholder, you may consent to receiving future shareholder communications (e.g., proxy
materials) over the Internet instead of the mail. You may give your consent by marking the appropriate box on
your proxy card or following the prompts given you when you vote by telephone or over the Internet. If you choose
electronic access, once there is sufficient interest in electronic delivery, we will discontinue mailing materials to
you. However, you will still receive a proxy card, together with a formal notice of the meeting, in the mail.
Providing shareholder communications over the Internet may reduce our printing and postage costs and the
number of paper documents that you would otherwise receive. Once you give your consent, it will remain in effect
until you inform us otherwise.
If your shares are held through a nominee, check the information provided by that entity for instructions on how
to choose to access future shareholder communications over the Internet.
FAQS
MENU
/ 7 8
When are shareholder proposals due for next year’s Annual Meeting in 2020?
In order for proposals to be considered for inclusion in next year’s proxy statement for the 2020 Annual Meeting, a
shareholder proposal must be received in writing by the Corporate Secretary at Lincoln Electric Holdings, Inc., 22801
St. Clair Avenue, Cleveland, Ohio 44117-1199 on or before November 23, 2019. In addition, if shareholders want to
present proposals at our 2020 Annual Meeting that are not included in Lincoln Electric’s proxy materials, they must
comply with the requirements set forth in our Amended and Restated Code of Regulations. Specifically, they must
provide written notice containing certain information and such notice must be received no later than January 25,
2020 and no earlier than December 26, 2019. If the Board of Directors chooses to present any information submitted
after the applicable deadlines at the 2020 Annual Meeting, then the persons named in proxies solicited by the Board
for the 2020 Annual Meeting may exercise discretionary voting power with respect to such information.
May I submit a nomination for Director?
Our Amended and Restated Code of Regulations permits shareholders to nominate persons for election as a
Director but requires that nominations be received in the Corporate Secretary’s Office at least 80 days before the
date of the annual meeting at which the nomination is to be made. If we have not publicly announced the date of
the annual meeting more than 90 days prior to the annual meeting date, shareholder nominations must be received
in the Corporate Secretary’s Office no later than the close of business on the tenth day following the day on which
we publicly announced the date of the annual meeting.
For this year’s Annual Meeting, we had to receive nominations not later than the close of business on January 28,
2019, as we publicly announced the date of this year’s Annual Meeting on January 15, 2019, which is more than
90 days prior to this year’s Annual Meeting date. Accordingly, no additional nominations can be made for this
year’s Annual Meeting.
To nominate a candidate for election as Director, a shareholder must send a written notice to the Corporate
Secretary at Lincoln Electric Holdings, Inc., 22801 St. Clair Avenue, Cleveland, Ohio 44117-1199. The notice must
include the information about the shareholder and about the person he or she intends to nominate that is
required by our Amended and Restated Code of Regulations.
How do I contact Lincoln Electric?
For general information, shareholders may contact Lincoln Electric at the following address:
Lincoln Electric Holdings, Inc.
22801 St. Clair Avenue
Cleveland, Ohio 44117-1199
Attention: Amanda Butler, Vice President, Investor Relations & Communications
Throughout the year, you may visit our website at www.lincolnelectric.com for information about current
developments at Lincoln Electric.
How do I contact the Directors?
Shareholders may send communications to any or all of our Directors through the Corporate Secretary at the
following address:
Lincoln Electric Holdings, Inc.
22801 St. Clair Avenue
Cleveland, Ohio 44117-1199
Attention: Corporate Secretary
The name of any specific intended Board recipient should be noted in the communication. Prior to forwarding any
correspondence, the Corporate Secretary will review such correspondence and, in his or her discretion, not forward
certain items if they are deemed of a frivolous nature or otherwise inappropriate for the Board’s consideration. In
such cases, some of that correspondence may be forwarded elsewhere within Lincoln Electric for review and
possible response.
MENU
/ 7 9L I N C O L N E L E C T R I C : 2 0 1 9 P R O X Y S TA T E M E N T

APPENDIX A—DEFINITIONS AND NON-GAAP FINANCIAL MEASURES //The discussion of our results in the CD&A and other sections of this Proxy Statement includes reference to our EBIT,
EBITB, Adjusted net income, Adjusted diluted earnings per share, Adjusted EBIT, Adjusted operating income,
Adjusted operating income margin, Adjusted effective tax rate, Return on Invested Capital (ROIC), Average Operating
Working Capital to Sales (AOWC/Sales), 3-year and 5-year Total Shareholder Return (TSR), Organic Sales, Cash
Conversion and Free Cash Flow (FCF) performance. Some of these metrics are considered Non-GAAP financial mea-
sures, as management uses various GAAP and non-GAAP financial measures in assessing and evaluating our under-
lying operating performance. Non-GAAP financial measures exclude the impact of special items on our reported
financial results. Non-GAAP financial measures should be read in conjunction with the generally accepted account-
ing principles in the United States (“GAAP”), as non-GAAP measures are a supplement to, and not a replacement for,
GAAP financial measures. The following defines the financial and non-GAAP financial measures discussed in the
CD&A and other sections of this Proxy Statement:
ADJUSTED DILUTED EARNINGS PER SHAREAdjusted Diluted Earnings Per Share is defined as reported Diluted Earnings Per Share excluding certain disclosed
special items.
ADJUSTED EBITAdjusted EBIT is defined as reported EBIT excluding certain disclosed special items.
ADJUSTED EFFECTIVE TAX RATEAdjusted Effective Tax Rate is defined as reported Effective Tax Rate excluding the tax effect of certain disclosed
special items.
ADJUSTED NET INCOME Adjusted Net Income is defined as reported Net Income excluding certain disclosed special items.
ADJUSTED NET INCOME FOR COMPENSATION PURPOSES Adjusted Net Income for Compensation Purposes is defined as reported Net Income excluding certain disclosed
special items and other adjustments as approved by the Compensation and Executive Development Committee.
ADJUSTED OPERATING INCOME Adjusted Operating Income is defined as reported Operating Income excluding certain disclosed special items.
ADJUSTED OPERATING INCOME MARGIN Adjusted Operating Income Margin is defined as Adjusted Operating Income divided by Net sales.
AOWC/SALES AOWC/Sales is defined as net operating working capital as of period end divided by annualized rolling three months
of sales. Net operating working capital is defined as Accounts receivable plus Inventory less Trade accounts payable.
AOWC/SALES FOR COMPENSATION PURPOSES AOWC/Sales for Compensation Purposes is defined as the three-month average operating working capital (gross
accounts receivable plus gross inventory less trade accounts payable) divided by the rolling twelve-months of sales
calculated at budgeted exchange rates and adjusted for the results of businesses acquired during the year.
CASH CONVERSION Cash Conversion is defined as Free Cash Flow divided by Adjusted Net Income.
EBIT EBIT is an amount equal to earnings before interest and tax defined as operating income plus equity earnings in
affiliates and other income.
EBITB EBITB is an amount equal to earnings before interest, tax and bonus, calculated at budgeted exchange rates and adjusted
for special items as determined by management. The adjustments for special items include such items as rationalization
charges, certain asset impairment charges, the gains and losses on certain transactions including the disposal of assets
and the results of businesses acquired during the year. Adjusted Operating Income is a representative measure of EBITB.
APPENDIX A—DEFINITIONS AND NON-GAAP FINANCIAL MEASURES
MENU
/ A - 1

FREE CASH FLOW (FCF) Free Cash Flow is defined as Net cash provided by operating activities less Capital expenditures.
ORGANIC SALES Organic Sales is defined as sales excluding the effects of foreign currency and acquisitions.
RETURN ON INVESTED CAPITAL (ROIC) ROIC is defined as rolling 12 months of Adjusted net income excluding tax-effected interest income and expense
divided by Invested capital. Invested capital is defined as total debt, which includes Amounts due banks, Current
portion of long-term debt and Long-term debt, less current portion, plus Total equity.
RETURN ON INVESTED CAPITAL (ROIC) FOR COMPENSATION PURPOSES ROIC for Compensation Purposes is calculated by an independent third-party and is adjusted for certain transac-
tions as approved by the Compensation and Executive Development Committee. In 2015, pension settlement charges
primarily related to the purchase of a group annuity contract were excluded. In 2016, the ROIC for Compensation
Purposes was adjusted to exclude the incremental balance in cash and marketable securities as of December 31,
2016 compared with the December 31, 2013 balance, as well as interest expense, associated with the long-term
notes drawn as a result of the execution of our capital allocation strategy.
TOTAL SHAREHOLDER RETURN (TSR) TSR is an amount equal to the net stock price change for our common stock plus the reinvestment of dividends
paid over the prescribed period of time.
Adjusted Operating Income
The following table presents a reconciliation of Operating income as reported to Adjusted operating income for the
years ended December 31, 2009 to 2018:
($ in thousands) Year Ended December 31,
2018 2017 2016 2015 2014 2013 2012 2011 2010 2009
Operating income
(as reported)$375,539 $376,942 $283,614 $324,582 $367,080 $413,705 $376,801 $305,719 $200,182 $115,252
Special items (pre-tax):
Rationalization and
asset impairment
charges
25,285 6,590 — 19,958 30,053 8,463 9,354 282 (384) 29,897
Venezuela
deconsolidation
and remeasurement
losses
— — 34,348 27,214 21,133 12,198 — — 3,123 —
Bargain purchase gain — (49,650) — — — — — — — —
Acquisition transaction
and integration costs4,498 15,002 — — — — — — — —
Amortization of step
up in value of
acquired inventories
— 4,578 — — — — — — — —
Other — — — — — 705 1,381 — — —
Adjusted operating
income$405,322 $353,462 $317,962 $371,754 $418,266 $435,071 $387,536 $306,001 $202,921 $145,149
Adjusted operating
income margin13.4% 13.5% 14.0% 14.7% 14.9% 15.3% 13.6% 11.4% 9.8% 8.4%
/ A - 2
MENU
L I N C O L N E L E C T R I C : 2 0 1 9 P R O X Y S TA T E M E N T
MENU

APPENDIX A—DEFINITIONS AND NON-GAAP FINANCIAL MEASURES
Adjusted Net Income and Adjusted Diluted Earnings per Share
The following table presents reconciliations of Net income and Diluted earnings per share as reported to Adjusted
net income and Adjusted diluted earnings per share for the years ended December 31, 2009 to 2018:
($ in thousands except per share amounts)
Year Ended December 31,
2018 2017 2016 2015 2014 2013 2012 2011 2010 2009
Net income
(as reported)$287,066 $247,503 $198,399 $127,478 $254,686 $293,780 $257,411 $217,186 $130,244 $48,576
Special items:
Rationalization and
asset impairment
charges
25,285 6,590 — 19,958 30,053 8,463 9,354 282 (384) 29,897
Venezuela
deconsolidtion
and remeasurment
losses
— — 34,348 27,214 21,133 12,198 — — 3,123 —
Pension settlement
charges6,686 8,150 — 142,738 — — — — — (2,144)
Bargain purchase gain — (49,650) — — — — — — — —
Acquisition
transaction and
integration costs
4,498 15,002 — — — — — — — —
Amortization of
step up in value
of acquired
inventories
— 4,578 — — — — — — — —
Other — — — — (805) (363) 1,381 — 1,782 2,877
Tax effect of
Special items(6,896) 20,536 (8,293) (57,204) 861 (890) (2,387) (4,889) (5,165) (6,108)
Adjusted net income $316,639 $252,709 $224,454 $260,184 $305,928 $313,188 $265,759 $212,579 $129,600 $73,098
Diluted earnings per
share (as reported)$ 4.37 $ 3.71 $ 2.91 $ 1.70 $ 3.18 $ 3.54 $ 3.06 $ 2.56 $ 1.53 $ 0.57
Special items per share $ 0.45 $ 0.08 $ 0.38 $ 1.78 $ 0.64 $ 0.23 $ 0.10 $ (0.05) $ (0.01) $ 0.29
Adjusted diluted
earnings per share$ 4.82 $ 3.79 $ 3.29 $ 3.48 $ 3.82 $ 3.77 $ 3.16 $ 2.51 $ 1.52 $ 0.86
MENU
/ A - 3

Return on Invested Capital (ROIC)
The following table presents calculations of ROIC for the years ended December 31, 2009 to 2018:
($ in thousands) Year Ended December 31,
2018 2017 2016 2015 2014 2013 2012 2011 2010 2009
Adjusted net
income$316,639 $ 252,709 $ 224,454 $ 260,184 $ 305,928 $ 313,188 $ 265,759 $ 212,579 $ 129,600 $ 73,098
Plus: Interest
expense
(after-tax)
18,386 14,947 11,775 13,469 6,439 1,767 2,597 4,164 4,156 5,293
Less: Interest
income
(after-tax)
5,206 2,955 1,291 1,675 1,909 2,049 2,471 1,938 1,479 2,150
Adjusted net
income
before tax
effected
interest
329,819 264,701 234,938 271,978 310,458 312,906 265,885 214,805 132,277 76,241
Invested capital $1,590,252 $1,638,720 $1,417,799 $1,287,073 $1,356,435 $1,549,775 $1,378,596 $1,296,620 $1,247,183 $1,209,392
Return on
invested
capital
20.7% 16.2% 16.6% 21.1% 22.9% 20.2% 19.3% 16.6% 10.6% 6.3%
MENU
/ A - 4L I N C O L N E L E C T R I C : 2 0 1 9 P R O X Y S TA T E M E N T
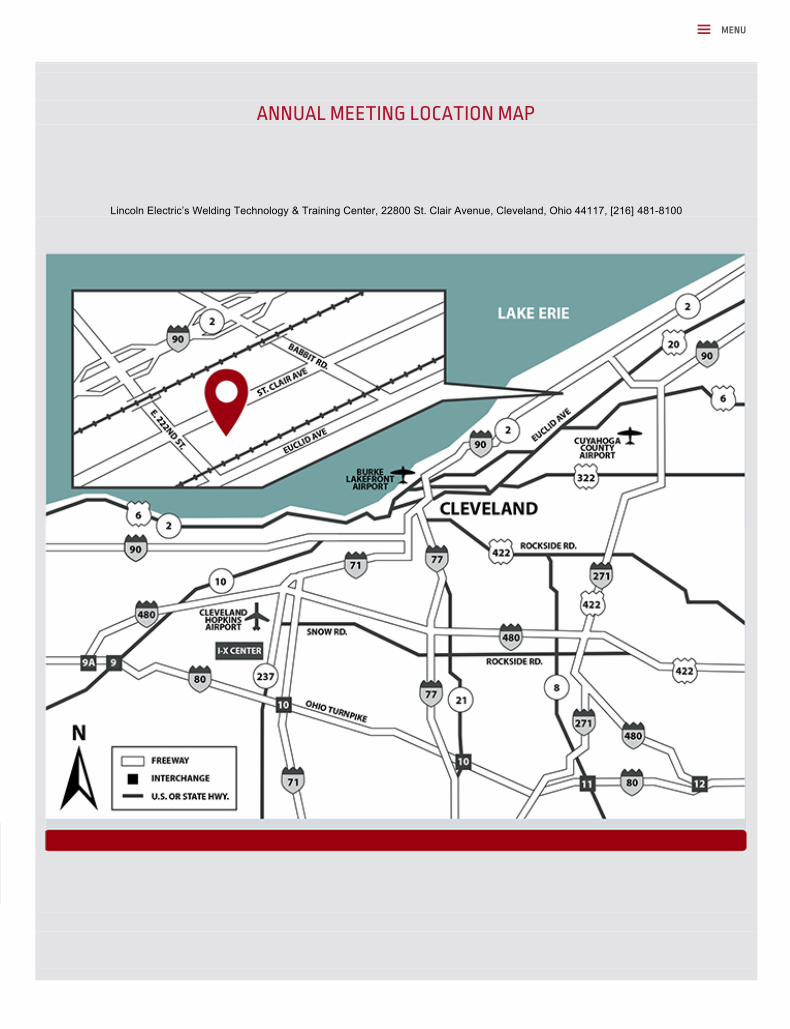
ANNUAL MEETING LOCATION MAP
Lincoln Electric’s Welding Technology & Training Center, 22800 St. Clair Avenue, Cleveland, Ohio 44117, [216] 481-8100
MENU

L IN C O L N E L E C T R IC H O L DIN G S, IN C .
22801 St. Clair Avenue Cleveland, Ohio 44117-1199 U.S.A.
www.lincolnelectric.com
OPERATE JOIN BUILD DESIGN CUT ENGAGE
MENU