TNOVA D4.1 Infrastructure Virtualisation v1.0 - … · Deliverable D4.1 Infrastructure...
89
Deliverable D4.1 Infrastructure Virtualisation Editor Michael J. McGrath (Intel) Contributors Vincenzo Riccobene (Intel). Eleni Trouva, Akis Kourtis, George Xilouris (NCSRD). Marco Di Girolamo, Samuele De Domenico (HP). Kimon Karras (FINT), Ahmed Abujoda, Panagiotis Papadimitriou (LUH). Georgios Gardikis (SPH). Jorge Carapinha (PTIN), Irena Trajkovska, Denis Baudinot, Piyush Harsh (ZHAW). Version 1.0 Date 31 st September, 2015 Distribution PUBLIC (PU) Ref. Ares(2015)4645183 - 28/10/2015
Transcript of TNOVA D4.1 Infrastructure Virtualisation v1.0 - … · Deliverable D4.1 Infrastructure...

Deliverable D4.1
Infrastructure Virtualisation
Editor Michael J. McGrath (Intel)
Contributors Vincenzo Riccobene (Intel). Eleni Trouva, Akis Kourtis, George Xilouris (NCSRD). Marco Di Girolamo, Samuele De Domenico (HP). Kimon Karras (FINT), Ahmed Abujoda, Panagiotis Papadimitriou (LUH). Georgios Gardikis (SPH). Jorge Carapinha (PTIN), Irena Trajkovska, Denis Baudinot, Piyush Harsh (ZHAW).
Version 1.0
Date 31st September, 2015
Distribution PUBLIC (PU)
Ref. Ares(2015)4645183 - 28/10/2015

T-NOVA | Deliverable D4.01 Infrastructure Virtualisation
© T-NOVA Consortium
2
Executive Summary
This deliverable presents the activities under taken and results obtained by Task 4.1 which was focused on the identification, characterisation and optimisation of the hardware and software components that can be used in the implementation of the T-NOVA Infrastructure Virtualisation and Management (IVM) layer. The task carried out characterisation experiments on the networking technologies options which can be used to improve packet processing performance. Technologies investigated included OVS, OVS-DPDK, SR-IOV and Snabb Switch. It was demonstrated that a combination of SR-IOV and DPDK achieved in excess of 8Gbps network throughput. The performance of a non-virtualised virtual Traffic Classifier network function was compared with Docker container and KVM VM implementations, demonstrating that virtualisation through a hypervisor can affect the performance of non-optimised network workloads up to 21%. A new approach to scale switch performance based on a dual-datapath approach was investigated. This approach exhibited high forwarding performance and port density in the accelerated datapath, while the primary datapath exploited the large amount of cache and main memory available in commodity servers to store all required flow state.
The effects of core and non-uniform memory access (NUMA) pinning, core isolation and huge pages on Virtualised Network Function (VNF) performance were investigated. The results obtained showed that the usage of processor pinning can help to achieve improved performance, if properly configured. The effect of NUMA pinning on virtual machine (VM) performance was identified as being significant with an approximately 50% increase in network throughput. Co-location of a virtualised network function (VNF) on the same NUMA node that is attached to the NIC is important for data plane type workloads. The effects of huge page configurations were found to be scenario specific and their performance contribution is higher in the presence of noisy neighbours where they can improve network throughput by 14%. The configuration of the BIOS settings in compute nodes were investigated and appropriate settings identified for an Network Function Virtualisation Infrastructure (NFVI) testbed. The effects of heterogeneous compute resources namely and FPGA system-on-chip (SoC) in an OpenStack environment were also investigated. This activity remains a work in progress.
Using a storage sensitive VNF the effect of different storage configurations were investigated. The results obtained indicate that the use of local disks is preferential to ephemeral volumes. In fact, with ephemeral volumes on local disks, Live Migration becomes bounded to a Storage Live Migration constraint.
Significant VNF workload characterisation activities were carried out in the task. A key enabling capability in the form of a VNF workload characterisation framework was developed by the task. The framework is designed to automatically test various configurations of a VNF, in an iterative manner on different target platforms. The framework provides orchestration of the full test case lifecycle. The framework was applied to the characterisation of a virtual Traffic Classifier. Specifically the framework was used to investigate the potential of ‘network performance intent’ deployments. The effect of the deployment configuration on the performance was demonstrated using a comparison between OVS and SR-IOV network technologies. It was shown

T-NOVA | Deliverable D4.01 Infrastructure Virtualisation
© T-NOVA Consortium
3
that this approach can be used to define optimised deployment configurations in an automated manner to achieve a targeted network throughput performance.
Task 4.1 has developed a collaborative engagement with the OPNFV Yardstick project. A number of areas of contribution have been identified which include the contribution of the VNF characterisation framework, definition and implementation of VNF lifecycle and VNF data plane benchmarking test cases and the contribution of the virtualised Traffic Classifier. This collaborative work is on-going and the contributions are scheduled to form part of the OPNFV Brahmaputra release in 2016.

T-NOVA | Deliverable D4.01 Infrastructure Virtualisation
© T-NOVA Consortium
4
1. CONTENTS
1. INTRODUCTION ........................................................................................................ 8
2. RESOURCE VIRTUALISATION ................................................................................ 10
2.1. WORKLOAD CHARACTERISATION ................................................................................................. 102.2. RESOURCE VIRTUALISATION COMPONENTS ................................................................................ 11
3. OPTIMISATION OF NETWORKING TECHNOLOGIES .......................................... 15
3.1. TESTBED CONFIGURATION ............................................................................................................. 153.2. NETWORK OPTIMISATIONS ............................................................................................................ 16
3.2.1. Non Virtualised (Bare Metal) Switch Comparison ................................................... 183.2.2. Comparison of Network Technologies for VMs ........................................................ 193.2.3. DPDK-SR-IOV VNF Performance Enhancement ...................................................... 21
3.2.3.1. Experimental Configuration ....................................................................................................................... 213.2.3.2. Experimental Results .................................................................................................................................... 23
3.3. SWITCH SCALABILITY ...................................................................................................................... 243.3.1. Data Plane Design .............................................................................................................. 243.3.2. Evaluation .............................................................................................................................. 263.3.3. Switch Scalability Conclusions ....................................................................................... 28
3.4. SNABB SWITCH EVALUATION ...................................................................................................... 283.4.1.1. Configuration and Experimental Issues ................................................................................................ 29
3.5. VNF VIRTUALISATION TECHNOLOGY ........................................................................................... 30
4. COMPUTATIONAL RESOURCE OPTIMISATION .................................................. 33
4.1. CORE PINNING AND ISOLATION ................................................................................................... 334.2. NUMA PINNING ............................................................................................................................ 364.3. HUGE PAGES .................................................................................................................................... 384.4. VNF COMPUTE RESOURCE OPTIMISATION ................................................................................. 394.5. HETEROGENEOUS COMPUTE RESOURCES .................................................................................... 404.6. RECOMMENDATIONS ...................................................................................................................... 42
4.6.1. BIOS Optimisation .............................................................................................................. 424.7. CONFIGURATION RECOMMENDATIONS ....................................................................................... 43
5. STORAGE PERFORMANCE CHARACTERISATION ............................................... 45
5.1. METHODOLOGY ............................................................................................................................... 455.2. TEST CASES ...................................................................................................................................... 465.3. TESTBED CONFIGURATION ............................................................................................................. 495.4. TEST EXECUTION ............................................................................................................................. 495.5. RESULTS AND CONCLUSIONS ........................................................................................................ 50
5.5.1. Further Investigations ........................................................................................................ 54
6. VNF WORKLOAD CHARACTERISATION FRAMEWORK ...................................... 55
6.1. FRAMEWORK OVERVIEW ................................................................................................................ 556.2. FRAMEWORK ARCHITECTURE AND IMPLEMENTATION ............................................................... 566.3. TEMPLATE GENERATION BLOCK .................................................................................................... 57

T-NOVA | Deliverable D4.01 Infrastructure Virtualisation
© T-NOVA Consortium
5
6.4. TEST CASE EXECUTION BLOCK ...................................................................................................... 576.5. DATA ANALYSIS BLOCK .................................................................................................................. 59
7. NFV WORKLOAD CHARACTERISATION .............................................................. 61
7.1. VIRTUALISED TRAFFIC CLASSIFIER ................................................................................................. 617.1.1. Traffic Classifier Architecture .......................................................................................... 62
7.2. EXPERIMENTAL CONFIGURATION .................................................................................................. 627.2.1. Networking Traffic Generation Setup .......................................................................... 63
7.3. TEST CASE SCENARIOS ................................................................................................................... 647.3.1. OVS vs SR-IOV Characterisation ................................................................................... 647.3.2. Network Intent Test Case ................................................................................................. 647.3.3. Results and Discussion ...................................................................................................... 65
7.3.3.1. OVS vs SR-IOV Characterisation .............................................................................................................. 657.3.3.2. Network Intent ................................................................................................................................................ 66
7.4. CONCLUSIONS ................................................................................................................................. 67
8. T-NOVA CONTRIBUTION TO OPNFV YARDSTICK PROJECT ............................. 68
8.1. YARDSTICK PROJECT ....................................................................................................................... 688.2. T-NOVA CONTRIBUTION TO YARDSTICK ................................................................................... 69
8.2.1. Test Cases .............................................................................................................................. 708.2.2. Virtual Traffic Classifier Instantiation Test ................................................................. 728.2.3. Virtual Traffic Classifier Instantiation in the presence of Noisy Neighbours Test ...................................................................................................................................................... 748.2.4. Virtual Traffic Classifier Data Plane Throughput Benchmarking Test.............. 768.2.5. Virtual Traffic Classifier Data Plane Throughput Benchmarking in presence of noisy neighbours Test ............................................................................................................... 78
9. CONCLUSIONS ....................................................................................................... 80
10. LIST OF ACRONYMS ............................................................................................ 83
11. REFERENCES ......................................................................................................... 88

T-NOVA | Deliverable D4.01 Infrastructure Virtualisation
© T-NOVA Consortium
6
Index of Figures
Figure 2-1 Mapping of ONP components to T-NOVA IVM. .................................................. 12Figure 2-2 General Functional Architecture of NFVI Under Test .......................................... 13Figure 3-1 Virtualisation Testbed Architecture ........................................................................... 16Figure 3-2 Network Connectivity Options .................................................................................... 17Figure 3-3 Non-virtualised virtual switch comparison scenario ........................................... 18Figure 3-4 Throughput comparison for the first testing scenario ....................................... 19Figure 3-5 Network technology comparison scenario ............................................................. 19Figure 3-6 Throughput comparison for network processing technologies ..................... 20Figure 3-7 Supported bandwidth comparison for network processing technologies. 21Figure 3-8 Standard Setup .................................................................................................................. 22Figure 3-9 Setup with SR-IOV enabled ports and DPDK on the VM. ................................. 22Figure 3-10 Physical Testbed DPDK vs LibPcap. ......................................................................... 23Figure 3-11 Virtual Machine over SR-IOV Testbed DPDK vs LibPcap. ............................... 24Figure 3-12 Flow distribution vs. data rate ................................................................................... 25Figure 3-13 Throughput for DP0 and DPX with 99% confidence intervals. ..................... 26Figure 3-14 Delay for DP0 and DPX with 99% confidence intervals. .................................. 27Figure 3-15 Experimental setup for the measurement of flow insertion rate. ................ 28Figure 3-16 Throughput calculation for bare metal deployment. ....................................... 31Figure 3-17 Throughput calculation for Docker container deployment. .......................... 31Figure 3-18 Throughput calculation for KVM virtual machine based on an OVS deployment. .............................................................................................................................................. 31Figure 3-19 Throughput calculation for KVM virtual machine based on an SR-IOV deployment. .............................................................................................................................................. 32Figure 4-1 Throughput varying the core pinning configuration for DPDK vSwitch. .... 34Figure 4-2 Throughput varying the core pinning configuration for the VM. .................. 35Figure 4-3CPU idle per core for the non-core pinning scenario. ......................................... 36Figure 4-4 CPU idle per core for the core pinning scenario. ................................................. 36Figure 4-5 The effect of core pinning configuration on throughput ................................. 37Figure 4-6 Packet throughput performance with huge page sizes of 2MB and 1GB .. 39Figure 4-7 – Block diagram of the FPGA SoC system ............................................................... 41Figure 5-1: Local disks without persistent storage .................................................................... 48Figure 5-2 Local disks plus persistent volumes ........................................................................... 48Figure 5-3 SAN disks ............................................................................................................................. 48Figure 5-4 Testbed configuration ..................................................................................................... 49Figure 5-5: Live Migration duration while cache reading ....................................................... 51Figure 5-6: Live Migration duration while cache writing ......................................................... 51Figure 5-7: Live Migration duration while the cache is idle ................................................... 52Figure 5-8: Disk I/O: Live Migration with ephemeral volumes while cache reading .... 52Figure 5-9: Disk I/O: Live Migration with block storage volumes while cache reading........................................................................................................................................................................ 53Figure 6-1 High level architecture of framework ....................................................................... 56Figure 7-1 Virtualised Traffic Classifier High Level Architecture .......................................... 62Figure 7-2 High level architecture of experimental testbed. ................................................. 63Figure 7-3 Testpoint configuration for VNF testing .................................................................. 64Figure 7-4. SR-IOV vs OVS throughput. ......................................................................................... 65

T-NOVA | Deliverable D4.01 Infrastructure Virtualisation
© T-NOVA Consortium
7
Figure 7-5 SR-IOV vs OVS number of detected flows .............................................................. 66Figure 7-6 J48 Decision Tree .............................................................................................................. 66Figure 7-7 Effect of vCPU’s allocation (High and Low performance evenly distributed indicating no influence ......................................................................................................................... 67
Index of Tables
Table 4.1 BIOS options. ......................................................................................................................... 43Table 4.2 Grub Options. ........................................................................................................................ 43Table 5.1 Storage technology option list ...................................................................................... 46Table 6.1 Configuration Metadata CSV file ................................................................................... 60

T-NOVA | Deliverable D4.01 Infrastructure Virtualisation
© T-NOVA Consortium
8
1. INTRODUCTION
Task 4.1 is focused on the functional testing, performance validation and implementation of the hardware and virtualised components within the IVM layer of the T-NOVA system. Virtualisation finds its origins in computing where a single compute resource can be divided into VMs that have same characteristics as a physical compute node with an operating system. Software running on the virtual machines is abstracted from the underlying physical hardware resources. Virtualisation has also expanded beyond its initial focus on compute resources to encompass a variety of different technology approaches such as hardware, operating systems, storage, memory and networking. Collectively, these approaches have enabled the complete virtualisation of infrastructure resources found it a traditional data centre.
Virtualisation is the key enabler technology that allows traditional physical network functions such as firewalls, deep packet inspection etc. to be decoupled from fixed appliances and to be deployed onto industry standard servers in large data centres (DCs). This approach provides key benefits to operators such as greater flexibility, faster delivery of new services, a broader ecosystem enhancing innovation in the network etc.
However virtualisation is not without significant challenges and limitations. Many virtualisation technologies find their origins in the IT domain where performance constraints can be more flexible than those of carrier grade telecom environments. Additionally given the origins of many virtualisation technologies such as cloud OS environments where the focus is on the provisioning of generic resources, capability gaps may exist and key features required for Telco related applications may also be absent. For example in cloud OS environments, where the focus is on provisioning of generic resources; some features required to adequately support VNF/NS type of workloads are absent.
Therefore the appropriate combination of hardware and software technology components coupled with appropriate characterisation for a given operational context is extremely important. It is imperative to understand how the various technology options perform and specifically within the context of the T-NOVA system.
Task 4.1 has specifically focused on various aspects of virtual node (vNode) resource virtualisation. A key aspect of this task was the emphasis on technology characterisation. It is important to contextualise the Telco performance aspects as they are generally multi-faceted in nature. Key influencing factors such as packet sizes and network connection type were identified together with key measures of performance determinism such as packet throughput etc. Various technologies characterisations have been undertaken including key network technologies (virtualised packet switching and packet acceleration), storage and compute (core pinning, NUMA pinning, heterogeneous compute resources etc.). The task also investigated approaches to switch scalability evaluating a forwarding plane option consisting of two datapaths. The task also performed characterisation of virtualised

T-NOVA | Deliverable D4.01 Infrastructure Virtualisation
© T-NOVA Consortium
9
network functions to develop an understanding of the relationship between specific measures of performance such as network throughput and the allocation of resources types and quantities. In this regard the task has developed models which can be used to optimise the deployment of a VNF for a targeted performance through the dynamic allocation of resources at run time.
A number of Best Know Methods (BKMs) have been identified by the task which can be applied to improve both performance of the infrastructure and VNFs. The BKMs included optimised usage of packets accelerators and BIOS settings configuration.
To support the workload characterisation activities a prototype framework for the automated generation of deployment configurations for a given VNF to be tested in an OpenStack environment was developed. The framework automatically builds VNF workload test configurations (for instance in the form of OpenStack Heat templates) based on a configuration file. The configuration file contains the range of defined configuration parameters and their associated value ranges which can be supported by the deployment environment. The framework supports the automated testing of hundreds of deployment configurations to identify the optimal allocation of resources to VNF workloads. The framework also automatically collects, processes and formats the data for a specified analytics platform. The open source WEKA machine learning platform has been used develop decisions trees which relate resource allocations to performance intent.
During the course of the task an exploitation path has been developed with the OPNFV Yardstick project which is focused on VNF Infrastructure verification. Test cases focused on evaluating aspects of VNF performance are being contributed to the Yardstick project. The test cases are being implemented using the VNF characterisation framework to provide full automation of the tests in a reproducible manner. The finalised framework will also be contributed to the Yardstick project.

T-NOVA | Deliverable D4.01 Infrastructure Virtualisation
© T-NOVA Consortium
10
2. RESOURCE VIRTUALISATION VNFs and Network Services composed from VNFs have varying compute, storage and network requirements that are context specific. The potential mix and match of hardware, hypervisors and software can create a high degree of variation between server builds and subsequently VM’s running on those servers. The performance of a VNF is directly linked to the hardware performance, resource allocations and virtualisation technologies (hardware and software). This heterogeneity in resource configurations and resource allocations can significantly impact VNF software performance. It is therefore important from an IVM point of view to develop an understanding of how VNF type workloads interact and consume resources in their host environments and how these interactions vary on a temporal basis. Task 4.1 has focused on identifying, defining and implementing tests cases that correlated VNF performance with the technologies used in the composition of its host environment. The data collected was used to enable insights into the specific composition of resources and their configuration in order to optimise the design of the T-NOVA NFVI.
2.1. Workload Characterisation
As a technology, Network Function Virtualisation (NFV) encompasses a wide variety of network functions which have a diversity of resource requirements. It is important therefore to develop an understanding of the workload types and their affinity for certain platform features and technologies. While it is not possible to identify all the affinities for all VNFs within the scope of Task 4.1, the development of a robust methodology is important. To support the workload characterisation activities in the task, a flexible test-bed platform was developed which was composed of the technologies that were identified in D2.31 as being relevant to the design and implementation of the NFVI.
The ETSI NFV Group Specification provides some general guidance on workload characterisation and the types of metrics that should be monitored [1]. For example they indicate that characterising all VNFs is not practical and therefore define an approach which is based on a testing regime that runs tests for relevant network tasks or workloads. The strategy is to extend the conclusions from a specific VNF to VNF’s of that type. ETSI identifies the following classes of workload [1]:
• Data plane workloads that cover all tasks related to packet handling in end-to-end communications between applications.
• Control plane workloads that cover communications between network functions which are not related to end-to-end communications.
• Signal processing workloads that cover all network function tasks related to digital signal processing as Cloud Radio Access Networks (C-RAN).
• Storage workloads covering all tasks related to disk storage.
The work presented in this deliverable is focused on characterisations related to data plane and storage workloads. Additional work on control plane workload

T-NOVA | Deliverable D4.01 Infrastructure Virtualisation
© T-NOVA Consortium
11
characterisation will be presented in the WP5 deliverables, while signal processing workloads are out of scope for T-NOVA.
VNF workloads can be deployed on high volume servers in two ways, bare metal and virtualised. Parameters such as processor architecture, number of cores, clock rate, memory configuration, peripheral buses or peripheral devices such as network interface cards etc. can have a significant impact on VNF performance. The software design used in the implementation of the VNF can also have a significant impact on performance. For example efficient multi-threaded application design is required to make appropriate use of multi-core processor designs. While non-virtualised (bare metal) deployments are not envisaged within the T-NOVA system, the performance of VNFs when deployed on bare metal is measured in order to establish baseline performance, which can used to quantify the overhead of virtualisation.
Of primary focus from a T-NOVA perspective is the deployment of fully virtualised network functions in virtualised environments. The factors that affect bare metal deployments remain relevant in the context of virtualised deployments however the introduction of virtual machines and hypervisors adds an additional overhead which has a significant influence on behaviour and performance. It should be noted that the overhead/penalties introduced by the hypervisor may be workload type specific. For example with control plane type workloads the virtualisation overhead could be less relevant (even negligible) in comparison to other workload types such as data plane workloads.
2.2. Resource Virtualisation Components
In the design and implementation of an NFVI test-bed, industry initiatives such as ONP (Open Network Platform) and OPNFV (Open Platform for NFV) were monitored closely and their outputs were utilised as appropriate e.g. OVS DPDK netdev. The key components selected for the implementation of a NFVI testbed are show in Figure 2-1. The evaluation of the component technologies are described in detail in sections 3 to 5. OpenStack provides implementation of the Virtualised Infrastructure Manager (VIM). OpenStack is used to manage pools of compute, networking, and storage infrastructure. The OpenStack compute service is called Nova. It is responsible for managing the compute infrastructure in an OpenStack managed cloud. Multiple hypervisor drivers are supported by Nova compute including QEMU/KVM (via libvirt), Xen, and VMware ESXi. For the purposes of the work carried out in Task 4.1 KVM was used exclusively due to its default native support in OpenStack. The OpenStack networking service is called Neutron which is designed to be a scalable service offering many different plug-in solutions to facilitate network management such as the ML2 plugin for OpenDaylight integration. Several network models are available such as a flat network, Virtual LAN (VLAN), VXLAN, GRE and others. IP Address Management (IPAM) support includes static IP address allocation, Dynamic Host Configuration Protocol (DHCP), and Floating IP support, the latter allowing for traffic to be dynamically rerouted in the infrastructure to different compute nodes.
A key decision in selecting a NFVI server is to determine if the processor model is suitable for VNF components supporting data plane workloads. A wide variety of features are potentially relevant in the context of VNF performance such as

T-NOVA | Deliverable D4.01 Infrastructure Virtualisation
© T-NOVA Consortium
12
virtualisation support via instructions to reduce the number of VM exits under certain operations. Other features include hardware support for virtualisation in I/O operations or extended instruction sets for specialised operations e.g. cryptography. In some cases, it is also necessary to know whether those features have been enabled in the BIOS system. The configuration of the BIOS options needed to be carefully considered as they influence the stability of the compute node hosting a VNF. RAM memory capabilities (DDR2 vs. DDR3, number of channels, etc.) can be relevant to memory intensive applications. Although it is possible to derive a set of supported memory speeds from the processor vendor and the model, the specific memory speed depends on the installed memory modules. In order to minimise any potential issues related to hardware performance Open Network Platform (ONP1) compliant hardware was used for the NFVI testbed (Intel Xeon CPU, Intel Communications Chipset 89xx series and Intel Ethernet Controller e.g. X520 T2). The Intel ONP Server software stack consists of released open-source software based on the work carried out in community projects, including contributions made by Intel. The key open-source software ingredients forming the Intel ONP Server software stack are:
• OpenStack • OpenDaylight • DPDK
• Open vSwitch • Linux/KVM
Figure 2-1 Mapping of ONP components to T-NOVA IVM.
The hypervisor also plays a critical role in a performant NFVI. It is important to know if the hypervisor is suitable for VNFCs dealing with data-plane workloads. The hypervisor should have the capability to appropriately exploit the hardware support for virtualisation and in particular for I/O operations. Other characteristics of relevance include: deterministic allocation of threads in CPUs (CPU pinning/affinity), deterministic memory allocation in NUMA nodes (memory pinning/affinity) and deterministic allocation of large pages in NUMA nodes (large memory pages pinning/affinity). Finally the resource topology can have a significant impact in NFV
1 https://01.org/packet-processing/intel%C2%AE-onp-servers

T-NOVA | Deliverable D4.01 Infrastructure Virtualisation
© T-NOVA Consortium
13
scenarios. When deploying VNFs it may be important to consider the location of the CPU, memory and I/O devices not only in terms of numbers, but also in terms of proximity e.g. ensure the VNFC’s of the same VNF are deployed on the same NUMA node or VNFC’s are deployed on the NUMA node with the network card attached. Within T-NOVA this information is collected and exposed by the information resource repository functional component of the T-NOVA Orchestrator.
Analysis of the IVM requirements in D2.31 was utilised in the identification of the activities carried out in sections 3 to 7. For validation and characterisation of the Network Function Virtualisation Infrastructure (NFVI), the NFVI represents the system under test (SUT) as shown in Figure 2-2 [2].
Figure 2-2 General Functional Architecture of NFVI Under Test
The SUT comprises of the following functions under test:
• Physical Compute
• Physical Network
• Physical Storage
• Virtualisation Layer
• Virtual Compute
• Virtual Network
• Virtual Storage
The test environment which was used for the experimental activities in sections 3-7 consists of an implementation of NFV MANO functional components e.g. VIM as necessary plus a Test Controller, Test VNFs, and a Performance Monitor (e.g. Telemetry Platform).

T-NOVA | Deliverable D4.01 Infrastructure Virtualisation
© T-NOVA Consortium
14
In shared NFV environments, VNFs will likely be instantiated, scaled or terminated at exactly the same instant that many other VNFs are executing in steady state on the same server. This means that one VNF’s lifecycle operation can both affect and be affected by the presence or performance of other VNFs executing at the same time, which makes it essential to thoroughly test the different phases of a VNF’s lifecycle. To address this requirement test cases need to be defined for VNF data plane benchmarking, VNF Lifecycle and VNF storage benchmarking. These test requirements are defined in the context of the contribution to the OPNFV Yardstick project (see section 9.0).

T-NOVA | Deliverable D4.01 Infrastructure Virtualisation
© T-NOVA Consortium
15
3. OPTIMISATION OF NETWORKING TECHNOLOGIES
The characterisation of network technologies plays an important role in the ability to predict the behaviour of a technology for a given context i.e. a particular use case, when combined with other technologies, etc.
Accurate characterisation of network technologies is important in the context of the VNF/NS that will be supported by the T-NOVA system. Appropriate characterisation enables the predictability of VNF behaviour for a given set of resource types which is important when providing SLAs to customers for a purchased service. Secondly, it provides key insights into which technologies or combination of technologies should be selected and how they should be configured to achieve a desired performance level across a range of performance criteria such as throughput, latency, etc. The following sections describe the testbed configuration that was used to perform the network technology characterisation activities within the task. The selected technologies, protocols used and the key findings are also described.
3.1. Testbed Configuration
A key activity in Task 4.1 was the design and implementation of a testbed platform to support workload and technology characterisation activities within the task. The architecture implemented for the majority of the experimental work described in sections 3, 4 and 7 is shown in Figure 3.1. The development and deployment of this architecture evolved over the lifetime of the task to ensure that the constituent platform elements were representative of current industry adoption trends.
The testbed is currently composed of three primary nodes: one controller and two compute nodes. The Controller acts as VIM (Virtual Infrastructure Manager - see Figure 3.1), and hosts the Cloud Controller (OpenStack Nova and Neutron) along with the Network Controller (OpenDaylight), integrated via the Neutron ML2 plugin.
The compute nodes include Nova compute, which communicates with the controller through the management network. Virtualisation of the compute resources is based on the use of a KVM hypervisor and a libvirt hypervisor controller.
From a hardware perspective, all the hosts include an Intel® Ethernet Converged Network Adapter X540-T2 NIC, which has dual Ethernet 10GB ports, supporting SR-IOV and DPDK technologies: one port is connected to the management network and the other is connected to the data network. The controller and the compute node used as a packet generator were based on Intel® Core™ i7 4770, 3.40GHz CPUs with 32GB of RAM. Initially the second compute node were based on dual socket servers with Intel® Xeon® E5 2680 v2, 2.8GHz CPUs and 96GB of RAM. The Xeon E5 computing architecture provides 10 cores per processor (20 cores in total) with 8GT/s Quick Path Interconnects (QPI) for inter socket communications.
The compute nodes (x2) were upgraded to Intel® Xeon® E5 2697v3, 2.6GHz and 64 GB of RAM. This Intel Xeon E5 provides 14 cores per processor (28 cores in total) with 9.6GT/s Quick Path Interconnects for inter socket communications. Additionally the

T-NOVA | Deliverable D4.01 Infrastructure Virtualisation
© T-NOVA Consortium
16
processor architecture has a set of platform features of interest to T-NOVA such as VT-x, VT-d, Extended page tables (EPT), TSX-NI, and Trusted Execution Technology (TXT). The controller and packet generator nodes based on Intel® Core™ i7 4770, 3.40GHz CPUs with 32GB of RAM were retained
The physical network-switching element of the test bed comprises of an Extreme® networks 10Gbps, 48-port SDN capable switch (Summit® X670V-48t) and a NETGEAR® 10Gbps 24 port non-SDN switch. The connectivity between the NICs of the compute nodes and the switch is provided by CAT7 cables.
From a software stack perspective the Juno release of OpenStack was initially used which was later upgraded to the Kilo release. SDN based control was provided by the Hydrogen release of OpenDaylight which was later upgraded to the Lithium release. Integration with OpenStack and OpenDaylight was implemented using the Neutron ML2 plugin.
Figure 3-1 Virtualisation Testbed Architecture
3.2. Network Optimisations
The manner in which a system and as a consequence the VNF workloads running on that system are connected to the network has a major impact on performance. There are several options currently available to provide network connectivity as shown in Figure 3-2.
T-NOVA | Deliverable D4.01 Infrastructure Virtualisation
© T-NOVA Consortium
17
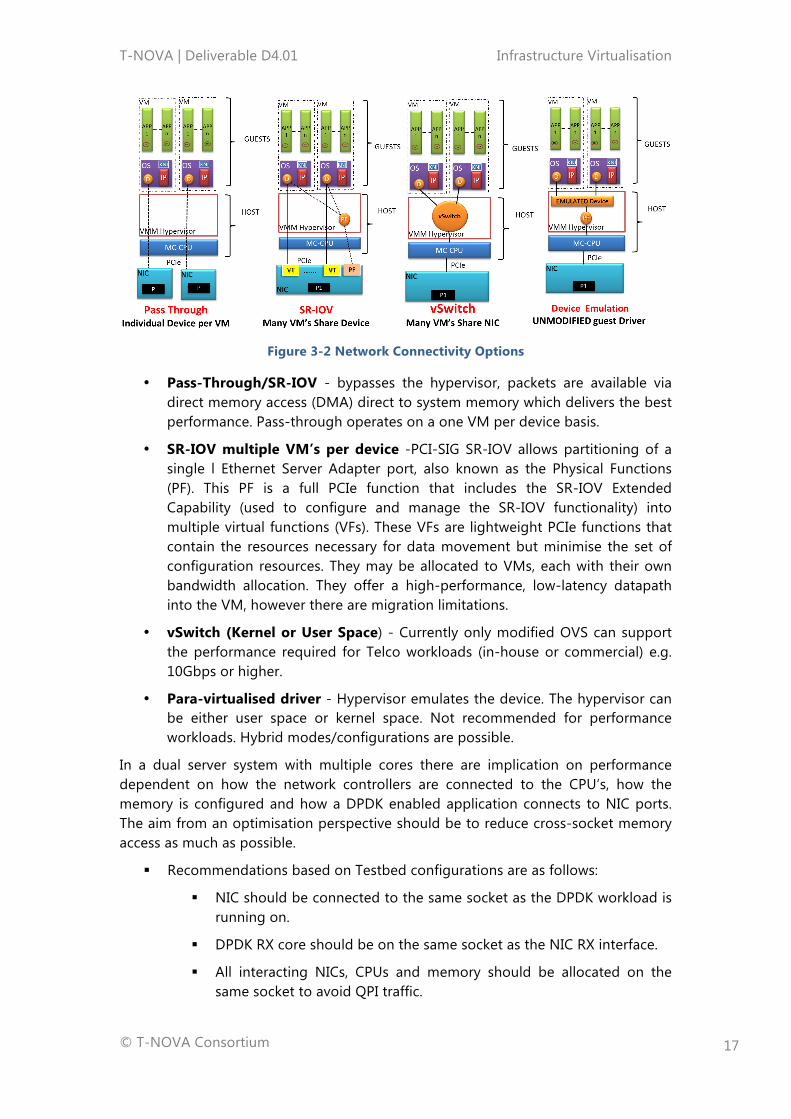
Figure 3-2 Network Connectivity Options
• Pass-Through/SR-IOV - bypasses the hypervisor, packets are available via direct memory access (DMA) direct to system memory which delivers the best performance. Pass-through operates on a one VM per device basis.
• SR-IOV multiple VM’s per device -PCI-SIG SR-IOV allows partitioning of a single l Ethernet Server Adapter port, also known as the Physical Functions (PF). This PF is a full PCIe function that includes the SR-IOV Extended Capability (used to configure and manage the SR-IOV functionality) into multiple virtual functions (VFs). These VFs are lightweight PCIe functions that contain the resources necessary for data movement but minimise the set of configuration resources. They may be allocated to VMs, each with their own bandwidth allocation. They offer a high-performance, low-latency datapath into the VM, however there are migration limitations.
• vSwitch (Kernel or User Space) - Currently only modified OVS can support the performance required for Telco workloads (in-house or commercial) e.g. 10Gbps or higher.
• Para-virtualised driver - Hypervisor emulates the device. The hypervisor can be either user space or kernel space. Not recommended for performance workloads. Hybrid modes/configurations are possible.
In a dual server system with multiple cores there are implication on performance dependent on how the network controllers are connected to the CPU’s, how the memory is configured and how a DPDK enabled application connects to NIC ports. The aim from an optimisation perspective should be to reduce cross-socket memory access as much as possible.
§ Recommendations based on Testbed configurations are as follows:
§ NIC should be connected to the same socket as the DPDK workload is running on.
§ DPDK RX core should be on the same socket as the NIC RX interface.
§ All interacting NICs, CPUs and memory should be allocated on the same socket to avoid QPI traffic.

T-NOVA | Deliverable D4.01 Infrastructure Virtualisation
© T-NOVA Consortium
18
§ Huge Page support at host level in kernel huge pages.
The experiments outlined in the following sections have been focused mainly on the network throughput metric. The Internet Engineering Task Force (IETF) developed RFC2544 [3] which outlines a benchmarking methodology for network Interconnect Devices was utilised. The methodology defines performance metrics such as latency, frame loss percentage, and maximum data throughput.
Using RFC2544 as a basis, throughput was measured in millions of frames per second where the frame size refers to Ethernet frames ranging from 64 bytes to 1518 bytes. For 64-byte frames, a line rate of 10Gbps translates to 14.88 million packets per second for unidirectional traffic.
The Device under Test (DUT) has 2 NICs, both connected to a packet generator: one NIC receives the packets, whereas the other NIC is used to send back the traffic to the packet generator where it measures the throughput. The packet generator selected for the experiments was DPDK Pktgen [4] which is an open source version of the Linux Foundation Pktgen based on Intel’s DPDK library. It was selected due to its free availability and its ability to send packets at 10Gbps line rate speeds. It is possible to physically assign one or more CPU cores directly to the sending and receiving processes over the NICs. In the current configuration, one core was assigned to the processor that generates the packets and one core is assigned to each transmission queue for transmitting packets onto the network. A new feature introduced in the latest release is the capability to run more than one instance on the same host which can be exploited in the creation of different packet flows.
To maximise the efficiency of the packet generator, a Command Line Interface (CLI) is available to set and start the transmission of the network traffic. Moreover, it is possible to create scripts using the Lua programming language [5] to automate the packet generation process, defining traffic profiles and the behaviour of the packet generator. Exploiting this feature for the purpose of this experiment, a Lua script was implemented, following the RFC 2544 recommendations, with different packets sizes, automating the test for the various configurations under test.
3.2.1. Non Virtualised (Bare Metal) Switch Comparison
Testing has been focused initially on comparing the throughput of both the Open vSwitch and the DPDK vSwitch technologies in a non-virtualised (bare metal) scenario. Such a scenario is shown in Figure 3-3.
Figure 3-3 Non-virtualised virtual switch comparison scenario

T-NOVA | Deliverable D4.01 Infrastructure Virtualisation
© T-NOVA Consortium
19
As shown in the Figure 3-3, this scenario does not involve VMs: the packet generator sends the traffic to a server hosting a virtual switch; the switch is configured in both the cases (OVS and DPDK OVS) in a manner where it is connected to the two physical ports of the server; it receives traffic input on the first port and sends it back on the second port; the packet generator then measures the throughput of the switch in such a bare metal deployment. This configuration is also called physical-port-to-physical-port where it forwards the traffic received through NIC1 onto NIC 2. The results obtained are shown in Figure 3-4.
Figure 3-4 Throughput comparison for the first testing scenario
The results clearly shows that the DPDK vSwitch provided significantly better packet switching performance with respect to Open vSwitch in a physical-port-to-physical-port scenario.
3.2.2. Comparison of Network Technologies for VMs A set of experiments was carried which compared a number of potential network configuration which could be utilised in the deployment of a VM/VNF as shown in Figure 3-5.
Figure 3-5 Network technology comparison scenario
0
2
4
6
8
10
12
64 128 256 512 1024 1280 1518
Milli
on P
acke
t per
Sec
ond
Packet Size (Bytes)
Open vSwitchDPDK vSwitch

T-NOVA | Deliverable D4.01 Infrastructure Virtualisation
© T-NOVA Consortium
20
The configurations shown in the Figure 3-5 compares OVS (a), DPDK vSwitch (b and c) and SR-IOV (d) when used with a VM. More specifically, the first and the second cases relate to the usage of OVS and DPDK vSwitch respectively to provide network connectivity to a VM that is based on Linux Kernel packet processing; the third and fourth scenarios (Figure 3-5 (c) and (d)) are focused on supporting a VM which is using the DPDK Pull Mode Driver (PMD) on top of DPDK vSwitch and an SR-IOV port. The results obtained are shown in Figure 3-6.
Figure 3-6 Throughput comparison for network processing technologies
It is clear from Figure 3-6 that the major bottleneck at the infrastructure layer is related to the communication between the VM and the physical host. Using DPDK in virtual switching technology provided superior performance in comparison to the non-DPDK accelerated version of OVS. The most visible output from the results is represented by the usage of the DPDK PMD within the guest VM. This is the main reason why developers are encouraged to use the DPDK library within the VM in order to achieve maximum throughput. The usage of SR-IOV in conjunction with DPDK vSwitch further improves the performance achievable by the VM. Another perspective is presented in Figure 3-7, where the same results are shown in terms of supported bandwidth. The use of SR-IOV channels achieves 100% exploitation of the available bandwidth (i.e. 10Gbps) for almost all the packet sizes used in the tests.

T-NOVA | Deliverable D4.01 Infrastructure Virtualisation
© T-NOVA Consortium
21
Figure 3-7 Supported bandwidth comparison for network processing technologies.
3.2.3. DPDK-SR-IOV VNF Performance Enhancement
The previous sections outlined the various virtualised data plane connection options for VNF network connectivity. As previously discussed, SR-IOV bypasses the hypervisor layer, allowing packets to be sent directly to the NIC while DPDK bypasses the kernel network I/O stack in the VM. While individually these technologies provide significant improvement in VNF performance, they have the potential to be used in combination as shown in Section 3.2.2 to deliver increased network throughput performance. The primary goal of the experimental protocol described in this section was to evaluate and quantify the performance improvements enabled by both SR-IOV and DPDK in comparison to the standard Linux network stack for a virtualised Traffic Classifier (vTC) developed by NCSRD. A description of the vTC is provided in Section 6.1.
3.2.3.1. Experimental Configuration
The tests outlined in this section were carried out on NCSRD’s testbed that is a separate instantiation of the testbed outlined in section 3-1 but is based on the same compute and networking components. Two setup configurations were utilised for performance testing of the traffic classifier VNF. Both test deployments were performed using servers with Intel® Xeon® E5-2620 v3 @ 2.40GHz CPUs. Each server had a dual port 10Gbit Intel® Ethernet Converged Network Adapter X520-T2. In both configurations one server was used as a traffic generator and the second server hosted the vTC application. The first test case was performed at the physical layer meaning the vTC application was executed in a non-virtualised manner i.e. ‘bare metal’ using the physical NICs, whereas in the second test the vTC application was deployed as a VM through a KVM hypervisor with the packets arriving through an SR-IOV fast path. In both performance tests two versions of the vTC application were evaluated, using LibPCAP [6, 7] and DPDK. The purpose of the first configuration was

T-NOVA | Deliverable D4.01 Infrastructure Virtualisation
© T-NOVA Consortium
22
to benchmark and set a baseline performance for the DPDK enhanced vTC application.
In Figures 3-8 and 3-9 an overview of the two configuration setups is shown. Figure 3-8 outlines the baseline setup, where no additional modifications were made to enhance the performance of the vTC. In both the physical NIC and virtual NIC driver layers, the Linux kernel network stack handles the packets. The vTC application in both tests (physical and virtualised), uses the LibPCAP in order to read and analyse the network traffic received.
Figure 3-8 Standard Setup
Figure 3-9 shows SR-IOV enablement at the physical NIC of the host server. A corresponding VF driver is attached to the vTC virtual machine. The virtual NIC is loaded with the DPDK driver for faster NIC-userspace communication. In this configuration the vTC application reads and processes the packets received using the DPDK framework, in both the physical and virtualised experiments.
Figure 3-9 Setup with SR-IOV enabled ports and DPDK on the VM.

T-NOVA | Deliverable D4.01 Infrastructure Virtualisation
© T-NOVA Consortium
23
For the evaluation and benchmarking of the vTC, the DPDK PktGen [8] traffic generator was used to replay a PCAP file generated from real traffic traces captured in NCSRD.
3.2.3.2. Experimental Results
This section presents the results of comparison tests between DPDK and LibPcap versions of the vTC in physical and virtualised environments. The traffic for both experimental evaluations was generated by a traffic generator in a linear manner from 1 to 100%, with 1% increments per second. Traffic statistics were collected from the VNF every second and were post processed for performance evaluation.
A comparison of the packet processing performance of the LibPcap based deployment of the vTC versus the DPDK accelerated version of the VNF under a bare metal scenario is shown in Figure 3-10. The results clearly show that the vTC’s performance is significantly improved when DPDK is used to accelerate packet processing. The LibPcap version exhibited saturation at approximate 1Gbps. This throughput compares poorly to the approximately line rate performance of the DPDK accelerated version.
Figure 3-10 Physical Testbed DPDK vs LibPcap.
A second set of experiments focused on identifying the effect of combining SR-IOV and DPDK on vTC performance when deployed as a VM. A linear scaling network traffic load up to 10Gbps was used to stress test both the LibPCAP and SR-IOV/DPDK versions of the vTC VM.
As shown in Figure 3-11 the SR-IOV/DPDK version achieves approximately 80% of line rate packet transmission performance. The LibPCAP version displayed saturation effect at 1Gbps with an 87.5% throughput reduction in comparison to the DPDK version. The results also indicate that DPDK’s performance in the virtualised scenario is degraded to, approximately 21% in comparison with the corresponding physical test. Additionally, in the DPDK-SRIOV setup the number of packets processed is steadily degraded compared to the total traffic sent. This can be explained by the fact that during the tests core-pinning and NUMA-pinning was not utilised, resulting in the DPDK-VM using 100% of the virtual CPU, however this does imply 100% utilisation of the physical CPU. The resources were not bound exclusively to each process demanding them, and this resulted in a percentage allocation according the workload each time.

T-NOVA | Deliverable D4.01 Infrastructure Virtualisation
© T-NOVA Consortium
24
The results indicate the promising performance of the virtualised vTC solution, and a clear improvement when DPDK is utilised. The gap in performance between the physical and the virtualised solution shows further optimisation is required in order for the VNF to achieve performance close to the corresponding physical vTC solution i.e. line rate. Additionally, it is clear that despite the use of SR-IOV the network kernel stack remained the bottleneck in the packet processing path. Detailed description of the experimental setup and results can be found in [9].
Figure 3-11 Virtual Machine over SR-IOV Testbed DPDK vs LibPcap.
3.3. Switch Scalability
Service chaining requires the installation of flow entries in OpenFlow switches located in data centres, such that traffic will traverse the NFs in the exact order specified in the service chain. This requirement necessitates the installation of a large number of flow entries in switches, especially with an increasing number of network functions. This, in turn, can result in data scalability issue for the T-NOVA system, as OpenFlow switches typically have relatively small flow table sizes (i.e., several thousand entries).
3.3.1. Data Plane Design To mitigate the problem of switch scalability, a dual datapath approach was employed, i.e., a forwarding plane consisting of a primary datapath (DP0) hosted on a commodity server, and an external OpenFlow switch that acts as an accelerated datapath (DPX) (see Figure 3-12). This allows the exploitation of the advantages of commodity servers and switches, while mitigating their inherent limitations.

T-NOVA | Deliverable D4.01 Infrastructure Virtualisation
© T-NOVA Consortium
25
Figure 3-12 Flow distribution versus data rate
More specifically, commodity servers are equipped with a large amount of memory, sufficient for storing a large number of flow entries. Despite the recent advances in commodity hardware (e.g., non-uniform memory architectures, network cards with hardware multi-queueing) and technologies for high-performance packet I/O (e.g., DPDK, netmap [10]) servers cannot yet match the packet forwarding performance rates of specialised hardware. On the other hand, switches offer higher forwarding capacity and port density but have limitations in terms of flow table size.
Figure 3-12 Flow distribution vs. data rate
The feasibility of the proposed dual-datapath approach mainly stems from the Zipf (Figure 3-13) property of aggregate traffic, i.e. a few flows carry a high percentage of the total traffic. For instance, based on a public trace captured on a 1Gb link of an access router of a residential ISP in [11], 100 prefixes comprised more than 50% of the total traffic, while 1000 prefixes account for 80% of the total traffic. Hence, this allows us to maintain all forwarding rules in DP0's flow table, while the DPX only caches large-volume flows (elephants).
By caching a small number of flow entries in the DPX, the traffic overhead on the DP0 and the DPX interconnection can be significantly decreased. In particular, a set of low-priority, infrastructure entries redirect traffic from the OpenFlow switch to the

T-NOVA | Deliverable D4.01 Infrastructure Virtualisation
© T-NOVA Consortium
26
DP0, when no high-priority flow entries were cached at the switch (i.e., acting as a fall-back path). It is the responsibility of the controller to select the flows that will be cached to DPX as well as the rate at which the cache is updated. This can be achieved using traditional caching techniques (e.g., LFU, LRU), or a more recent technique which yields higher efficiency [11].
3.3.2. Evaluation
The performance and feasibility of the proposed data plane design were assessed using a prototype implementation consisting of a Pronto 3290 switch with 48 1Gbps ports for the accelerated datapath (DPX) and Open vSwitch [12] for the primary datapath (DP0) running on a server with an Intel Nehalem CPU with four cores @2.27GHz and 4GB of RAM. DP0 and DPX were interconnected over four 1Gbps datapath links.
Figure 3-13 Throughput for DP0 and DPX with 99% confidence intervals.
Initially the throughput and latency with DP0 and DPX were measured. Figure 3-14 shows the mean achievable throughput rates for traffic with packet sizes ranging from 64 to 1500 bytes. For each packet size, 1Gbps CBR traffic was injected into the system and the rate at the output of the datapath measured for 100 seconds. Each experiment was repeated 25 times. As expected, the DPX forwards traffic at line rate for all packet sizes. On the other hand, DP0 can only sustain the maximum throughput for packets larger than 100B. This corresponds to a packet forwarding rate of 1Mpps (this forwarding limit is illustrated as a dashed line in Figure 3-14). This limitation of Open vSwitch has also been reported in Netmap [10] where an improved I/O technique is presented which increases the forwarding rate to nearly 3Mpps. To investigate this further, measurements using Click Modular Router [13] were repeated for DP0. It was found that a CPU core saturates a one 1G link with 64B packets. Furthermore, the forwarding performance scales linearly with the number of cores. The achievable throughput is also expected to scale with additional NUMA nodes due

T-NOVA | Deliverable D4.01 Infrastructure Virtualisation
© T-NOVA Consortium
27
to the integrated memory controllers that alleviate the main memory access latency limitations in shared-memory architectures [14].
The delay for packets traversing DP0 and DPX were also measured. The results for different packet sizes are shown in Figure 3-15 for 1000 runs. Packet forwarding at DPX incurs a minimum delay of 4 µs which increases linearly with the packet size with a slope corresponding to the transmission delay of the 1G link. For DP0 the minimum delay is 18.6 µs.
Figure 3-14 Delay for DP0 and DPX with 99% confidence intervals.
Moreover, the feasibility of the proposed data plane design is affected by (i) the rates with which new flows can be generated and inserted into the switch flow table, and (ii) the packet processing capacity of DP0 and the datapath link. The datapath flow insertion rate R directly influences the rate at which the flow cache manager may update cached entries. To evaluate R, CBR traffic was injected into DP0 and DPX using the setup in Figure 3-16 and generated a burst of 4000 routing flow modification messages, where the action of each flow entry is set to update the flow’s destination MAC address with an incremented value. The time required for the installation of a new flow entry in the switch was measured by capturing the interval tf between two packets with different destination MAC addresses at the egress of the switch. The mean flow insertion rates for DP0 and DPX were 12554/s and 715/s, respectively. It is expected these rates will increase further, as OpenFlow datapath implementations continue to improve. Since most OpenFlow controllers are capable of generating OpenFlow messages at significantly higher rates (several millions per second), the generation rate of flow modification messages at the flow management proxy does not result in a limitation for the data plane approach outlined.

T-NOVA | Deliverable D4.01 Infrastructure Virtualisation
© T-NOVA Consortium
28
Figure 3-15 Experimental setup for the measurement of flow insertion rate.
The enhancements in terms of packet I/O along with parallelisation across cores enable modern commodity servers to achieve throughput rates higher than 10Gbps. This indicates that the packet processing capacity of modern commodity servers is sufficient to handle the long tail of Internet traffic distribution with several thousands large-volume flows being offloaded to DPX. For instance, based on a public trace captured on a 1Gb link of an access router of a residential ISP, 100 prefixes were found to comprise more than 50% of the total traffic, while 1000 prefixes account for 80% of the total traffic. Using the latest OpenFlow-enabled switches with tens of thousands flow entries, it is feasible to offload 1000 prefixes for each port, thus leaving only 20% of the traffic to be processed by the primary datapath. A packet processing capacity in excess of 10Gbps is sufficient for DP0 to handle mice (i.e. percentage of flows with low volume, see figure 3-13) traffic.
3.3.3. Switch Scalability Conclusions
To mitigate the problem of the small switch flow tables, a dual-datapath approach was employed that exhibits high forwarding performance and port density in the accelerated datapath, while the primary datapath exploits the large amount of cache and main memory available in commodity servers to store all required flow state. This essentially enables service chaining at massive scale, and thus NFaaS offerings to a large number of customers. The results obtained corroborate the feasibility of the data plane approach.
3.4. SNABB Switch Evaluation
Snabb Switch [15] is a simple and fast packet open source networking toolkit that runs as a stand-alone Linux userspace executable. It is being developed in a simple, minimalistic manner to support intuitive use by the user. Snabb Switch is written using three main techniques:
• Lua, a high-level programming language that is easy to learn. • LuaJIT, a just-in-time compiler that is competitive with C. • Ethernet I/O with no kernel overhead ("kernel bypass" mode).

T-NOVA | Deliverable D4.01 Infrastructure Virtualisation
© T-NOVA Consortium
29
Snabb Switch can also be defined as a virtualised Ethernet networking stack. It can be used as the underlying framework where users can build on top of the existing features, develop their own custom features or extending its functionality with Lua scripts.
The first generation of Snabb Switch applications include:
Snabb NFV makes QEMU/KVM networking performance practical for applications that require high packet rates, such as ISP core routers. It is intended for people who want to process up to 10Gbps or 50Mpps of Virtio-net network traffic per server. Snabb NFV can be deployed in a stand-alone mode with QEMU or it can be integrated with a cloud computing platform such as OpenStack. The OpenStack implementation includes switching, firewalling, some QoS capabilities, tunnelling and other features that are being developed specifically for NFV. It can be considered as a potential alternative to Open vSwitch, although it is possible to utilise both in the same environment.
Snabb Switch has a specific use case for its OpenStack Neutron plugin. It assumes you have a network in place, which you want to connect the VMs to the network. The target user is therefore someone who wants to deploy hardware virtualisation. Snabb switch provides a wide range of hardware virtualisation features, which allows the NIC to provide packet-switching and provide QoS capabilities, while achieving near line rate performance. Snabb switch copies all traffic to virtio within VMs using zero-copy methodology. It also ensures that the packet filtering, QoS and tunnelling gives the user the full OpenStack Neutron abstraction rather than just the subset the hardware can handle directly.
Snabb Switch is in relatively early stages of development and has been developed with a focus on Intel CPU’s (typically Xeon), and a limited number of Intel network interface cards.
3.4.1.1. Configuration and Experimental Issues
For the purposes of evaluating alternatives to DPDK in userspace packet processing accelerating frameworks, SnabbNFV was deployed in the NCSRD testbed. Although Snabb switch looked initially promising and is potentially simpler than DPDK (DPDK is over 10 million lines of code), it was found that at its current early stage development status successful integration into the NCRSD testbed was not possible due to various technical issues.
Firstly, the current stable release support for network interface cards is limited to Intel’s 82599 driver. The system under test utilised Intel’s x540-T2 10Gbps cards, which are compliant to the 82599 driver, but are currently not directly supported by the Snabb switch’s stable release. This incompatibility was resolved after using the “next” branch of Snabb switch, which is intended for future release and is currently under-test.
The test scenario based on a simple QEMU-VM using Snabb switch’s SnabbNFV program in order for the virtual network interface to work over Snabbswitch’s userspace was investigated. The SnabbNFV consists of two software components; the first is the Snabb driver that is loaded on the NIC, running as a socket file providing

T-NOVA | Deliverable D4.01 Infrastructure Virtualisation
© T-NOVA Consortium
30
debugging information, the second component is a spawning QEMU instance for the VM hosting. The association between the two components is done through the socket file of the driver file, which is loaded as a parameter in the QEMU instance. The advised QEMU version for use is the 2.1.0-vhost-user, which is a version previous to the current QEMU release. This resulted in numerous compatibility problems and issues, even when attempting to run a QEMU-VM with a Snabb-vNIC. The issues encountered revolved mainly around huge pages allocations and mounting as a device on the VM. The issues were mainly caused by poor debugging info provided by the version of QEMU. After surmounting these issues and finally managing to successfully run a QEMU-VM with Snabb-driver loaded network interface, the VM failed to receive any packets. Additionally, the SnabbNFV driver program running for the virtual NIC, although successfully acknowledging the port attachment it did not show any incoming packets from the traffic generator. Also in [16] it reports that with various OS distributions, Snabb switch may fail to receive any packets, resulting in failed tests.
Due to the breath of issues encountered during the installation and configuration of Snabb switch and as a result of its current immaturity it is not a viable candidate for use within the T-NOVA project at this time. Moreover the set-up of a simple QEMU-VM scenario was very challenging and the supporting documentation is difficult to follow [17] therefore it was concluded that Snabb switch does not make a viable candidate for the required T-NOVA functionality, however the overall the Snabb switch project has significant potential and adoption will become more viable as it matures.
3.5. VNF Virtualisation Technology
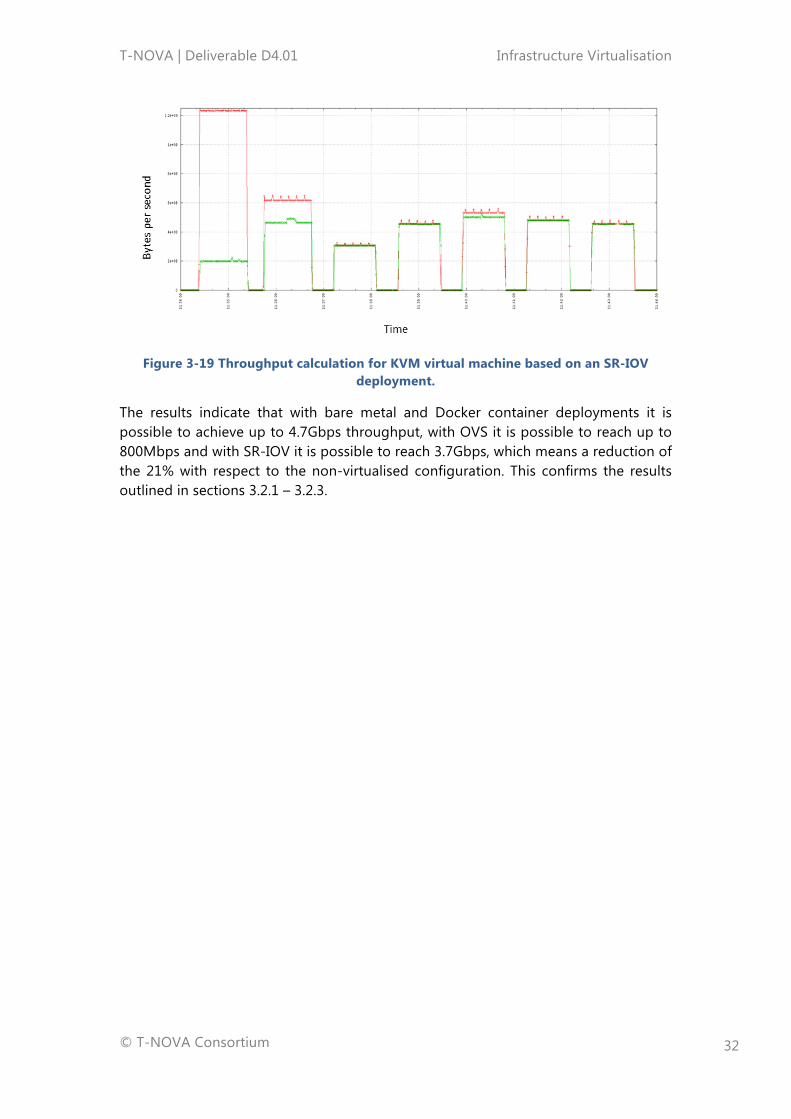
Another important aspect to be considered is the virtualisation technology used. From a T-NOVA perspective a flexible virtualisation environment is required. As it is important to quantify how particular options impact VNF performance, a set of experiments were conducted using the LibPCAP version of the vTC developed by NCSRD. The experiments show a comparison in terms of supported network throughput between different deployments using different virtualisation technologies, namely: bare metal, Docker container, KVM virtual machine based on OVS and KVM virtual machines based on SR-IOV deployments. The results obtained are shown in Figures 3-17 to 3-20.
The figures show metrics from the network interfaces of the testbed. More specifically the red lines (in all the figures) represent the number of bytes per second sent by the packet generator, whereas the green lines represent the traffic sent back from the vTC to the packet gen. In order to measure these values, a telemetry agent was installed on the infrastructure. The network throughput was measured using the Workload Characterisation Framework (see Section 6). The framework module responsible for calculating latency implements a non-extensive search algorithm which is designed to avoid checking all possible bandwidth values (from 1 to 100%) by using a stepping mechanism which halves the bandwidth at each step until a match is identified. The throughput was calculated using packets of 1280 bytes.

T-NOVA | Deliverable D4.01 Infrastructure Virtualisation
© T-NOVA Consortium
31
Figure 3-16 Throughput calculation for bare metal deployment.
Figure 3-17 Throughput calculation for Docker container deployment.
Figure 3-18 Throughput calculation for KVM virtual machine based on an OVS deployment.
T-NOVA | Deliverable D4.01 Infrastructure Virtualisation
© T-NOVA Consortium
32
Figure 3-19 Throughput calculation for KVM virtual machine based on an SR-IOV deployment.
The results indicate that with bare metal and Docker container deployments it is possible to achieve up to 4.7Gbps throughput, with OVS it is possible to reach up to 800Mbps and with SR-IOV it is possible to reach 3.7Gbps, which means a reduction of the 21% with respect to the non-virtualised configuration. This confirms the results outlined in sections 3.2.1 – 3.2.3.

T-NOVA | Deliverable D4.01 Infrastructure Virtualisation
© T-NOVA Consortium
33
4. COMPUTATIONAL RESOURCE OPTIMISATION
The characteristics of the underlying server architecture can have a significant influence on VNF performance. Parameters such the processor architecture, bandwidth of buses (peripheral, inter-processor), availability of specialist instruction sets (AES-NI), have a strong influence on how a VNF behaves on the specific compute hardware. It is also important from a software perspective to ensure that a VNF is designed to appropriately to leverage the features of the server such as such multi-core and multi socket architectures. Software developers need to consider aspects such as multi-threading, pipelining etc. to maximise performance of the VNF. Furthermore accelerators such as FPGAs and GPUs might be used in tandem with standard processors to expedite specific, compute-intensive parts of the processing. The inter-play between the VNF and hardware in the context of virtualisation is of critical importance.
In the following sections the effect of core pinning, NUMA, huge pages and FPGA-based on heterogeneous compute resources are investigated to determine their impact on VNF performance in order to identify the appropriate configurations for the T-NOVA system.
4.1. Core Pinning and Isolation
In OpenStack by default the host scheduler has the flexibility to move threads around within that NUMA cell. The host will schedule across available physical CPU’s (pCPU’s) within the NUMA node. This impacts NFV applications that require threads to be pinned to pCPUs to comply with particular application design constraints, or to deliver on particular latency or predictability metrics. Processor pinning (or core pinning) enables the binding of a process to specific cores within the CPUs in a manner that the process runs only on the specified core(s). I/O threads should be pinned on virtual CPUs (vCPU) and vCPU pinned to pCPUs.
A number of tests have been performed to identify the impact of processor pinning on both vSwitch and VM performance.
With DPDK vSwitch, it is mandatory to dedicate cores to switching operations. The minimum number of cores which can be assigned to DPDK vSwitch is four. However, in order to tune the performance of the vSwitch, the impact of increasing the number of allocated cores was investigated.
In Figure 4-1 and 4-2 throughput versus the number of allocated cores is shown. The experiment scenario was comprised of a DPDK vSwitch connected to a VM with two virtual NICs: the traffic was sent from a packet generator to the virtual switch, then from the virtual switch to the VM that takes the traffic in from vNIC1 and sends it back to the switch through vNIC2, then the switch sends the traffic back to the packet generator to measure throughput.
The Operating System setup require a special configuration for these experiments: the “isolcpus” option in the GRUB configuration file is required to isolate the cores

T-NOVA | Deliverable D4.01 Infrastructure Virtualisation
© T-NOVA Consortium
34
from the OS it-self. This prevents the OS accessing the cores of the platform indicated in the isolcpus option.
Figure 4-1 relates to a scenario where different numbers of cores assigned to the vSwitch. The results indicate that the optimal assignment of cores to vSwitch is exactly four and the allocation of higher number of cores does not provide any measurable performance improvement in most cases. The allocation of additional cores beyond the default configuration can therefore be considered as a waste of resources that could be otherwise allocated to VMs.
Figure 4-1 Throughput varying the core pinning configuration for DPDK vSwitch.
Similar experiments have been conducted by changing the number of cores allocated to a VM, in order to analyse the extent in which a VNF can be influenced by processor pinning. Results are shown in Figure 4-2. Four cores were statically assigned to the vSwitch for this experiment.
0
0.1
0.2
0.3
0.4
0.5
0.6
0.7
0.8
0.9
64 128 256 512 1024 1280 1518
Milli
on P
acke
t per
Sec
ond
Packet Size (Bytes)
4 Cores
5 Cores
6 Cores

T-NOVA | Deliverable D4.01 Infrastructure Virtualisation
© T-NOVA Consortium
35
Figure 4-2 Throughput varying the core pinning configuration for the VM.
The results show that the usage of processor pinning can help to achieve improved performance, if properly configured. In this experimental configuration the VM using just one core for processing incoming network traffic was found to be insufficient to manage the processing overhead required by the VM. Assigning two cores (yellow bars) it is possible to achieve improved performance in comparison to a non-pinned configuration (blue bars). These experiments are based on a single VM deployment onto a server with two processors with 10 cores each with the assigned cores on CPU1. These results are however workload specific and with a different VM configuration the exhibited behaviour could be potentially different. This is a key motivation behind the development of the characterisation framework described in Section 5: using the framework for automated tests it is possible to calculate the best configuration deployment for a specific workload in an automatic fashion, exploiting a workload awareness approach.
Using the framework to analyse the effect of the core pinning on the virtual Traffic Classifier network function developed by NCSRD, a side effect of core pinning was identified. More specifically, two experiments were executed with the purpose of analysing the CPU idle metric of each physical core during a throughput test and this was realised using a telemetry agent measuring the CPU idle time per core on the compute node.
In Figure 4-3 the CPU idle time per core for a non-core pinning scenario is shown. Each trace represents the idle metric of one physical core. There are 28 lines in total (2 CPUs with 14 cores each) shown. It can be clearly seen from Figure 4-3 than in this scenario the CPU cores are not heavily utilised i.e. CPU idle time is high which from a service provider’s perspective is uneconomical in terms of infrastructure resource use.
0
0.1
0.2
0.3
0.4
0.5
0.6
0.7
0.8
0.9
64 128 256 512 1024 1280 1518
Milli
on P
acke
t per
Sec
ond
Packet Size (Bytes)
No Processor Pinning
1 Core
2 Cores
3 Cores
4 Cores

T-NOVA | Deliverable D4.01 Infrastructure Virtualisation
© T-NOVA Consortium
36
Figure 4-3CPU idle per core for the non-core pinning scenario.
In Figure 4-4 the CPU idle time per core for a core pinning scenario is shown. In this scenario the VM process responsible for processing and forwarding packets is pinned to a single core (core 1) represented by the blue line.
Figure 4-4 CPU idle per core for the core pinning scenario.
The high CPU idle time shown in Figure 4-3 is a result of the execution core continuously changing resulting in a higher number of L3 cache calls. However when core pinning i.e. execution is always on the same core, therefore L3 cache calls are generally not required as the data is kept on core in either the L1 or L2 caches, reducing the number of cache misses.
4.2. NUMA Pinning
NUMA is a computer memory access design used in multiprocessing, where the memory access time depends on the memory location relative to the processor. In multiprocessor systems the processors can be grouped together with their own memory and possibly their own I/O channels. Each group of CPUs and memory is called a “NUMA node”. Each CPU can also access memory associated with another NUMA node in a coherent way. However this approach introduces latency: the process is slower and less efficient in comparison to accessing local memory. The

T-NOVA | Deliverable D4.01 Infrastructure Virtualisation
© T-NOVA Consortium
37
allocation of CPUs and hardware resources to a NUMA node is a hardware vendor specific implementation. In order to avoid such latency, the concept of NUMA pinning was introduced. This feature ensures a process (more specifically a VM) runs on cores belonging to the same CPU: This has the effect of maintaining all process related data in the local memory which improves the performance and predictability of the process.
Another very important aspect to consider from this perspective is related to the location of the NICs within the NUMA architecture: each PCI express device attached to the motherboard, including the NICs, exclusively belong to a NUMA node. This means that a VM particularly using the NIC (for example a VNF) will benefit from an allocation of its vCPUs in the same NUMA node added to the NIC.
The test system utilised for the investigating the NUMA configurations had two NUMA nodes, containing one CPU per each. The NIC used for the experiments (Intel X540-T2) was installed on a PCI slot belonging to the first NUMA node. Throughput was measured for two different configurations: in the first instance the VM was pinned to two cores belonging to the first NUMA node (CPU1), whereas in the second instance the VM was pinned to two cores belonging to the second NUMA node (CPU2). The results obtained are shown in Figure 4-5.
Figure 4-5 The effect of core pinning configuration on throughput
The performance obtained in the second scenario was approximately 50% less than in scenario one, indicating that NUMA awareness can have a significant influence on system performance and should be considered appropriately at the Orchestration layer and within the VIM functional entity of the IVM.
Awareness of NUMA topology in the platform was added in the OpenStack Juno release with the Virt driver guest NUMA node placement and topology extension. This feature allows the tenant to specify its desired guest NUMA configuration. The Nova scheduler was extended with the numa_topology_filter to help match guest NUMA topology requests with the available NUMA topologies of the hosts. Tenants
0
0.1
0.2
0.3
0.4
0.5
0.6
0.7
0.8
0.9
64 128 256 512 1024 1280 1518
Milli
on P
acke
t per
Sec
ond
Packet Size (Bytes)
CPU 1
CPU 2

T-NOVA | Deliverable D4.01 Infrastructure Virtualisation
© T-NOVA Consortium
38
can specify their request via the Nova flavour-based mechanism. Tenants also have the option to specify their guest NUMA topology request via an image-property-based mechanism. The parameters provided are:
• hw:numa_cpus.0=0,1,2,3 o It indicates the virtual cores of the VM that have to be pinned on the
NUMA node 0 • hw:numa_cpus.1=4,5,6,7
o It indicates the virtual cores of the VM that have to be pinned on the NUMA node 1
• hw:numa_mem.0=1024 o It indicates the amount of memory (RAM) associated to the NUMA
node 0 • hw:numa_mem.1=1024
o It indicates the amount of memory (RAM) associated to the NUMA node 1
These parameters can be set in OpenStack through Horizon, Command Line Interface (CLI) or Heat Template. Further support for NUMA awareness has been included in the last OpenStack Kilo release, where each VM with an associated SR-IOV NICs is automatically pinned to the NUMA node that includes the physical NIC, if there are free cores available.
4.3. Huge Pages
When executing instructions in an x86 architecture both the CPU and OS mark the RAM as being used by a process. For efficiency, the CPU usually allocates RAM in blocks (default value for Linux) named pages. Since these pages can be swapped to the disk, the memory addresses are virtual and the operating system has to keep track of which page belongs to which process and where they are stored on the disk. As the number of pages increases, more time is taken to find where the memory has been mapped too. Newer CPU architectures and operating systems support bigger pages (so less time spent on look-ups as is the number of pages required). This feature is called Huge Pages.
The purpose of huge pages is to help avoid Translation Lookaside Buffer (TLB) misses and page table walks as the Memory Management Unit (MMU) attempts to resolve application virtual memory addresses to physical address. Huge pages must be supported by the kernel (HUGETLBFS – Linux RAM file systems). Support for huge pages can be determined using the Linux commands:
• cat /proc/cpuinfo | grep pse o Verifies if the system supports 2M pages,
• cat /proc/cpuinfo | grep 1Gb o Verifies if the system supports 1G pages,
• grep huge /proc/meminfo | grep Huge o Analyses the actual configuration and usage of huge pages
Huge page support is processor dependent, for example only Xeon class processor support 1G pages with 1G huge pages being the recommended default. It is also

T-NOVA | Deliverable D4.01 Infrastructure Virtualisation
© T-NOVA Consortium
39
recommended that both guest and host use huge pages. Huge pages should be reserved at boot time and 1G page tables must be reserved at boot time and specified specifically. Huge pages are not swapped out. DPDK uses mmap() and 1G huge pages and must be mounted as a HUGETBLFS, typically mounted by default by the system on /dev/hugepages, for each huge page a file will be created here when applications take a huge page.
Since the usage of DPDK vSwitch requires huge pages, tests were performed on the switch performance by changing the size of the pages from 2Mbytes to 1Gbyte. The results obtained are shown in Figure 4-6. The results obtained indicated that there was no significant advantage in terms of throughput by increasing the huge page size.
Figure 4-6 Packet throughput performance with huge page sizes of 2MB and 1GB
4.4. VNF Compute Resource Optimisation
In order to provide a practical example of how improvements that can be applied to the compute domain in order to optimise VNF performance, a series of experiments were carried out. These experiments investigated the effect of core pinning and huge pages on a vTC VNF. NUMA awareness was not explicitly tested, as it is supported by default in the OpenStack Kilo release.
The experiments described in this section have been executed using the Workload Characterisation Framework outlined in Section 5.
The default configuration for the vTC in these experiments was based on a single VM (which includes both the inspection engine and the forwarding engine VNFCs) with two SR-IOV NICs used respectively to receive and forward traffic. The baseline performance throughput was 3.7Gbps, as shown in Figure 3-20.
Two test cases were executed: in the first test case throughput was calculated following the RFC 2544 methodology; in the second experimental scenario the
0
0.1
0.2
0.3
0.4
0.5
0.6
0.7
0.8
0.9
64 128 256 512 1024 1280 1518
Milli
on P
acke
t per
Sec
ond
Packet Size (Bytes)
2MB
1GB

T-NOVA | Deliverable D4.01 Infrastructure Virtualisation
© T-NOVA Consortium
40
throughput was re-measured in the presence of noisy neighbours who added additional overhead to the CPU of node hosting the VNF. The results obtained are shown in Figure 4-7.
Figure 4-7 Packet throughput performance of the vTC with different configurations.
In the first test case, the results show that huge pages have no measurable impact on the performance, whereas core pinning improved performance, especially if used in conjunction with the “isolcpus” Grub option, by up to 24%. The isolcpus option provides CPU isolation from the general kernel SMP balancing and scheduler algorithms. This has the effect of isolating the cores from user-space tasks.
In the second test case (with noisy neighbours) the base line performance with the default configuration is 2.7Gbps, which is lower than the first test case scenario. The reason for the reduction in throughput is the additional computation overhead placed on the CPU servicing requests from the additional VM’s. In this test case the impact of the huge pages on performance is clearly visible (up to 14% improvement in throughput) and with the core pinning it is possible to further improve the performance up to an additional 23% increase in throughput.
4.5. Heterogeneous Compute Resources
Heterogeneous compute resources encompass a variety of accelerators that offer higher performance than general-purpose processors for specific applications. The reasons for this performance boost can be traced to a combination of specialised processing resources and the use of massive parallelism inherent in many workloads. This by necessity includes a broad range of devices including GPUs, DSPs and FPGAs, which feature very different architectures and programming paradigms. This makes having one unified approach to virtualise them impossible. This necessitated limiting investigations to one class of devices. The choice was made to pursue FPGAs since
0
0.5
1
1.5
2
2.5
3
3.5
4
4.5
5
WithoutNeighbours WithNoisyNeighbours
Supp
ortedTh
roug
hput(G
bps)
Default
HugePages
Hugepages+CorePinning
Hugepages+CorePinning+isolcpus

T-NOVA | Deliverable D4.01 Infrastructure Virtualisation
© T-NOVA Consortium
41
they offer the prospect of significant performance benefits with a large variety of applications.
FPGAs are conspicuously absent from any cloud infrastructure. One of the main reasons for this is the complete absence of any integration with existing cloud environments. There’s currently no way to include an FPGA as an addressable resource within a cloud infrastructure and to deploy and retire tasks to and from the cloud much like with a normal processor. The goal of this work was to integrate an FPGA within a standard OpenStack-based cloud infrastructure as shown in Figure 4-7.
Deploying a VNFC on an FPGA is a vastly different process than its CPU equivalent. Since FPGA virtualisation is none existent there’s a lot of foundational work that that is required at an infrastructure management level in order to realise an operational solution. In this activity the focus was on enabling cloud deployment for single-tenant FPGAs. This means that each FPGA device can only be used for the deployment of a single VNFC, independently of how many resources this VNFC will use. While there are approaches to both time- [18] and space [19] sharing of an FPGA, they are both complicated and inefficient to implement and operate due to the way FPGAs are programmed.
Figure 4-7 – Block diagram of the FPGA SoC system
The selected platform was a Xilinx Zynq FPGA SoC device, which combines two ARM A9 cores with programmable fabric. This combination of a general purpose CPU and programmable fabric delivers the best of both worlds, namely the acceleration that the programmable logic can offer coupled with the flexibility that the A9 offers which supports an embedded Linux OS on which an OpenStack agent is executed. While this approach allows the maximum reuse of OpenStack components, the different nature of programmable devices requires that these components are modified accordingly. Changes are mandated on both the side of the cloud controller and the worker. The following changes were made:
• A modified nova scheduler service communicates with the database to identify an appropriate FPGA host. It then launches an rpc.cast request to nova-compute to launch an instance on the appropriate host.

T-NOVA | Deliverable D4.01 Infrastructure Virtualisation
© T-NOVA Consortium
42
• The Nova Conductor service was modified to interact with Glance and to fetch VNF information such as host ID and flavour.
• The Nova Compute service was adapted to compensate for the absence of a hypervisor (libvirt, XenAPI, etc). The high number of calls to the hypervisor API (which has no equivalent on a programmable device) has to be intercepted and re-routed. To deal with this requirement a simple libvirt function which responds to the agent’s queries in terms of resources availability and deployment status was developed.
• The Glance service was modified to store the bitstream used to configure the FPGA.
The configuration data is then passed on to the reconfiguration driver (DevC) which is provided by the FPGA vendor. This driver interfaces with a specialist silicon function that allows the programmable logic to be dynamically reprogrammed during its operation. This component is called a Processor Configuration Access Port (PCAP).
In order for dynamic configuration to function correctly the programmable logic was partitioned in two areas, the static and the dynamic one. The static one contains all of the modules that are required to perform the reconfiguration and to facilitate the communication between the A9 and the programmable logic. This includes the PCAP, as well as an AXI DMA engine to ship data received from the network (which is connected to the A9) to the programmable logic and back. This is programmed onto the device upon initialisation (at the same time the A9s boot up) and is not altered during operation. In contrast the dynamic region is where the FPGA-based VNFC will be deployed.
Currently the hardware and software components of the system are being tested, which will be followed by an integration phase, after which the deployment of a simple dummy VNFC will be demonstrated. This dummy VNFC will be subsequently replaced by a functional block and the system will be integrated into the T-NOVA environment, with the ultimate goal being to deploy a VNF, which consists of at least one FPGA-based VNFC.
4.6. Recommendations
In this section a list of recommendations realised from the work carried out in setting up the testbed and the output from the experiments described in Sections 3 and 4 are outlined.
4.6.1. BIOS Optimisation
For initial BIOS testing the recommendation is to disable some features of the platform. After an initial baseline is established these features can be enabled one at a time and tuned for desired performance level. Using the vTC the settings outlined in Table 4.1 were identified as providing the most stable environment for the execution of the VNF. Note some BIOS will not allow access to all the options described in Table 4-1.

T-NOVA | Deliverable D4.01 Infrastructure Virtualisation
© T-NOVA Consortium
43
Table 4.1 BIOS options.
BIOS Option Description Value
Hyper Threading HT Allows 2 hardware threads (Logical Cores) per physical core (pCPU)
OFF
C-States CPU sleep states OFF
P-States Frequency scaling OFF
Memory Power Management
Management of the power consumption for the memory
OFF
Memory Frequency Frequency of the memory MAX per installed DDR
Intel® Turbo Boost Technology
OFF
VT-d, VT-x, VT-c Virtualisation Features ON
In addition to BIOS optimisation Grub options can also be used to tune compute node behaviour. Grub is the boot loader process which is used to load the OS. Various customisation options are available which can be used to specific the behaviour of the kernel. The key options utilised are shown in Table 4.2
Table 4.2 Grub Options.
Grub Option Description Value
Intel_iommu Input/Output Memory Management Unit
“on”
isolcpus Isolation of the cores Id of the cores to be isolated (e.g. 1,2,3,4)
default_hugepagesz Size of the huge pages (default values)
“1G” or “2M”
hugepagesz Size of the huge pages “1G” or “2M”
Hugepages Number of huge pages available
Value higher than 1
4.7. Configuration Recommendations
Based on the various investigations carried out in this task a set of configuration and deployment settings to satisfy the T-NOVA requirements and to improve the performance of the NFVI have been identified. The key recommendations are as follows:

T-NOVA | Deliverable D4.01 Infrastructure Virtualisation
© T-NOVA Consortium
44
§ Virtualisation Technology:
§ Docker container deployment provided better VNF throughput performance in comparison to a standard VM/VNF deployment. However, in order to support the T-NOVA requirements, the bare metal configuration is not flexible enough, whereas Docker comes with various issues that have been outlined in Deliverable 2.32.
§ The recommended solution is the virtualisation technology based on KVM, since it is possible to address the virtualisation performance overhead using data plane acceleration technologies.
§ Network packet processing technology:
§ Default virtual switches do not provide the required Telco level of performance (10Gbps throughput).
§ The usage of SR-IOV channels is recommended if the level of required flexibility is not too high. (SR-IOV cannot be used if live migration is required)
§ The accelerated version of Open vSwitch could afford the T-NOVA performance requirements, (see DPDK vSwitch).
§ DPDK as data plane packet acceleration technology within the guest VM is strongly recommended (in the case of the virtual Traffic Classifier it allows it reach up to 8Gbps throughput).
§ Core Pinning and Isolation
§ DPDK vSwitch can be pinned on physical cores. The best allocation for DPDK is four cores. This is the minimal requirement to work, however additional cores will not provide any improvement.
§ The same rationale can be extent to the VMs, but the number of cores is specific for each workload, therefore workload characterisation is recommended prior to deployment.
§ Using core pinning for VMs improves the performance of the VMs reducing the interplay effect between VMs deployed on the same compute node and the L1 and L2 cache misses, resulting in improved performance.
§ NUMA Pinning
§ The NIC has to be installed on NUMA node 0. § Network workloads have to be deployed as much as possible on the same
NUMA node connected to PCIe channel of the NIC.
§ Huge pages
The huge page support is desirable, as it reduces the interplay effects between VMs deployed on the same compute node. (The impact of this can vary among different workload types).

T-NOVA | Deliverable D4.01 Infrastructure Virtualisation
© T-NOVA Consortium
45
5. STORAGE PERFORMANCE CHARACTERISATION
The deployment and execution of VNFs in the T-NOVA system requires the allocation of appropriate storage resources in the NFVI. Storage is involved in the lifecycle of a VNF at two levels:
1. Infrastructural level (black-box VM) - In an NFV environment, as well as in any virtualised, cloud-based platform, storage resources are required to support the deployment of computational resources. Storage devices are required to provide repositories for VNF images, from which they can be retrieved and deployed as VMs each time a new VNF is instantiated or scaled out. When VNFs are in execution mode, they require storage devices, not only to perform their specific functions, but also to guarantee their availability. Storage can at any time hold an updated snapshot of the VNF’s running VNFC’s thus ensuring that in the event of issues the host VM can be moved to a different node without (or with minimal) service interruption.
2. Application level (white-box VM) - To enable the execution of a VNF, storage resources may be required. The required allocation of resources will be dependent on the specific functionality of the VNF. Although many network functions are not characterised by being storage-bound, there are cases where this condition applies (e.g., functions processing high throughput streams, content distribution network (CDN) related functions, etc.). Hence, the functional performance of the VNF (what happens inside the host VM) can strongly depend on the characteristics of the available storage resources.
There are a number of different storage technology options that can be utilised in the provisioning of resources within an NFV framework. Selected options can potentially have an impact in terms of performance, availability, or other key performance indicators (KPIs) associated to the whole NFVI layer. Therefore it is important to include storage characterisation as part of the overall NFVI technology characterisation presented in this deliverable in order to ensure, that the right options are selected in the NFVI design and implementation.
5.1. Methodology
The storage characterisation process was carried out based on the following key steps:
1. Identification of the key technology options to be evaluated;
2. Appraisal of the potential impact of any option on NFVI performance and behaviour;
3. Identification of the most significant configurations, combining the various options applicable to operational deployments.
Following step one, the storage technology options listed in Table 5.1 were identified.

T-NOVA | Deliverable D4.01 Infrastructure Virtualisation
© T-NOVA Consortium
46
Table 5.1 Storage technology option list
Feature/parameter Possible options
VNF lifecycle phase
• First instantiation • On-line instantiation (scaling) • Execution (storage used by VNF application) • Migration
Media technology • HDD • Solid state
Storage model • Block (OpenStack Cinder) • Object (OpenStack Swift) • Both (with Ceph)
Storage location • Storage on Nova Compute Node: Local vs SAN • Storage on Cinder Node: Local vs SAN • Storage on Ceph node
VM volume type • Bootable volume • Additional (non-bootable) volumes
Transversal features • Latency critical • Dependent upon the specific application in the
VNF
An additional step in the characterisation setup is the selection of a candidate VNF workload. To satisfy this requirement a storage intensive VNF was necessary in order to appropriately stress the storage resources and to provide indicative metrics related to the impact of storage operations.
After some investigation, balancing the trade-off between VNF features with timing needs for the execution of the characterisation experimental protocol, a Squid proxy VNF was selected. The VNF executes a tuneable and potentially intensive number of caching operations, supporting the collection of measurements relating to storage performance impacts.
5.2. Test Cases
The first step in the execution of the test cases was to exclude options which were deemed not to be sufficiently relevant. Then the key considerations were identified which are as follows:
• Initial instantiation and runtime instantiation of a VNF (the latter triggered by scaling out) are functionally identical; they were considered separately, since scaling could potentially have considerably tighter performance constraints to prevent possible service interruptions, whereas for initial instantiation no special requirement is expected on the speed of deployment;
• Latency problems are particularly relevant during the VNF execution phase;
• Local disks have cost advantages with respect to Storage-Area Network (SAN) storage, at the expense of reliability/availability, as well as performance in the

T-NOVA | Deliverable D4.01 Infrastructure Virtualisation
© T-NOVA Consortium
47
case of live migration (they force the migration all data in conjunction to moving the VMs to a different computing node);
• Solid State Disks (SSD) can provide significant performance advantages with respect to High Density Disks (HDD) whenever there is a real constraint on read/write performance;
• Object storage is of limited scope within T-NOVA; the key focus is on options related to block storage, and include volume persistence as a varying parameter.
Utilising these considerations the choice for the most representative process influenced by storage technologies and configuration was identified as Live Migration. Live Migration can be divided in three types, each one involving the storage subsystem:
• Host only o Refers to the movement of the host on which the VM is running on;
while all files representing the VMs disks (the virtual disks) remain on the same storage location as before.
o Using block storage technology (e.g. Cinder), or more generally in the case of shared disks between the source and target host, storage is only involved for writing VM metadata. Instead, with ephemeral volumes on local disks a ‘host only’ migration moves the whole VM, so in this case falls into a type B migration.
• Storage only o Usually indicated as “Storage Live Migration”.
o Refers to the movement of all VM files (virtual disks and metadata) from a storage volume to another (can be on same or different storage arrays), while the VM continues to run on the same host. As stated above, in OpenStack Live Migration of VMs residing on ephemeral disks corresponds to a Storage Live Migration.
o In this migration type, storage bound VNFs could exhibit impact on their service delivery capability.
• Host and Storage together
o There is no formal definition, sometimes defined as “Storage Live Migration” or sometimes as “Host and Storage Live Migration”.
In addition a test matrix was composed with three macro test cases, which provided a representative characterisation of potential configurations of interest within the context of T-NOVA:
1. Local disks ephemeral only, i.e. without persistent storage;
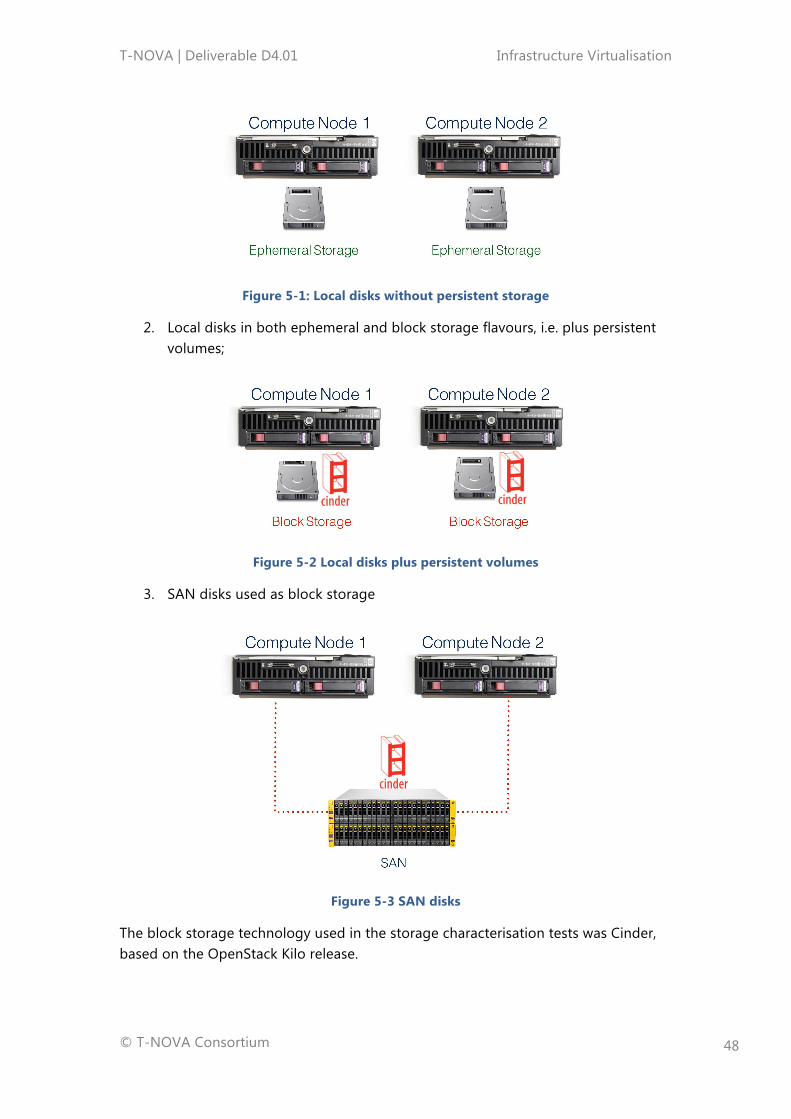
T-NOVA | Deliverable D4.01 Infrastructure Virtualisation
© T-NOVA Consortium
48
Figure 5-1: Local disks without persistent storage
2. Local disks in both ephemeral and block storage flavours, i.e. plus persistent volumes;
Figure 5-2 Local disks plus persistent volumes
3. SAN disks used as block storage
Figure 5-3 SAN disks
The block storage technology used in the storage characterisation tests was Cinder, based on the OpenStack Kilo release.

T-NOVA | Deliverable D4.01 Infrastructure Virtualisation
© T-NOVA Consortium
49
5.3. Testbed Configuration
Figure 5-4 below shows the configuration of the components utilised in the testbed.
Figure 5-4 Testbed configuration
• The compute nodes used were HP Proliant BL465 Gen8 with 2 x 300 GB 15K RPM internal disks.
• The controller network nodes were virtual machines on an external vSphere farm.
• The storage array was a HP 3PAR • The compute nodes were connected to the 3PAR storage array via Fibre
Channel, through SAN switches • The OS for all nodes was Ubuntu Server 14.04.2. • OpenStack Kilo release - community standard flavour.
5.4. Test Execution
As outlined previously the tests focused on the Live Migration process of a VNF. The VNF used for these tests was a Squid based proxy VM, with caching enabled.
Tests were executed with three different cache sizes:
I. 1 GB II. 5 GB III. 15 GB
15GB was set as the maximum useful cache size. With 1GB and 5GB (with ephemeral volumes) the http download duration was lower than the Live Migration duration. With a 15GB cache size the inverse was true which indicated VNF proxy activity

T-NOVA | Deliverable D4.01 Infrastructure Virtualisation
© T-NOVA Consortium
50
during the complete Live Migration process. For block storage based volumes, the Live Migration duration is so quick that even a download of just 1GB from cache took longer.
For each cache size, Live Migration of the Squid VNF was executed with the following three cache activity types:
1. Squid VNF solely reading cache 2. Squid VNF solely writing cache 3. Cache was idle
Finally the combination of the above 3 x 3 cases (cache size and activity type) were repeated based on two of the three scenarios described in the previous paragraph, i.e.:
A. Ephemeral volumes located on local disks B. Cinder block storage volumes located on local disks C. Cinder block storage volumes located on a shared disk provided by a storage
array in SAN
For each one of the 27 resulting tests, several iterations were performed in order to establish statistically significant results. For the same reason, the metrics data collection was performed with different tools, namely:
o Iotop - oriented to per-process monitoring. o Iostat - oriented to per-disk monitoring. o dstat – Dstat is a utility for monitoring systems during performance tuning
tests, benchmarks or troubleshooting. Replacement for vmstat, iostat, netstat, nfsstat and ifstat.
Metrics collected were:
§ Live Migration duration § Disks I/O throughput during the Live Migration process
5.5. Results and Conclusions
The results obtained for the executed experimental protocol are outlined in the following figures 5-5 to 5-9.

T-NOVA | Deliverable D4.01 Infrastructure Virtualisation
© T-NOVA Consortium
51
Figure 5-5: Live Migration duration while cache reading
Figure 5-6: Live Migration duration while cache writing
34
83
120
9 9 9.59 10 10
0
20
40
60
80
100
120
140
1GB 5GB 15GB
s
CacheSize
EphemeralStorage BlockStorage SAN
34
83
120
9 9 9.59 9 10
0
20
40
60
80
100
120
140
1GB 5GB 15GB
s
CacheSize
EphemeralStorage BlockStorage SAN

T-NOVA | Deliverable D4.01 Infrastructure Virtualisation
© T-NOVA Consortium
52
Figure 5-7: Live Migration duration while the cache is idle
Figure 5-8: Disk I/O: Live Migration with ephemeral volumes while cache reading
19
7180
8 8 87 8 9
0
20
40
60
80
100
120
140
1GB 5GB 15GB
s
CacheSize
EphemeralStorage BlockStorage SAN

T-NOVA | Deliverable D4.01 Infrastructure Virtualisation
© T-NOVA Consortium
53
Figure 5-9: Disk I/O: Live Migration with block storage volumes while cache reading
Figure 5-10: Disk I/O: Live Migration with block storage on SAN while cache reading
Examining Figures 5-5 to 5-7 it is clear that the Live Migration duration with ephemeral volumes increases with the cache size, with approximately the same duration (in seconds) for cache reading and writing respectively and, as expected, has lower values when the cache in idle mode. This does not occur when volumes are located on a block storage solution such as Cinder. In this case the Live Migration duration:
• Is much lower than with ephemeral volumes; • Cache size has no influence
As a general consideration, the SAN case provides results similar to the Cinder/local storage configuration as the latter has proved significantly different from the ephemeral storage case.

T-NOVA | Deliverable D4.01 Infrastructure Virtualisation
© T-NOVA Consortium
54
As outlined previously Live Migration elapsed time exhibits sensitivity to variations of cache size. In the case of ephemeral storage the duration increases with cache size, whereas it appears to remain constant in the case of Cinder block storage. This is explained by the different order of magnitude for the migration execution. In the case of block storage, this is faster than the cache downloading time, even at the lowest tested cache size. In the ephemeral storage case, migration is not as fast, and cache downloading has a growing impact with increasing size.
As previously outlined, cache sizes above 15GB did not have added significance in the context of the test cases, as at this threshold level the cache download time systematically exceeds the migration duration with any storage class.
The results obtained indicate the performance improvement obtained with local disks on the hosts (configuration is less expensive than disks on a SAN based storage array). In fact, with ephemeral volumes on local disks Live Migration becomes bounded to a Storage Live Migration constraint. The same conclusions can be derived in the case of block storage on SAN, where migration time has comparable durations with that of Cinder block storage on local disks.
With respect to I/O throughput during the migration, it can be observed in Figures 5-8 to 5-10 a steep decline in throughput corresponding to storage migration. However, this step is far narrower in cases of block storage (both local or on a SAN) with respect to ephemeral volumes, as expected. There is an increase from a few seconds to the tens of seconds, which could have an impact on quality of service. With SAN storage the impact of live migration is comparable with the local block storage case and it is even less perceivable.
Analysis of the results indicate that using block storage technology (either on local disks of compute nodes or on a SAN based storage array) is the preferred option in comparison to ephemeral volumes, exhibiting both insensitivity to cache size variations and a significant reduction in the window where I/O throughput falls short.
Of course there are scenarios where the selection of a storage array (SAN) based block storage solution could be preferential to local disks, but this decision must be taken after a considered trade-off analysis, taking into account the costs of storage array solutions and consequently evaluating the return on investment (ROI) for both approaches. A SAN option should carefully balance the required service levels and the potential frequency of migration events. In other words, the marginal cost of a SAN infrastructure should be motivated by an actual compelling need in terms of performance (tight application requirements for the VNF) and/or availability requirements (need to minimise service quality issues).
5.5.1. Further Investigations
There is potential for additional investigations can be performed in the future to extend the current results. Additional areas of interest include:
• SSD storage technology evaluation
• Use of Ceph as a block storage option alternative to Cinder;
• Investigation of VNFs with high affinity for storage performance.

T-NOVA | Deliverable D4.01 Infrastructure Virtualisation
© T-NOVA Consortium
55
6. VNF WORKLOAD CHARACTERISATION FRAMEWORK
Industry initiatives such as OPNFV or standard bodies such as ETSI or IETF have initiated various projects to address different aspects of workload characterisation. This includes the definition of methodologies, modifications to existing methodologies, development of tools to support characterisation of VNF workloads or verification of infrastructure that supports VNFs.
Typically workload characterisation is a manual process, however in order to address VNF workload characterisation at scale i.e. investigation of multiple configuration combinations requires a repeatable, automated and robust methodology. This methodology can be used to identify bottlenecks and platform feature affinities for different classes of VNF: this is very important capability for T-NOVA, especially when external developers are providing their own implementation of VNFs. In this task a prototype framework was developed to address this need. The following sections describe the key features and implementation details of the framework.
6.1. Framework Overview
Evaluation of VNF configurations is typically limited in the number of test cases that can be completed due to the characteristically manual nature of the process. However, in order to develop a granular understanding of how a VNF behaves with respect to its host infrastructure environment, it is necessary to investigate various configurations and to repeat this process for multiple iterations to obtain statistically meaningful data. The total number of configurations to be tested can be very high and depends on the number of different parameters to be analysed and the number of values to be explored for each parameter.
The framework is designed to automatically test various configurations of the VNF, in an iterative manner on different target platforms to evaluate the affinity a VNF has for either allocations of compute resources (e.g. OpenStack flavour) or the effect of specific platform features on VNF performance. Parameters which can be investigated are those specified in the Heat template describing the deployment of VNF and its component VNFCs. Parameters of specific interest are defined in a configuration file which is used by the framework and includes the value types to be investigated (examples of parameters are: vNICs technology, Scheduler Hints, vCPUs, etc.; whereas examples of configuration values include Scheduler Hints e.g. “SameHostFilter” or “DifferentHostFilter”, for vCPUs an integer value range, etc.).
The framework provides orchestration of the full test case lifecycle. A typical test case will comprise of template deployment, followed by VNF load application (e.g. traffic generation sent to the deployed VNF), collection of real time data on performance (e.g. network throughput), and VNF deletion. This process is repeated until all templates have been deployed.
The framework is designed to support a user specified telemetry solution due to the wide range of open source telemetry solutions (e.g. Collectd, Nagios, Ganglia etc.) and the typical requirement for users to implement their own data formats and

T-NOVA | Deliverable D4.01 Infrastructure Virtualisation
© T-NOVA Consortium
56
metrics. For the purposes of the evaluating the framework and executing the test case scenarios described in section 7-3 the Cimmaron [20] telemetry platform was used to capture real-time performance metrics.
6.2. Framework Architecture and Implementation
The high-level architecture of the framework comprises three key functional blocks as shown in Figure 5-1. The key blocks of functionality in the framework are:
• Template Generation- this block is responsible for generating a set of heat templates representing the configurations to be tested according to the configuration file containing the configuration parameters and value ranges.
• Test Case Execution – this block is responsible for deploying each template sequentially through the OpenStack Heat service, executing the required test cases using the deployed VNF and deleting it after the experiment.
• Data Analysis – this block is responsible for formatting and processing all the data files generated at the end of experiments. The default format for the processed data is a CSV (Comma Separated Variable) file. This block can also call an analytics platform passing the processed data files and collecting results.
Figure 6-1 High level architecture of framework
All components of the framework were implemented in Python. A more detailed description of the software modules is provided in the following sections.

T-NOVA | Deliverable D4.01 Infrastructure Virtualisation
© T-NOVA Consortium
57
6.3. Template Generation Block
The Template generation block of the framework is responsible for the generation of all Heat templates necessary to test the capabilities of interest to the user. This block is composed by a single software module that takes as its input a “generic” Heat Template written in yaml, hereinafter called the “Base Heat Template”.
The base Heat template and the framework’s configuration file are parsed and platform information from both sources is combined and used by an algorithm to generate a hierarchical tree structure. The algorithm starts by constructing a root node, the first level leaves are then added and this process is repeated for all parameters. The number of leaves is dependent on the number of possible values for each parameter.
More specifically, the base Heat template is a template that describes the specific workload (VMs and their components, like vNICs, Flavours, etc.) and includes placeholders for the configuration parameters that will be populated from the configuration file. It is therefore necessary for the user to set the placeholders in the base Heat template and to contextually set the values that these parameters have to assume in the configuration files. The user can also specify a cost associated to each single configuration value: the cost has to be a numeric value and has to be expressed according to a specific syntax: in the base Heat template it is necessary to use the ‘#’ special character to indicate that a string corresponding to the name of a parameter; in the configuration file the syntax is expressed as follow:
PARAM_NAME = @type “val1” “val2” … “valN” @costs ‘cost1’ ‘cost2’ … ‘costN’
In Figure 5-2 an example of the syntax is provided.
Figure 5-2 User defined syntax for the heat template generation block
6.4. Test Case Execution Block
The Test Case (TC) Execution block is responsible for the actual execution of the test cases for each configuration previously generated by the template generation block.

T-NOVA | Deliverable D4.01 Infrastructure Virtualisation
© T-NOVA Consortium
58
This block comprises a number of software modules, namely:
• Benchmarking Unit • Deployment Unit • Data Manager
The Benchmarking Unit is the primary module of the block: it is responsible for managing the test case execution lifecycle which comprises of: the iterative deployment of the workloads, the execution of the test cases required by the user, the collection of data from each experiment and the termination of the workloads. This module utilises the Deployment Unit to deploy and terminate workloads and uses the Data Manager to store metadata for each experiment and to collect results. Each test case is defined as a class that extends a base test case abstract class and implements three required methods: initialise (initialise setup of resources for test case execution), finalise (termination and removal of test case deployment) and run (test case execution e.g. sends traffic to the VNF).
Some test cases are natively provided with the framework: their description is provided in Section 8. The test cases can access a library that provides control of the packet generator and allows the test cases to generate traffic and to send it to the VNF. The framework supports the DPDK packet generator through a combination of Python and Lua scripts (Lua is the only interface supported by the packet generation for external programmatic control), however the user can implement their own wrapper for any packet generator that offers an appropriate API.
The user can specify a list of test cases to run with each configuration, including both the native test cases provided with the framework and the user implemented ones; then, the Benchmarking Unit performs the following actions for all configurations previously generated:
1. Each workload is deployed through the OpenStack Heat service, which creates the VMs, installs the VNF software and a telemetry agent to measure internal metrics at a 1 Hz sampling interval. Details of the telemetry agent and supporting backend have been previously reported [8].
2. Execution of each test case from the list of the ones indicated by the user.
3. Collection of the results from each test case.
4. Termination of the workload.
The Deployment Unit is a module that manages the deployment of the VNF workloads on the benchmarking testbed. The credentials to access the testbed are specified by the user into the configuration file, along with the URL of the OpenStack controller and the access URL of the Heat service. This module keeps track of the workloads deployed during the execution of the test cases, manages any errors that may occur during the deployment and resets the system (terminates the workloads) at the end of each test sequence. The actual implementation of the calls to the Heat service are managed by a decoupled software component, the Heat Manager, in order to make the Deployment Unit more generic and extensible to support other platforms in the future.

T-NOVA | Deliverable D4.01 Infrastructure Virtualisation
© T-NOVA Consortium
59
The Data Manager module manages the data related to experiments. For each experiment an object is instantiated and three different types of data are identified and organised in three different dictionaries:
• Configuration: includes the specific key-value pairs describing the configuration parameters that characterise the experimental set-up.
• Results: the results are organised as a dictionary of benchmarks and, for each benchmark, there is a list of data points that represent the specific result. Each data point is again a dictionary that includes key-value items defined within the specific test case. This feature allows each test case to have its own set of metrics as results and also allows the user to easily define their own set.
• Metadata: all other relevant data that needs to be saved for an experiment (start time, stop time, etc.).
6.5. Data Analysis Block
The Data Analysis functional block is responsible for processing and analysing the data collected during each experiment and supporting the automated and performant deployment of workloads. In order to support this, the block functions in three phases:
• Data formatting: realised through the Data Manager (described in the previous section), which generates CSV files. More specifically, the Data Manager generates a single CSV file for each test case executed with a workload. Each row of the file represents a data point and contains data related to the specific configuration deployed (see Table 5-1) for that data point and the correspondent results obtained during execution of a test case.
• Data Analysis: an analytics platform is invoked in order to process the data and generate a model. The analytics platform takes a CSV file input and outputs a model that describes the required configuration to reach a specific performance target (i.e. a specific network performance). The framework supports models in the form of a decision tree.
• Performant deployment: This involves the processing of the model and the selection of the configuration parameters according to the network performance intent specified by the user. This phase is supported by a software module that collects the decision trees specific for each VNF and uses the rules to select the best configuration to achieve the required network intent. If the costs for each configuration values are specified in the configuration file, this module selects the configuration correspondent to the lower cost (see section 6.3.2 for more details).

T-NOVA | Deliverable D4.01 Infrastructure Virtualisation
© T-NOVA Consortium
60
Table 6.1 Configuration Metadata CSV file
Vnic_type RAM CPU … Performance
normal 1024 1 … 400M
direct 1024 1 … 2G
Normal 2048 1 … 500M
Direct 2048 1 … 3G
normal 1024 2 … 500M
direct 1024 2 … 3G
… … … … …
The CSV format was selected to store the results of the experiments due to its simplicity and its widespread support across most analytics platforms. In order to support different analytics platforms, the user needs to implement a software module that provides an appropriate wrapper for a given analytics platform or set of analysis algorithms. The output of the algorithm has to be formatted as a decision tree and given to the Performant Deployment module, along with a VNF ID, in order to enable support for the performant deployment of that VNF.
In the current implementation of the workload characterisation framework the data analysis block was configured to support the open source Weka machine learning platform. The data files collected for each test case were processed and formatted into a single data file which can be provided to Weka for modelling purposes. Weka is a data mining software application developed in Java [21]. It comprises of machine learning algorithms for data mining tasks. The algorithms can either be applied directly to a dataset or called directly from your own application when required. Weka contains various tools for data pre-processing, classification, regression, clustering, association rules, and visualisation. Its primary focus is enabling the development of new machine learning schemes.
Finally, it is important to note that performant deployment can be decoupled from the framework: this allows the user to use the framework only as a collector of data (in CSV format) from experiments and therefore the data can be used as necessary for other purposes.

T-NOVA | Deliverable D4.01 Infrastructure Virtualisation
© T-NOVA Consortium
61
7. NFV WORKLOAD CHARACTERISATION
Workload characterisation is the science of a methodical approach which is used to observe, identify and explain the phenomena of work in a manner that allows you to develop a clear and insightful understanding of how resources are being used by a given workload [22]. The primary objective of workload characterisation is to derive metrics and models to show, capture, and reproduce the behaviour of the workload and its most important features [23].
For any VNF type workload it is important to have a detailed understanding of its performance characteristics. It is necessary to build a picture of the VNF’s affinities for compute resource allocations and platform specific features in order to understand how it will behave when deployed. In order to appropriately interrogate these affinities requires the deployment of various compute resource allocations and to quantify the performance of a VNF using telemetry in a statistically meaningful manner. Even for relatively simple VNFs with constrained boundary conditions in terms of resource allocation ranges, workload characterisation will require tens or hundreds of distinct configurations. This can quickly grow into thousands of deployments to ensure data robustness. This constraint catalysed the development of the framework described in the previous section. In this section the application of the framework to characterise a virtualised traffic classifier which was developed by NCSRD in WP5 is described. The relationship between different flavour allocations and VNF performance was investigated. The effect of different network connectivity technologies was also investigated. Finally using the data from the experiments performed, a decision tree model was developed. The model is used to specify the type and quantity of resources to be allocated when deploying the virtualised traffic classifier in order to achieve a targeted network throughput performance.
7.1. Virtualised Traffic Classifier
The virtualised traffic classifier VNF used comprises of two Virtual Network Function Components (VNFCs), namely the Traffic Inspection engine and the Classification and Forwarding function as shown in Figure 7-1. The two VNFCs are implemented in respective VMs. The Traffic Classifier is based upon a Deep Packet Inspection (DPI) approach, which is used to analyse a small number of initial packets from a flow in order to identify the flow type. After the flow identification step, no further packets are inspected. The Traffic Classifier follows the Packet Based per Flow State (PBFS) in order to track the respective flows. This method uses a table to track each session based on the 5-tuples (source address, destination address, source port, destination port, and the transport protocol) that is created for each flow.
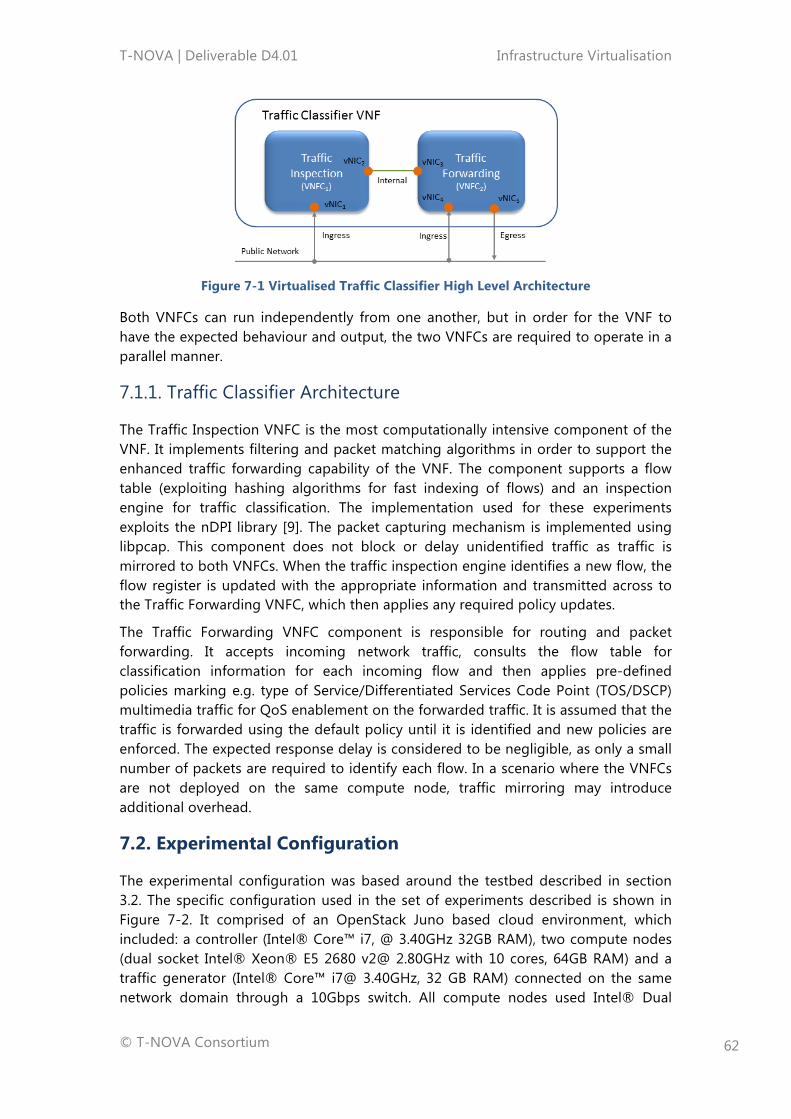
T-NOVA | Deliverable D4.01 Infrastructure Virtualisation
© T-NOVA Consortium
62
Figure 7-1 Virtualised Traffic Classifier High Level Architecture
Both VNFCs can run independently from one another, but in order for the VNF to have the expected behaviour and output, the two VNFCs are required to operate in a parallel manner.
7.1.1. Traffic Classifier Architecture
The Traffic Inspection VNFC is the most computationally intensive component of the VNF. It implements filtering and packet matching algorithms in order to support the enhanced traffic forwarding capability of the VNF. The component supports a flow table (exploiting hashing algorithms for fast indexing of flows) and an inspection engine for traffic classification. The implementation used for these experiments exploits the nDPI library [9]. The packet capturing mechanism is implemented using libpcap. This component does not block or delay unidentified traffic as traffic is mirrored to both VNFCs. When the traffic inspection engine identifies a new flow, the flow register is updated with the appropriate information and transmitted across to the Traffic Forwarding VNFC, which then applies any required policy updates.
The Traffic Forwarding VNFC component is responsible for routing and packet forwarding. It accepts incoming network traffic, consults the flow table for classification information for each incoming flow and then applies pre-defined policies marking e.g. type of Service/Differentiated Services Code Point (TOS/DSCP) multimedia traffic for QoS enablement on the forwarded traffic. It is assumed that the traffic is forwarded using the default policy until it is identified and new policies are enforced. The expected response delay is considered to be negligible, as only a small number of packets are required to identify each flow. In a scenario where the VNFCs are not deployed on the same compute node, traffic mirroring may introduce additional overhead.
7.2. Experimental Configuration
The experimental configuration was based around the testbed described in section 3.2. The specific configuration used in the set of experiments described is shown in Figure 7-2. It comprised of an OpenStack Juno based cloud environment, which included: a controller (Intel® Core™ i7, @ 3.40GHz 32GB RAM), two compute nodes (dual socket Intel® Xeon® E5 2680 v2@ 2.80GHz with 10 cores, 64GB RAM) and a traffic generator (Intel® Core™ i7@ 3.40GHz, 32 GB RAM) connected on the same network domain through a 10Gbps switch. All compute nodes used Intel® Dual

T-NOVA | Deliverable D4.01 Infrastructure Virtualisation
© T-NOVA Consortium
63
Ethernet Converged Network Adapters (X540-T2). The compute node configuration enabled the hosted VMs to use both vNICs connected to OVS (Open vSwitch) in the form of a software-assisted solution and physical NICs with PCIe pass-through, exploiting SR-IOV in the form of a hardware-assisted solution. A packet generator was used to stress test the performance of the VNF under test. The deployment of the vTC, test case execution, data collection and processing in the testbed was controlled by the VNF workload characterisation framework (see section 6).
Figure 7-2 High level architecture of experimental testbed.
7.2.1. Networking Traffic Generation Setup
The performance of the vTC VNF is dependent on the following factors with respect to the traffic profile, namely (i) the number of flows; (ii) flow duration; (iii) stateful protocol matching versus static port. In this context a traffic profile which consists of high volume, short-lived flows consumes a higher level of compute resources (CPU and memory) in order to support classification of the new flows. Additionally other factors that affect the performance of the VNF are dependent solely on its configuration and enabled features. These factors are: (i) the number of protocols being matched against, (ii) the number of regular expressions used and (iii) matching algorithm complexity. Throughout the experimental protocol the same mixture of traffic and VNF setup was utilised in order to minimise any influence from the factors outlined which can affect the VNF’s performance behaviour.
The traffic profile used in the experiments was based on real traffic traces captured in NCSRD’s network. In total the captured traffic contained 2343 unique flows utilising 28 different application protocols. The captured PCAP files were reproduced during

T-NOVA | Deliverable D4.01 Infrastructure Virtualisation
© T-NOVA Consortium
64
the experiments using a packet generator capable of reaching 10Gbps line rates. The packet destination addresses for the generated were re-written and replaced with a multicast destination address. This modification is necessary due to the fact that the traffic needs to be mirrored to both VNFCs. This method was preferred over performing traffic mirroring at the OVS level (at the compute node), which could introduce additional latencies and increase resource utilisation.
7.3. Test Case Scenarios
The following section describes a test case scenario where the framework was applied. The scenario investigated the effect of allocating OVS and SR-IOV network connections on the performance of a vTC. The framework was also used to investigate an approach which supports a VNF deployment based on network performance intent.
7.3.1. OVS vs SR-IOV Characterisation
The framework was used to investigate the effect of allocating OVS and SR-IOV physical channel connections to the network ports of the VNFCs comprising the VNF. As shown in Figure 7-1 the VNF has 5 network port connections providing ingress, egress and inter VNFC connectivity. Two Heat templates were generated to reflect this configuration with the two instances generated being deployed on two different physical hosts, respectively with and without SR-IOV capabilities. As shown in Figure 7-3 each instance had dedicated destination test endpoints (TP2 and TP3) implemented as virtual machines which were used to measure the amount of traffic the VNF was able to forward. A third endpoint destination (TP1) acted as a network throughput reference point by intercepting all traffic sent by the traffic generator. A traffic generator [8] was used to generate multicast traffic flows that were simultaneously sent to both VNFs and TP1. The traffic rate was accelerated at runtime in order to send a linearly increasing traffic profile, ranging from 1Mbps to 9.6Gbps.
Figure 7-3 Testpoint configuration for VNF testing
7.3.2. Network Intent Test Case
The network intent test case investigated an approach which supports VNF deployments based on network performance intent. The main purpose of the test case was to support an automated deployment which is capable of selecting the minimum resource configuration for a VNF which will provide the desired level of

T-NOVA | Deliverable D4.01 Infrastructure Virtualisation
© T-NOVA Consortium
65
performance specified by an SLA. This relates to a scenario where a Service Provider wishes to provide the same service to many users with different SLAs by using different VNF flavours. The concept of flavour in this context is distinctly different to OpenStack’s VM flavour. In this context it is intended to define the complete deployment configuration of all the VNFCs composing a VNF. It includes the configuration of the network interfaces, the scheduler hints and other elements necessary to instantiate the VMs in additional to the required allocations of vCPUs, RAM and storage. In order to define the VNF flavours, a set of experiments were carried out using the framework to collect and analyse the data based on various deployment configurations (SR-IOV allocation and VM flavours). Three bandwidth SLA targets were selected (400Mbps, 800Mbps and 3Gbps). The data collected was analysed using the J48 machine learning algorithm [24], specifically the Weka implementation which returns a decision tree as its output. The approach is designed to support the automated building of VNF flavours, according to the network performance intent of the customer, selecting the most efficient configuration (in terms of usage of resources) which can provide the required SLA.
7.3.3. Results and Discussion
The following sections present the key results relating to the test case scenarios described in the previous section.
7.3.3.1. OVS vs SR-IOV Characterisation
The results of the characterisation experiments are shown in Figure 7-4. The network traffic load was increased linearly from 1 Mbps to 9.6Gbps over the course of the experimental run which was approximately 140 seconds in duration. The VNF deployment utilising OVS exhibited network saturation effects at approximately 360 Mbps. The VNF deployment utilising SR-IOV exhibited a 10 fold improvement over OVS with saturation occurring at approximately 3.6Gbps. However the results also indicate a significant gap between the throughput achieved by the forwarding VNFC and the total traffic load.
Figure 7-4. SR-IOV vs OVS throughput.
The VNF also generates metrics to monitor its internal performance which are typically used by a VNF Manager (VNFM) to manage the VNF when deployed. For the

T-NOVA | Deliverable D4.01 Infrastructure Virtualisation
© T-NOVA Consortium
66
purposes of this experiment these metrics were captured and integrated into the telemetry platform for further analysis. In Figure 7-5 the number of flows detected per second by the VNF is shown. The ability of the VNF to detect unique flows is significantly affected by the allocation of SR-IOV or OVS and corresponds to the pattern of behaviour shown in Figure 7-5.
Figure 7-5 SR-IOV vs OVS number of detected flows
7.3.3.2. Network Intent
In order to explore different network performance intents, 32 different configurations consisting of various network connection types between SR-IOV and OVS for the VNFCs of the VNF were investigated. The test scenarios were automatically provisioned, tested and analysed using the framework, generating all possible combinations of the variables (Five vNICs with two allowed values). Each configuration was tested three times using 60 second test durations. Over 6000 data points were generated and analysed using the J48 algorithm to generate a decision tree as shown in Figure 7-6.
Figure 7-6 J48 Decision Tree
Using this tree it is possible to select a VNF configuration to achieve a given SLA. For instance, the minimal configuration to achieve a forwarding throughput of 3Gbps is achieved by allocating SR-IOV to vNICs 4 and 5 both and OVS to the other interfaces.
The same experiments were performed for various flavours of the Forwarding VNFC, specifically varying the quantity of vCPUs and of RAM assigned to the VM. For this experimental configuration SR-IOV channels were statically assigned to the vNICs 1, 4 and 5. The number of vCPUs assigned to the VM was varied between 1 and 10 and RAM allocations between 2 and 8GBs in 1GB incremental steps. The total number of

T-NOVA | Deliverable D4.01 Infrastructure Virtualisation
© T-NOVA Consortium
67
possible combinations of configuration for this experiment was 70. Each configuration was tested 3 times over a 60 second duration using the framework. In total 14,000 data points were collected which were used for model generation in WEKA.
The results obtained do not indicate any particular dependency on the flavour of the VM i.e. the VNFC was not CPU or memory bound; therefore a minimum VNF flavour (1 vCPU, 2GB RAM) was sufficient to achieve a 3Gbps traffic throughput. Of course, this result is specific for the virtualised traffic classifier under test and for the physical infrastructure setup utilised. The J48 algorithm did not return any decision tree.
To check the validity of the results obtained two deployments were carried out. One deployment was based on a maximum resources allocation and a second deployment was based on the resources selected by the framework. A side to side performance comparison of the respective deployments is shown in Figure 7-7. The network throughput achieved is the same for both deployments. However in the second deployment the result is achieved with a significantly smaller allocation of resources which provides tangible support for the approach outlined.
Figure 7-7 Effect of vCPU’s allocation (High and Low performance evenly distributed
indicating no influence
7.4. Conclusions While the utilisation of a VNFD is the current industry approach to support the automated deployment of VNFs in cloud computing environments, it has potential limitations from an Orchestration perspective and does not take into account underutilisation of compute resources. To address this limitation, the potential of ‘network performance intent’ was investigated. The effect of the deployment configuration, i.e. the VNF flavour, on the performance has been demonstrated using a comparison between OVS and SR-IOV network technologies. Additionally an approach for the automatic selection of the best VNF flavour has been proposed and a framework has been designed and developed to support dynamic configuration selection at runtime.
It has been shown that this approach can be used to define appropriate deployment configurations in an automated manner to achieve a specific network related performance intent with a minimal configuration of a VNF i.e. consumes the lowest amount of resources (e.g. number of SR-IOV channels, number of vCPUs, amount of RAM, etc.) for the required performance intent.

T-NOVA | Deliverable D4.01 Infrastructure Virtualisation
© T-NOVA Consortium
68
8. T-NOVA CONTRIBUTION TO OPNFV YARDSTICK
PROJECT
In September 2014 the Linux Foundation announced the Open Platform for NFV Project (OPNFV) [25] which is focused on developing a carrier-grade, integrated, open source reference platform.
The goal of OPNFV is to accelerate the introduction of new NFV products and services.
As an open source project it is positioned to bring together the work of standards bodies, open source communities and commercial suppliers to deliver a de facto standard open source NFV platform for the industry. By integrating components from upstream projects, the community is carrying out performance and use case-based testing to ensure the platform’s suitability for NFV use cases. OPNFV aims also to bring the learnings from its work directly to those communities in the form of blueprints, patches, and code contributions.
The scope of OPNFV’s ARNO release (June 2015) was focused on building an NFV Infrastructure (NFVI) and Virtualised Infrastructure Management (VIM) by integrating components from upstream projects such as OpenDaylight, OpenStack, Ceph Storage, KVM, Open vSwitch, and Linux. These components, along with application programmable interfaces (APIs) to other NFV elements form the basic infrastructure required for VNFs and Management and Network Orchestration (MANO) components. OPNFV’s goal is to increase performance and power efficiency; improve reliability, availability, and serviceability; and deliver comprehensive platform instrumentation.
One of the projects in OPNFV is Yardstick which is focused on the verification the infrastructure compliance when running VNF applications. The activities of Yardstick and activities in Task 4.1 have an obvious alignment. During the course of Task 4.1 partners from the task engaged with Yardstick team and identified opportunities for the task to make a meaningful contribution to the Yardstick project. The following sections describe T-NOVA contributions to Yardstick project which are planned to be included in the OPNFV Brahmaputra release scheduled for early 2016.
8.1. Yardstick Project
The goal of the Yardstick Project is to verify the infrastructure compliance when running VNF applications. NFV use cases described in ETSI GS NFV 001 show a large variety of applications, each defining specific requirements and complex configuration on the underlying infrastructure and test tools. The Yardstick concept decomposes typical VNF work-load performance metrics into a number of characteristics/performance vectors, which each of them can be represented by distinct test-cases. The project scope is to develop a test framework, test cases and

T-NOVA | Deliverable D4.01 Infrastructure Virtualisation
© T-NOVA Consortium
69
test stimuli. The methodology used by the Project, to verify the infrastructure from the perspective of a VNF, is aligned with ETSI TST001 [2].
8.2. T-NOVA Contribution to Yardstick
The T-NOVA contribution to the Yardstick project is mainly composed by the virtual Traffic Classifier (vTC) network function developed in WP5 along with a number of VNF lifecycle and data plane benchmarking test cases and the Workload Characterisation Framework described in Section 5. The workload characterisation framework provides full test case lifecycle support: deployment of required resources, execution of the test case and the termination of the resources at the end of each test case. Some use cases have been already defined: they come with the framework and will be contributed to the Yardstick OPNFV project in order to support a user to characterise the vTC on top of their-own infrastructure. However it will be possible for the user to develop their onw test cases whose life cycle will be supported by the framework.
A test case is defined as a set of actions to be performed in order to collect data or answer specific questions related to the workload under test (e.g. is the workload able to manage a given traffic rate?, or what is the highest supported throughput?, and so forth).
For the sake of simplicity, within the framework each test case is organised into different phases. The instantiation and the termination of the workload and the allocation of required resources is realised by the Benchmarking Unit of the Framework, which also validates each deployment. A test case includes the following methods:
§ Initialisation: provides the initialisation of the set of resources specific for a given test case (e.g. deployment of noisy neighbours on the physical host);
§ Execution: the actual execution of the test case, which also needs to manage data collection and data persistence at the end of each experiment;
§ Finalisation: termination of the resource set allocated during the initialisation phase.
Four test cases are currently under development and will be contributed to Yardstick. They require traffic to be sent to the function under test and are based on the DPDK-Pktgen packet generator. The test cases are based on the use of three physical compute nodes and two switches. The general configuration utilised is as follows:
§ An OpenStack controller:
o Operating System: Linux (Ubuntu 14.04) o OpenStack Controller (Kilo version). o Configuration of Neutron service based on VLANs (not GRE tunnels). o 1GB (or higher) Ethernet card connected a management network; o 1GB (or higher) Ethernet card to be connected to a data network; o 1GB (or higher) Ethernet card to be connected to an external network;
§ An OpenStack compute node:

T-NOVA | Deliverable D4.01 Infrastructure Virtualisation
© T-NOVA Consortium
70
o Operating System: Linux (Ubuntu 14.04) o OpenStack Compute Node (Kilo –needs to be same as the controller
node). o 1GB (or higher) Ethernet card to be connected to the management
network, o 2x10GB Ethernet cards, SR-IOV enabled, to be connected to the data
network (Intel X540-T2 NIC is preferable), one NIC is used for communications with the VM over an SR-IOV channel, the other NIC is used for communications via OVS.
§ A node for hosting the packet generator and the execution of the framework:
o Operating System: Linux (Ubuntu, Fedora or CentOS are valid options) o 1Gb (or higher) Ethernet card to be connected to the management
network, o 2x10Gb DPDK compatible Ethernet cards connected to the data
network (e.g. Intel X540-T2);
§ Data Network switch:
o 10GB interfaces o Multicast support (Internet Group Management Protocol (IGMP) and
IGMP snooping protocols) o VLAN support
§ Management Network switch:
o 1GB (or higher) Ethernet interface.
If only two physical nodes are available, the framework can also be executed in an All-In-One OpenStack setup, however the results of the performance characterisation will probably be influenced by this choice. A dedicated node is required for packet generator and framework execution. The vTC instances are executed by the framework on the OpenStack compute node sequentially.
8.2.1. Test Cases
A typical test case will comprise of template deployment, followed by traffic generation which is sent to the deployed VNF, collection of real time data on performance (e.g. network throughput), stopping network traffic generation followed by VNF and template deletion. This process is repeated until all templates have been deployed.
The following test cases will be completed.
• Network Throughput - Measurement of networking throughput using RFC2544 benchmarking methodology for network interconnect devices. This test case utilises the DPDK packet generator to generate a constant line rate network traffic load with different frame sizes (64, 128, 256, 512, 1024, 1280, 1518 bytes). The throughput is calculated as the maximum traffic rate that is supported by the function under test for 60 seconds without any packet loss.

T-NOVA | Deliverable D4.01 Infrastructure Virtualisation
© T-NOVA Consortium
71
• Multi tenancy - Measurement of networking throughput using RFC2544 benchmarking methodology for network interconnect devices in a multi-tenancy deployment scenario. This test case utilises OpenStack Heat to generate multi instances of a generic traffic sender/receiver service that generates and consumes network traffic at defined rates. The test case deploys a single instance of the function under test with incrementally increasing instances of the sender/receiver service. This test case utilises the DPDK packet generator to generate a constant line rate network traffic load with different frame sizes. Throughput is calculated according to RFC2544.
Deployment Scenarios:
• The function under test, sender and receiver services are deployed on same physical compute node using OVS.
• The function under test and sender service are deployed on the same physical compute node using OVS. The receiver service is deployed on a second physical compute node using OVS.
• The function under test and sender and receiver services are deployed on same physical compute node. The function under test is allocated SR-IOV ports, and the sender receiver service is allocated OVS ports.
• The function under test and sender receiver service are deployed on the same physical compute node. The function under test and the sender and receiver services are allocated SR-IOV ports.
Details of the individual test cases adhering to the format proposed in ETSI GS NFV-TST001 are described in the following sections.

T-NOVA | Deliverable D4.01 Infrastructure Virtualisation
© T-NOVA Consortium
72
8.2.2. Virtual Traffic Classifier Instantiation Test
A detailed description of the protocol to be followed for this test case is presented in the following table, adhering to the format proposed in ETSI GS NFV-TST001.
vTC Instantiation Test Description
Identifier vTC _Instantiation_Test_1
Test Purpose To verify that a newly instantiated vTC is ‘alive’ and functional.
Configuration The values of the parameters composing the flavours of the vTC used for the test are provided in a configuration file or through an API. All possible configuration combinations are considered. In the case where only one value is provided for each parameter, the configuration under test will be one.
References ETSI GS NFV MAN 001: "Network Functions Virtualisation (NFV); Management & Orchestration".
ETSI GS NFV SWA 001: "Network Functions Virtualisation (NFV); VNF Architecture".
Pre-test conditions • The Test vTC has been successfully instantiated and configured. • The user has specified the network throughput (expressed in
unitary percentage of 10Gbps) that the vTC is should support on the current infrastructure.
• The user has assigned the necessary NFVI resources and selected the correct parameter values for the vTC to perform at its target level.
Test
Sequence Step Type Description Result
1 Stimulus The Test Controller triggers the creation and configuration of the vTC.
2 Check The vTC has been successfully instantiated and has been allocated the necessary NFVI resources, as specified in the Heat Template.
The vTC configuration script has been executed and the network function is ready to receive and process traffic.
3 Stimulus This step involves the Test Controller (the framework) before initiating the actual test. The Test Controller is required to establish the necessary control plane or stateful sessions with the VNF.

T-NOVA | Deliverable D4.01 Infrastructure Virtualisation
© T-NOVA Consortium
73
vTC Instantiation Test Description
Since the vTC VNF is session agnostic, this step is omitted by the test case.
4 Check Follows Step 3.
5 Stimulus The Test Controller originates the traffic to be sent to the vTC and the vTC processes the traffic and sends it to the destination, in order for the traffic to be analysed.
6 Check The vTC instance forwards traffic for at least 10 seconds.
7 Check The Test Controller ensures that the vTC instance forwards all packets without errors, meets its user defined performance targets (throughput >= user specified value) and the packets are processed correctly.
Test Verdict The vTC is deemed as successfully instantiated if all the checks are successful, else it is deemed DoA (dead-on-arrival).

T-NOVA | Deliverable D4.01 Infrastructure Virtualisation
© T-NOVA Consortium
74
8.2.3. Virtual Traffic Classifier Instantiation in the presence of Noisy Neighbours Test
A more detailed description of the protocol for this test case is presented in the following table.
vTC Instantiation in presence of noisy neighbours Test Description
Identifier vTC _Instantiation_Test_2
Test Purpose To verify that a newly instantiated vTC is ‘alive’ and functional in presence of noisy neighbours.
Configuration The values of the parameters composing the flavours of the vTC used for the test are provided in the configuration file or through an API. All possible combinations of parameters and associated values are taken into account. If for each parameter only one value will be provided, the configuration under test will be one.
References ETSI GS NFV MAN 001: "Network Functions Virtualisation (NFV); Management & Orchestration"
ETSI GS NFV SWA 001: "Network Functions Virtualisation (NFV); VNF Architecture"
Pre-test conditions • The Test vTC has been successfully instantiated and configured. • The user has specified the number of compute-bound noisy
neighbours. • The user has specified the number of memory-bound noisy
neighbours. • The user has specified the network throughput (expressed in
unitary percentage of 10Gbps) that the vTC is required to support on the current infrastructure and with the current configuration.
• The user has assigned the necessary NFVI resources and selected the right parameter values for the vTC to perform at its target level.
Test Sequence
Step Type Description Result
1 Stimulus The Test Controller triggers the creation and configuration of the vTC.
2 Stimulus The Test Controller triggers the creation and the configuration of the noisy neighbours, as required by the user.
3 Check The vTC and the neighbours have been successfully instantiated and have been allocated the necessary NFVI resources, as

T-NOVA | Deliverable D4.01 Infrastructure Virtualisation
© T-NOVA Consortium
75
vTC Instantiation in presence of noisy neighbours Test Description
specified in a Heat Template.
The vTC configuration script has been executed and the network function is ready to receive and process traffic.
4 Stimulus This step would involve the Test Controller (the framework) before to initiate the test. The Test Controller would be required to establish the necessary control plane or stateful sessions with the VNF.
Since the vTC VNF is session agnostic, this step is omitted by this test case.
5 Check Follows Step 4.
6 Stimulus The Test Controller originates traffic to be sent to the vTC and the vTC processes it and sends it to the destination, in order for the traffic to be analysed.
7 Check The vTC instance forwards traffic for at least 10 seconds.
8 Check The Test Controller ensures that the vTC instance forwards all packets without errors, meets its user defined performance targets (throughput >= user specified value) and the packets are processed correctly.
Test Verdict The vTC is deemed as successfully instantiated if all the checks are successful, else it is deemed DoA

T-NOVA | Deliverable D4.01 Infrastructure Virtualisation
© T-NOVA Consortium
76
8.2.4. Virtual Traffic Classifier Data Plane Throughput Benchmarking Test
This test case mainly involves the measurement of network throughput using the RFC2544 benchmarking methodology for network devices. Further details are provided in the following table.
vTC Data Plane Throughput Benchmarking Test Description
Identifier vTC Data Plane Throughput Benchmarking Test_1
Test Purpose Measure the vTC’s network throughput according to the RFC 2544 methodology for a user-defined set of vTC deployment configurations.
Configuration The values of the parameters composing the flavours of the vTC used for the test are provided in the configuration file or through an API. All possible combinations of flavour/configuration are considered. If for each parameter only one value will be provided, the configuration under test will only be one.
References ETSI GS NFV MAN 001: "Network Functions Virtualisation (NFV); Management & Orchestration"
ETSI GS NFV SWA 001: "Network Functions Virtualisation (NFV); VNF Architecture"
Pre-test conditions • The vTC has been successfully instantiated and configured. • The user has correctly assigned the values to the
deployment configuration parameters.
Test Sequence
Step Type Description Result
1 Stimulus The Test Controller triggers the creation and configuration of the vTC.
2 Check The vTC has been successfully instantiated and has been allocated the necessary NFVI resources, as specified in the Heat Template.
The vTC configuration script has been executed and the network function is ready to receive and process traffic.
3 Stimulus This step would involve the Test Controller (the framework) before to initiating the test. The Test Controller would be required to establish the necessary control plane or stateful

T-NOVA | Deliverable D4.01 Infrastructure Virtualisation
© T-NOVA Consortium
77
vTC Data Plane Throughput Benchmarking Test Description
sessions with the VNF.
Since the vTC VNF is session agnostic, this step is omitted by this test case.
4 Check Follows Step 4.
5 Stimulus It is recommended to run the test cycle through different frame sizes and frame rates:
• Frame sizes - [64 , 128, 256, 1024, 1280, 1518 bytes]
• Rate in percentage of available bandwidth - [10, 20, 30, 40, …, 100].
The Test Controller originates traffic to be sent to the vTC and the vTC processes it and sends it to the destination, in order for the traffic to be analysed. It repeats the iterations until all frame sizes and frame rates have been exhausted.
6 Check The vTC instance forwards traffic for at least 120 seconds.
7 Check The Test Controller ensures that the vTC instance forwards all packets and calculates the maximum supported throughput for each configuration.
Test Verdict The Test Controller returns a csv file with the results obtained during the test for the different configurations.
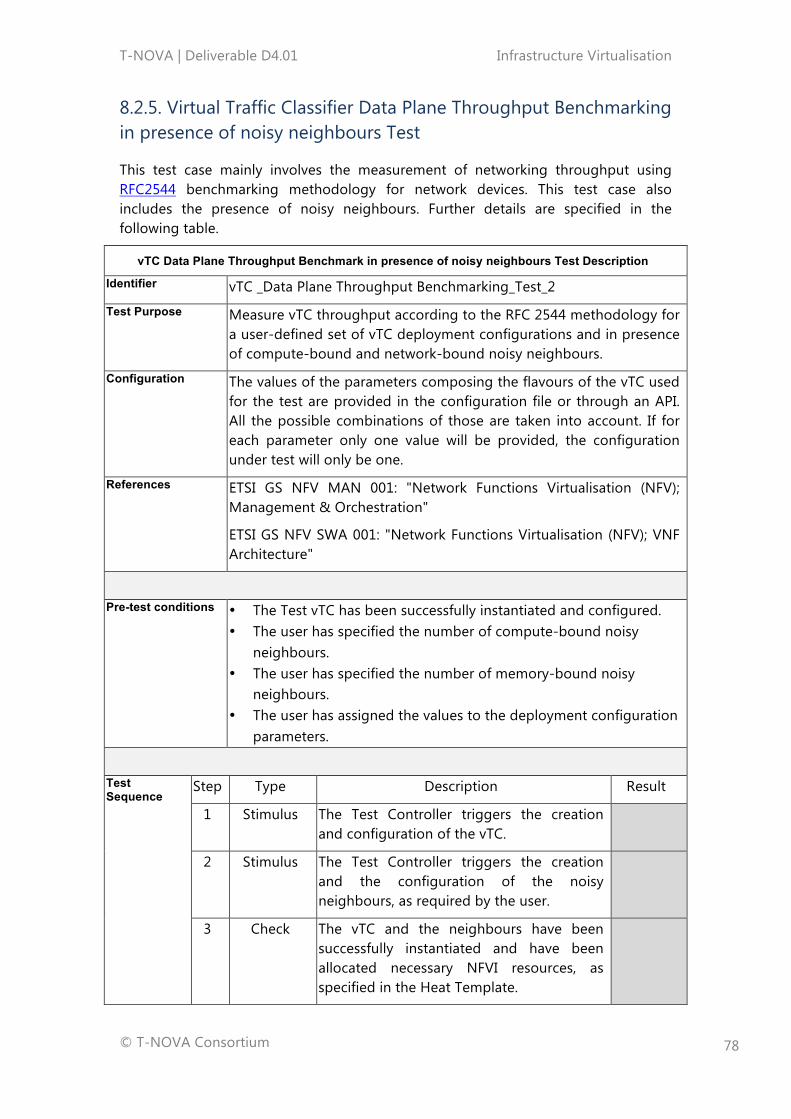
T-NOVA | Deliverable D4.01 Infrastructure Virtualisation
© T-NOVA Consortium
78
8.2.5. Virtual Traffic Classifier Data Plane Throughput Benchmarking in presence of noisy neighbours Test
This test case mainly involves the measurement of networking throughput using RFC2544 benchmarking methodology for network devices. This test case also includes the presence of noisy neighbours. Further details are specified in the following table.
vTC Data Plane Throughput Benchmark in presence of noisy neighbours Test Description
Identifier vTC _Data Plane Throughput Benchmarking_Test_2
Test Purpose Measure vTC throughput according to the RFC 2544 methodology for a user-defined set of vTC deployment configurations and in presence of compute-bound and network-bound noisy neighbours.
Configuration The values of the parameters composing the flavours of the vTC used for the test are provided in the configuration file or through an API. All the possible combinations of those are taken into account. If for each parameter only one value will be provided, the configuration under test will only be one.
References ETSI GS NFV MAN 001: "Network Functions Virtualisation (NFV); Management & Orchestration"
ETSI GS NFV SWA 001: "Network Functions Virtualisation (NFV); VNF Architecture"
Pre-test conditions • The Test vTC has been successfully instantiated and configured. • The user has specified the number of compute-bound noisy
neighbours. • The user has specified the number of memory-bound noisy
neighbours. • The user has assigned the values to the deployment configuration
parameters.
Test Sequence
Step Type Description Result
1 Stimulus The Test Controller triggers the creation and configuration of the vTC.
2 Stimulus The Test Controller triggers the creation and the configuration of the noisy neighbours, as required by the user.
3 Check The vTC and the neighbours have been successfully instantiated and have been allocated necessary NFVI resources, as specified in the Heat Template.
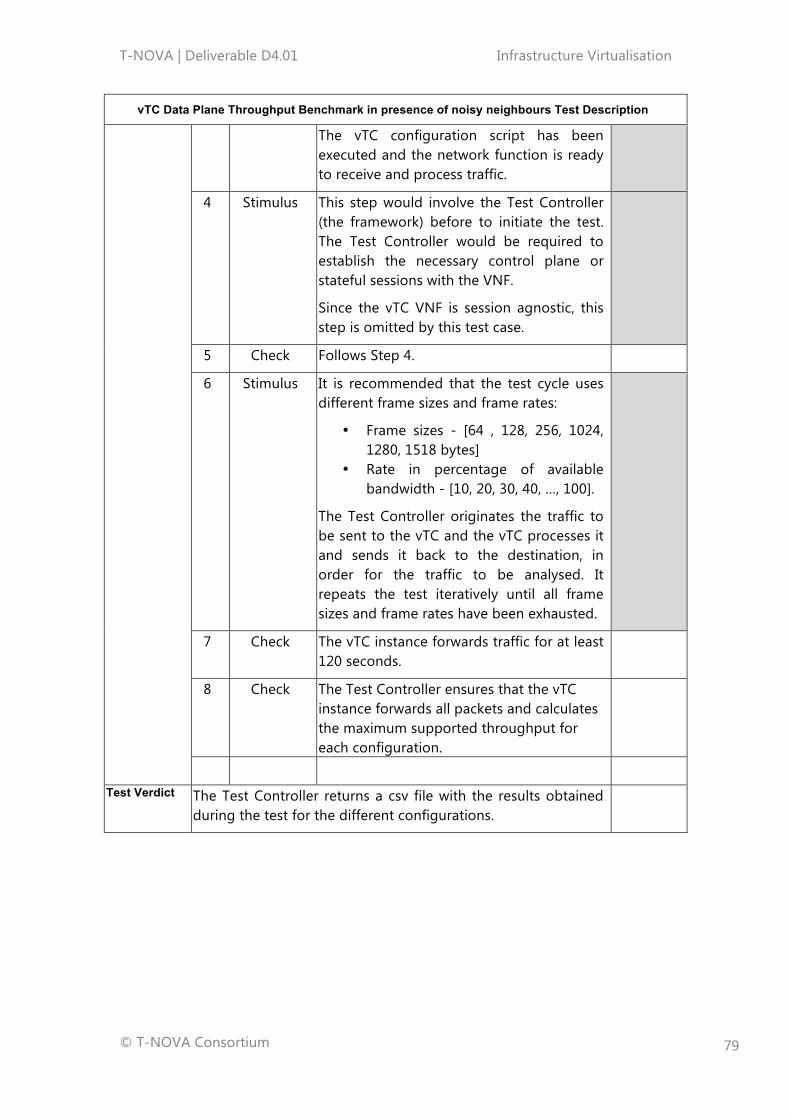
T-NOVA | Deliverable D4.01 Infrastructure Virtualisation
© T-NOVA Consortium
79
vTC Data Plane Throughput Benchmark in presence of noisy neighbours Test Description
The vTC configuration script has been executed and the network function is ready to receive and process traffic.
4 Stimulus This step would involve the Test Controller (the framework) before to initiate the test. The Test Controller would be required to establish the necessary control plane or stateful sessions with the VNF.
Since the vTC VNF is session agnostic, this step is omitted by this test case.
5 Check Follows Step 4.
6 Stimulus It is recommended that the test cycle uses different frame sizes and frame rates:
• Frame sizes - [64 , 128, 256, 1024, 1280, 1518 bytes]
• Rate in percentage of available bandwidth - [10, 20, 30, 40, …, 100].
The Test Controller originates the traffic to be sent to the vTC and the vTC processes it and sends it back to the destination, in order for the traffic to be analysed. It repeats the test iteratively until all frame sizes and frame rates have been exhausted.
7 Check The vTC instance forwards traffic for at least 120 seconds.
8 Check The Test Controller ensures that the vTC instance forwards all packets and calculates the maximum supported throughput for each configuration.
Test Verdict The Test Controller returns a csv file with the results obtained during the test for the different configurations.

T-NOVA | Deliverable D4.01 Infrastructure Virtualisation
© T-NOVA Consortium
80
9. CONCLUSIONS
Task 4.1 focused on the identification, characterisation and optimisation of the hardware and software components that can be used in the implementation of the T-NOVA IVM. VNFs have varying compute, storage and network requirements that are specific to required levels of performance or associated SLAs. The potential mix of software and hardware options within the NFVI can have a signification influence on the performance of VNFs running on NFVI nodes. The performance of a VNF is directly linked to the hardware performance, resource allocations and virtualisation technologies (hardware and software).
The task identified various candidate technologies relating to network optimisation, computational resources and storage to be characterised. The selection of candidate technologies were utilised in the design and implementation of an NFVI testbed. The testbed was used to characterise the performance of candidate technologies on a standalone basis or when used to support the deployment of a VNF. The initial set of characterisation experiments focused on networking technologies options which can be used to improve packet processing performance. Technologies investigated included OVS, OVS-DPDK, SR-IOV and Snabb Switch. Using different configuration their impact on network throughput performance of a VNF was demonstrated. It was also demonstrated that a combination of SR-IOV and DPDK achieved in excess of 8Gbps network throughput.
The performance of a non-virtualised deployment of the virtual Traffic Classifier (considered as baseline performance) was compared to a Docker container and virtualised KVM deployments with OVS and SR-IOV network connectivity. The results obtained indicated that with a non-virtualised deployment and Docker container it is possible to achieve up to 4.7Gbps throughput, with OVS it is possible to reach up to 800Mbps and with SR-IOV it is possible to reach 3.7Gbps, which means a reduction of the 21% with respect to the non-virtualised configuration.
Another element of network optimisation which is important to consider is service chaining and its impact on switch performance requirements. Service chaining requires the installation of flow entries in OpenFlow switches located in data centres, after which network traffic will traverse the NFs in the exact order specified in the service chain. This requirement generates the need to install a large number of flow entries in switches which potentially could result in a data scalability issue for the T-NOVA system, as OpenFlow switches typically have relatively small flow table size (i.e., several thousand entries). To mitigate the problem of the small switch flow tables, a dual-datapath approach was investigated. This approach exhibited high forwarding performance and port density in the accelerated datapath, while the primary datapath exploited the large amount of cache and main memory available in commodity servers to store all required flow state. This approach has the potential to enable service chaining at scale which is important in the context of realising NFaaS for customers. The network characterisation activities also highlighted the different levels of maturity in network technologies for VNF related use cases. The work on

T-NOVA | Deliverable D4.01 Infrastructure Virtualisation
© T-NOVA Consortium
81
Snabb switch indicated that despite the promising level of functionality it currently lacks sufficient maturity for it to be considered for use within the T-NOVA system.
The second phase of technology characterisation focused computational resources options. Parameters such the processor architecture, bandwidth of buses (peripheral, inter-processor), availability of specialist instruction sets (AES-NI), have a strong influence on how a VNF behaves on the specific compute node’s hardware. The effects of core and NUMA pinning, core isolation and huge pages on VNF performance were investigated. The results show that the usage of processor pinning can help to achieve improved performance, if properly configured. The effect of NUMA pinning on VM performance was identified as being significant with an approximately 50% increase in network throughput. Co-location of a VNF on the same NUMA node that is attached to the NIC is important for data plane type workloads. The effects of huge page configurations were found to be scenario specific and are more important in multi-tenancy scenarios where noisy neighbours can affect the performance of the workload. The configuration of BIOS settings in compute nodes were investigated in addition to huge page settings. BIOS can have an important influence on both compute node stability and workloads running on the compute node. For initial testing the recommendation is to disable the majority of platform settings (apart from the virtualisation features, namely VT-d, VT-x, VT-c which must be enabled). After an initial baseline has been established the various features can be enabled one at a time and tuned for desired performance level. The BIOS configuration will be at a minimum workload type specific i.e. data plane versus control plane etc. Finally the effects of heterogeneous compute resources were investigated with a specific focus on how they could be used within an OpenStack environment. An FPGA SoC with two ARM A9 cores was selected as the target platform. This activity remains a work in progress. The hardware and software components of the system are being tested, which will be followed by an integration phase, after which the deployment of a simple dummy VNFC will be demonstrated as part of Task 4.5 activities. This dummy VNFC will be subsequently replaced by a functional block and the system will be integrated into the T-NOVA system with the ultimate goal being to deploy a VNF, which consists of at least one FPGA-based VNFC.
Investigations into the effect of storage using a Squid Proxy VNF indicate that Live Migration duration with ephemeral volumes increases with the cache size, with approximately the same duration (in seconds) for cache reading and writing respectively and with lower values with cache in idle mode. This does not happen when volumes are located on a block storage solution such as Cinder. In this case the Live Migration duration is lower than the case with an ephemeral volume while cache size was found to have no influence. The results obtained also indicate that that when using local disks of compute nodes block storage technology is the preferred option in comparison to ephemeral volumes, exhibiting insensitivity to cache size variations. In fact, with ephemeral volumes on local disks Live Migration becomes bounded to a Storage Live Migration constraint.
The inter play between the VNF and hardware in the context of virtualisation is of critical importance. Workload characterisation was an important focus within the task. As a technology, NFV encompasses a wide variety of network functions which have a

T-NOVA | Deliverable D4.01 Infrastructure Virtualisation
© T-NOVA Consortium
82
diversity of resource requirements. Therefore it is important to develop an understanding of the workload types and their affinity for certain platform features and technologies. While it is not possible to identify all the affinities for all VNFs within the scope of Task 4.1 it was important to implement a robust methodology which could be used for the T-NOVA VNFs and was sufficiently flexible in nature to allow its use beyond T-NOVA. Workload characterisation is typically a manual process which investigates a limited number of platform features and variations of configurations. This has the effect of constraining the workload characterisation process due the high levels of human intervention required and time constraints. To address these limitations a VNF workload characterisation framework was designed and implemented to automatically test various configurations of a VNF, in an iterative manner on different target platforms. It is used to evaluate the affinity a VNF has for either allocations of compute resources (e.g. OpenStack flavour) or the effect of specific platform features on VNF performance. The framework provides orchestration of the full test case lifecycle. The framework was applied to the characterisation of a virtualised traffic classifier developed by NCSRD. Specifically the framework was used to investigate the potential of ‘network performance intent’ deployments. The effect of the deployment configuration, i.e. the VNF flavour, on the performance has been demonstrated using a comparison between OVS and SR-IOV network technologies. It was shown that this approach can be used to define appropriate deployment configurations in an automated manner to achieve a specific network related performance intent with a minimal configuration of a VNF i.e. consumes the lowest amount of resources (e.g. number of SR-IOV channels, number of vCPUs, amount of RAM, etc.) for the required performance intent. This work has potential to be exploited at an Orchestration level where the selection of a VNF flavour to deliver a specific level of performance could be automated to provide dynamic selection at run time.
The activities within Task 4.1 had a natural alignment with OPNFV which is an industry lead open source project focused on accelerating NFV's evolution through an integrated, open platform. There are variety of Requirements, Integration & Testing and Collaborative Development projects within OPNFV. Specifically Task 4.1 had significant alignment with the Yardstick project which is an Integration and Testing type project. Working collaboratively with the Yardstick project which is led by Ericsson, a number of areas of contribution were identified which include contribution of the VNF characterisation framework, definition and of implementation of VNF lifecycle and VNF data plane benchmarking test cases and the contribution of the virtualised traffic classifier. The test case contributions from Task 4.1 have been accepted and added to the Yardstick work program. The framework is being further developed in order to ensure that can be used in a fully generic manner (i.e. the framework is not tied to a specific VNF) and to ensure robustness of operation through the implementation of a comprehensive unit testing plan. This work is on-going and will continue through Task 4.5 where the framework will be deployed and utilised as part of the T-NOVA testbed. The Task 4.1 contributions are scheduled to form part of the OPNFV Brahmaputra release in 2016.

T-NOVA | Deliverable D4.01 Infrastructure Virtualisation
© T-NOVA Consortium
83
10. LIST OF ACRONYMS
Acronym Description
ACL Access Control List
AES-NI Advanced Encryption Standard New Instructions
API Application Programming Interface
AVG Average
BCAM Binary Content Addressable Memory
BGP Border Gateway Protocol
BGP-LS Border Gateway Protocol Linkstate
BKM Best Known Method
CLI Command Line Interface
CP Control Plane
CPU Control Processing Unit
CRC Cyclic Redundancy Check
DC Data Centre
DMA Direct Memory Access
DOVE Distributed Overlay Virtual Ethernet
DoW Description of Work
DP Data Plane
DPDK Data Plane Development Kit
DSP Digital Signal Processing
DUT Device Under Inspection
EPT Extended Page Tables
ETSI European Telecommunications Standards Institute
FE Functional Entity
FPGA Field Programmable Gate Array
Gbps Giga bits per second
GPU Graphical Processing Unit
GRE Generic Routing Encapsulation
HA Hardware Abstraction
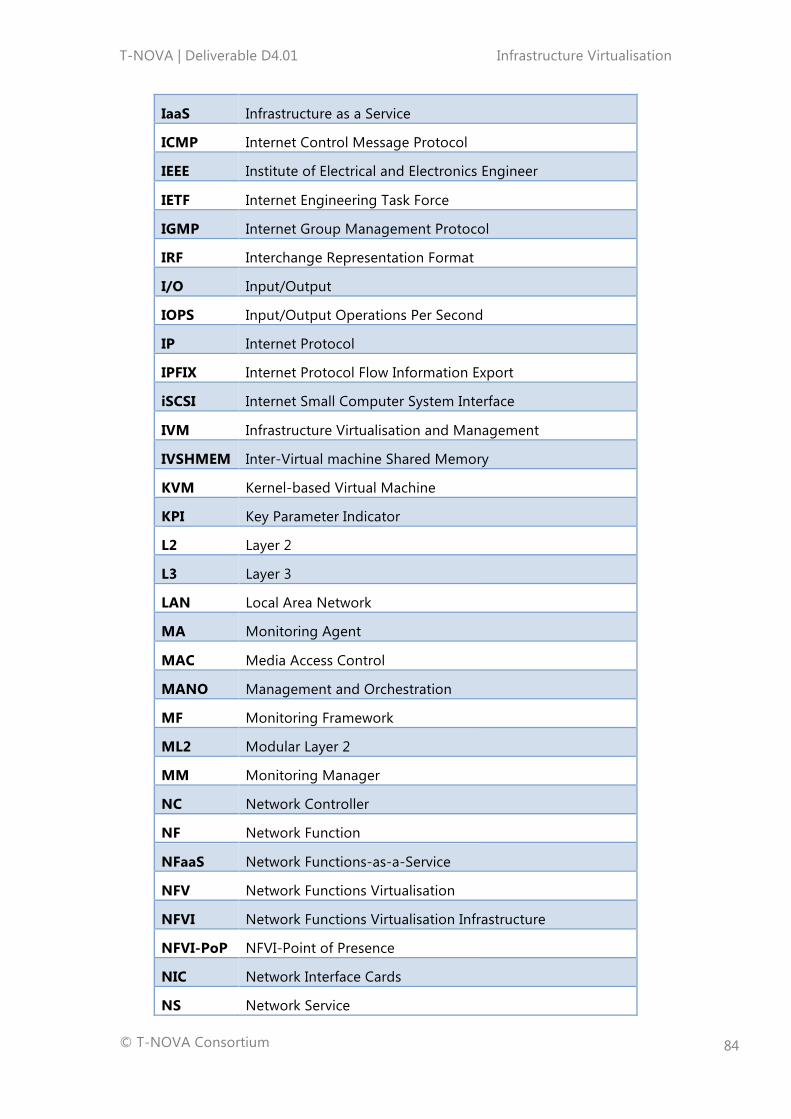
T-NOVA | Deliverable D4.01 Infrastructure Virtualisation
© T-NOVA Consortium
84
IaaS Infrastructure as a Service
ICMP Internet Control Message Protocol
IEEE Institute of Electrical and Electronics Engineer
IETF Internet Engineering Task Force
IGMP Internet Group Management Protocol
IRF Interchange Representation Format
I/O Input/Output
IOPS Input/Output Operations Per Second
IP Internet Protocol
IPFIX Internet Protocol Flow Information Export
iSCSI Internet Small Computer System Interface
IVM Infrastructure Virtualisation and Management
IVSHMEM Inter-Virtual machine Shared Memory
KVM Kernel-based Virtual Machine
KPI Key Parameter Indicator
L2 Layer 2
L3 Layer 3
LAN Local Area Network
MA Monitoring Agent
MAC Media Access Control
MANO Management and Orchestration
MF Monitoring Framework
ML2 Modular Layer 2
MM Monitoring Manager
NC Network Controller
NF Network Function
NFaaS Network Functions-as-a-Service
NFV Network Functions Virtualisation
NFVI Network Functions Virtualisation Infrastructure
NFVI-PoP NFVI-Point of Presence
NIC Network Interface Cards
NS Network Service

T-NOVA | Deliverable D4.01 Infrastructure Virtualisation
© T-NOVA Consortium
85
NUMA Non-uniform Memory Access
NVGRE Network Virtualisation using Generic Routing Encapsulation
ODCS OpenDOVE Server
ODGW OpenDOVE Gateway
ODL OpenDaylight
ODML OpenDOVE Management Controller
OF OpenFlow
ONF Open Networking Foundation
ONP Open Networking Platform
OPNFV Open Platform for Network Function Virtualisation
OS Operating System
OVSDB Open vSwitch Database Management Protocol
PCIe Peripheral Component Interconnect Express
PF Physical Function
PMD Poll Mode Driver
PPS Packets Per Second
QoS Quality of Service
QPI Quick Path Interconnect
QSFP Quad Small Form-factor Pluggable
OSGi Open Service Gateway initiative
RAM Random Access Memory
REST API Representation State Transfer API
RDMA Remote Direct Memory Access
RFC Request for Comments
RPC Remote Procedure Call
SAN Storage Area Network
SDN Software-Defined Networking
SDK Software Development Kit
SFP Small Form Factor Pluggable
SLA Service Level Agreement
SNMP Simple Network Management Protocol
SoC System on Chip

T-NOVA | Deliverable D4.01 Infrastructure Virtualisation
© T-NOVA Consortium
86
SOTA State-Of-The-Art
SR-IOV Single Root I/O Virtualisation
SSD Solid-State Disk
SW Software
TCAM Ternary Content Addressable Memory
ToR Top of Rack
TNM Transport Network Manager
T-NOVA Network Functions as-a-Service over Virtualised Infrastructures
TXT Trusted Execution Technology
UDP User Datagram Protocol
vApp Virtual Application
VIM Virtualised Infrastructure Manager
VL Virtual Link
VLAN Virtual Local Area Network
VM Virtual Machine
VMDq Virtual Machine Device Queues
VMM Virtual Machine Manager
VMX Virtual Machine Extension
VNF Virtual Network Function
VNFC Virtual Network Function Component
vNode Virtual Node
VPN Virtual Private Network
vNIC Virtual Network Interface Cards
VPN Virtual Private Network
vNS Virtual Network Service
VT-d Virtualisation Technology for Directed I/O
VTEP Virtual Tunnel End Point
VT-x Virtualisation Technology for x86
VTN Virtual Tenant Network
vTunnel Virtual Tunnel
WAN Wide Area Network

T-NOVA | Deliverable D4.01 Infrastructure Virtualisation
© T-NOVA Consortium
87
WP Work Package
XFP 10 Gigabit Small Form Factor Pluggable
XML Extended Markup Language
YAML YAML Ain't Markup Language

T-NOVA | Deliverable D4.01 Infrastructure Virtualisation
© T-NOVA Consortium
88
11. REFERENCES
[1] ETSI, "Network Functions Virtualisation (NFV); NFV Performance & Portability Best Practise, ETSI GS NFV-PER 001 V1.1.1 (2014-06)," ETSI2014.
[2] ETSI, "ETSI GS NFV-TST001 - Network Functions Virtualisation (NFV); Pre-deployment Testing; Report on Validation of NFV Environments and Services (Draft)," in Definition of SUTs, 2015.
[3] S. Bradner and J. McQuaid. (1999). Benchmarking Methodology for Network Interconnect Devices. Available: https://www.ietf.org/rfc/rfc2544.txt
[4] Intel. (2014). Pktgen version 2.7.7 using DPDK-1.7.1. Available: https://github.com/pktgen/Pktgen-DPDK
[5] PUC Rio. (2014). Lua. Available: http://www.lua.org/ [6] University of Calagary. (2014). Libpcap tutorial. Available:
http://wiki.ucalgary.ca/page/Libpcap_tutorial [7] TCPDUMP/Libpcap. (2015). TCPDUMP & Libpcap. Available:
http://www.tcpdump.org/ [8] Wind River. (2014). Pktgen version 2.7.7 using DPDK-1.7.1. Available:
https://github.com/Pktgen/Pktgen-DPDK/ [9] M.-A. Kourtis, G. Xilouris, V. Riccobene, M. J. McGrath, G. Petralia, H.
Koumaras, G. Gardikis, and F. Liberal, "Enhancing VNF Performance by Exploiting SR-IOV and DPDK Packet Processing Acceleration " presented at the IEEE NFV-SDN, San Francisco, USA, 2015.
[10] L. Rizzo, M. Carbone, and G. Catalli, "Transparent acceleration of software packet forwarding using netmap," in INFOCOM, 2012 Proceedings IEEE, 2012, pp. 2471-2479.
[11] N. Sarrar, S. Uhlig, A. Feldmann, R. Sherwood, and X. Huang, "Leveraging Zipf's law for traffic offloading," SIGCOMM Comput. Commun. Rev., vol. 42, pp. 16-22, 2012.
[12] B. Pfaff, J. Pettit, T. Koponen, K. Amidon, M. Casado, and S. Shenker, "Extending Networking into the Virtualization Layer," in Eighth ACM Workshop on Hot Topics in Networks (HOTNETS VIII), New York, USA, 2009.
[13] E. Kohler, R. Morris, B. Chen, J. Jannotti, and M. F. Kaashoek, "The click modular router," ACM Trans. Comput. Syst., vol. 18, pp. 263-297, 2000.
[14] N. Egi, A. Greenhalgh, M. Handley, M. Hoerdt, F. Huici, and L. Mathy, "Towards high performance virtual routers on commodity hardware," presented at the Proceedings of the 2008 ACM CoNEXT Conference, Madrid, Spain, 2008.
[15] Snabb GmbH. (2015). snabb.co. Available: https://www.snabb.co/ [16] Snabbswitch. (2015). Snabb NFV Getting Started Guide. Available:
https://github.com/SnabbCo/snabbswitch/blob/master/src/program/snabbnfv/doc/getting-started.md
[17] Snabbswitch. (2015). Installation. Available: https://github.com/SnabbCo/snabbswitch/blob/master/src/program/snabbnfv/doc/installation.md

T-NOVA | Deliverable D4.01 Infrastructure Virtualisation
© T-NOVA Consortium
89
[18] S. Trimberger, D. Carberry, A. Johnson, and J. Wong, "A time-multiplexed FPGA," in The 5th Annual IEEE Symposium on Field-Programmable Custom Computing Machines 1997, pp. 22-28.
[19] K. Karras and E. S. Manolakos, "An embedded dynamically self-reconfigurable Master-Slaves MPSoC architecture," presented at the International Conference on Field Programmable Logic and Applications (FPL), 2008.
[20] P. Veitch, M. J. McGrath, and V. Bayon, "An instrumentation and analytics framework for optimal and robust NFV deployment," Communications Magazine, IEEE, vol. 53, pp. 126-133, 2015.
[21] University of Waikato. (2015). Weka 3: Data Mining Software in Java. Available: http://www.cs.waikato.ac.nz/ml/weka/
[22] R. Lee. (1991). An Introduction to Workload Characterization. Available: https://support.novell.com/techcenter/articles/ana19910503.html
[23] M. Calzarossa, L. Massari, and D. Tessera, "Workload Characterization Issues and Methodologies," in Performance Evaluation: Origins and Directions. vol. 1769, G. Haring, C. Lindemann, and M. Reiser, Eds., ed: Springer Berlin Heidelberg, 2000, pp. 459-482.
[24] R. Arora and S. Suman, "Comparative Analysis of Classification Algorithms on Different Datasets using WEKA," Internation Journal of Computer Applications, vol. 54, pp. 21-25, 2012.
[25] OPNFV. (2014). Open Platform for NFV. Available: https://www.opnfv.org/