
T.N. FORRESTER · the Tiros Operational Vertical sounder (TOVS) and the Advanced Very High...
60
James Rennell Centre Remote Sensing Group Informal note no:1 WOCE A REVIEW OF AVHRR PROCESSING SYSTEMS FOR U.K. WOCE by T.N. FORRESTER ^/larch 1991 James Rennell Centre for Ocean Circulation
Transcript of T.N. FORRESTER · the Tiros Operational Vertical sounder (TOVS) and the Advanced Very High...

James Rennell Centre Remote Sensing Group Informal note no:1
WOCE
A REVIEW OF AVHRR PROCESSING SYSTEMS FOR U.K. WOCE
by
T.N. FORRESTER
^/larch 1991
James Rennell Centre for Ocean Circulation

EXECUTIVE SUMMARY
The World Ocean Circulation Experiment (WOCE) not only involves new and novel scientific techniques to fulfil its objectives, but also great efforts in international and national cooperation/collaboration are required. In early 1990 the James Rennell Centre for Ocean Circulation (JRC) was established to direct and coordinate research for U.K. WOCE and it was with this spirit of "WOCE collaboration" in mind that the remote sensing group of the JRC undertook this review.
The Advanced Very High Resolution Radiometers (AVHRR) on board the TIROS-N series of operational satellites have been sensing Sea Surface Temperature (SST) signatures on an operational basis since 1978. In early 1991 the European Space Agency's Remote sensing Satellite (ERS-1) will be launched, carrying the Along Track Scanning Radiometer (ATSR). Together these different instruments could provide the coverage and accuracy of SST measurements required by WOCE.
At present no national policy in the processing of AVHRR data exists, instead various institutions have developed their own in-house systems. It was the task of this review to determine if an existing processing system was currently available and capable of combining both AVHRR and ATSR data, as well as meeting the standards applicable for use by various U.K. WOCE participants.
Seven AVHRR processing systems (APSs) were reviewed. Three of them were restricted by their incompatibility with UNIX based computer environments (the UNIX environment is supported by a wide range of computers, and as such offers the greatest flexibility when considering other users). Two of the three, i.e. the AVHRR(SU) system of the University of Southampton and the I^S/SBOO of the NERC Image Analysis Unit at Plymouth Polytechnic could not realistically be adapted to run on different hardware owing to their complex integration with system specific software. The third system (APOLLO) of the U.K. Meteorological Office is a flexible package designed specifically for meteorological research, it has some very useful programs and is designed in a modular fashion, without many system specific input/output commands. However it has become out dated and lacks both the user friendliness and sophistication of other systems.
Two other systems. I.e. the system of the NERC satellite ground receiving station at Dundee and the "SHARK" system of the European Space Agency (ESA) will not be fully operational until at least 1992-3. Both of these systems are designed for routine processing of AVHRR land, sea and ice data, and will provide a range of high level products products to a wide variety of users.
The "SEDAS" system of the Royal Aircraft Establishment is a fully operational fairly sophisticated system, but will not be UNIX compatible until 1992, also its availability to other users is in doubt.
Finally the "DSP" AVHRR and CZCS (Coastal Zone Colour Scanner) processing system of the University of Miami is the most comprehensive, accurate, sophisticated and user friendly system that was reviewed. It is sold on a yearly contract basis, which provides for a fully maintained system. The system operates on UNIX and VAX based computers. It is capable of processing all the major AVHRR acquisition data formats that are provided by the National Oceanic and Atmospheric Administration (NOAA), who operate the TIROS-N series of satellites.
After the survey of individual AVHRR processing systems in this report, the relevant options as well as cost and regional issues are discussed, resulting in the conclusion that the DSP Miami system was the best available to meet the requirements of U.K. WOCE. This choice not only satisfies a national spirit of collaboration, but also an

international one, since DSP is the major AVHRR processing system within the U.S.A. and as such within U.S. WOCE.
It is the recommendations of this report that the JRC should purchase a U.K. licence for the DSP Miami system, and that a copy of the system should be distributed amongst interested U.K. WOCE participants. It is also recommended that the JRC obtains the APOLLO system (free of charge), in order to make use of some excellent meteorological and ephemeral programs. Finally it is recommended that the JRC becomes increasingly involved with ESA with respect to SST research, and should also gain access to ESA's Earthnet Centralised TIROS Catalogue. This catalogue will give U.K. WOCE access to AVHRR data from a variety of European receiving stations. Combined with the near global coverage that the DSP system will give access to, U.K. WOCE will have a powerful tool with which to help carry out its huge task of surveying and simulating the global circulation of the worlds oceans.

CONTENTS
Chapter 1 1.1
Chapter 2 2.1 2.2
Chapter 3 3.1 3.2 3.3
Introduction Background
3.4
3.5
3.6
3.7
3.8
Introduction to NOAA satellites 3 The Advanced Very High Resolution Radiometer 3 Signal and CCT AVHRR Data Format 6
Review of AVHRR Processing Schemes 8 introduction 8 Processing Steps 8 APOLLO AVHRR Processing System 1 1 3.3.1 Reading CCTs 1 2
Calibration 12 Geolocation 13 Cloud Detection 1 4 Atmospheric Correction 1 5 Applications 16 Discussion 16
Southampton University's AVHRR Processing System 17 SLdl.l Fieiacjiiig (;()irs 11f
Boundary Delineation 1 7 Geolocation 18 Specif ications 18 AVHRR3and AVHRR4 19 Discussion 19
I^S/System 600 AVHRR Processing System 20 3.5.1 Tape/AVHRR 20 3.5.2 AVHRR/MCSST 21 3.5.3 AVHRR Navigate 21 3.5.4 Discussion 22 AVHRR Processing System (Dundee) 24 3.6.1 Discussion 24 DSP AVHRR Processing System 25 3.7.1 Reading and Unpacking Raw Data 25
Geolocation 26 Extraction 2 7 Sector, Atmospheric Correction and Remap (SAR) 27 Image Processing 28 Discussion 31
SHARK AVHRR Processing System 33 3.8.1 Discussion 3 5
3.3.2 3.3.3 3.3.4 3.3.5 3.3.6 3.3.7
3.4.2 3.4.3 3.4.4 3.4.5 3.4.6
3.7.2 3.7.3 3.7.4
3.7.5 3.7.6

3.9 SEDAS AVHRR Processing System 3.9.1 Discussion
36 37
Chapter 4 Discussion of AVHRR Processing 4.1 Introduction 4.2 Possible Options 4.3 Cost Issues 4.4 Regional Issues 4.5 Views of other U.K. AVHRR Users 4.6 Summary 4.7 Conclusion
^sues 38 38 38 40 41 42 43 44
Chapter 5 References Appendix A Appendix B Appendix C Appendix D
46 48 49 50 53
GLOSSARY
APOLLO - AVHRR Processing Over Land cLoud and Ocean APS - AVHRR Processing System APT - Automatic Picture Transmission ATN - Advanced TIROS-NOAA satellite ATSR - Along Track Scanning Radiometer AVHRR - Advanced Very High Resolution Radiometer CCT - Computer Compatible Tape CDA - Command and Data Acquisition CZCS - Coastal Zone Colour Scanner DN - Digital number DSP - (short for Display) the Miami University's APS ERS1 - European Remote Sensing Satellite number 1 ESA - European Space Agency GAC - Global area Coverage GTS - Global Telecommunications System HRPT - High Resolution Picture Transmission lOSDL - Institute of Oceanographic sciences Deacon
laboratory IPS - Image Processing Software ITOS - Improved TIROS Operational Satellite JRC - James Rennell Centre for Ocean Circulation LAC - Local Area Coverage LUT - Look Up Table NERC - National Environmental Research Council NESDIS - National Environmental Satellite Data and
Information Service NOAA - National Oceanic and Atmospheric Administration RAE - Royal Aircraft Establishment (Farnborough) RAL - Rutherford Appleton Laboratory SEDA - Satellite Environmental Data Acquisition System SHARK - Station Archiving Reprocessing Kernel SST - Sea Surface Temperature TIROS - Television Infra Red Observational Satellite TOS - TIROS Operational Satellite TOVS - TIROS Operational Vertical Sounder U.K. WOCE - United Kingdom World Ocean Circulation
Experiment

Chapter 1: Introduction
The purpose of this report is to review some of the available AVHRR Processing Schemes (APS), discuss the relevant issues, and put forward recommendations for a strategy of AVHRR data handling and processing at the James Rennell Centre for Ocean Circulation. During the course of this report the following institutes were visited and principal APS users consulted:
a) A visit to the NERC lA unit at Plymouth. b) A visit to the Dundee satellite receiving station. c) A visit to the Earthnet Program Office in Frascati (Italy). d) A visit to Telespazio in Rome. e) Communication with APS users and developers including:
- E. P McClain at NOAA/NESDIS (Washington DC) - S. Groom at the NERC lA unit (Plymouth) - R. Saunders at RAE (Farnborough) - I. Robinson at the University of Southampton - L. Fusco at the Earthnet Program office (Frascati) - S. Marullo at Telespazio (Rome) - J. Mathews at the University of North Wales (Bangor) - P. Mather at the University of Nottingham - K. Heywood at the Uiniversity of East Anglia - R. Evans at the University of Miami - A. Kite at Software Sciences Ltd
1.1 Background
The James Rennell Centre for Ocean Circulation (JRC) was established in 1990 as a subgroup of the Institute of Oceanographic Sciences Deacon Laboratory (lOSDL). Its main goals are to conduct as well as co-ordinate research of other U.K. institutions, as part of U.K's contribution to the World Ocean Circulation Experiment (U.K. WOCE).
In order to fulfil the remote sensing requirements of U.K. WOCE the satellite team (formerly based at lOSDL) has been expanded and transferred to JRC. Remotely sensed sea surface temperature (SST) data are part of these requirements and are measured in the Infrared part of the electromagnetic spectrum. This requires different skills than those previously used by the team, which in the past has concentrated on parameters measured at microwave frequencies.

One of the first operational requirements of this new work is to produce a strategy for obtaining and processing SST data derived from the TIROS/NOAA series of satellites, as measured by the Advanced Very High Resolution Radiometer (AVHRR). The investigation of this issue has involved the familiarisation of remote sensed SST retrieval techniques and the development of working relationships with the AVHRR user community.
Technical issues covering some AVHRR Processing Systems (APS's) were presented to the JRC satellite team on 11th January 1991.

Chapter 2: Introduction To NOAA Satellites
The first series of ten experimental Earth viewing satellites began in 1960 with TIROS (Television Infra Red Observational Satellite) and ending in 1965. This led to the weather series of TIROS Operational Satellites (TOS) between 1966 and 1969. In 1970 the Improved TIROS operational satellite (ITOS) series started, the series was later renamed after it was taken over by the National Oceanic and Atmospheric Administration (NOAA). Since 1970 the series has been generally known as the TIROS-NOAA series. The current series being known as the Advanced TIROS-N (ATM) series has been in continuous operation since 1978. When the satellites are in their commissioning phase they are known as ITOS-A... and when fully operation NOAA-1..., the latest operational satell i te is NOAA-11. The National Environmental Satellite Data and Information Service (NESDIS) is the wing of NOAA which runs the day to day operation of the series.
The configuration consists of two near polar orbiting satellites (height ca 855km), with one crossing the equator at local solar times of approximately 0730 and 1930, and the other at 0230 and 1430. The even numbered satellites cover the morning orbit and the odd numbered ones cover the afternoon orbit (presently NOAA-10 and NOAA-11). The NOAA series was designed primarily for meteorological applications and its two principle payloads are the Tiros Operational Vertical sounder (TOVS) and the Advanced Very High Resolution Radiometer (AVHRR).
2.1 The Advanced Very High Resolution Radiometer
The current version (AVHRR/2) is a 5 channel passive scanning radiometer:-
channel description wavelength (fim) 1 visible 0.58-0.68 2 visible 0.73-1.1 39 Infra Red 3.55-3.93 4 Infra Red 0.3-11.3 5b Infra Red 1.5-12.5
a On NOAA 11 and thereafter there are two channel 3 bands; 3.55jim-3.93^m (night time) and 157}xm-1.78)xm (day time).
b On NOAA 6,8 and 10, channel 4 for is substituted for channel 5.
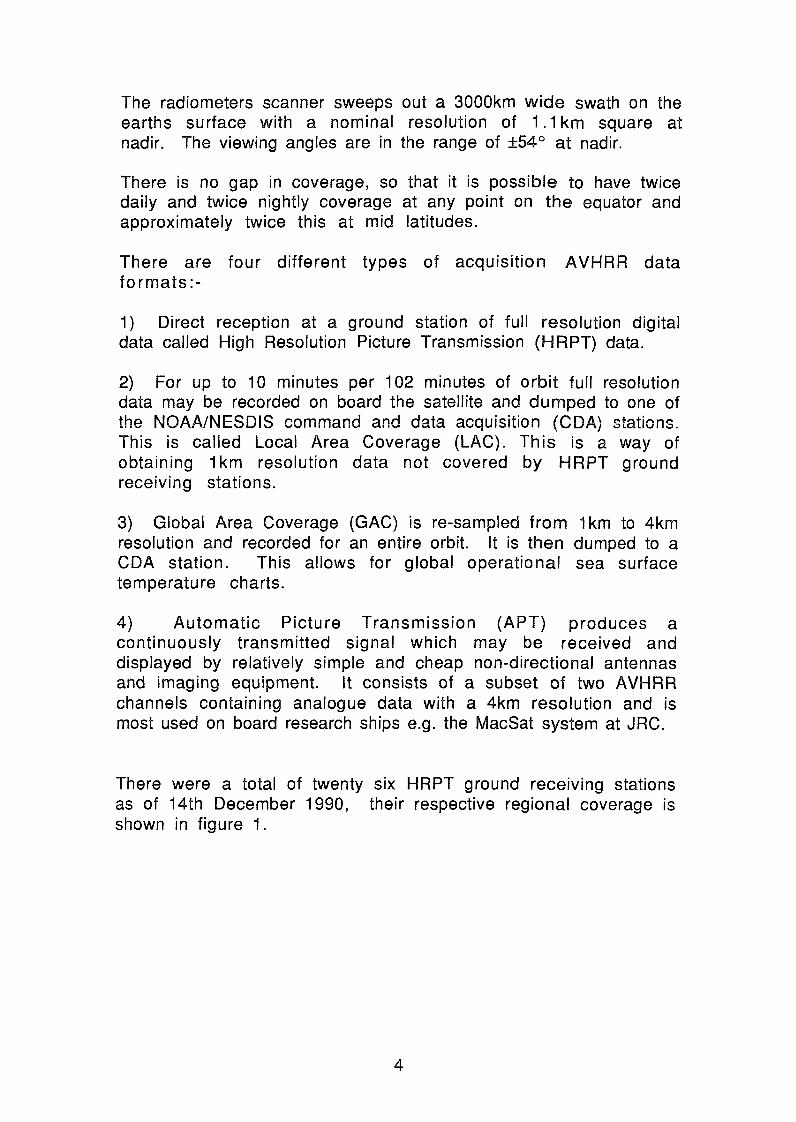
The radiometers scanner sweeps out a 3000km wide swath on the earths surface with a nominal resolution of 1.1 km square at nadir. The viewing angles are in the range of ±54° at nadir.
There is no gap in coverage, so that it is possible to have twice daily and twice nightly coverage at any point on the equator and approximately twice this at mid latitudes.
There are four different types of acquisition AVHRR data formats:-
1) Direct reception at a ground station of full resolution digital data called High Resolution Picture Transmission (HRPT) data.
2) For up to 10 minutes per 102 minutes of orbit full resolution data may be recorded on board the satellite and dumped to one of the NOAA/NESDIS command and data acquisition (CDA) stations. This is called Local Area Coverage (LAC). This is a way of obtaining 1 km resolution data not covered by HRPT ground receiving stations.
3) Global Area Coverage (GAC) is re-sampled from 1km to 4km resolution and recorded for an entire orbit. It is then dumped to a CDA station. This allows for global operational sea surface temperature charts.
4) Automatic Picture Transmission (APT) produces a continuously transmitted signal which may be received and displayed by relatively simple and cheap non-directional antennas and imaging equipment. It consists of a subset of two AVHRR channels containing analogue data with a 4km resolution and is most used on board research ships e.g. the MacSat system at JRC.
There were a total of twenty six HRPT ground receiving stations as of 14th December 1990, their respective regional coverage is shown in figure 1.

Figure 1; HRPT ground receiving stations of the world, and their area of coverage. Prince Albert, Siux Falls, Downsview, Miami, Cachoeira Paulista, Fortaleza, Santiago,O'Higgins, Terranova Bay, Syowa, Tromso, Dundee, Rome, Niamey, Nairobi, La Reunion, Hartebeesthoek, Maspalomas, Beijing, Kiyose, Dhaka, Manila, Selangor, Townsville, Perth, Hobart
cn

2.2 Signal and CCT AVHRR Data Format
The AVHRR data on board the satellite is coded into 10 bit words, this signal format is received at satellite ground stations and converted into 8 bit word format, thereby producing computer compatible tapes (CCT) of raw HRPT data. It is these CCT's that are read into AVHRR Processing Systems. The format of CCT's from various ground receiving stations differs slightly, e g Lannion (France) HRPT format differs from that of Dundee (U.K.), also LAC, GAC and HRPT have different formats from each other. Thus different programs are needed to read each format.
The AVHRR HRPT data as received at the Dundee station consists of major frames of 11,090 10 bit binary words. One major frame corresponds to one AVHRR scan line and contains data for all five channels plus other data added at the start of the frame (figure 2). After ten 10 bit words containing all zeros are added by the CCT interface, all 10 bit words are translated into 8 bit words and one Major Frame is equivalent to four Minor Frames.
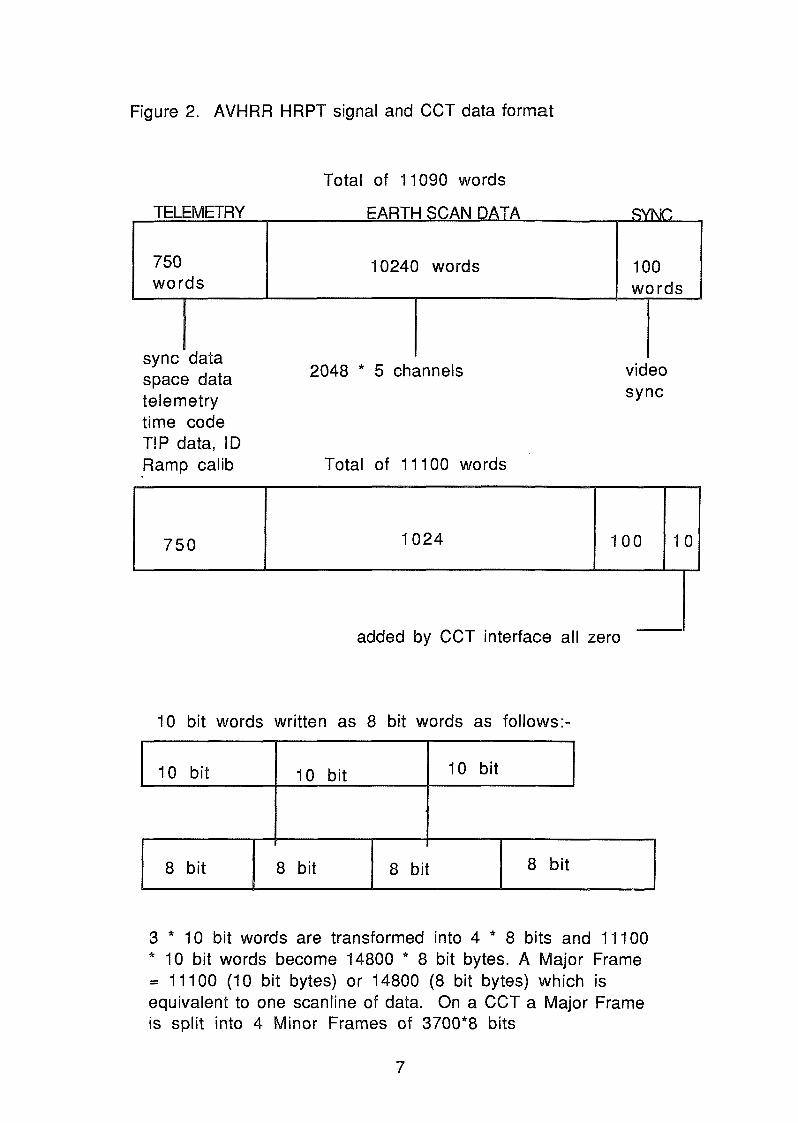
Figure 2. AVHRR HRPT signal and CCT data format
TELEIVIEIRY
Total of 11090 words
750 10240 words
u: # yw
100 words words
sync data space data telemetry time code TIP data, ID Ramp calib
2048 * 5 channels
Total of 11100 words
video sync
750 1024 100 1 0
added by CCT interface all zero
10 bit words written as 8 bit words as follows:
10 kiit 10 bit 10 bK
8 bK 8 bK 8 bM 8 bK
3 * 10 bit words are transformed into 4 * 8 bits and 11100 * 10 bit words become 14800 * 8 bit bytes. A Major Frame = 11100 (10 bit bytes) or 14800 (8 bit bytes) which is equivalent to one scanline of data. On a CCT a Major Frame is split into 4 Minor Frames of 3700*8 bits

Chapter 3: Review of AVHRR Processing Schemes
3.1 Introduction
It is apparent that a great many AVHRR processing Schemes (APS's) exist, it has not been possible or desirable to see all of them at first hand, for example a great many probably exist in the U.S.A. Most of them are related to a few original schemes. The criteria behind choosing an existing scheme is to save "re-inventing the wheel", so that as well as looking for the best attributes in a system, emphasis was put on a system capable of operating on a (SUNOS) UNIX environment or designed such that little re-programming was needed to achieve this.
3.2 Processing Steps
The task of an APS is to transform raw satellite data into a final product, useful for scientific analysis e.g. a digital data file or a map of a geophysical field i.e. SST. For time series analysis the data needs to be in sets of earth located, earth gridded, co-registered fields of geophysical data. This allows the sensor voltages to be transformed into geophysical units and mapped in such a way that scenes viewed from different satellite orbits can be compared in the same scale and projection.
There are seven processing steps within an APS e.g;-1) Read in HRPT data 2) Calibration 3) Geolocation/Navigation 4) Land/cloud mask 5) Geophysical conversion 6) Remapping/image processing 7) Statistical applications
In different APS's these processes are not always separated, in the same order, or all present, and there are different methods of achieving them. This is not the correct place to review the theoretical derivation of the algorithms involved, instead emphasis is placed on how these methods are applied. Duplication is kept to a minimum by only describing procedures relative to this investigation, and this criterion was used when deciding which steps to elaborate on.
Once the data is in the form of a digital data matrix of geolocated geophysical units, it may be further processed by image processing or statistical analysis techniques.
8

There are many different makes of commercial image processing software (IPS) packages, which are utilised in AVHRR processing systems. The choice of which one to use often depends on ephemeral constraints e.g. cost, or hardware compatibility, even personal choice, but they all tend to carry out similar processing tasks. Different image processing packages require different input/output commands and some APS's limit these "package specific" commands to a few programs, while others are designed around the IPS, thus making it a complicated task to adapt the APS to operate on a new computer environment. Where the latter is true this report does not dwell on the image processing capabilities of the system unless the IPS used is compatible with the SUNOS environment and is likely to be acquired by the JRC.
A list of the APS's known to this investigation are given in table 1.

Table 1. AVHRR processing systems known to this review
NAME INSTITUTE HARDWARE APPLICATION APOLLO U.K. Met Office VAX/VMS,
HERMES/HOMER Meteorological Research
AVHRR (SU) University of Southampton
IBM mainframe, PC
Coastal SST
Dundee Dundee sat receiving stn
SUNOS/UNIX Routine processing
I2S/S600 (NIAU)
NERC lA Unit Micro-VAX CZCS, AVHRR
DSP University of Miami
UNIX & VAX Commercial package
SEDAS MOD/NRSC/RAE PRIME Defence/Met SHARK ESRIN (Italy) SUN Service DSPb Telespazio
(Italy) Micro-VAX SST, CZCS
APOLLOa RAE VAX/VMS HERMES/HOMER
Met Res
APOLLOa RAL VAX/VMS HERMES/HOMER
ATSR SST Res
APOLLOa Edinburgh University
VAX/VMS Met Res
APOLLOa DFVLR (Gennany)
Met Res
APOLLOa University of Nottingham
VAX/VMS General Res
APOLLOa BAS VAX Polar Met. res I2S/S600 (NIAU)
University of Bangor
VAX Shelf seas research
a Derived from the original APOLLO system
1 0

3.3 APOLLO AVHRR Processing System
The APOLLO (AVHRR Processing Over Land cloud and Ocean) suite of programs was developed over a number of years on the HERMES/HOMER VAX11/750 computers at the U.K. Meteorological Office (Robert Hooke Institute for Cooperat ive Atmospheric Research) by R.W. Saunders and R.W. Pescod. The system is no longer supported by the Met. Office but a number of applied versions exist in different institutes (table 1). The aim was to provide an automated system to derive sur face and cloud parameters from raw 1.1km AVHRR data, with emphasis on a flexible system for research purposes. There are a total of twenty nine programs (Appendix A) of which about eight or nine are used for general purposes. Very few of the programs are linked to image processing software or unformatted files thus making the system relatively easy to rewrite, so that it operates on different hardware.
An overview of an APOLLO SST processing scheme for ascending pass is given below. NB. The boxes are programs and the arrows are files read or written by each processing step;-
CaljJj file
HRPT TAPE
AVHIN
I I I I Cte 1,2,4,5
AVHCAL
V I I I | = h s
AVHEDC l<-
Locat file V V
,->! RTQAIB
V i 4 V V
CODUD Cloud
. mask
i 4 V
DCnXJDM-
l i I TIOST I
Sea surface teoiperature image
Read in image channels required + calibration file from t^je for area of interest
Calibrates raw image data into hr.taips or normalised reflectance
Corrpites location file for images.
Corrpite TOA reflectance from reflectance.
Computes cloud uosk-for cloudfree and fully cloudy pixels.
Channel 4 brightness term image decloudsd (all cloudy pixels set to zero)
Cgncutes surface term from split winocw method
1 1

3.3.1 Reading CCT's
Several programs are available for this task, the choice depends on the format of the raw data i.e. Dundee format, LAC or GAC format etc.
Step 1: Defining the area of interest. There are two methods, the first is slower but is used when quick looks are not provided with the data. Here, the user defines the area of interest by specifying a lat/long for the centre of the image, and image size in lines and columns (this can be a trial and error exercise). The second method is faster and applicable to Dundee formatted tapes where a quick look is provided. The user specifies the starting line and column as well as the number of line and columns for the area required within the whole pass. It is useful to have a predetermined linear scale to match up with the quick look for this task. This is because the quick looks from Dundee have had the ends of the scan lines corrected for the geometric distortion due to earths curvature, unlike the raw data on the CCT.
Step 2: Choice of spectral channels may depend on several factors, for example, if a cloud mask is required channels 1, 2, 4 and 5 are required for the day time passes and channels 3, 4 and 5 for night time passes (N.B. for NOAA's 6, 8 &10 channel 5 is substituted by channel 4). Other factors include the amount of available memory, each channel will produce a 1024*1024 pixel image which requires about 2.1 Mb of memory on a VAX11/750.
Step 3 The lines are written to disk in equal time intervals, thus if there are missing or corrupt lines the program inserts extra lines (nearest neighbour) into the image file to ensure that it is continuous in time. After extracting the required area and spectral channels from the overpass, the data are written on disk as a standard image file, and can then be displayed and manipulated using image processing software.
3.3.2 Calibration
This involves the conversion of count numbers into physical properties e.g. radiance or brightness temperatures. All systems use the basic procedure as recommended by NOAA/NESDIS (Lauritson et a I, 1979). Calibration of visible channels is separate because there is no on board calibration, so pre-flight gain and intercept are used.
1 2

The visible counts are converted into radiance normalised over the filter response function. These normalised radiance can be converted to bidirectional reflectance (i.e. the reflectance as viewed from space) using the program ROTALB.
The calibration file which was created by the previous program (e.g. AVHIN) is used, it contains black body temperature and space counts for the infrared calibration and the times of each scan line.
Infrared bands are calibrated in two steps, f irstly the count numbers are converted into radiance and then the radiances are converted to brightness temperature.
A linear relationship between counts and radiance is generally applied, this does not hold for channels 4 and 5, so a non-linearity correction is applied as described by Brown, et al (1985). More recently Weinreb, ef a/ (1990) have proposed a new correction procedure.
The relationship between radiance and brightness temperature can be given by inverting the Planck function using a central frequency (wave number) for each channel (Kidwell, 1985) or by using a look up table (LUT) relating the two parameters.
The LUT's for each instrument have been calculated by NOAA/NESDIS by computing the integrated radiance over the filter response function for a range of di f ferent scene temperatures using the Plank function and re-sampling the table to enable brightness temperature to be obtained from a given radiance. The first procedure is less accurate because the central frequency varies with temperature. The second procedure is not only more accurate but quicker in CPU time and is incorporated into the later versions of APOLLO.
3.3.3 Geolocatlon
Geolocation is the determination and adjustment of the mapping from line/pixel (image) space to lat/long space. This process needs to be as accurate as possible because any further remapping (i.e. on to a particular projection) of the image will carry the navigation errors with it. Theoretically the mapping can be determined mathematically using an orbital model, which uses orbital elements of the satellite (e.g. satellite and sensor lime and aHKude data).
1 3

The attitude (roll and pitch) parameters of the satellite are usually supplied daily by NOAA/NESDIS (over the Global Telecommunications System), these are a subset of the orbital data stream obtained from the U.S. military and are called TBUS data. Errors in both the attitude parameters and the satellite clock mean that such orbital models only provide a rough estimate, and further processing is needed.
In APOLLO an orbital model using TBUS data is used within the geolocation program (AVHLOC). Knowing the sub-satellite point (in lat and long) at a given time the model predicts lat/long values along a scan line. To save memory space the positions for every thirty second line and column only are stored in a location file, allowing any intermediate positions to be interpolated from each 32*32 grid if and when needed. The program COAST (containing a map of the world's coastline) is then run over the image displayed on the screen, errors in the geolocation can be determined by scrolling the coastline up or down beneath the image until they match up. The offsets in the along track (time) and cross track (attitude) direction are displayed on the screen. AVHLOC can then be rerun with these offsets to create a location file accurate to ±2km.
3.3.4 Cloud Detection
For the purposes of obtaining a SST field cloudy pixels need to be masked, the masking procedure (DCLOUD) is separated from the detection procedure (CLOUD), so that cloud radiances can be obtained if required. The literature abounds with different de-clouding techniques, however when it comes to automating a system compromises in resolution are often made The procedure employed in APOLLO is the combination of three separate techniques and is called the Spatial Coherence Visible (SCV) algorithm (Saunders 1986). Better algorithms have since been published e.g. Saunders and Kriebel (1988), McClain, et al (1990), including an algorithm with sub pixel resolution (Simpson and Humphrey, 1990).
The program CLOUD requires that brightness temperature thresholds over land and sea have to be input on the terminal for a gross cloud check. These temperatures are obtained from the channel 4 image during the running of the geolocation program AVHPOS. The DCLOUD program zeros all cloudy pixels thereby giving them a black mask.
1 4

3.3.5 Atmospheric Correction
This is perhaps the most varying of all procedures amongst different APS's. In general the NOAA Multi-Channel Sea Surface Temperature (MCSST) algorithms are used: McClain, (1985), McMillin and Crosby, (1984). The coefficients for these algorithms may come from NOAA themselves e.g. NOAA/NESDIS (1982) or from other sources. The coefficients for the NOAA algorithms are obtained for each instrument by regressing the brightness temperatures of the various channels on buoy derived SST data, using over 100 match up buoys from the North and South Atlantic, the northeastern and tropical North Pacific, the sub-tropical and mid latitude South Pacific and the Indian Ocean. The algorithms used in APOLLO are taken from Llewellyn Jones et al, (1984) (usually known as the "RAL algorithms" after the Rutherford Appleton Laboratory) and the coeff icients are optimised for the North East Atlantic. There are single, dual, split and triple window linear algorithms depending on which channels are being used. "Windows" refers to the range of infrared wavelengths of each channel. These channels are used because there is least atmospheric interference in these "windows" within the infra red spectrum as a whole. The appropriate algorithm depends on which channels a particular satellite's AVHRR is using and whether the pass is day or night time.
The channel 3 window suffers from solar back scatter contamination during the day, so here, only split (chs 4/5) window algorithms are used and at night the triple (chs 3/4/5) or dual (chs 3/4) window algorithms are used. More recently non-linear algorithms have been developed (McClain et al, 1990).
Comparison of the radiances from different channels allows the atmospheric correction to be derived, but at the same time the resultant SST has the combined noise of two or more channels, thereby giving a less accurate measurement. Hence the new passive radiometer which is on board the European Space Agency's Remote-sensing Satellite, the ERS1 i.e. the Along Track Scanning Radiometer (ATSR). This instrument will measure the radiance in one window, but over two different path lengths through the atmosphere and so enabling an atmospheric correction value with only the noise of one channel incorporated in it to be derived.
15

3.3.6 Applications
Once a SST image has been produced there is a suite of programs which allows certain applications to be performed, these are given in the complete list of APOLLO programs shown in appendix A, and include features such as the rotation of an image through 180 degrees (otherwise images of descending passes appear upside down), the joining together of images or calibration files, the removal of distortion at the edges of scan lines due to the earth's curvature, and the creation of a calibration LUT for new satel l i tes.
3.3.7 Discussion
APOLLO is used widely throughout the AVHRR community in Europe. It has not been maintained since 1988 and as such suffers from the use of out of datetechniques. It is a relatively lengthy business to process a scene because each program is separate and user controlled. However, while this makes it less useful as a purely applications tool, it does make it a good research system, allowing many different programs to be slotted in. The system is written in Fortran 77 and has few image processing commands, so can be easily re-written. Obviously it is best suited to run on a VAX system, but is possibly the easiest APS to rewrite to run on a new system. It is offered at a nominal price to research institutions, in fact many institutions have just acquired a few of the programs to slot into their own APS e.g. Nottingham University.
1 6

3.4 Southampton University's AVHRR Processing System
The APS at the University of Southampton uses an IBM mainframe computer, which is now being re-written to operate on IBM compatible Personal Computers (PC's). It was developed in the university's Oceanography department by N. Ward. The principles behind the two versions are similar, but the new one is more user friendly and faster to operate. The aim behind producing the system was to develop a geolocation model which did not rely on any orbital element information (i.e. TBUS data) and to have a system suited to the hardware constraints imposed on the department. The main applications are for coastal SST fields.
The system is composed of 4 programs: AVHRR1 to 4, which are summarised below;-
AVHRR 1
3.4.1 Reading CCT's
Only Dundee format HRPT CCT's are accepted, the selected area within a pass (given by line and column numbers) is read and the calibration data is written to a file.
3.4.2 Boundary deiineation
Normally channel 4 is selected to set the threshold values between land, cloud and sea. A series of questions are answered by the user in order that a 3 dimensional plot (which is displayed in two dimensions) is generated, where X=sensor count number, Y= scan line number, Z=frequency of the count within each scan line. Thereby using the count frequency distribution as a crude display of the temperature histogram. Usually two distinct peaks within the histogram appear (for night time passes) running north-south across the plot. The left hand peak corresponds to the lower counts (i.e. lower temperatures) of the land and to the right of the second peak are the higher count frequencies of the cloud (which is colder). Obviously this convention does not always hold, often the land may be warmer than the sea or the two may be indistinguishable from each other. The upper and lower count values of the region determined as sea are then input at the terminal and a rough plot of the area delimiting land, cloud and sea is generated.
1 7

3.4.3 Geolocation
The width of the image area required is measured from a quick look and input in millimetres. A cloud free single point showing a clear coastline feature is identified on the image and its co-ordinates (lat/long) are retrieved from a LUT or an atlas, the position, in terms of scan line and column number of the feature are also read. This procedure is repeated for four ground control points (GCP's). The geolocation model then works backward, given the time corresponding to each count number/control point (from the calibration file) and its lat/long position, corresponding orbital parameters are simulated. This is done for each set of latitudes and longitudes, then the four different sets of orbital parameters derived in this way are themselves compared statistically and a residual mean square (rms) value is output to the screen. Once this procedure is complete the image has been roughly geolocated. A similar procedure is again carried out, but with at least a further ten GCP's. These are chosen to cover as much of the image area as possible. Once they have been selected the rms value incorporating all the GCP's is given and the user can go back to each ground control point in turn and reposition the GCP in an attempt to get the rms value down to a minimum. Once this has been achieved the image is earth located. Where there is a good choice of GCP's i.e a coastal region on a clear day/night then theoretically an accuracy of ±1 km is achieved.
AVHRR 2
3.4.4 Specifications
This program asks the user to choose amongst certain options e.g:-1) Fixed area code, this allows overlays of different images of
the same area to be achieved. 2) A choice between a 512*512 or a 64*64 image size. 3) Area Scale factor (1,2 or 4), this determines how much of the
image you want displayed, 1 is the smallest and gives the best resolution and 4 the largest with the least resolution.
4) Central location (lat/long) of the required image. 5) Selection of cloud removal algorithms depending on which
channels are used. 6) Global/local correction: the GCP's over the original input
image can be used when geolocating a sub-image, alternatively just those GCP's within the sub-image can be used.
7) Option to calibrate the data or not
1 8

8) Choice of the NOAA or RAL MCSST algorithms. 9) Option to mask out cloudy pixels or not. 10) Option for a contour plot of SST to be generated. 11) Option for a temperature scale to be generated. 1 2) Option for a set of grid marks to be overlaid on the image. 1 3) Select which channels to be processed. 14) Enter lowest expected temperature (to set the temperature
scales).
3.4.5 AVHRR 3 and AVHRR 4
AVHRR 3 implements AVHRR 2, and does not require any user input. AVHRR 4 allows SST data from a ships track to be compared with the corresponding AVHRR SST data, out/putting the results to a data file.
3.4.6 Discussion
The method for geolocation used in this system is even more subjective than the previous technique described above. This is because individual coastal features (GCP's) have to be picked out and compared to an atlas to obtain a lat/long position, unlike the APOLLO method where the position of the coastline is already known. This probably leads to an accuracy which is less than the theoretical one of ±1 km for this method. The new APS version cuts this error down by making use of a mouse "click" system, and the whole process is speeded up by having all the GCP areas appearing on the screen simultaneously as sub-images. The program uses up minimal CPU time and computer memory, so that the system can run on PC's. It is best suited for coastal work, where many GCP sites are available. Further manipulation of the SST image can be carried out by applying any of a number of image processing packages. The original version is written in Fortran 77 and the new one in "C", however they are not well documented or commented (since the system is purely "in house") and as such would not be very good as a source code to adapt for different hardware.
1 9

3.5 |2S/System 600 (NIAU) AVHRR Processing System
This system was developed at the National Environmental Research Council Image Analysis Unit (NERC lA unit) situated at Polytechnic South West, by S. Groom. It has been developed to process AVHRR and Coastal Zone Colour Scanner (CZCS) data. The same system is extensively used at the University of North Wales Bangor and is maintained by Steven Groom. It runs on a Micro-Vax computer and utilises the I^S/System 600 image processing software. There are three programs, the last of which is extensively integrated into the image processing software.
3.5.1 Tape/AVHRR
This program reads and unpacks the HRPT Dundee data from a CCT and generates an image.
Steps: -1) Reads Dundee format HRPT data. The area is selected from the quick look and given in terms of the first line and column and the total number of lines and columns. The complete width (2048 pixels) of the pass and up to 512 scan lines can be read. Missing or corrupt data may not be ignored.
2) All 5 bands can be selected and an I^S/SGOO short integer image can be generated for each band.
3) Data is read South to North, so a descending pass is automatically rotated. Certain modifiers have been incorporated e.g. if NOAA 11 is specified TAPE/AVHHR will cope with new Dundee format (introduced in 1990).
4) Infrared calibration data (channels 3,4 & 5) are read and stored on the header. Visible band data (channels 1 & 2) are calibrated using the standard NOAA method (Lauritson et al 1979) The orbit number is also used to perform a calibration correction to the visible channels owing to degradation of sensitivity with time. This results in a given radiance producing a lower Digital Number (DN) value later in the sensor's life. The NOAA model relates orbit number with the amount of degradation.
20

3.5.2 AVHRR/MCSST
This program uses the infrared calibration data stored in the header from the previous program and produces SST values. There are two versions, one scales the SST output between 0 and 25°C and the other between -5 and 15°C, i.e. the image processing software is used to contrast stretch these range of values between the 256 (0 to 255) digital levels available.
The NOAA day time (split window) MCSST algorithms using channels 4 and 5 of the AVHRR instruments on NOAA7, 9 and 11 are used to retrieve SST values.
3.5.3 AVHRR/NAVIGATE
A simple and fast orbital model requiring TBUS (orbital element data) only once a month is used. The model assumes a spherical Earth and circular orbit and takes into account effects due to the rotation of Earth, oblateness and scan skew. Inputs into the model are the ascending nodal longitude and time (TBUS derived) and the position of one GCP. The GCP information is used to modify the satellite altitude and inclination angle, thereby correcting for an ellipsoidal Earth and elliptical orbit. An appropriate prominent coastal feature is selected using a mouse and the lat/long coordinates are imputed into the terminal. This model gives an accuracy on average of plus or minus 1.5 km.
Then using the image processing software the image is re-sampled from the spacecraft projection and remapped using bilinear interpolation, which assumes a linear gradient of the pixel values between pixel centres on the original grid.
A map of the coastline is generated (from a global bathymetric data base) and laid over the image, to see the accuracy of the geolocation.
A cloud mask is generated simply by using the visible channels and selecting threshold values from the image. The cloudy pixels can then be set to zero, these values are then transferred across to the SST image, so that a cloud mask is applied. The resultant image can then be output onto a laser printer, giving a monochromatic hard copy of the image (see figure 3).
21

3.5.4 Discussion
The system is greatly tied in with the I S/SGOO image processing software run on a Micro-VAX computer, making it a complicated task to re-write for UNIX compatibility using a different image processing package. It is a fast procedure and produces relatively accurate geolocation, with a smooth image. The system is maintained at the NERC Nl unit (Plymouth), but it is not intended to be an operational centre routinely providing updates of the software for other holders of the system. The University of North Wales at Bangor uses this system on similar hardware to that at the Plymouth lA unit and S. Groom kindly updates the system when new NOAA satellites are launched. However this may take some time because the system is only intended for "in house" use. It suffers from the restriction of not being able to produce SST fields from night passes and only reads Dundee format HRPT tapes. The system works very well for its intended use and the Bangor team have used it for much shelf seas SST research over the past three years.
22

Figure 3: A SST image as produced by the NERC lA unit system at Plymouth Polytechnic. The region is the Tyrrhenian Sea between Italy and the islands of Corsica and Sardinia. The totally black areas represent land and cloud. The temperature is graded so that cold is dark and warm is light.
m 1"%* n
im 1, ; , 1 • -
23

3.6 AVHRR Processing System (Dundee)
The satellite receiving and archiving facility at Dundee started to receive Very High Resolution Radiometer (VHRR) data in 1975 and AVHRR data since 1978, and as such has Europe's largest AVHRR data archive (Baylis, 1981). The station offers an archiving service, routinely distributing HRPT data on CCT's and quick look hard copies of each pass recorded. Since 1987 the station has been planning to process AVHRR data into higher level data sets i.e. calibrated, geolocated and geophysical products. The project is three years behind schedule and is far from completion. The APS will operate on a SUN computer system. It is not yet known which techniques will be applied. The intention is to have a routinely operational system that is totally automated from satellite reception to high level products. The geolocation technique which will be applied appears to be superior to those used at present, it will incorporate all the methods so far discussed into a three staged process:-
1) An orbital model using TBUS data will predict the satellites orbit (accurate for up to three days in advance). Doppler shift corrections are used to correct for time errors (in the Y-direction on the image) of the on board clock (ca ±1 second). 2) Up to 300 GCP's may be selected automatically, using a coastal grid overlay. 3) This procedure will obtain an accuracy of plus or minus one pixel. A feedback mechanism to interpolate lat/long positions from a coastal scene to a completely open ocean scene will be applied, thereby providing an accurate open ocean geolocation.
3.6.1 Discussion
Although there have been considerable delays in developing their APS, Dundee are in a good position to generate a routine system. They have recently acquired an array processor, which will enable them to develop a fully automated and fast APS, providing standard products on demand. A lack of oceanographic skills within the team has lead to some delay in developing necessary algorithms. The system will only read in Dundee HRPT format and its image processing capabilities are not known. At present it is not thought that the systems software will be freely distributed amongst the U.K. AVHRR users, rather, customers would log in to the Dundee computer and operate the system remotely. The systems development is still in very early days, but its development is encouraged by U.K. AVHRR users.
24

3.7 DSP AVHRR Processing System
DSP (short for display) is capable of processing CZCS and AVHRR data, It is designed by the remote sensing group at the University of Miami. It was originally developed for the University's own use, but is now sold as a complete APS on a maintenance contract basis i.e. it costs £10K per year for the system and any maintenance or upgrading that is required. In the past it has usually been installed on a DEC VAX or Micro-VAX computer using the VAX/VMS operating system. It has recently been adapted to run in a UNIX operating environment on IBM, SUN, Silicon Graphics and Stardent unix boxes (At the time of this report the SUN version is still on a test basis). During the course of this investigation the system has been briefly seen in use on a VAX computer. The full capabilities of the UNIX system is not yet known, it is however expected to be more versatile than the VMS version simply because of the versatility of the UNIX system i tse l f .
DSP incorporates the user interface, and the image processing software for the APS. The extra hardware resources needed for the system to run on a SUN operating system are: X-windows interface package, about 32Mb of memory to install the DSP system and about 1 Gb of disk space to run the system.
DSP has two levels: applications and executive. Application programs actually do the AVHRR processing (e.g. Geolocation etc.) and executive programs provide the display management. Some examples are: image input/output, DSP/SUN interface, task management, the SI language command processor, and the on-line help facility. It executes all the appropriate programs and binds them together with a transparent data base manager.
The necessary sequence of processing steps in the DSP system are: reading and unpacking, geolocation, extraction, geophysical conversion, and remapping.
3.7.1 Reading and Unpacking Raw Data
Raw data may be read from CCT's, exabyte or optical disk. The following AVHRR data formats may be read: 1) Miami HRPT, LAC and GAC (U.S.A) 2) Scripps HRPT, LAC (U.S.A) 3) NOAA NESDIS HRPT, LAC and GAC (U.S.A.) 4) Dundee HRPT
25

5) Deutsche forschungsantalt fur Luft-und Raumfahrt (DFVLR, Germany) HRPT
6) Lannion (France) HRPT
The entire pass or a sub-area (defined by the number of scan lines) may be read, and the number of channels to be used are selected. Telemetry data such as calibration and navigation data are read into a master data base. All the selected data may be read directly from the screen. Any missing lines in the ingested data are replaced by zeros, and their corresponding line numbers are displayed on the screen. If vital information necessary for the processing of the data was not found then the name of the data file created is flagged.
A standard image file is created for the area chosen and each channel selected, these may be output to a laser printer and used as hard copy quick looks.
3.7.2 Geolocatlon
A channel 4 image is automatically selected, and because the contrast of AVHRR images is often so low that land and sea are indistinguishable, the radiometric range of the data containing the land/sea boundary is brought into a portion of the palette that has high contrast by the use of contrast stretching. A user selected part of the swath is displayed on the screen and initially geolocated using an orbital model which inputs attitude parameters from a set of orbital element data received daily from the U.S. military. This data is said to be the most accurate available and the TBUS data is a subset derived from this.
The geolocation is then corrected for attitude and time errors. This is done near nadir because any yaw error will be minimised here, the nadir track of the satellite is automatically superimposed on the image. A near nadir point on the image where there is good contrast between land and sea is selected by means of a "mouse" on the screen. The image is then reloaded about that point, and the coastline is imputed on to the screen (from a CIA world map data base), and manipulated by the use of arrow keys. Time errors are corrected by adjustments in the Y direction and roll errors in the X direction. Once these corrections have been applied, yaw errors are corrected, changes in yaw will cause the line of pixels that make up one scan to vary from a pattern perpendicular to the nadir track and distortion increases with increasing distance from nadir.
26

Thus an area far off nadir is selected for this correction, and to achieve this the image is reloaded with a scale factor of four, giving less resolution but a wider area of coverage, enabling both ends of the swath to be corrected. The image and coastline are matched up in the same way as for roll and time correction. Each new position of the coast line relative to the image creates a corresponding new set of attitude and time parameters which are automatically read and a new navigation (lat/long) file is created, with an accuracy of plus or minus one pixel.
3.7.3 Extraction
Extraction is the specification and creation of a subset of the original image data. The subset is specified by a lat/long centre and read into a separate file. Extracted images can be 2048*512 pixels or 1024*1024 pixels in size. The purpose of extraction is the reduction of data volume for subsequent processing.
3.7.4 Sector, Atmospheric Correction and Remap (SAR)
Atmospheric correction and remapping of the image on to a desired projection can be combined in a procedure called SAR. The output of geophysically corrected data may be displayed on the screen (so the user can evaluate the results) or be displayed as an image, in the case of the latter the scaling of the SST range between 0 and 255 is done automatically within the geophysical algorithm.
Calibration of visual and infrared channels is carried out using the standard NOAA/NESDIS algorithms and look up tables previously mentioned for other APS's.
The atmospheric correction algorithms used are the standard NOAA ones and the actual one used depends on the satellite number and the channels being used, an example of some of the available ones is given in table 2. The designers are currently reviewing which algorithms should be used, they will probably be incorporating some non-NOAA algorithms and deleting some of the existing NOAA ones.
27

Table 2. Some NOAA MCSST algorithms used in the DSP APS
Algorithm S a t e l l i t e Channel Deschamps & Phulpin NOAA-6 3 & 4 C.Walton Feb. 87 day NOAA-10 3 & 4 C.Walton Feb. 87 night NOAA-10 3 & 4 McClain's standard day NOAA-7 4 & 5 McClain's standard night NOAA-7 5 & 4 McClain's standard day NOAA-9 5 & 4 McClain's standard night NOAA-9 5 & 4 McClain's original day NOAA-7 5 & 4 McClain's new day NOAA-7 5 & 4 McClain's original night NOAA-7 5 & 4 McClain's new night N0AA7 5 & 4
The program REMAP transforms the image from satellite scan coordinates to a specified standard map projection, (twenty five possible projections are available, see appendix B). There are four choices of mathematical transforms to remap the navigated geophysical data eg:- (BGT = bi- linear geometrical transform)
1) BGT and bi-linear interpolation 2) BGT and bi-cubic interpolation 3) BGT and nearest neighbour selection 4) BGT and nearest neighbour for global input Remapping also provides a final check on navigation since all similar images mapped with the same parameters can be superimposed to within the limit of the navigation.
3.7.5 Image Processing
Image file structure on the DSP system is such that an image may have a sub image, which in turn may have multiple band or single band images (each band is the data from one channel on the sensor). Each sub image file can have various types of information associated with it e.g. navigation, calibration data etc. Each image/sub image occupies an image plane. The display hardware allows for two display resolutions, high and low. In high resolution the display memory is organised into two memory planes, each containing 2048*1024 pixels (of which only 1024*1024 are viewable at any one time).
In low resolution the display memory is organised into four planes, each containing 1024*1024 8 bit pixels (of which only 512*512 pixels are viewable at any one time).
28
Three of these planes are used to display images (i.e. one image per plane) and the fourth is reserved for graphics, lines, annotation, coastlines, etc, each graphics plane is 1 bit deep for a total of eight planes.
An outline of a selection of the most relevant image processing and applications programs is given below:
Current status There are programs which display and or manipulate various information about current sessions e.g. names and palette file of current image planes etc.
Pa le t tes Palettes are stored in palette or image files. DEEP defines the current palette file that is to be used. PAINTER modifies the display palette given the hue, saturation and end point values and the number of palette entries to be created. PALMOD enable current palette modification by individually rolling the red, green or blue portions of the palette.
Graphics manipulation DEFGR, specifies which image plane is to be the graphics plane. COPYGR, copies one graphics plane to another. The SLD processor creates graphic annotation for image e.g. lines, text, arrows, rectangles, etc.. which can be written onto or merged into an image. SHRINK, reduces an image file to a specified size and outputs four graphic planes.
Image plane control DEFLU, specifies which Look-up/video output unit is to be used, a null device can be selected so that a user can use DSP without affecting other DSP users. ENABIM enables red, green and blue colours to be mapped to separate image planes giving so called "true colour". ENABPC enables one image plane to be mapped to all three colours, giving pseudo colour mapping. LOOP, allows multiple images to be loaded into different quadrants of the image planes and displayed one after the other as if in a movie loop.
Image operators SHFIMG, shifts the whole image up, down or right to left.
29
CONVRT, will re-scale, shift or even flip the data through 180 degrees. MEAN, creates a new image containing the mean of two images. ASMD, adds, subtracts, multiplies or divides images. ADD and SUB, add or subtract one image from another. COMPARE, compares two images and states whether or not the pixels match exactly. MINMAX, zeros all pixels outside of a specific range.of values. DECLOUD, uses mean and variance data to determine which pixels to zero. FILLZ, replaces missing pixels with the average of their eight neighbours. MIA2TIFF, converts an image file to TIFF format, suitable for display on an Apple Macintosh computer by programs such as Page Maker or Image Studio.
F i l t e r s FLTC is a generalised convolution routine for distance weighted filtering of images. It first calculates the mean and variance of the pixels included in a specified box. The centre pixel in the box (old value) is then replaced with a new value. FLTM generates a median valued field of the image memory based on either a 3*3, 5*5, or 7*7 pixels moving window. The value of the centre cell is replaced, after filtering with the median of all the values within the specified box. This procedure preserves most linear features while suppressing random noise. FLTMLIM, is similar to FLTM, but operates on image counts only within a specified range. FLTFFT, performs a notch filter on the image, this removes synchronous noise from channel 3 on the AVHRR sensor.
S t a t i s t i c s GRAD, estimates the spatial gradient magnitude field for a specified area of the image display contents. GRADAN, estimates the spatial gradient direction field. HIST, generates absolute or relative frequency histograms of image memory count data and displays the output as bar charts or numerical output. JHIST and DISJHI, computes and displays a matrix of all pixel values in two images as a histogram. MEAN, estimates the mean of an image field. SKEW, estimates the skew moment image field. AREASTAT, computes statistics of a specified region from the input image and outputs the value to a work space variable. The possible statistics are; minimum, maximum, mean, variance, skewness and Kurtosis.
30

REGRESS, performs linear regression analysis on the n-variate data contained in an .XTA input file.
Data extraction IMGTOFMT, converts an image subset into a printable FMT format f i le . PULL, fits a third order curve between specified points (using a mouse), it then plots the curve on the graphic display, and outputs the positions and extracted values of evenly spaced points along the curve to a DIM file (a sequential ASCII file). GTCRCL, computes, draws and then outputs a great circle route between specified points to a DIM file. XAP, extracts a scan line and outputs the values in a graphic bit plane. XTRSCA, extracts concurrent ship and satellite observations and outputs to a XT A data extraction file. TRACE, can extract calibrated values from an image plane at specified lat/long coordinates and write them to a DIM file.
3.7.6 Discussion
DSP is a comprehensive APS package. Its geolocation technique is superior to the others described in this report (except, possibly the proposed "Dundee" method", because this is to be fully automated). It is still a subjective technique, and it requires some time to implement (although a rough geolocation can be obtained almost instantly), but its final accuracy is very good.
There are obvious advantages of the systems capabilities to read in the various American formats of acquisition data as well as the main European ones.
The applications software is extensive as well as accessible, so that the addition of new routines is relatively easy. The menu system allows this APS to be used by students and researchers unfamiliar with AVHRR processing relatively easily.
The hardware needed to operate this system on the SUNOS at JRC already exists or is on order, except that extra memory space will be required. The optical disk system at the JRC has infinite storage capacity, but there is up to a 14 second time delay in the retrieval of the stored data.
If the APS was allowed to run on the computer system as it is, a considerable slowing down in computation speed across the
31

network would be experienced. The required hardware needed costs about £2.5K.
The DSP system will cost $20K (ca £10K) per year. This includes the acquisition of the system and its continual maintenance. Only one licence is required for the U.K. and all enquiries/requests would be channelled through the institute holding the licence. This makes the system very attractive for a wide range of interested institutes, because the cost may be shared and administration is kept to a minimum. This is reinforced by the wide range of computer hardware upon which the system now operates.
32

3.8 SHARK AVHRR Processing System
Station HRPT Archiving Reprocessing Kernel (SHARK) is being developed by the Earthnet Program Office (ESRIN), as part of the Coordinated TIROS Network activity, for TIROS HRPT data reprocessing, and archiving.
Reprocessing, refers to the development of higher level (1B and above, see below) AVHRR data.
Formatting, refers to the reformatting of various HRPT data into a standard format (SHARP), which it is hoped will be used throughout Europe.
Archiving, refers to the Earthnet Centralised TIROS Catalogue, which holds the largest range of pan European and tropical AVHRR data bases.
An overview of the SHARP format and the Earthnet Centralised TIROS Catalogue is given in appendix C and D respectively.
The SHARK APS is still under development, it is written in Fortran and C. At present its capabilities include;-1) Reading and unpacking HRPT data from ten different ground receiving stations (see figure 4). Reformatting the full pass scene (approximately 16 minutes of coverage) into four minute scenes i.e SHARP format. 2) Processing of TOVS (TIROS Vertical Sounder) data. 3) Automatic generation of quick look (on screen and hard copy). 4) Production of calibrated and geolocated AVHRR data (level 1B).
When development is completed SHARK will also provide the following levels (products) of HRPT data:-Level 2A: 1 SHARP scene in radiometric units, scan orientated. Level 2B; 1 SHARP scene in geophysical units, scan orientated. Level 3A; 1 SHARP scene in radiometric units, remapped. Level 3B: 1 SHARP scene in geophysical units, remapped. Level 4; Mul t i - t ime/mul t i -scene, in geophys ica l units, remapped. The PVwave image processing package will be utilised as the interface and main image processing software of the full SHARK APS.
33

Figure 4: Earthnet Coordinated TIROS Network station coverage.
4
Stations: Dundee, Maspalomas, Tromsoe, Oberpfaffenhofen, Scanzano, Niamey, La Reunion, Nairobi, Antarctica

The system is based on SUN work stations, its handling capabilities are:
1) Real time acquisition of APT AVHRR data. 2) Raw data input from CCT's, Exabyte, Streamer and Network
media. 3) Optical disk archiving and retrieval. 4) Interface with the NOAA bulletin board, for TBUS and other
ephemeral parameters.
Calibration is achieved in the usual standard NOAA manner and the geolocation process is similar to that of the APOLLO APS.
3.8.1 Discussion
The system is being installed at the JRC with no capital cost, and will be used to provide quick look facilities for the major European HRPT formats. Its full development is probably a few years off, but what already exists appears to be well designed. It is not yet known what it's full application capabilities will be, it is likely to be akin to that of the I^S/System 600 APS. Although, it will incorporate the PVwave graphics software (an advanced user interface system), which would have to be purchased by JRC.
35

3.9 SEDAS AVHRR Processing System
The Satellite Environmental Data Acquisition System (SEDAS) has been jointly developed by RAE (Farnborough) and Software Sciences. The latter is a commercial company, who have a contract with RAE to develop the software. The aim of the developers was to provide an accurate and flexible research tool to process AVHRR data, specifically for RAE. The system is also used operationally by the Royal Navy (Northwood) to determine the positions of mesoscale ocean features. The National Remote Sensing Centre (NRSC), which is shortly being commercialised also uses SEDAS. The system runs on a Prime 250 computer linked to a GEMS 33 image processing device. The GEMS image processing software is an user interface to SEDAS and menus and graphics are accessed using a tracker ball.
The GEMS image processing software provides sixteen 8 bit image stores (12 working stores and 4 displays), plus four 1 bit overlay planes which can provide, coastline, grid, annotation, and graph displays. Full resolution images or sub-areas are displayed in a 512*512 pixel array. There is a temperature sl ice with up to sixteen different colour slices available. Contours may be drawn on to the image to highlight isotherms. Images may be added, subtracted or multiplied together and the resulting output is normalised to keep it the data within the range of the eight bit image planes.
At present SEDAS can only read in Lasham and Dundee format acquisition data. It copes with missing or corrupt data lines in a similar fashion to the APOLLO APS.
Cloud detection and cloud clearing algorithms as developed by Saunders and Kriebel (1988) are utilised.
The geolocation technique applied is also similar to that of the APOLLO system as are the atmospheric correction algorithms which provide SST from the brightness temperature.
Remapping can be either on a pixel by pixel basis or by using an interpolation technique on every eighth scan line. Re-sampling uses a cubic correlation technique, which defaults first to a bi-linear interpolation and finally to a nearest neighbour algorithm in the vicinity of clouds or the edge of the image. The available projections include Mercator, polar stereographic and equal area.
36

3.9.1 Discussion
The capabilities of SEDAS seem to lay somewhere between those of the APOLLO and DSP systems. By 1992 Software systems, hope to upgrade SEDAS to UNIX compatibility and provide the following fac i l i t i es : 1) Automatic differentiation between sea ice and cloud and
mapping of the ice boundaries. 2) Improved atmospheric correction algorithms. 3) Capability of incorporating ATSR and Altimeter data from
ERS1, as well as ancillary data such as in-situ SST measurements, bathymetry and atmospheric profiles.
Once the system has been fully developed as described, it will be a very capable APS. However, because Software Sciences have developed SEDAS under contract to RAE, they are not able to sell the system to potential customers. At present, the only way for a customers to process AVHRR data on SEDAS, is to use it on the Prime computer at NRSC for a fee of £35 per hour plus £10 per CCT used.
The GEMS image processing software was conceived in 1982 by RAE and GEMS of Cambridge Ltd, the latter organisation, was taken over by an American company (Ramtek) in 1990. GEMS (or Gemstone) software is an interface package designed specifically for remotely sensed data processing, it is not an APS in itself i.e it does not provide cloud clearing, atmospheric correction and calibration algorithms. Ramtek U.K. Ltd, is currently updating the Gemstone software, and claims that it will be hardware independent, i.e it will run on any computer. This new version (Terrain) will provide state of the art image processing tools with a host of library functions, but still without full AVHRR processing capability.
37

Chapter 4: Discussion of AVHRR Processing Issues
4.1 Introduction
Principally, the issues involved in this discussion can be addressed by some questions in a hierarchical order:
1) What are the principal APS needs of JRC e.g. a)to carry out research in developing an APS or b)to carry out applied AVHRR oceanographic research?
2) What are the APS needs of other U.K. WOCE participants and can/should JRC develop take these needs into account?
3) What time scales are involved?
4) What costs are involved?
4.2 Possible Options
These may be listed as:-1) An APS is developed in-house from scratch
2) An APS is developed around an existing one, which may act as a skeleton program
3) The purchase of a system which suits all of U.K.WOCE APS needs, and is maintained by the manufacturers
4) Purchase an APS outright, which is not maintained
A result of the JRC's dual role of conducting research for U.K.WOCE and acting as a focal point for other U.K.WOCE participants, is that two types of research institutes are involved i.e. universities and governmental research institutes. In general, universities put more emphasis on training students, whilst dedicated research institutes have a higher priority to produce results of research. This may help to explain the strategy of universities to develop their own APS, unlike research institutes, who tend to buy in "off the Shelf" systems (as in the U.S.A. for example).
The advantages of developing an in-house APS are;-1) The developers (often students) gain an increased understanding of how the AVHRR data was treated before they apply it to oceanography.
38

2) The system can be tailored around the hardware and output requirements of the developer.
3) Although a suitable system may be purchased from elsewhere, it is cheaper to spend a lot of time developing ones own (because time may be relatively inexpensive).
4) It is often easier to get funding for new personnel/projects rather than for a lump sum capital payment.
5) The student will gain more confidence and independence as a result of developing a system, and the department may gain more independence within the oceanographic community.
6) Improved AVHRR processing and correction techniques will evolve.
The disadvantages are;-
1) Unnecessary duplication of systems within the AVHRR community.
2) Less oceanographic research may result because some departments/students cannot afford the time to develop their own system.
3) End products of different systems cannot be readily compared, because different correction procedures were applied.
4) The lack of a standard end product weakens the case for the incorporation of AVHRR data in other projects e.g. ocean/atmosphere modeling.
5) The system will often only work on the host's own computer hardware.
Alternatively a system which has been designed to be sold as a complete APS may be purchased. This system would have one central base within the country, where all enquiries and problems addressed to the manufactures are channelled through, and would be installed in other subgroups e.g. universities participating in U.KWOCE
39

The advantages of this are:-
1) The system is very user friendly, therefore reducing learning t ime.
2) AVHRR data would become available to many more researchers within and outside JRC.
3) The end products are easily compared with others derived from the standard system. This advantage could be extended beyond U.K. WOCE to U.S WOCE, if for example the DSP system was chosen, because this is the main APS currently used in the U.S.A.
4) The system will operate on a variety of different hardware. This lends itself to a multi-institutional group, which will have different hardware both on and off shore.
5) In some cases only one licence fee for all the research institutes in the country is needed. Thereby spreading the cost of the system amongst all its users.
6) The system will be continually updated and improved by the manufacturers.
7) The political advantage of the JRC being seen to provide something for the entire WOCE community
The disadvantages are;-
1) Capital costs may be high.
2) Less overall development and improvement of AVHRR correction procedures.
3) A user can apply the data without knowing exactly how it was derived, which may lead to spurious use of the data.
4.3 Cost Issues
Which is cheaper, a high capital cost with low running costs or vice versa? This can be a "catch 22" situation, because the actual process of investigating this question maybe so high as to make the question itself inappropriate. It would certainly be true that the installation of an all purpose APS in the JRC would free the centre from having one person tied to the system, who would have to instruct other users and continually maintain the system.
40

The cost of the DSP system (approximately £1 OK per year) is cheaper than an Assistant Scientific Officers salary, and this cost could be distributed amongst the main users.
4.4 Regional Issues
Consultations with the processing team of the NERC satellite receiving station at Dundee has revealed that they intend to produce an APS which will provide high level products on a routine basis for a wide range of AVHRR users. It was agreed that the station is best placed to routinely produce such a comprehensive system which will serve the whole country, since it already produces a quick look and archiving facility on a routine basis. These products will have meteorological, oceanographic, land and ice applications. It was also revealed that the centre is two to three years behind schedule with its programme. This is a result of contractual, staffing and other problems. One difficulty that has hampered them in trying to develop such a widely comprehensive system, is the lack of personnel experienced in some special ised areas e.g. oceanographic skills are needed to develop SST algorithms. During these consultations it was felt that collaboration between JRC and the Dundee station could help to overcome these problems. Once the remote sensing group at JRC has acquired an operational APS it will undergo a learning curve itself and will be in a position to pass on its experience to Dundee. The system proposed by Dundee will be more automated than the others reviewed here, but it would take many years for it to achieve a range of application software comparable to that of the DSP system. It is this capability and its user friendliness that makes the DSP system the best available. The other U.K. institution which routinely receives AVHRR transmissions is the Meteorological station at Lasham in Hampshire, this station does not archive the data or produce a service outside of the Met Office, but it may be fruitful to involve the station in any future U.K. APS.
While it is extremely important for the U.K. community to collaborate, use, and influence the ESA AVHRR processing system i.e SHARK (especially since we have already indirectly paid for it!), a mechanism to implement our own processing ideas is needed. This is because ESA's system is a compromise of other nations ideas and systems, so there is not always room for our needs to be incorporated.
41

Two good examples of this are:-
1) The scientific community tends to need the whole AVHRR pass scene (i.e. 16 minutes) in its work, which is supplied in raw data form by the Dundee receiving station, but is broken up into separate 4 minute scenes in the ESA format. 2) Although its archive is drawn from many satellite receiving stations around the globe it does not hold all of the available passes e.g. it will only hold fifty percent of the day time passes received at the Dundee station and the situation on night time passes is not yet clear.
This could be seriously limiting, especially when one is planing a cruise and trying to find cloud free passes. This aside there are many positive reasons for using the European system e.g;-
1) The SHARK software is free to the U.K. research community
2) It has a large data base with satellite receiving stations from around the world contributing to it
3) It incorporates a catalogue archiving facility (Charge for products)
4) It promotes U K's science internationally
5) ESA is a good source of extra funding
6) The system is very user friendly and is orientated towards the applications side of remotely sensed data, so will be useful in helping to forge links between industry and the science community in schemes such as the MET-OCEAN club recently upgraded by lOSDL.
At present the SHARK system provides on-line quick look facilities which are geolocated as brightness temperature, but no geophysical products. These products (levels 2,3 and 4) are being developed at present. The system will not be completed for a few years yet, until it is we will not know how it compares with the DSP system in terms of manipulating the data. If the development continues to be as good as the it has so far, then there is every reason to think that it will compare favourably.
42

4.5 Views of other U.K. AVHRR Users
AVHRR SST data is used extensively at the University of North Wales Bangor. It is the view of Dr J. Mathews (of the Oceanography department) that adoption of the DSP APS by the JRC for U.K. WOCE will enable many more students to use AVHRR data, and vastly increase the applications of AVHRR SST data. It will give Europeans access to American AVHRR data and provide a standard AVHRR product within the U.K. and most of the U.S.A. Most of the algorithm developments that are used in most APS's have originated from NOAA, and the University of Miami has close links with NOAA/NESDIS, enabling it to develop the most accurate and comprehensive APS available. The department may be willing to make a financial contribution towards the purchase of the DSP APS. Professor P. Mather of the remote sensing department at the University of Nottingham and Dr K. Heywood at the Environmental Sciences department of the University of East Anglia, both would like to see a standard APS introduced to the U.K. They are particularly concerned that the system should be user friendly so that it can be easily operated by students, and that it was in-house, rather than at some remote institute, which would require travelling in order to operate it.
4.6 Summary
From the seven APSs reviewed in this report, three of them are not compatible with the UNIX operating environment, and two of those (AVHRR (SU) and |2S/S600 (NIAU)) could not realistically be adapted to achieve this. The third (APOLLO), is more suited to UNIX compatibility conversion, although it is becoming out dated for SST use, and does not provide the advantages of a user friendly, fully maintained system. It does provide some very useful ephemeral programs (e.g. computation and compilation of calibration tables for new AVHRR sensors), and could be acquired at low capital cost.
The Dundee and SHARK systems will both provide SUN compatibility, but will not be fully operational as APS's for at least a year or more (1992-3). Although the SHARK system is currently operating as a display system, providing quick look and SHARP formatting capabilities. It also provides the most complete global AVHRR archiving facility available via the Earthnet Centralised Tiros Catalogue.
43

The SEDAS system is a fully operational APS, but will not be compatible on UNIX machines for at least a year and its availability to potential customers is in doubt.
Given the scientific objectives of U.K.WOCE and the fact that the JRC exists to carry out these objectives within ten years, an existing purposely designed and maintained APS such as the DSP system would best suit these aims in terms of providing an AVHRR data applications tool, which is most cheaply and easily utilised by a cross section of the user community.
By providing both, a standard system (DSP) for the whole of U.K. WOCE and compatibility with U.S.WOCE, the JRC will truly be fulfilling its role as a national coordinator and an international cooperator.
It is worth noting that, all that has been discussed regarding the DSP processing system and ESA's SHARP system applies equally to CZCS data. It is extremely fortuitous that the satellite department of the Southampton University (who are renowned for their work in remote sensed ocean colour) will be joining the JRC team at their new offices in a few years time, as this makes it perfect sense for the Southampton team to acquire and operate CZCS versions of the software in a similar fashion as described for SST at JRC.
4.7 Conclusion and Recommendations
The DSP Miami APS is the most comprehensive and user friendly system available, It satisfies the APS requirements of the JRC and U.K. WOCE.
It is recommended that the DSP APS should be purchased by the JRC and distributed to all interested user institutes, which would contribute towards the cost of the system from research funding, such as WOCE special topic awards.
The JRC should be the contact point regarding operational aspects of the system.
The satellite receiving station at Dundee should acquire the DSP system and be responsible for the routine production of AVHRR products to the non-WOCE AVHRR user community.
The JRC should utilise the APOLLO APS for some of its own research requirements.
44

There should be more involvement in ESA in relation to remotely sensed SST retrieval, and JRC should gain access to the Earthnet Centralised TIROS Catalogue.
45
Chapter 5: REFERENCES
Baylis P.E. 1981a Dundee University meteorological satellite ground receiving and data archive facility. In, Gower J.F.R. (ed), Oceanography from space, New York and London, Plenum Press 49-58
Brown .B., Brown J.W. and Evans T.H. 1985 Calibration of AVHRR infra red observations. J. Geophys. Res., 90, 11667-11677
Lauritson L., Nelson G.J. and Porto F.W. 1979 Data extraction an calibration of TIROS-N/NOAA radiometers. NOAA Tech. Memo NESDIS 107
Nagle F. 1986 A description of prediction errors associated with the TBUS-4 navigation message and a corrective procedure. NOAA Tech. Memo NESDIS 106
NOAA/NESDIS 1982 Coefficients presented at the 32nd SST research Panel meeting held by the National Environmental Satellite, Data and Information Service (NESDIS) of the National Oceanic and Atmospheric administration (NOAA) at the World Weather BIdg in Suitland, Maryland on September 30, 1982.
McClain E.P., William G., Pichel and Walton C.C. 1985 Comparative performance of AVHRR-based Multi Channel Sea Surface Temperatures. J. Geophys. Res., 90, 11587-11601
McClain E.P., Walton C.C. and Stowe L.L. 1990 CLAVR cloud/clear algori thms and non-linear atmospheric correct ions for multichannel sea surface temperatures. In, Fifth conference on satellite meteorology and oceanography, 3-7 September 1990, London 133-138
McMillin L.M. and Crosby D.S. 1984 Theory and validation of the multiple window sea surface temperature technique. J. Geophys. Res., 89, 3655-3661
Saunders R.W. 1986 An automated scheme for the removal of cloud contamination from AVHRR radiances over western Europe. Int. J. Remote Sensing, 7, 867-886
46

Saunders R.W. and Kriebel K.T. 1988 An improved method for detecting clear sky and cloudy radiances from AVHRR data. Int. J. Remote Sensing, 9,123-150
Simpson J.J. and Humphrey C. 1990 An automated cloud screening algorithm for day time Advanced Very High Resolution Radiometer Imagery. J. Geophys. Res., 95, 13459-13481
Weinreb M.P., Hamilton G., Brown S. and Koczor R.J. 1990 Non-linearity corrections in calibration of Advanced Very High Resolution Radiometer infra red channels. J. Geophys Res., 95, 7381-7388.
47

APPENDIX A
The APOLLO suite of programs and their applications;
NAME PURPOSE
AVHCAL AVHCTH AVHIN AVHLIN AVHLOC AVHPOS
CLOUD COAST CTT-IOOL
DCLOUD GACIN GBOOORR JOIN
JOINCAL
JOINTIP IVIASK IVIESOmP
PSCOAST PSCOASTIN
PSIMAG
OSIIVIOD
ROT180 RTALB
SATMOSIN SUBSAT SURMSK TEMRAD
TTOR
TTOST
Calibrates an AVHRR vis or IR image Produces an AVHRR cloud top HT or temp image To read a Dundee or Lasham HRPT tape Reads a NOAA LAC format tape Creates a file for geolocating pixels Find lat/long or line/columns of a point in an AVHRR image To detect clear and fully cloudy pixels Overlay coastline and or lat/long grid on image To create colour table for cloud top HT/temp image To zero cloudy pixels from an AVHRR image To read a NOAA GAC format tape Geometric correction of raw AVHRR image Joins two images of the same AVHRR pass together Joins two consecutive calibrations files together Joins two consecutive TOVS TIP files together Overlays or blinks a cloud mask over an image Create segmented image file of a mesoscale model Overlay coastline on polar image Writes coastline into a polar stereographic image Reproject an AVHRR image to a polar stereographic image Composite input image file from two input images Rotates a standard Image File through 180 deg Computes a surface or top of atmosphere bidirectional reflectance Read AVHRR/TOVs data from a SATMOS tape To compute a track of NOAA sat for a given time Overlay a land or sea mask on an AVHRR image Computes radiance-temp tables for new AVHRR instruments Converts an AVHRR brightness temperature image into radiances Converts AVHRR brightness temperature to SST
48

7: APPENDIX B
A list of projection options provided in the DSP AVHRR processing system;-
1 2 3 4 5 6 8 9 10 11 12 13 14 15 16 17 18 19 20 21 22 23 24 25
Galls stereographic Stereographic Orthographic Azimuthal equal area Azimuthal Gnomonic Azimuthal Equidistant Mercator Equirectangular Cylindrical Equal area Cylindrical gnomonic Conic equidistant (1 ||) Conic equidistant (2 j j ) Conic Equal Conic conformal Bonne Pseudoconic Polyconic pseudoconic Conic gnomonic NCAR oval A i t o f f
Sanson sinusoidal Mollweide Hammer Briesemeister Demons eye
49

APPENDIX C
Overview of SHARP
Standard-family HRPT Archive Request Product is Earthnet's format for AVHRR, TOVS and CZCS data. It is the forerunner to the CEOS (Community for Earth Observing Satellite) Inventory Exchange Format (CIEF) for such data and will be compatible with the CIEF, when its final format is agreed. An overview of the standard family format is given in figure 5 and the tape organisation in figure 6.
SHARP characteristics;
Images provided as 4 minute blocks of AVHRR data (1440 scan lines) and includes TOVs data for the entire pass. This allows one scene to fit on a 1600bpi CCT, 4 scenes on a 6250 bpi CCT, and up to thirty scenes on an Exabyte. HRPT scenes are ordered from North to South and from East to West irrespective of the original pass direction. The 10bit words per AVHRR count of the HRPT frame are stored right hand justified within 16 bits, the remaining 6 bits are used as flags for supplementary data assigned as follows; bit 6 - lat/long grid, bit 5 - coastlines, bits 1,2&3 - classification. Earth location, sun angles and satellite angles given as suffix data for every 32 pixels within 16 scan lines. Depending upon the classification, the following is given: Total percentage, cloud, sunglint, land, sea, ice and snow in the image. Data quality flag, good, average or below average. Number of bad or missing lines. Calibrated intercepts and slopes for the thermal bands provided at each scan line . Raw data histogram for each band Quick look image classified into 6 or 4 classes, (512*480 lines) for full frame;-- Standard quick look - 6 classes: land, cloud, sunglint, sea,
desert and snow/ice. - Floating ice quick look - 4 classes:, floating ice, cloud, sea
and snow. - Night quick look - floating ice, cloud sea and snow
(reduced quality).
50

Figure 5. An overview of the Standard Family CCT Format
E O F
FH'e
E O F
E O F
Data
Fire # 3
E O F
E O F
Data.
File
E O F
Nul^Volume Directary
E O F
E O F
E O F
\ \
\ \
Volume Descriptor Record
Inter Record Gap
File Pointer Record #1
Inter Record Gap
File Pointer Record #2
Inter Record Gap
File Pointer Record #n
Hie Descriptor Record
Inter Record Gan
Data Record #1
Inter Record Gan
Data Record #2
Inter Record Gap
Data Last Record
Identifies Volume and tells number of Files
Tells how to read this File and how to find Key Data
51
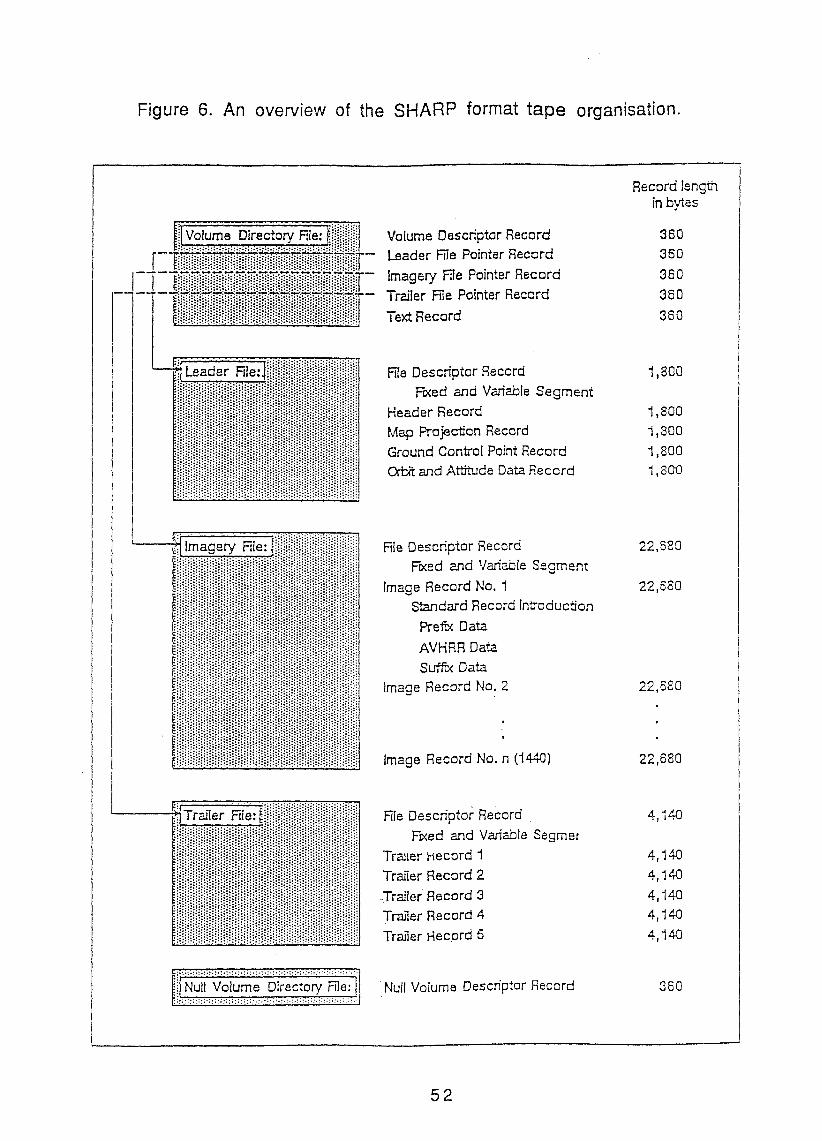
Figure 6. An overview of the SHARP format tape organisation.
I Volume Directory Hie;
Leader Fil^ji
imagery File:
Volume Descriptor Record Leader File Pointer Record Imagery File Pointer Record Trailer Rie Pointer Record Text Record
File Descriptor Record Fixed and Variable Segment
Header Record Map Projection Record Ground Control Point Record OitA and Attitude Data Record
File Descriptor Record Fixed and Variable Segment
Image Record No. 1 Standard Record Introduction Prefix Data AVHRR Data
Suffix Data Image Record No. 2
Image Record No. n (1440)
Record length in bytes
360
360
3G0
360
360
1,800
1,800 1,800 I WO 1,800
22.680
22,680
22,620
22,680
Trailer Fil^ File Descriptor Record Fixed and Variable Segmer
Trailer hecord 1 Trailer Record 2 Trailer Record 3 Trailer Record 4 Trailer Hecord 5
4 J 4 0
4 J 4 0
4 J 4 0
4^40 4 J 4 0
4 J 4 0
i Null Volume Directory File: Null Volume Descriptor Record 360
52

APPENDIX D
Earthnet Centralised TIROS AVHRR Catalogue
This catalogue is included in the on-line Earthnet Data Archive (LEDA) catalogue system. Some general characteristics are:
Contains HRPT acquisition records (approximately 2500 records), giving pan European and tropical coverage, with plans for global coverage.
Contains AVHRR SHARP level 1B scenes. There is at the moment a 1300 back log in entries, so the archive is not complete
Quality parameters derived from the quick look include; corner coordinates percentage sea percentage land percentage sunglint
The catalogue opened in November 1987 and its archive will start from 1978 for some regions.
It will handle CEOS Inventory Exchange Format Files.-
It is planned to include; world wide station inventories and guide information (e.g. historical TBUS and calibration data).
53


![Atmospheric CO retrieval from the AIRS and AMSU ......2005/01/28 · resolution instruments TOVS flying onboard the NOAA polar satellites since 1978 [Chédin et al. 1999, 2002, 2003].](https://static.fdocuments.net/doc/165x107/61169e43175f9043a465248c/atmospheric-co-retrieval-from-the-airs-and-amsu-20050128-resolution.jpg)


