Advanced Very High Resolution Radiometer Normalized ... · Advanced Very High Resolution Radiometer...
2
U.S. Department of the Interior U.S. Geological Survey Fact Sheet 2005-3114 November 2005 Advanced Very High Resolution Radiometer Normalized Difference Vegetation Index Composites Printed on recycled paper The Advanced Very High Resolution Radiometer (AVHRR) is a broad-band scanner with four to six bands, depending on the model. The AVHRR senses in the visible, near-, middle-, and thermal- infrared portions of the electromag- netic spectrum. This sensor is carried on a series of National Oceanic and Atmospheric Administration (NOAA) Polar Orbiting Environmental Satellites (POES), beginning with the Television InfraRed Observation Satellite (TIROS-N) in 1978. Since 1989, the United States Geological Survey (USGS) Center for Earth Resources Observation and Science (EROS) has been mapping the vegetation condition of the United States and Alaska using satellite information from the AVHRR sensor. The vegetation condition composites, more commonly called greenness maps, are produced every week using the latest information on the growth and condition of the vegetation. One of the most important aspects of USGS greenness mapping is the historical archive of information dating back to 1989. This historical stretch of information has allowed the USGS to determine a “normal” vegetation condition. As a result, it is possible to compare the current week’s vegetation condition with normal vegetation conditions. An above normal condition could indicate wetter or warmer than normal conditions, while a below normal condition could indicate colder or dryer than normal conditions. The interpretation of departure from normal will depend on the season and geography of a region. Characteristics of AVHRR The greenness maps are representations of the Normal- ized Difference Vegetation Index (NDVI). The NDVI has been utilized for many years to measure and monitor plant growth (vigor), vegetation cover, and biomass production from multispectral satellite data. Figure 3. Greenness map for Alaska, August 10 - 23, 2005. Figure 1. The AVHRR sensor aboard the NOAA POES Satellite. Image courtesy of NOAA. Figure 2. Greenness map for the conterminous United States, August 10 - 23, 2005.
Transcript of Advanced Very High Resolution Radiometer Normalized ... · Advanced Very High Resolution Radiometer...
U.S. Department of the InteriorU.S. Geological Survey
Fact Sheet 2005-3114November 2005
Advanced Very High Resolution RadiometerNormalized Difference Vegetation Index Composites
Printed on recycled paper
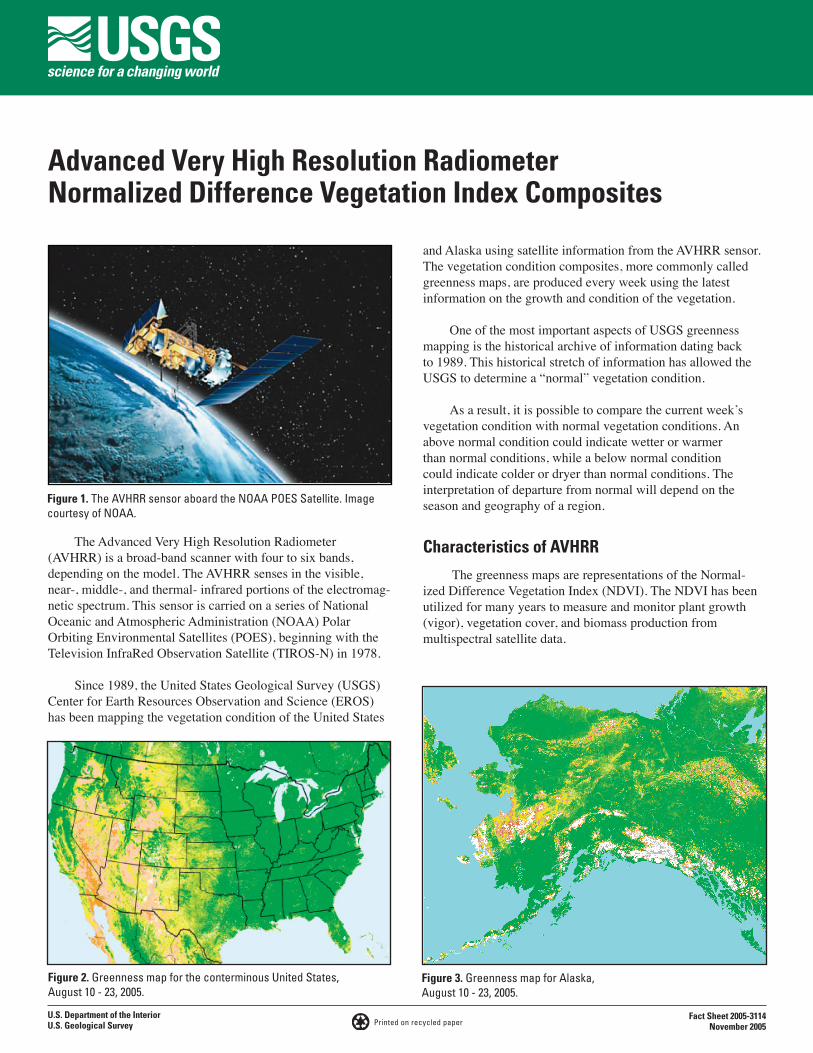
The Advanced Very High Resolution Radiometer (AVHRR) is a broad-band scanner with four to six bands, depending on the model. The AVHRR senses in the visible, near-, middle-, and thermal- infrared portions of the electromag-netic spectrum. This sensor is carried on a series of National Oceanic and Atmospheric Administration (NOAA) Polar Orbiting Environmental Satellites (POES), beginning with the Television InfraRed Observation Satellite (TIROS-N) in 1978.
Since 1989, the United States Geological Survey (USGS) Center for Earth Resources Observation and Science (EROS) has been mapping the vegetation condition of the United States
and Alaska using satellite information from the AVHRR sensor. The vegetation condition composites, more commonly called greenness maps, are produced every week using the latest information on the growth and condition of the vegetation.
One of the most important aspects of USGS greennessmapping is the historical archive of information dating back to 1989. This historical stretch of information has allowed the USGS to determine a “normal” vegetation condition.
As a result, it is possible to compare the current week’svegetation condition with normal vegetation conditions. An above normal condition could indicate wetter or warmer than normal conditions, while a below normal condition could indicate colder or dryer than normal conditions. The interpretation of departure from normal will depend on the season and geography of a region.
Characteristics of AVHRR
The greenness maps are representations of the Normal-ized Difference Vegetation Index (NDVI). The NDVI has been utilized for many years to measure and monitor plant growth (vigor), vegetation cover, and biomass production frommultispectral satellite data.
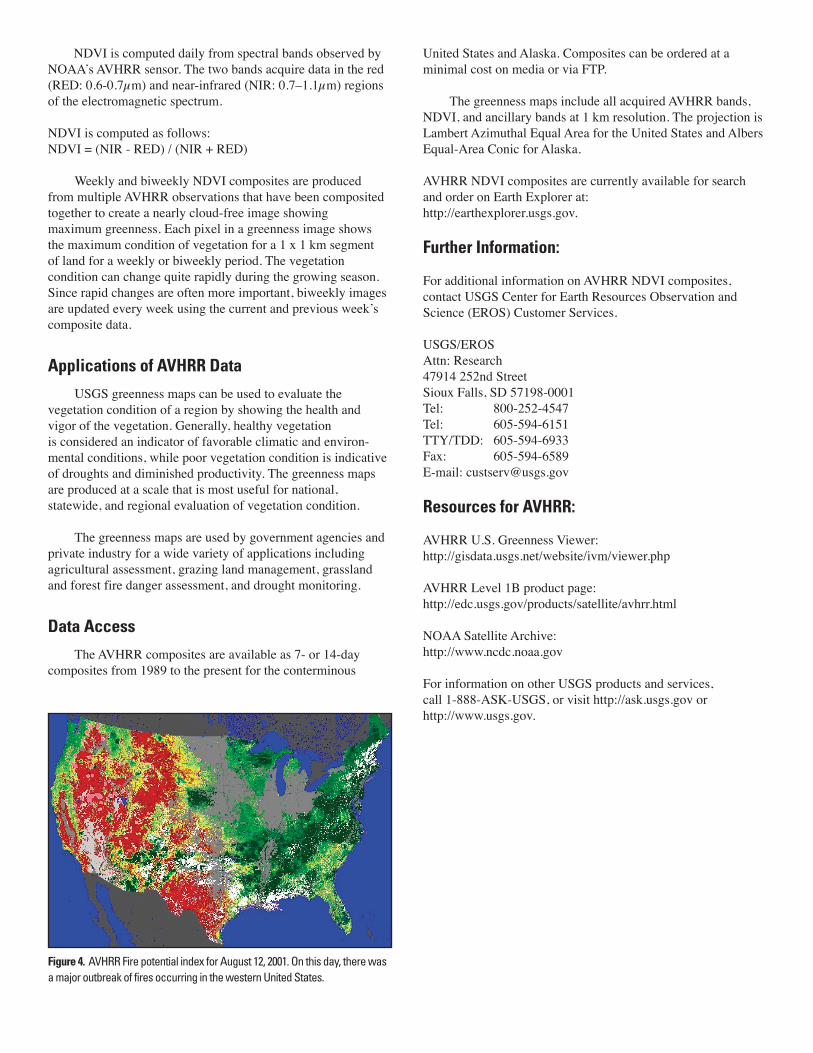
Figure 3. Greenness map for Alaska, August 10 - 23, 2005.
Figure 1. The AVHRR sensor aboard the NOAA POES Satellite. Image courtesy of NOAA.
Figure 2. Greenness map for the conterminous United States, August 10 - 23, 2005.
NDVI is computed daily from spectral bands observed by NOAA’s AVHRR sensor. The two bands acquire data in the red (RED: 0.6-0.7µm) and near-infrared (NIR: 0.7–1.1µm) regions of the electromagnetic spectrum.
NDVI is computed as follows:NDVI = (NIR - RED) / (NIR + RED)
Weekly and biweekly NDVI composites are produced from multiple AVHRR observations that have been composited together to create a nearly cloud-free image showing maximum greenness. Each pixel in a greenness image shows the maximum condition of vegetation for a 1 x 1 km segment of land for a weekly or biweekly period. The vegetation condition can change quite rapidly during the growing season. Since rapid changes are often more important, biweekly images are updated every week using the current and previous week’s composite data.
Applications of AVHRR Data
USGS greenness maps can be used to evaluate the vegetation condition of a region by showing the health and vigor of the vegetation. Generally, healthy vegetation is considered an indicator of favorable climatic and environ-mental conditions, while poor vegetation condition is indicative of droughts and diminished productivity. The greenness maps are produced at a scale that is most useful for national, statewide, and regional evaluation of vegetation condition.
The greenness maps are used by government agencies and private industry for a wide variety of applications including agricultural assessment, grazing land management, grassland and forest fire danger assessment, and drought monitoring.
Data Access
The AVHRR composites are available as 7- or 14-day composites from 1989 to the present for the conterminous
Figure 4. AVHRR Fire potential index for August 12, 2001. On this day, there was a major outbreak of fires occurring in the western United States.
United States and Alaska. Composites can be ordered at a minimal cost on media or via FTP.
The greenness maps include all acquired AVHRR bands, NDVI, and ancillary bands at 1 km resolution. The projection is Lambert Azimuthal Equal Area for the United States and Albers Equal-Area Conic for Alaska.
AVHRR NDVI composites are currently available for search and order on Earth Explorer at:http://earthexplorer.usgs.gov.
Further Information:
For additional information on AVHRR NDVI composites, contact USGS Center for Earth Resources Observation and Science (EROS) Customer Services.
USGS/EROSAttn: Research47914 252nd StreetSioux Falls, SD 57198-0001Tel: 800-252-4547Tel: 605-594-6151TTY/TDD: 605-594-6933Fax: 605-594-6589E-mail: [email protected]
Resources for AVHRR:
AVHRR U.S. Greenness Viewer:http://gisdata.usgs.net/website/ivm/viewer.php
AVHRR Level 1B product page:http://edc.usgs.gov/products/satellite/avhrr.html
NOAA Satellite Archive:http://www.ncdc.noaa.gov
For information on other USGS products and services, call 1-888-ASK-USGS, or visit http://ask.usgs.gov or http://www.usgs.gov.


![arXiv:1705.03260v1 [cs.AI] 9 May 2017 · 2018. 10. 14. · Vegetables2 Normalized Log Size Vehicles1 Normalized Log Size Vehicles2 Normalized Log Size Weapons1 Normalized Log Size](https://static.fdocuments.net/doc/165x107/5ff2638300ded74c7a39596f/arxiv170503260v1-csai-9-may-2017-2018-10-14-vegetables2-normalized-log.jpg)