Title of Presentation - vert-dpf.eu€¦ · • Testing is Worst Case oriented ... specific...
71
1 Quality Control of Emission Control Systems Certification, IUC-Inspection and Maintenance Andreas C.R.Mayer The VERT Scientific Committee VERT-Workshop within AQM2016-Conference Tehran Jan.2016
Transcript of Title of Presentation - vert-dpf.eu€¦ · • Testing is Worst Case oriented ... specific...

1
Quality Controlof Emission Control Systems
Certification, IUC-Inspection and
Maintenance
Andreas C.R.Mayer
The VERT Scientific Committee
VERT-Workshop within AQM2016-Conference Tehran Jan.2016
What is VERT ?
1. VERT =
Verification of Emission Reduction Technologies
2. VERT is a Diesel Particle Filter Testing, Certification and Quality Control System
3. VERT is a Trade Mark
for Particle Filters of Best Available Technology
4. VERT is a non-profit Association (based in CH) of Filter Manufacturers, Engine Builders and Associates – 24 members
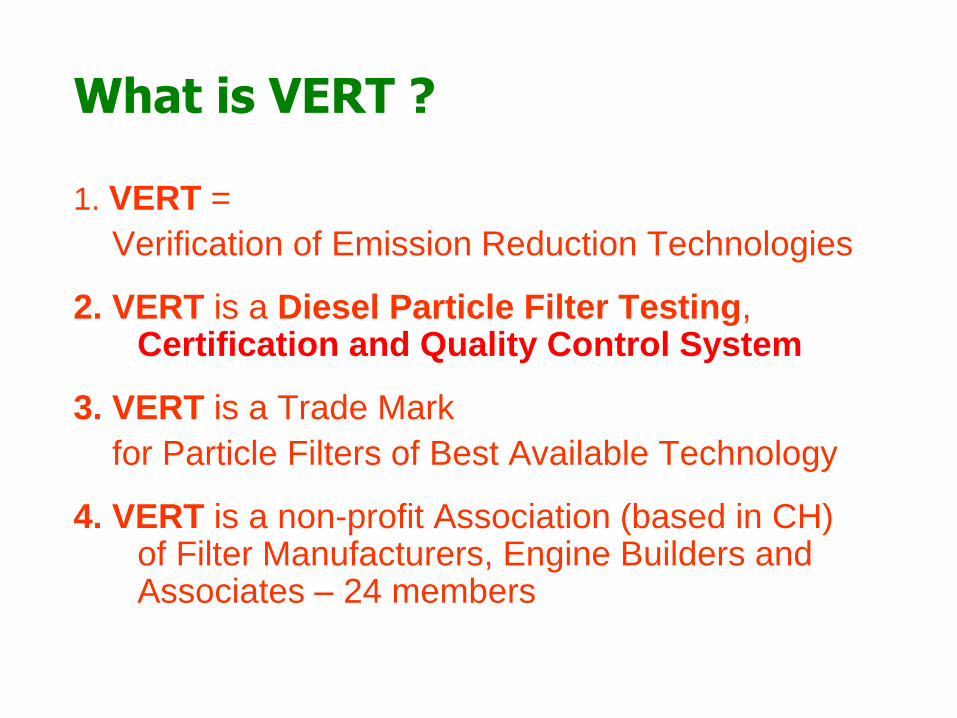
• In Depth Testing of Exhaust Gas Filter Structures for Nanoscale Filtration (Physical Properties)
• In Depth Testing Chemical Phenomena in Exhaust Gas Filter Structures
• Testing a complete DPF system
• Type Approval of one filter per filter family
• Endurance Testing on Typical Vehicle Application
• Testing is Worst Case oriented
• Best Available Technology is the moving Target
Testing of each Combination Filter + Engine not required
Concept of VERT-Testing
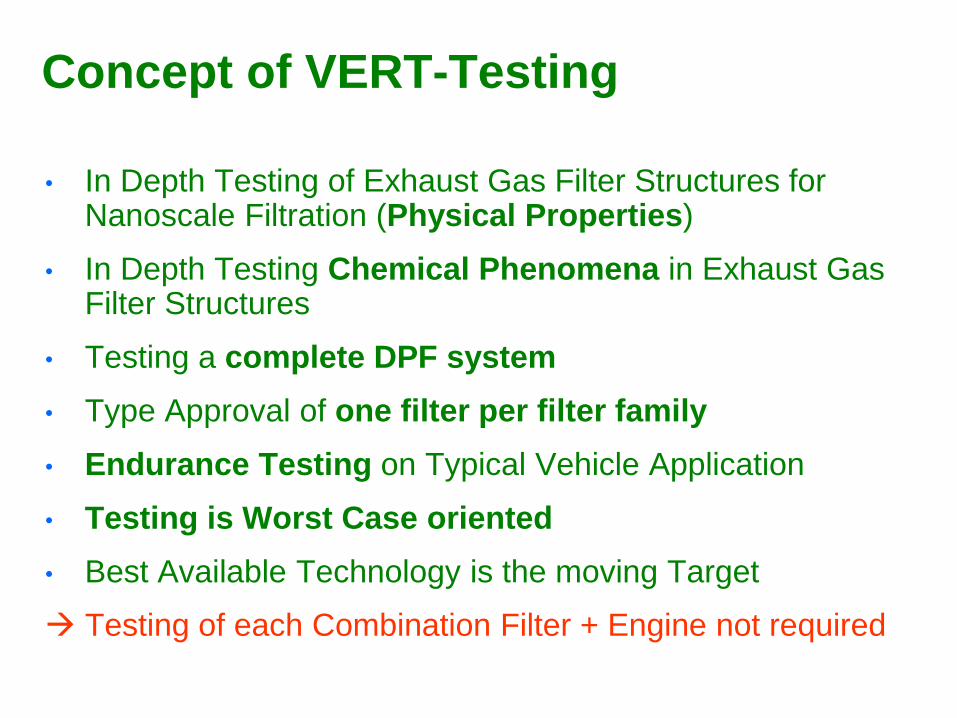
DOC Reduction CO, HC
Production
NO NO2
SO2 O3
No Effect on Particles(M.Maricq)
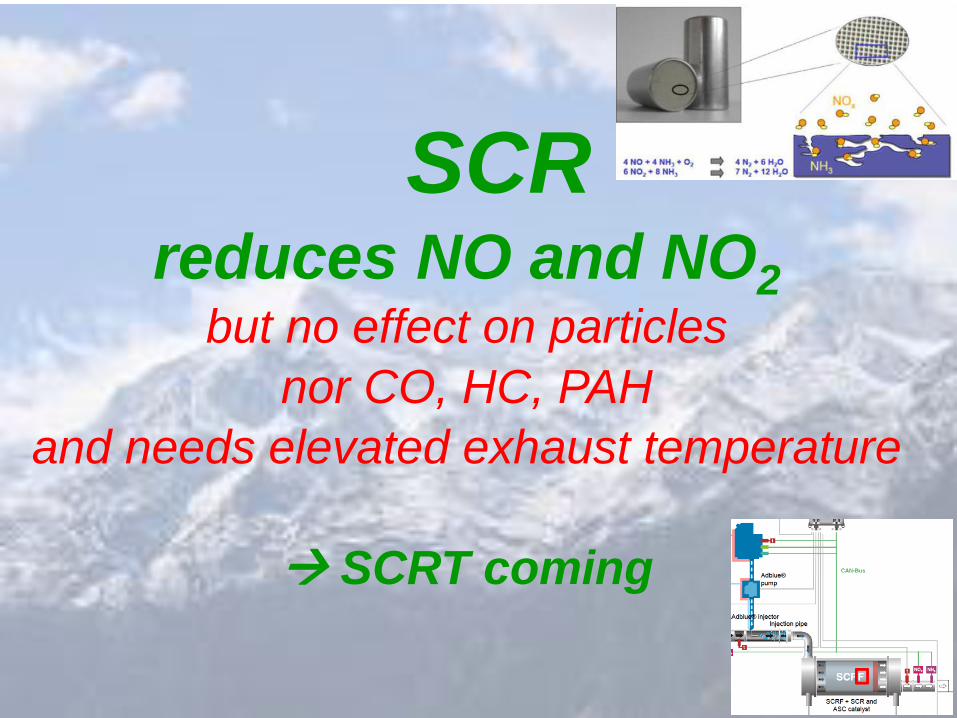
SCR reduces NO and NO2
but no effect on particles
nor CO, HC, PAH
and needs elevated exhaust temperature
SCRT coming
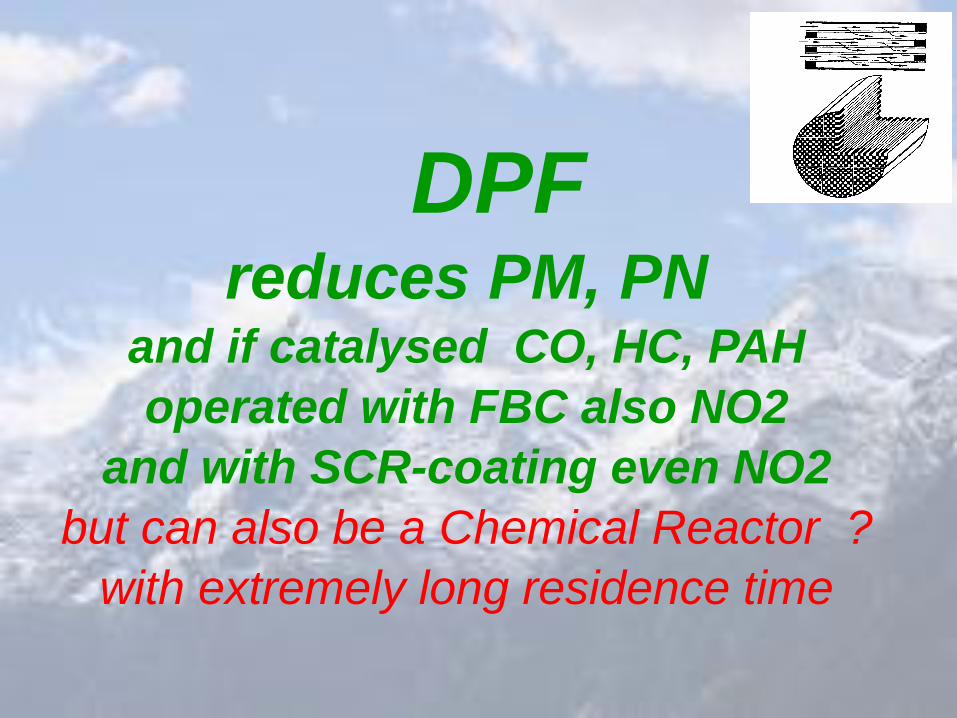
DPF reduces PM, PN
and if catalysed CO, HC, PAH
operated with FBC also NO2
and with SCR-coating even NO2
but can also be a Chemical Reactor ?
with extremely long residence time
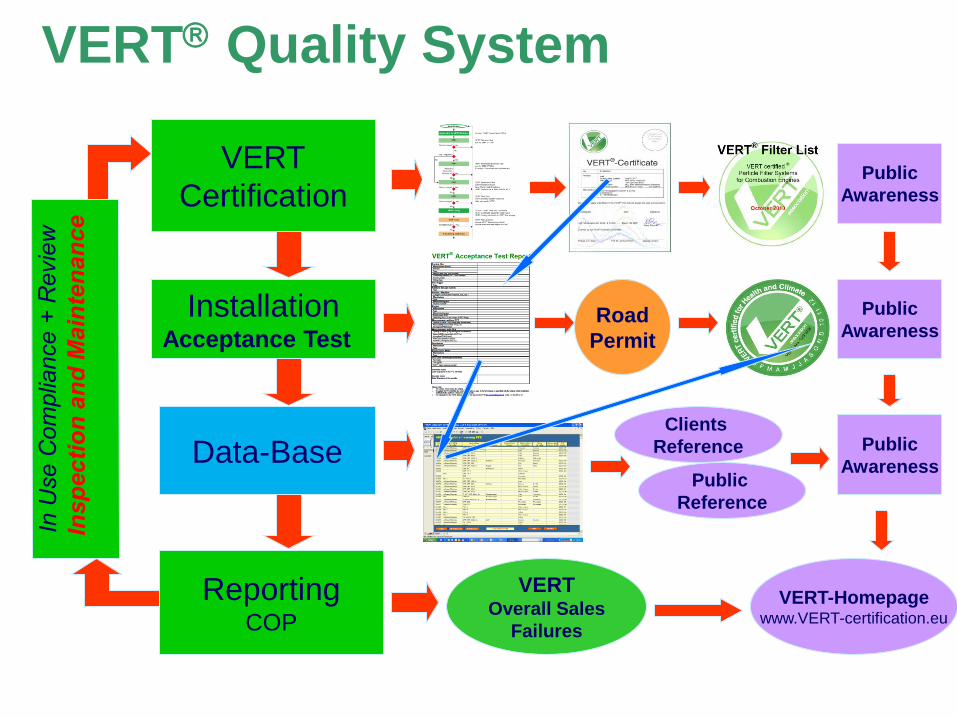
VERT Quality System
VERT
CertificationPublic
Awareness
InstallationAcceptance Test
Data-Base
ReportingCOP
Public
Awareness
Public
Awareness
VERT-Homepagewww.VERT-certification.eu
Road
Permit
Clients
Reference
Public
Reference
VERTOverall Sales
Failures
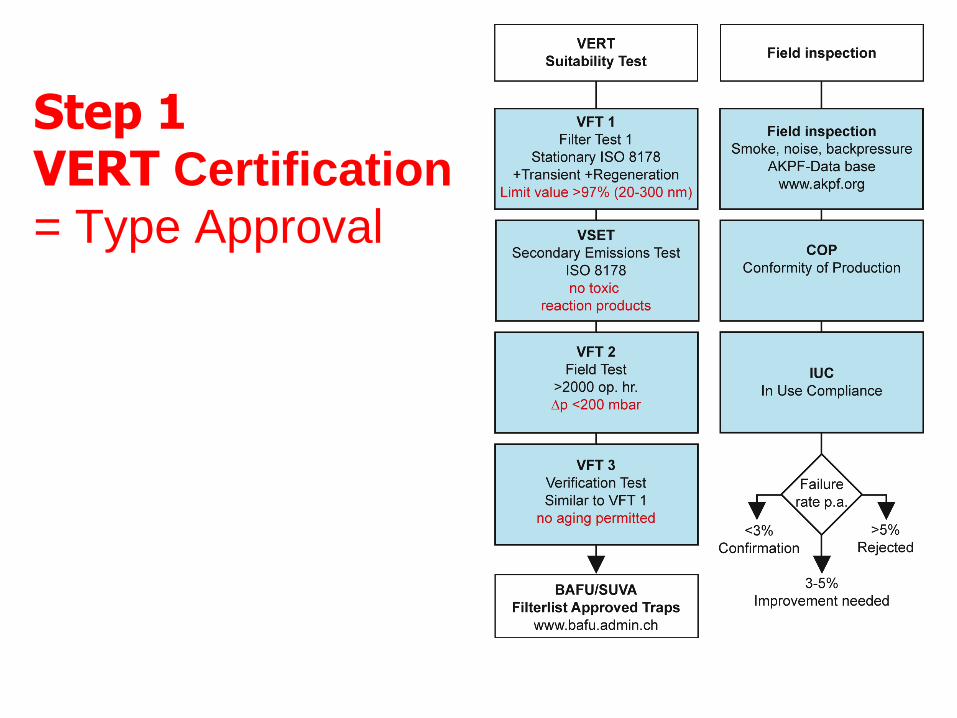
Step 1VERT Certification
= Type Approval
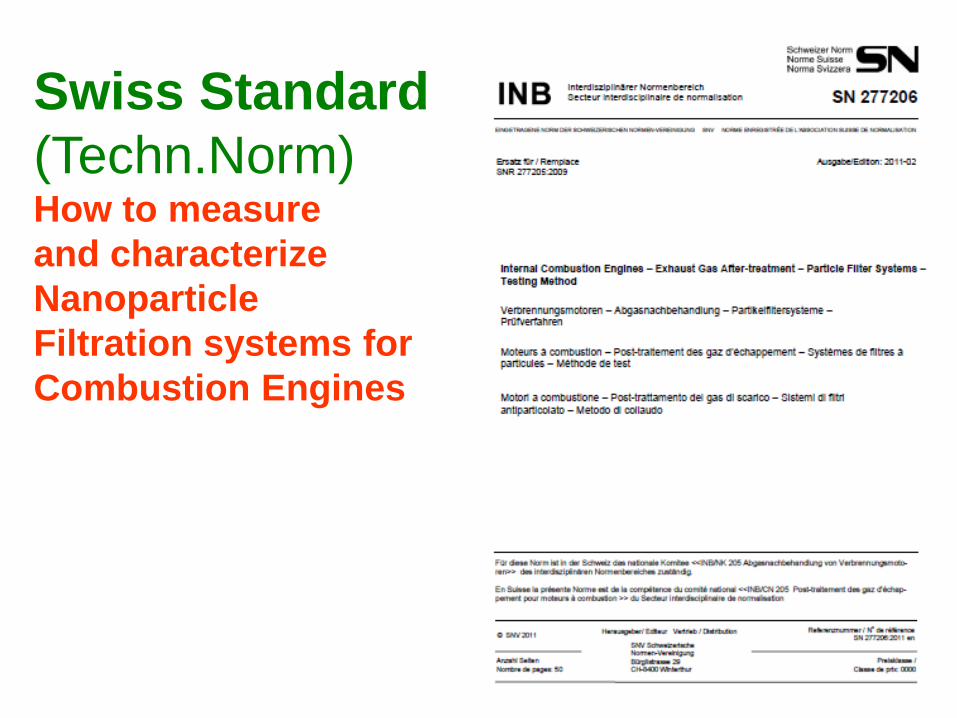
Swiss Standard
(Techn.Norm)How to measure
and characterize
Nanoparticle
Filtration systems for
Combustion Engines

Test Setup
1000
1100
1200
1400
1500
1600
1700
1800
1900
2000
Liebherr D 934 S A6
0
50
100
600 800 1000 1200 1400 1600 1800 2000 2200
engine speed [rpm]
6
load
[%
]
55
1
2
3
4
8
7
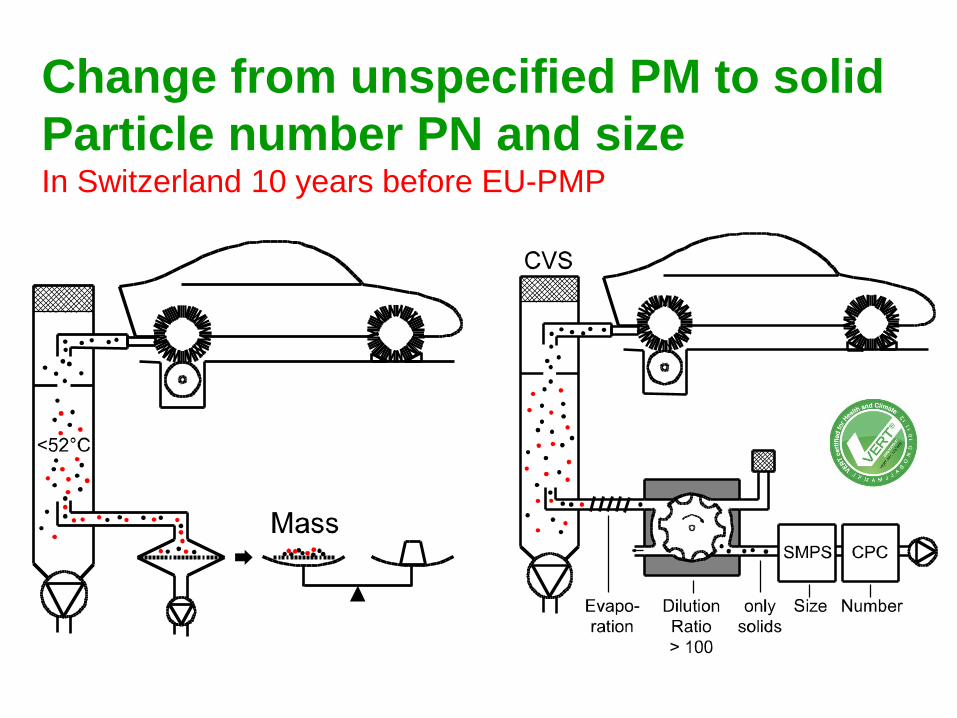
Change from unspecified PM to solid
Particle number PN and size In Switzerland 10 years before EU-PMP
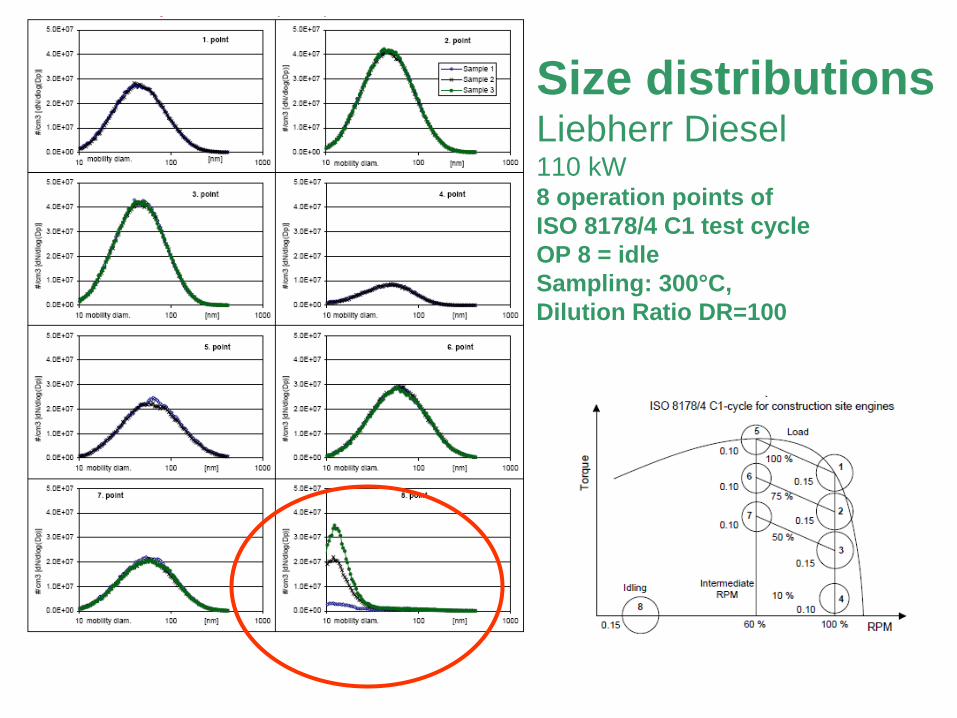
Size distributionsLiebherr Diesel110 kW8 operation points of
ISO 8178/4 C1 test cycle
OP 8 = idle
Sampling: 300°C,
Dilution Ratio DR=100
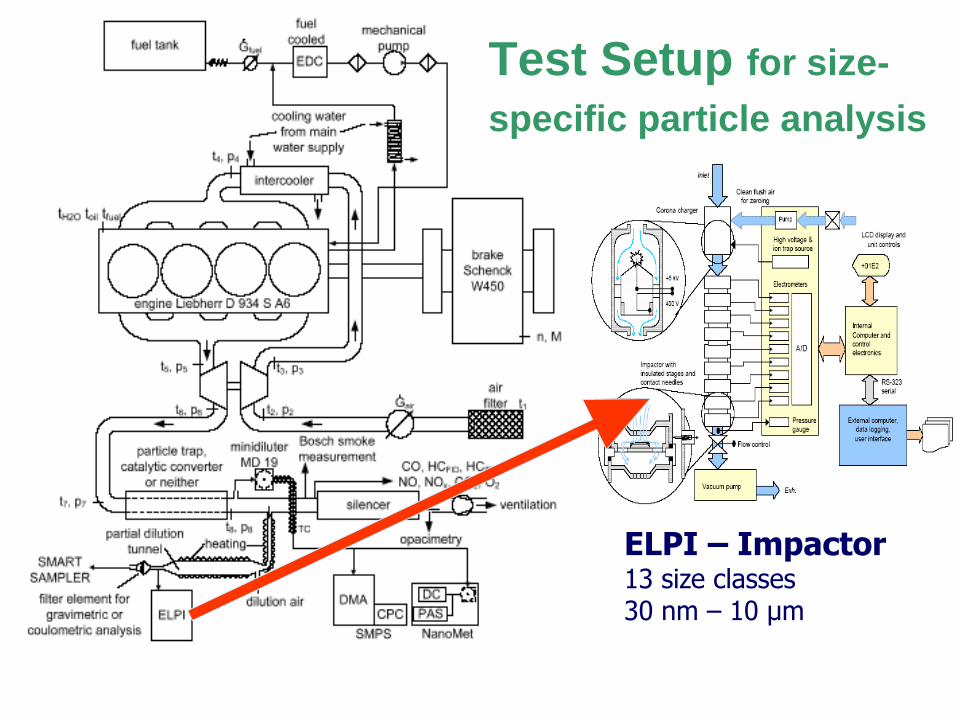
Test Setup for size-
specific particle analysis
ELPI – Impactor13 size classes 30 nm – 10 μm

0.0E+00
2.4E+05
4.8E+05
7.2E+05
9.6E+05
1.2E+06
0 4 8 12 16 20
LQ
1 D
C [
mm
2/c
m3]
time [s]
Free acceleration with DC, with / without DPF
measurement 4 measurement 5 measurement 6
w/o DPF
with DPF
Extreme Transients « free acceleration »
with DC-signal, with / without DPF

Main requirements of
VERT filter test
• High filter efficiency 97 %: highest space velocity, highest temperature, clean,loaded,regenerated and during regeneration new and aged, all particle sizes 20-500 nm
• No secondary emissions
• Durability of filter quality
• Regeneration of the filter

1.0E+0
1.0E+1
1.0E+2
1.0E+3
1.0E+4
1.0E+5
1.0E+6
1.0E+7
10 100 1000diameter [nm]
co
nce
ntr
atio
n d
W [
cm
-3]
without
particle trap
ambient air
Octimax
stand. fuel
Liebherr D914 T, 2000 min-1/ full load
(20 ppm Fe + 5 ppm Sr)
with
particle trap
stand. fuel
Octimax
Measurement
must be by
Number
and Size
to show that
Filtration
Effectiveness
is > 99 %
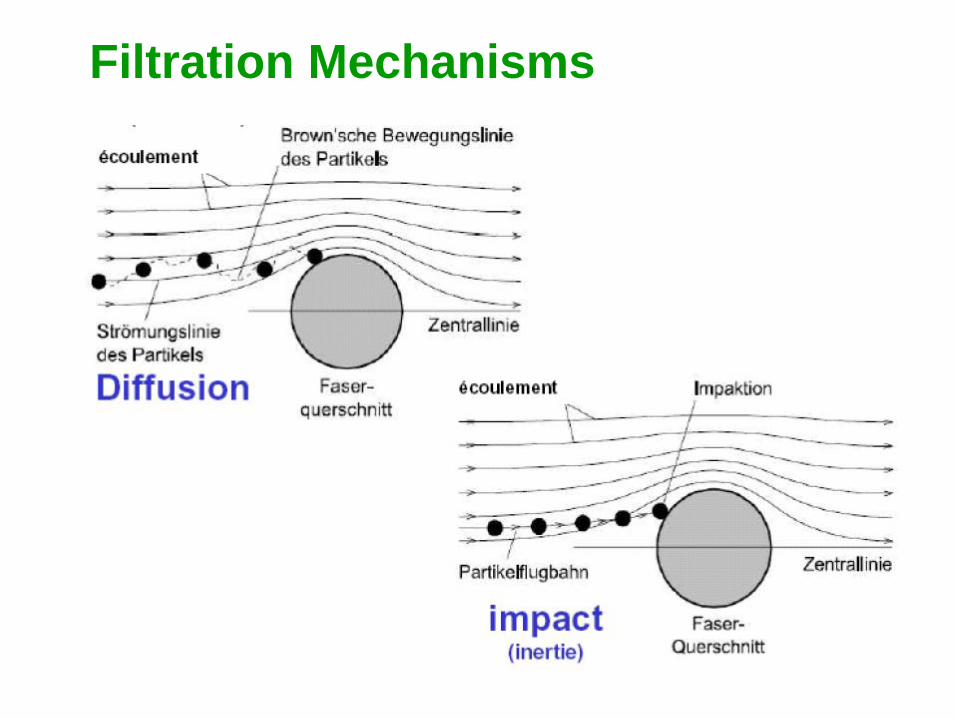
Filtration Mechanisms

Filtration Risk in the Middle Size Range

Strange Coincidence
The most sensitive size
range of the Lungs
is the most intensive
emission range of the
Engines
and the weakest size range
of Filtration
The Lung is an open door
for engine emitted ultrafine
particles in this size range

Particle Emission
of ICE
DieselSootpeak: 80 nm; 106
Ashpeak: 10 nm; 107
Petrol
Sootpeak: 40 nm; 105
Ashpeak: 10 nm; 107
Soot and Ash Peaks
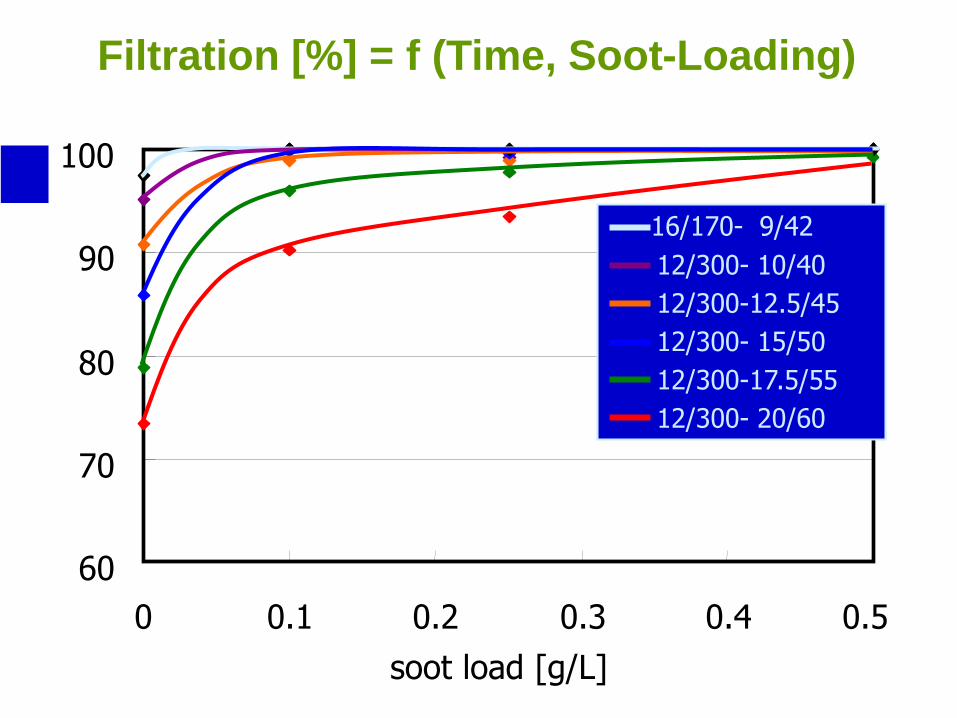
Filtration [%] = f (Time, Soot-Loading)
60
70
80
90
100
0 0.1 0.2 0.3 0.4 0.5
soot load [g/L]
16/170- 9/42
12/300- 10/40
12/300-12.5/45
12/300- 15/50
12/300-17.5/55
12/300- 20/60

Secondary EmissionsToxics generated in the Filter/Catalyst system
• VERT approved DPF systems do not release secondary emissions in relevant amounts, e.g.
• NO2, Dioxins/Furans, PAH, Nitro-PAH etc.
• Sulfuric acid aerosols
• Metal oxide (Ash) particles, mineral fibers etc.
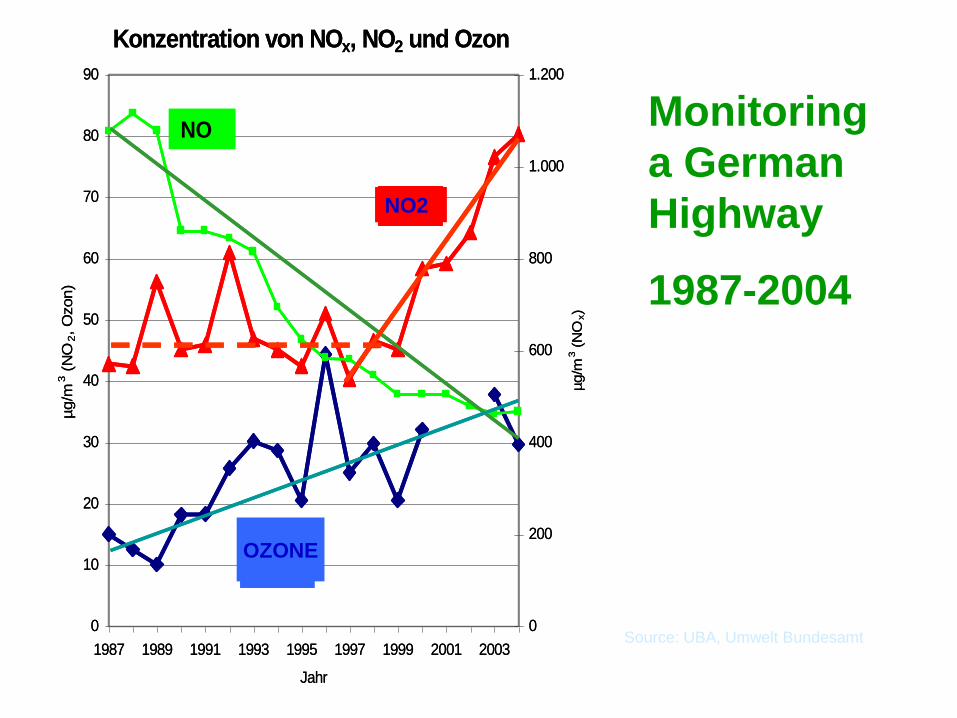
Monitoring
a German
Highway
1987-2004
Konzentration von NOx, NO2 und Ozon
0
10
20
30
40
50
60
70
80
90
1987 1989 1991 1993 1995 1997 1999 2001 2003
Jahr
µg/m
3 (
NO
2, O
zon)
0
200
400
600
800
1.000
1.200
µg/m
3 (
NO
x)
NO
Ozo
ne
NO2
Konzentration von NOx, NO2 und Ozon
0
10
20
30
40
50
60
70
80
90
1987 1989 1991 1993 1995 1997 1999 2001 2003
Jahr
µg/m
3 (
NO
2, O
zon)
0
200
400
600
800
1.000
1.200
µg/m
3 (
NO
x)
NO
Ozo
ne
NO2
OZONE
NO2
Source: UBA, Umwelt Bundesamt

NONO2
Conversion due to
PMG Catalysis
but non-PMG-
catalysts and FBC
can avoid this
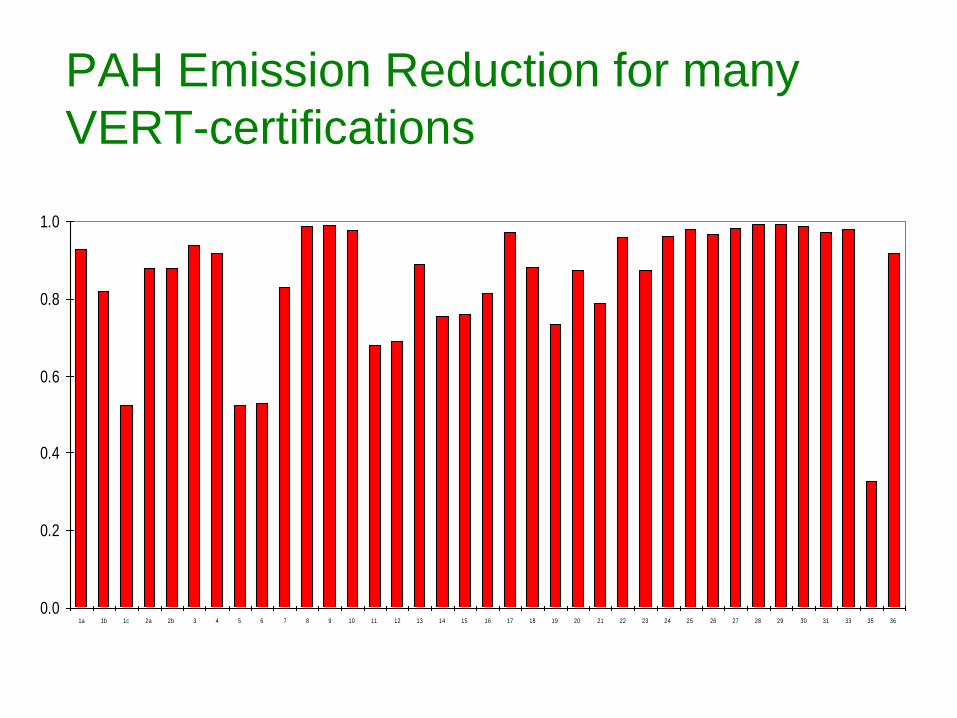
PAH Emission Reduction for many
VERT-certifications
Conversion of carcinogenic PAHs
0.0
0.2
0.4
0.6
0.8
1.0
1a 1b 1c 2a 2b 3 4 5 6 7 8 9 10 11 12 13 14 15 16 17 18 19 20 21 22 23 24 25 26 27 28 29 30 31 33 35 36
[-/-
]

CuCeFe
100 ppm
40
1925
34 29 29
110
11100
77600
1160
1
10
100
1000
10000
100000
1000000
HO
HM
HE
O
HE
M
HC
O
HC
M
HK
O
HK
M
XK
O
XK
M
[pg/l
with DPF
w/o DPF
Chlorine: 11 ppm
Formation of Dioxins in a Filter
System using Cu-FBC

Durability Test (Field test) 2000 hrs
VERT approved DPF systems must undergo a field test of at least 2000 operating hours
Do be done in a typical application of the specific DPF system (i.e. stationary or mobile application resp.)
With periodic tests of filter performance, back pressure, regeneration, control and alert systems, mechanical construction etc.
Followed by a full filter test on bench VFT3 no aging or deterioration permitted
Filter Regeneration
• During filter operation, the filter fills with filtered soot which must be removed
• Soot is carbon, i.e. can be burnt in the filter
• This so called „regeneration“ of the filter is very important for a good functioning
• Filter regeneration is carefully tested in the VERT filter test
• Emission during Regeneration is measured online and limited
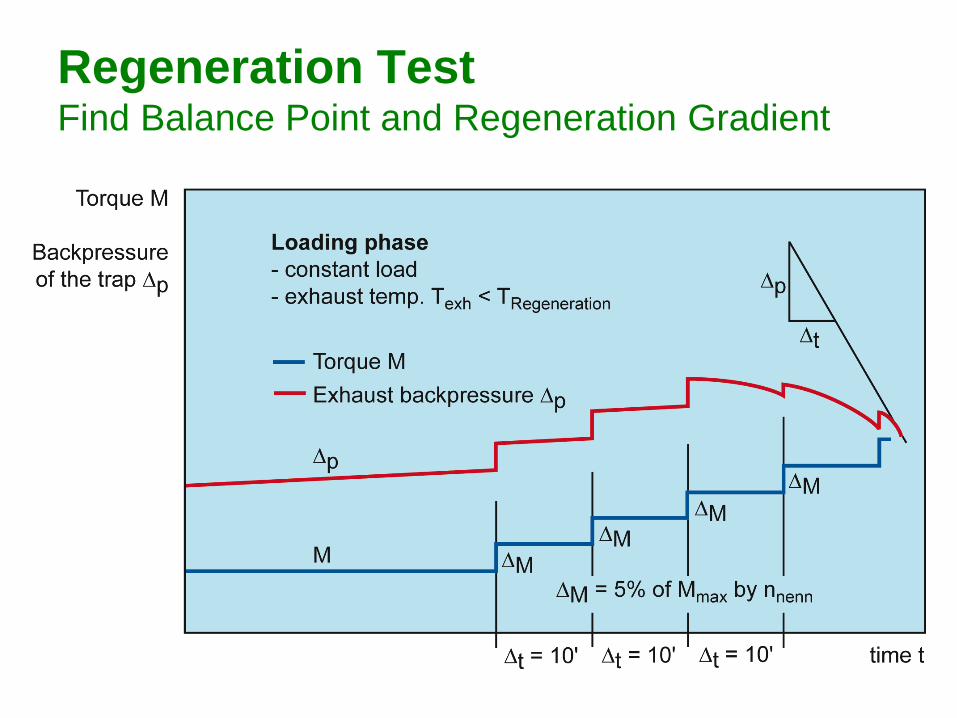
Regeneration Test Find Balance Point and Regeneration Gradient
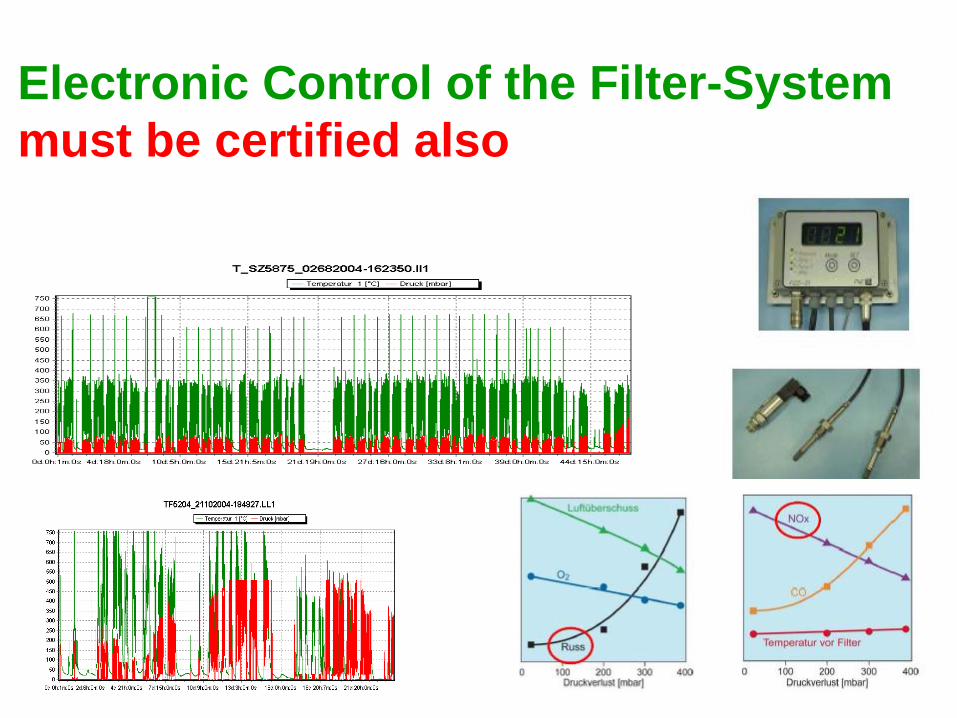
Electronic Control of the Filter-System
must be certified also
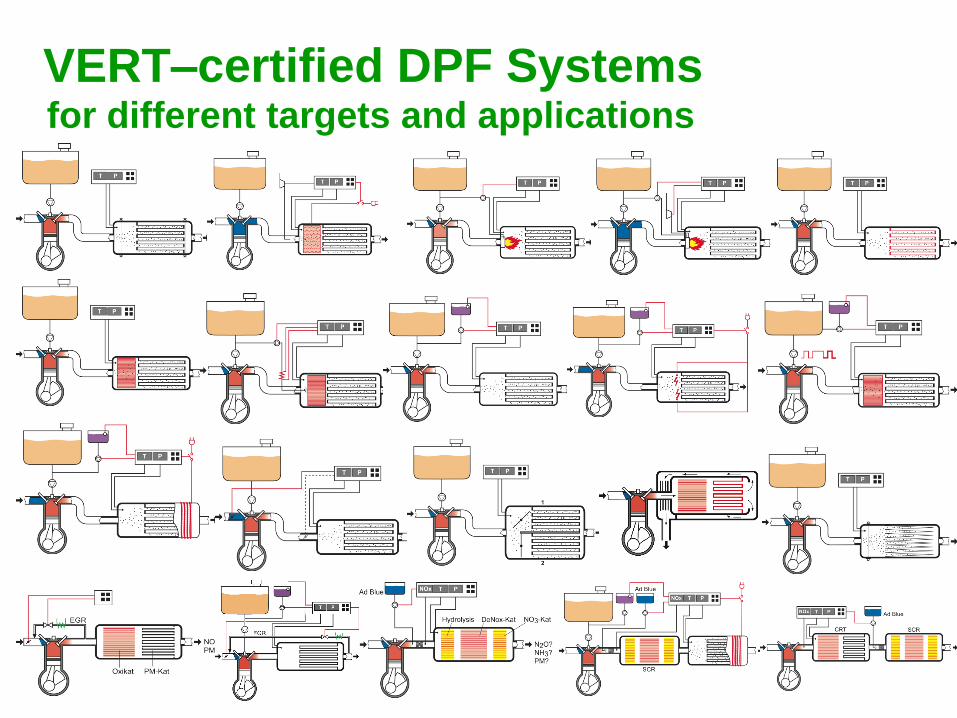
VERT–certified DPF Systemsfor different targets and applications
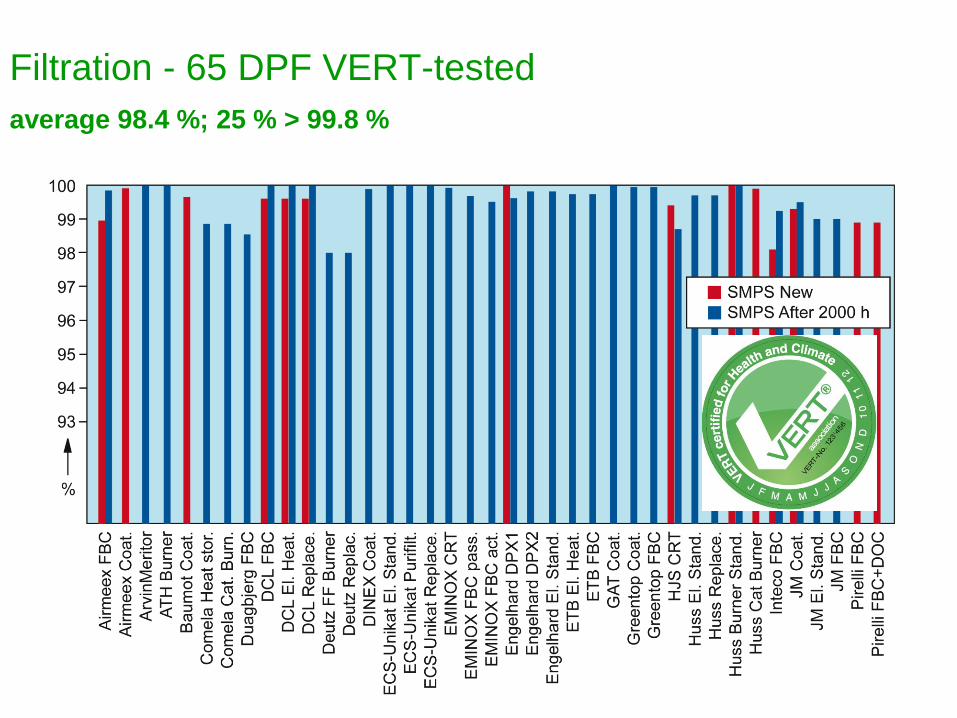
Filtration - 65 DPF VERT-tested
average 98.4 %; 25 % > 99.8 %

VERT– Reports
for DPF Systems are confidential
By now 443 reports
VERT
Filter List
65 Certifications
First Publication 1998
Published on VERT-homepage
www.VERT-certified.eu
Updated whenever modified
Responsible:
VERT-Scientific Committee
Language: English only
VERT is recognized worldwide by
BAFU, SUVA, ASTRA, BAV - Switzerland
AUVA, Wien, Tirol - Austria
BG Bau, UBA, TRGS 554 –Germany
CARB, MSHA, NY City – USA
VROM – Netherlands
Alto Adige – Italy
Santiago de Chile
Columbia-Bogotá
DEEP – Canada
London LEZ – UK
Denmark LEZ
Tehran – IRAN
Australia
Mexico
China
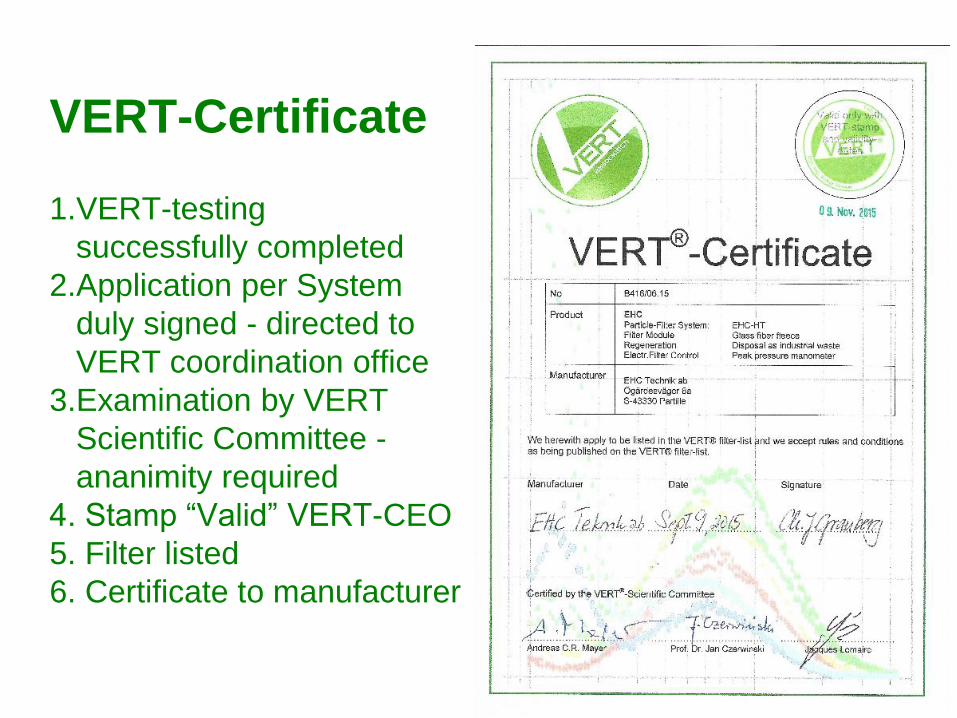
VERT-Certificate
1.VERT-testing
successfully completed
2.Application per System
duly signed - directed to
VERT coordination office
3.Examination by VERT
Scientific Committee -
ananimity required
4. Stamp “Valid” VERT-CEO
5. Filter listed
6. Certificate to manufacturer
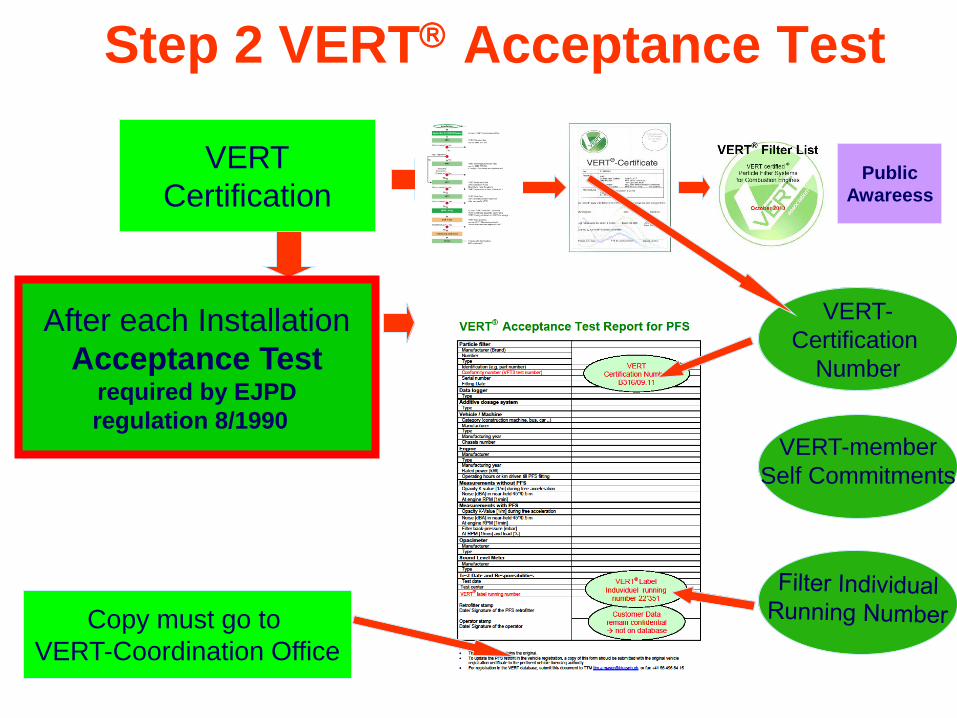
Step 2 VERT Acceptance Test
VERT
CertificationPublic
Awareess
After each Installation
Acceptance Testrequired by EJPD
regulation 8/1990
VERT-
Certification
Number
VERT-member
Self Commitments
Copy must go to
VERT-Coordination Office
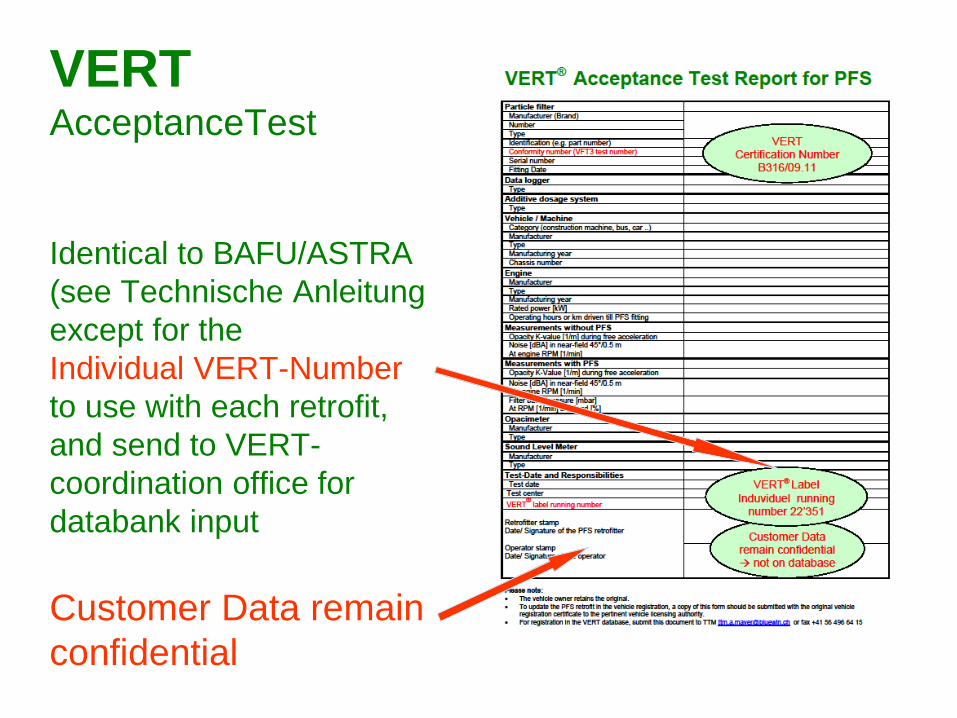
VERT AcceptanceTest
Identical to BAFU/ASTRA
(see Technische Anleitung
except for the
Individual VERT-Number
to use with each retrofit,
and send to VERT-
coordination office for
databank input
Customer Data remain
confidential
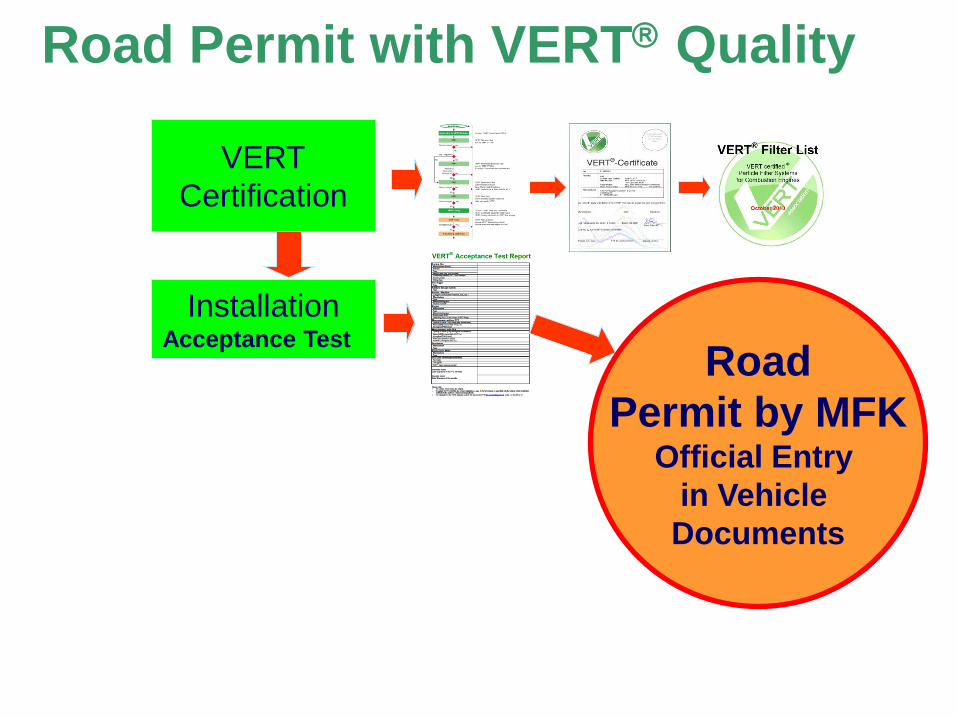
Road Permit with VERT Quality
VERT
Certification
InstallationAcceptance Test
Road
Permit by MFKOfficial Entry
in Vehicle
Documents
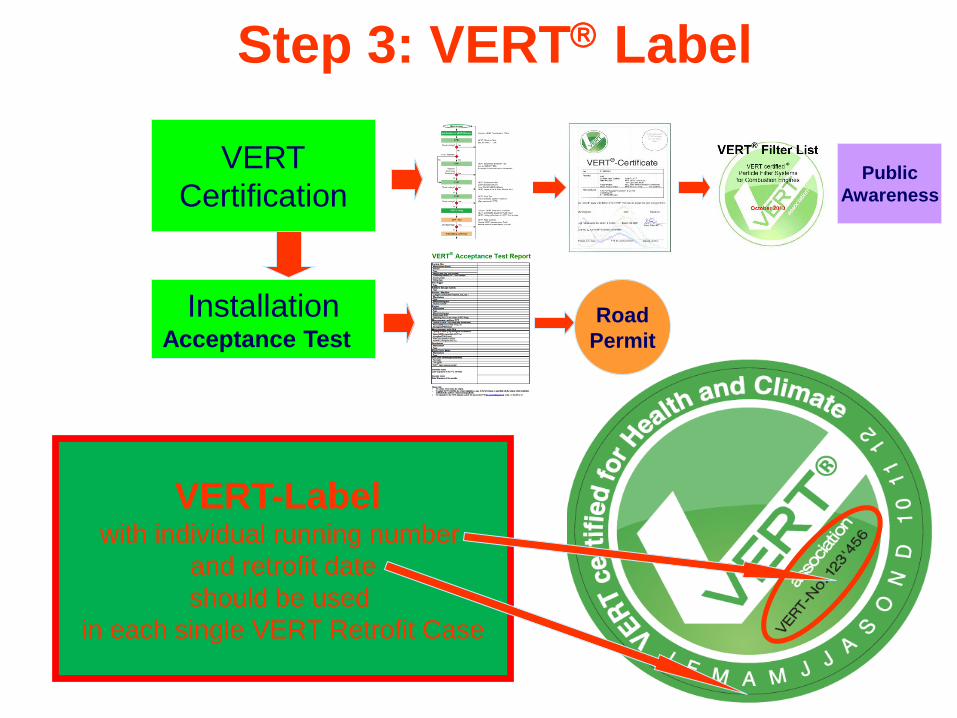
Step 3: VERT Label
VERT
CertificationPublic
Awareness
InstallationAcceptance Test
Road
Permit
VERT-Label with individual running number
and retrofit date
should be used
in each single VERT Retrofit Case
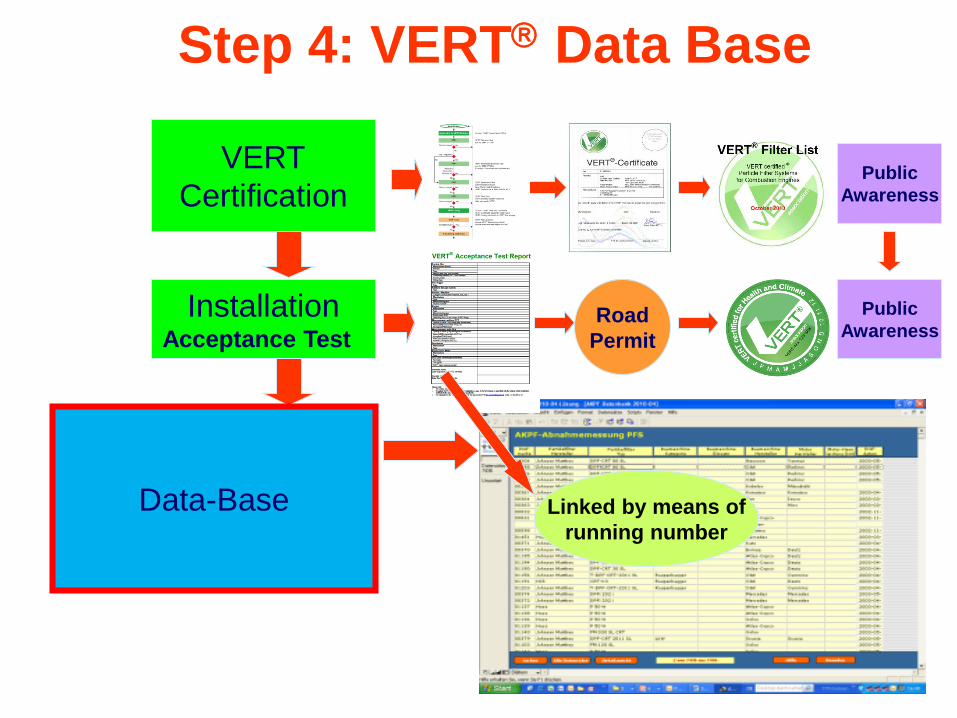
Step 4: VERT Data Base
VERT
CertificationPublic
Awareness
InstallationAcceptance Test
Data-Base
Public
AwarenessRoad
Permit
Linked by means of
running number
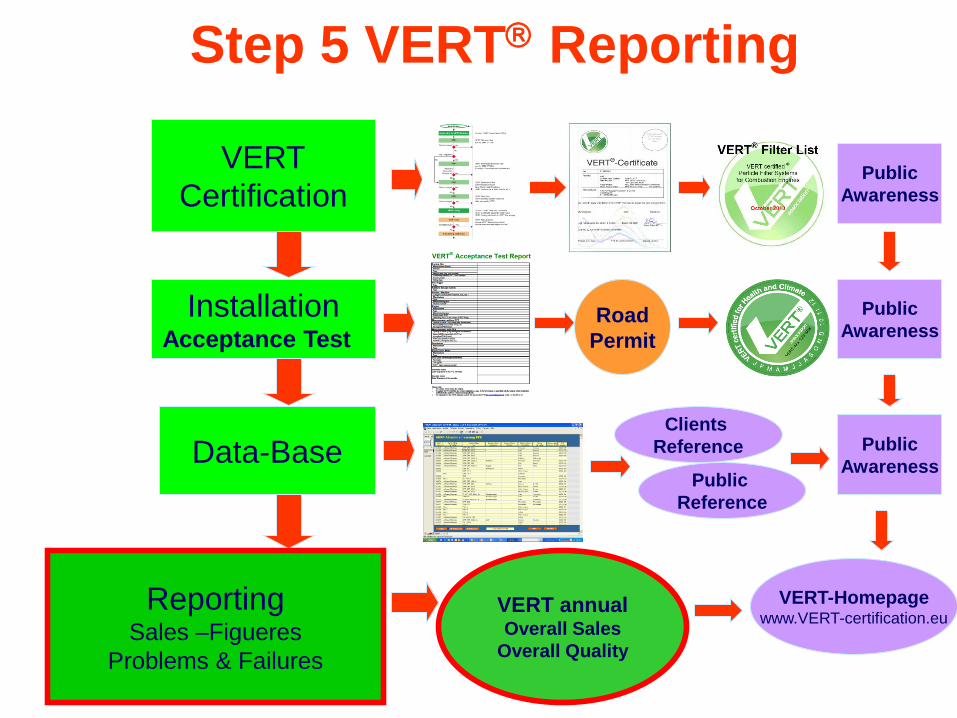
Step 5 VERT Reporting
VERT
CertificationPublic
Awareness
InstallationAcceptance Test
Data-Base
ReportingSales –Figueres
Problems & Failures
Public
Awareness
Public
Awareness
VERT-Homepagewww.VERT-certification.eu
Road
Permit
Clients
Reference
Public
Reference
VERT annualOverall Sales
Overall Quality
Step 6 VERT IUC-Review by I&M
VERT
Certification
InstallationAcceptance Test
Data-Base
ReportingSales –Figueres
Problems & Failures
COP
Confirmation
De-Listing
Re-Verification

44
To check IUC In Use Compliance
requires measurement in-use
roadside, workshop, inspection
for all emission control functions
Filtration
Catalysis
Backpressure
Noise attenuation etc
Must be fast and at low cost
should immediately recommend
preventive maintenance
45
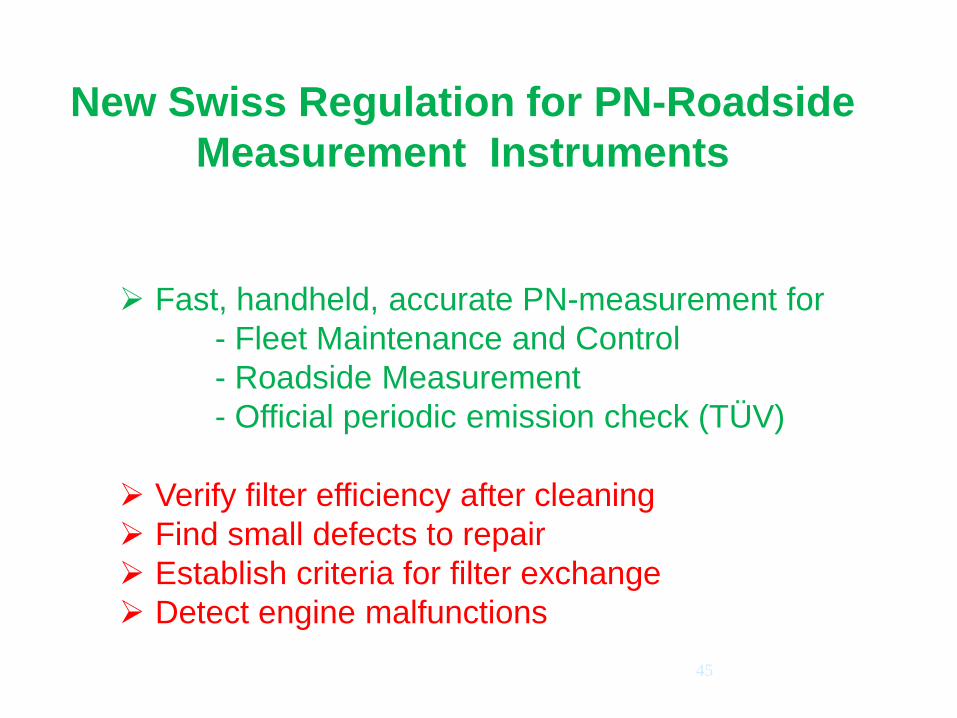
New Swiss Regulation for PN-Roadside
Measurement Instruments
Fast, handheld, accurate PN-measurement for
- Fleet Maintenance and Control
- Roadside Measurement
- Official periodic emission check (TÜV)
Verify filter efficiency after cleaning
Find small defects to repair
Establish criteria for filter exchange
Detect engine malfunctions
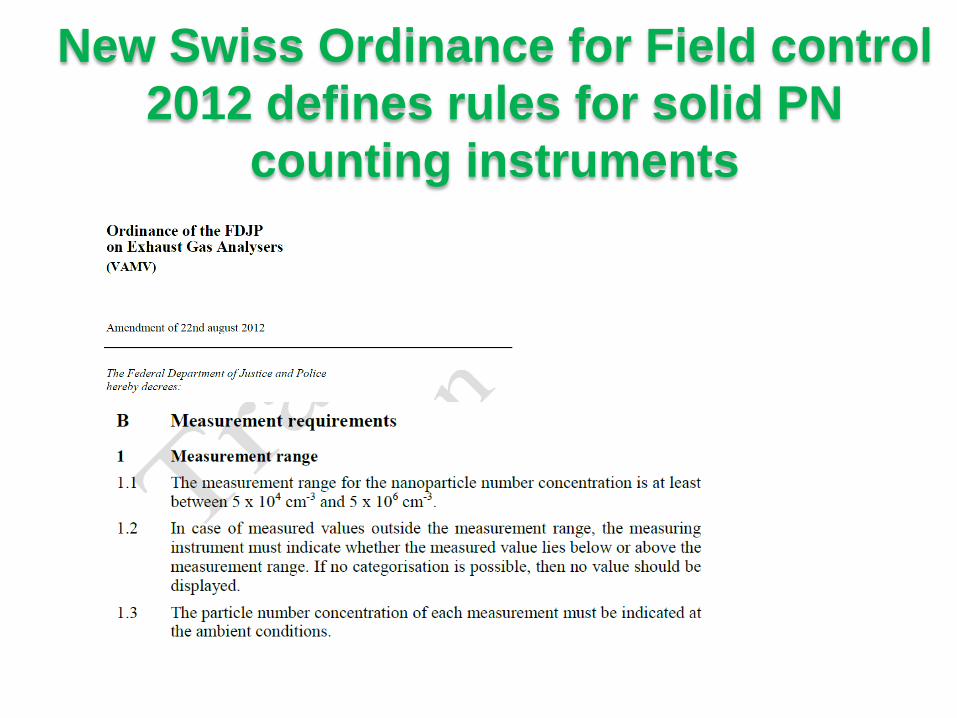
New Swiss Ordinance for Field control
2012 defines rules for solid PN
counting instruments

Requirements of Swiss Ordinancesize cut-off and particle counting efficiency
METAS = Swiss office for measurment
Instrument characteristics acc.to Swiss METAS
counting efficiency band
Size distribution without and
with filter (VERT-VSET)
48
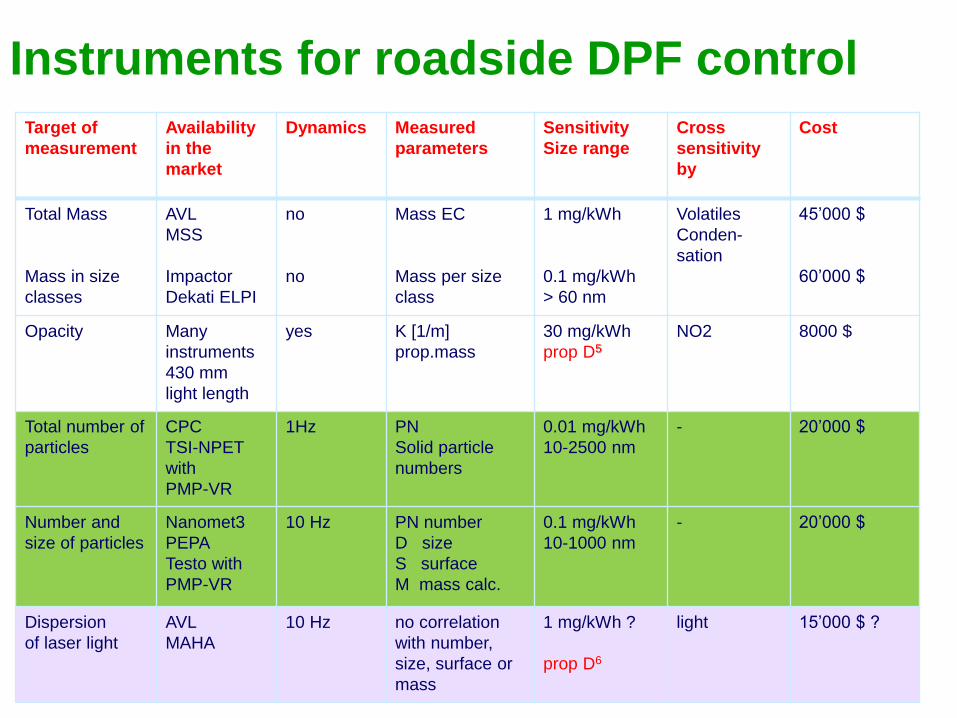
Instruments for roadside DPF control
Target of
measurement
Availability
in the
market
Dynamics Measured
parameters
Sensitivity
Size range
Cross
sensitivity
by
Cost
Total Mass
Mass in size
classes
AVL
MSS
Impactor
Dekati ELPI
no
no
Mass EC
Mass per size
class
1 mg/kWh
0.1 mg/kWh
> 60 nm
Volatiles
Conden-
sation
45’000 $
60’000 $
Opacity Many
instruments
430 mm
light length
yes K [1/m]
prop.mass
30 mg/kWh
prop D5
NO2 8000 $
Total number of
particles
CPC
TSI-NPET
with
PMP-VR
1Hz PN
Solid particle
numbers
0.01 mg/kWh
10-2500 nm
- 20’000 $
Number and
size of particles
Nanomet3
PEPA
Testo with
PMP-VR
10 Hz PN number
D size
S surface
M mass calc.
0.1 mg/kWh
10-1000 nm
- 20’000 $
Dispersion
of laser light
AVL
MAHA
10 Hz no correlation
with number,
size, surface or
mass
1 mg/kWh ?
prop D6
light 15’000 $ ?
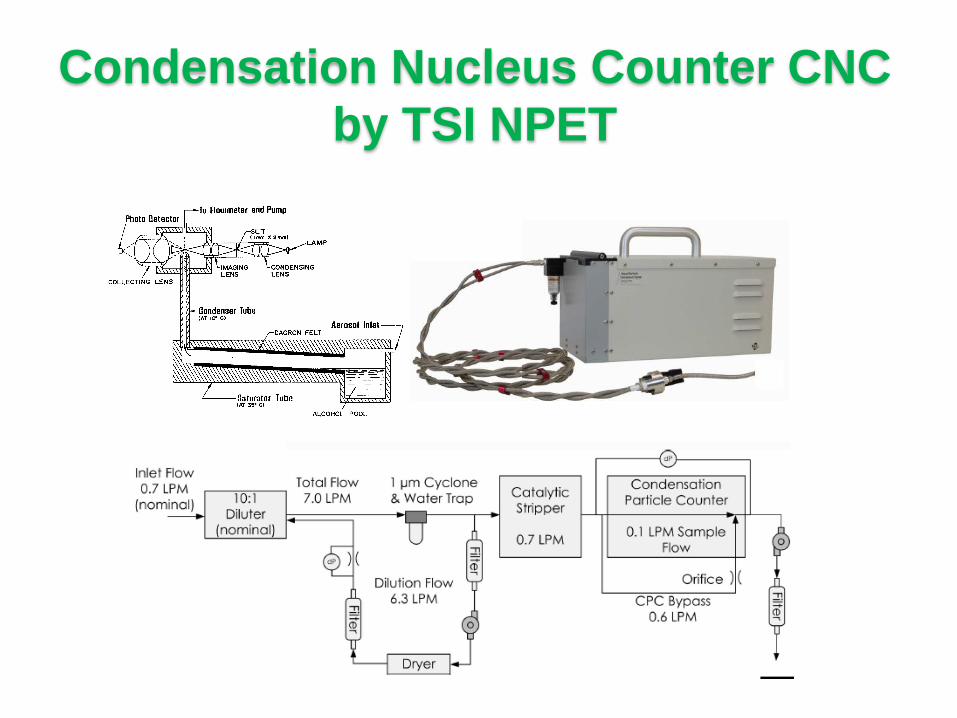
Condensation Nucleus Counter CNC
by TSI NPET
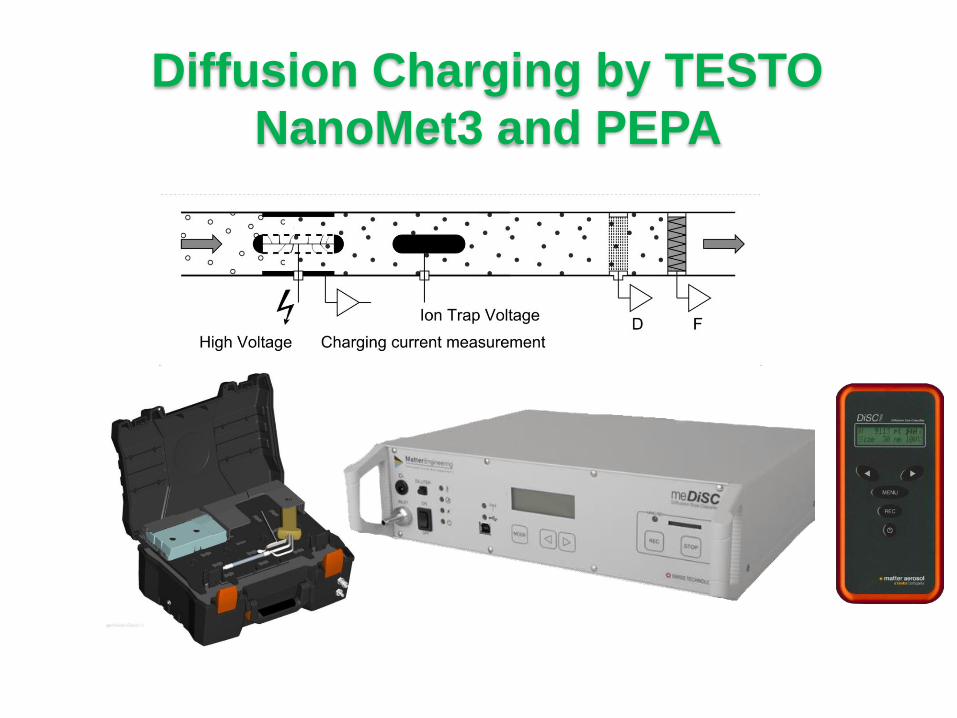
Diffusion Charging by TESTO
NanoMet3 and PEPA

Diffusion Charging by NANEOS
PARTECTOR
Partector
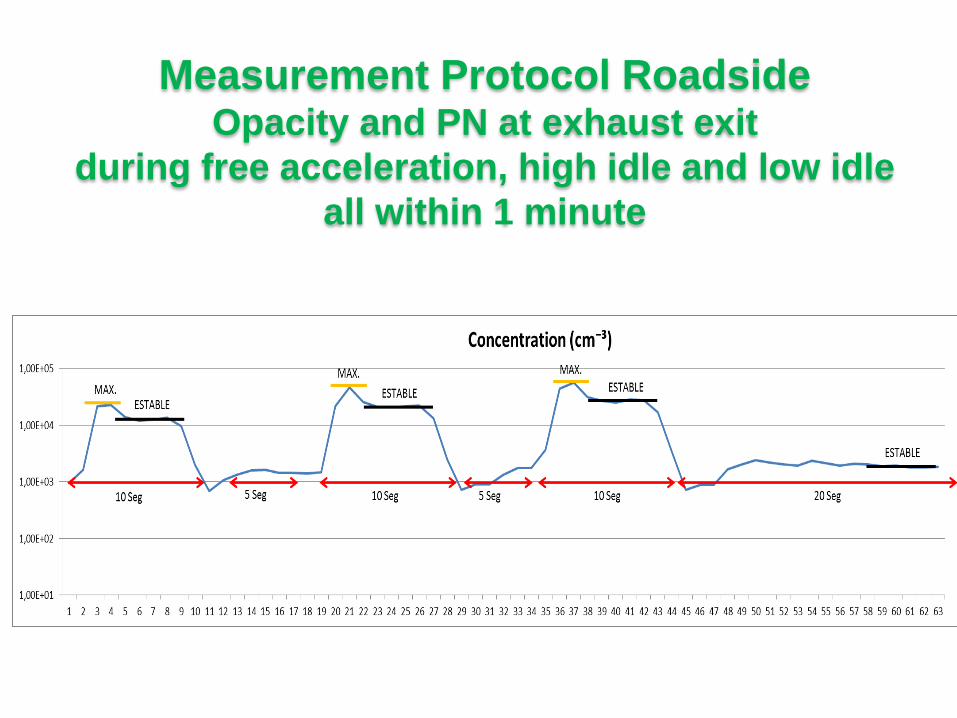
Measurement Protocol Roadside Opacity and PN at exhaust exit
during free acceleration, high idle and low idle
all within 1 minute
53
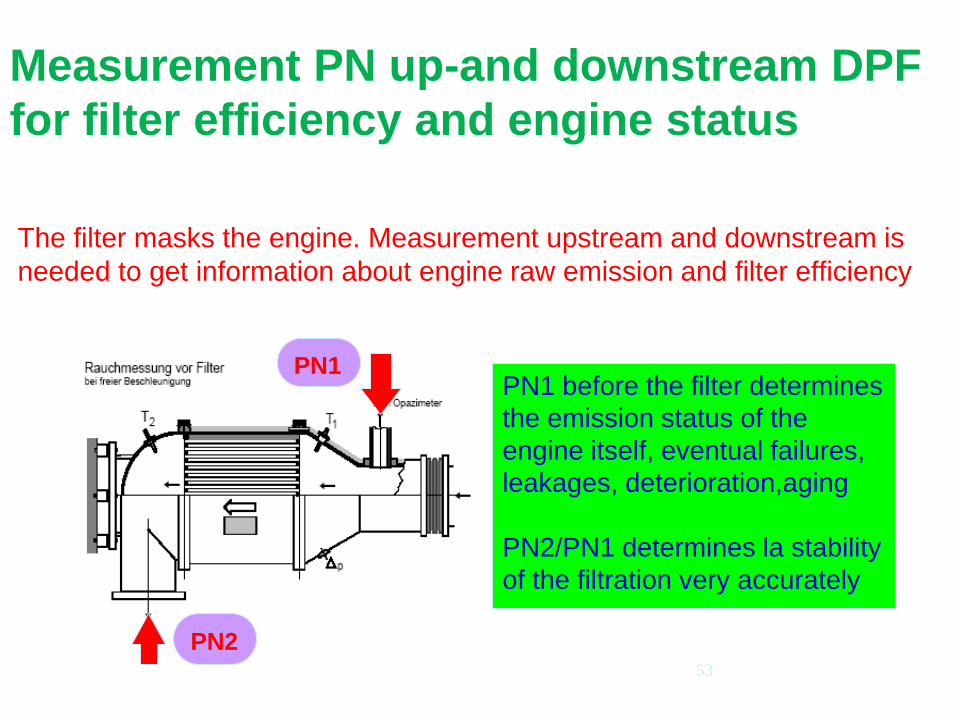
Measurement PN up-and downstream DPF
for filter efficiency and engine status
The filter masks the engine. Measurement upstream and downstream is
needed to get information about engine raw emission and filter efficiency
PN1 before the filter determines
the emission status of the
engine itself, eventual failures,
leakages, deterioration,aging
PN2/PN1 determines la stability
of the filtration very accurately
PN2
PN1
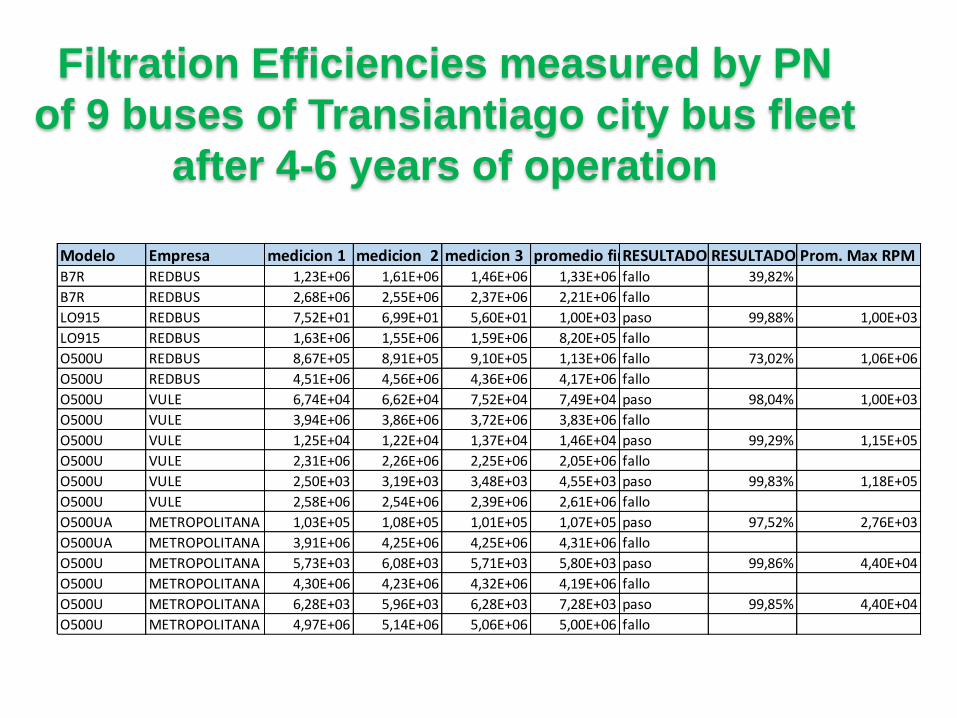
Filtration Efficiencies measured by PN
of 9 buses of Transiantiago city bus fleet
after 4-6 years of operation
Modelo Empresa medicion 1 medicion 2 medicion 3 promedio finalRESULTADO RESULTADO Prom. Max RPMB7R REDBUS 1,23E+06 1,61E+06 1,46E+06 1,33E+06 fallo 39,82%
B7R REDBUS 2,68E+06 2,55E+06 2,37E+06 2,21E+06 fallo
LO915 REDBUS 7,52E+01 6,99E+01 5,60E+01 1,00E+03 paso 99,88% 1,00E+03
LO915 REDBUS 1,63E+06 1,55E+06 1,59E+06 8,20E+05 fallo
O500U REDBUS 8,67E+05 8,91E+05 9,10E+05 1,13E+06 fallo 73,02% 1,06E+06
O500U REDBUS 4,51E+06 4,56E+06 4,36E+06 4,17E+06 fallo
O500U VULE 6,74E+04 6,62E+04 7,52E+04 7,49E+04 paso 98,04% 1,00E+03
O500U VULE 3,94E+06 3,86E+06 3,72E+06 3,83E+06 fallo
O500U VULE 1,25E+04 1,22E+04 1,37E+04 1,46E+04 paso 99,29% 1,15E+05
O500U VULE 2,31E+06 2,26E+06 2,25E+06 2,05E+06 fallo
O500U VULE 2,50E+03 3,19E+03 3,48E+03 4,55E+03 paso 99,83% 1,18E+05
O500U VULE 2,58E+06 2,54E+06 2,39E+06 2,61E+06 fallo
O500UA METROPOLITANA 1,03E+05 1,08E+05 1,01E+05 1,07E+05 paso 97,52% 2,76E+03
O500UA METROPOLITANA 3,91E+06 4,25E+06 4,25E+06 4,31E+06 fallo
O500U METROPOLITANA 5,73E+03 6,08E+03 5,71E+03 5,80E+03 paso 99,86% 4,40E+04
O500U METROPOLITANA 4,30E+06 4,23E+06 4,32E+06 4,19E+06 fallo
O500U METROPOLITANA 6,28E+03 5,96E+03 6,28E+03 7,28E+03 paso 99,85% 4,40E+04
O500U METROPOLITANA 4,97E+06 5,14E+06 5,06E+06 5,00E+06 fallo

Regeneration chart Cross Section Outlet Surface1
0 g
/L
0
200
400
600
800
1000
1200
0 2 4 6 8 10 12 14
Time(min)
Tem
pera
ture
(℃)
Soot load : 42.7 g (10.4 g/L)
Max.temp. :877.8 ℃
Max.temp.grad. :63.4 ℃/cm
Regeneration rate : 65.6 %
20
g/L
0
200
400
600
800
1000
1200
0 2 4 6 8 10 12 14
Time(min)
Tem
pera
ture
(℃)
Soot load : 86.6 g (21.1 g/L)
Max.temp. 1041.3 ℃
Max.temp.grad. :98.9 ℃/cm
Regeneration rate : 94.1 %
30
g/L
0
200
400
600
800
1000
1200
0 2 4 6 8 10 12 14
Time(min)
Tem
pera
ture
(℃
)
Soot load : 123.3 g (30.1g/L)
Max.temp. 1200℃ over
Max.temp.grad. :TC broken℃/cm
Regeneration rate : 93.8%
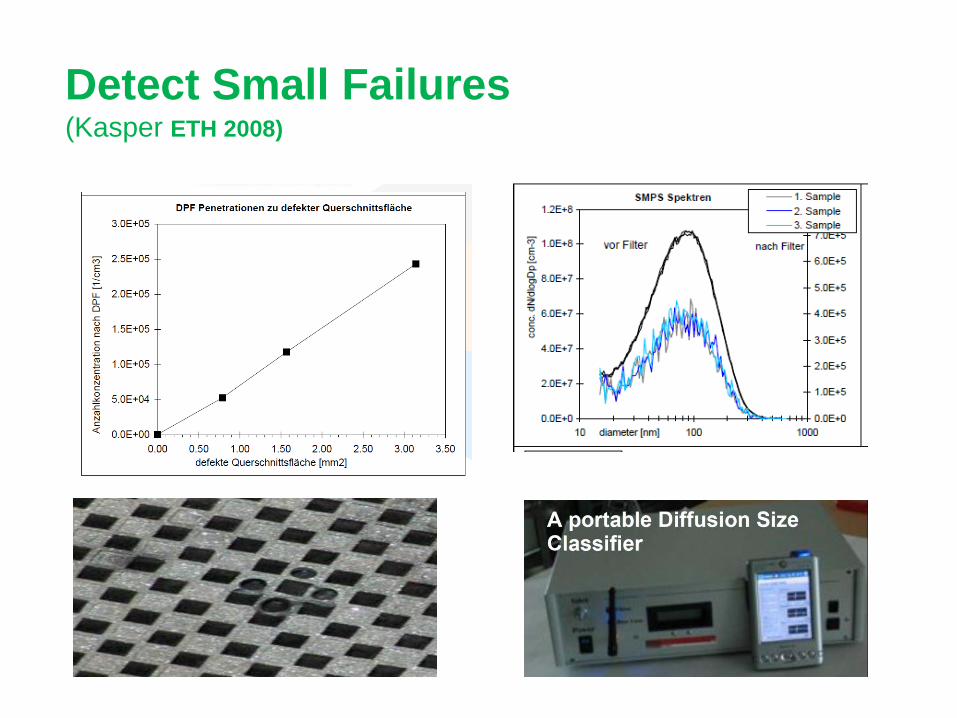
Detect Small Failures (Kasper ETH 2008)

57
Repair Small Failures by
ceramic cement
W.Haldenwanger
Technische Keramik GmbH
Teplitzer Strasse 27
D-84478 Waldkraiburg
WH Feuerfestkitt Teil A und B
www.haldenwanger.de
58
Conclusions for failure detection by
PN-Measurement
PN emissions increase linearly with DPF damage ratio
Opacity does not have enough sensitivity
Laser Light Scattering LLSP has enough sensitivity to
detect the emission of large particles but is very
insensitive for ultrafine particles
PN measurement at low idle can detect even small DPF
damage, which can be repaired
59
Conclusions on PN-Measurement for I&M
Very accurate tool
Easy to apply and handle even at low idle
Measurement time < 1 minute
Useful for maintenance and periodic control
Equally useful for DPF and Engine failure detection
Will replace opacity measurement and light scattering
60
Can we also check Catalysis in-use
DOC
SCT
?
Yes, we can
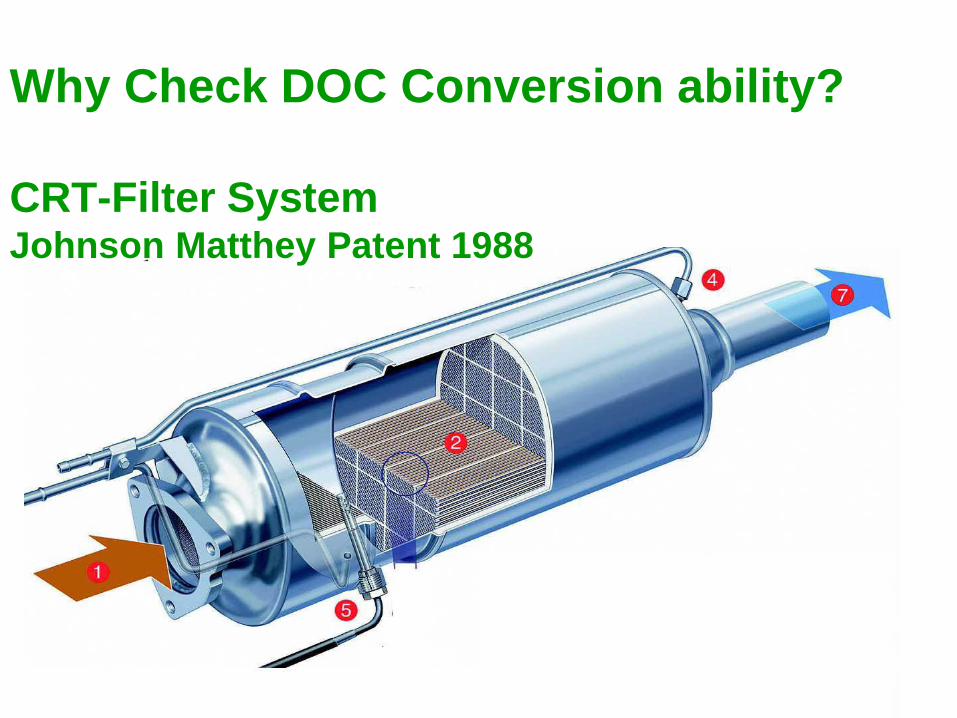
Why Check DOC Conversion ability?
CRT-Filter System Johnson Matthey Patent 1988
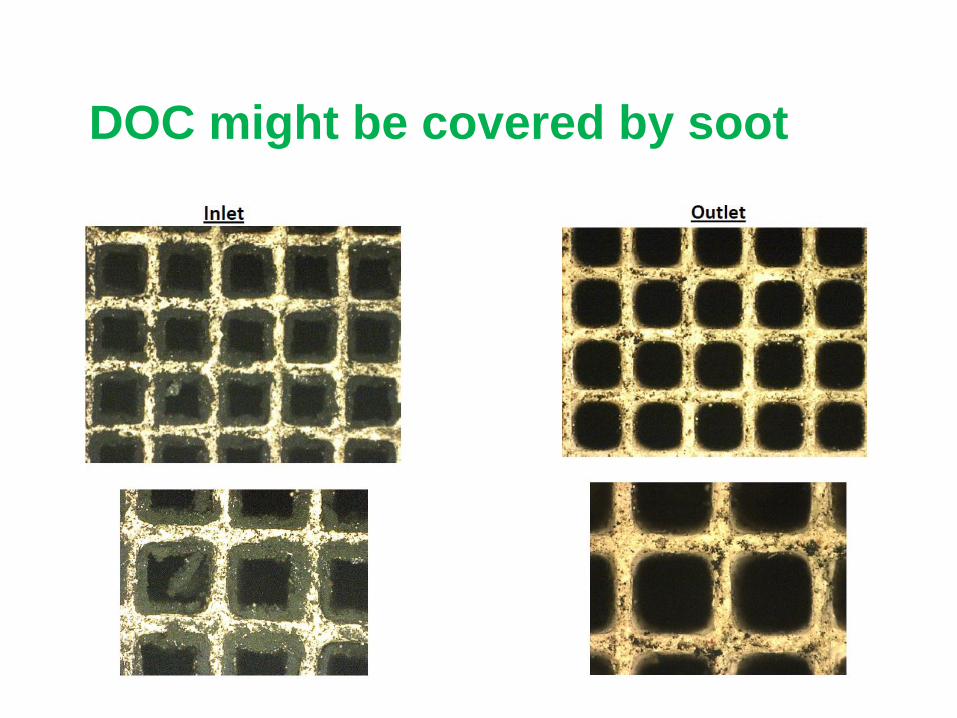
DOC might be covered by soot
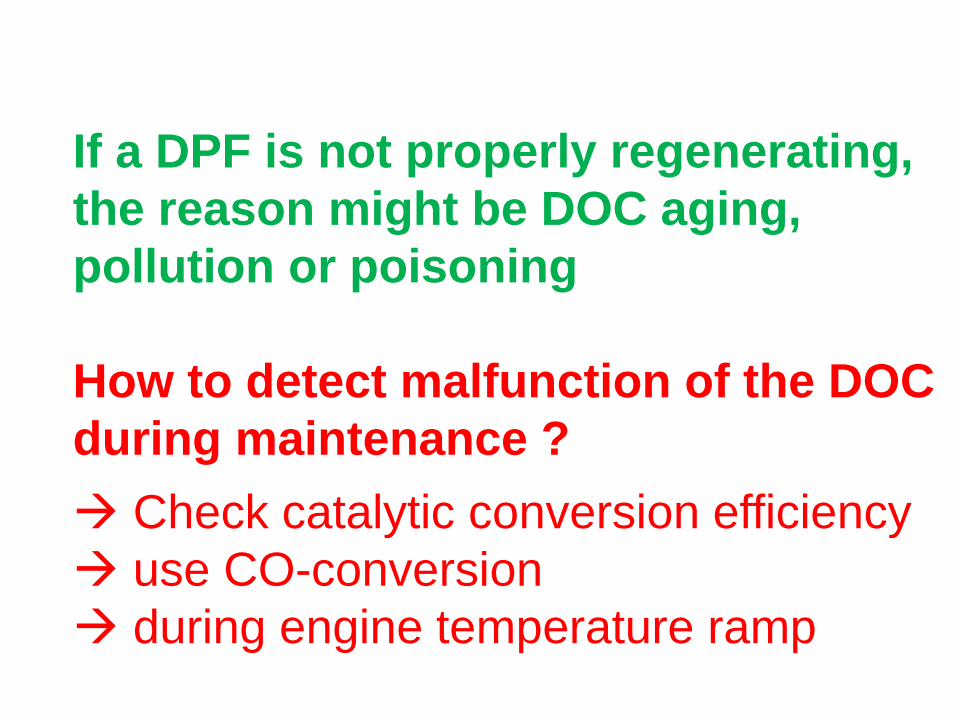
If a DPF is not properly regenerating,
the reason might be DOC aging,
pollution or poisoning
How to detect malfunction of the DOC
during maintenance ?
Check catalytic conversion efficiency
use CO-conversion
during engine temperature ramp
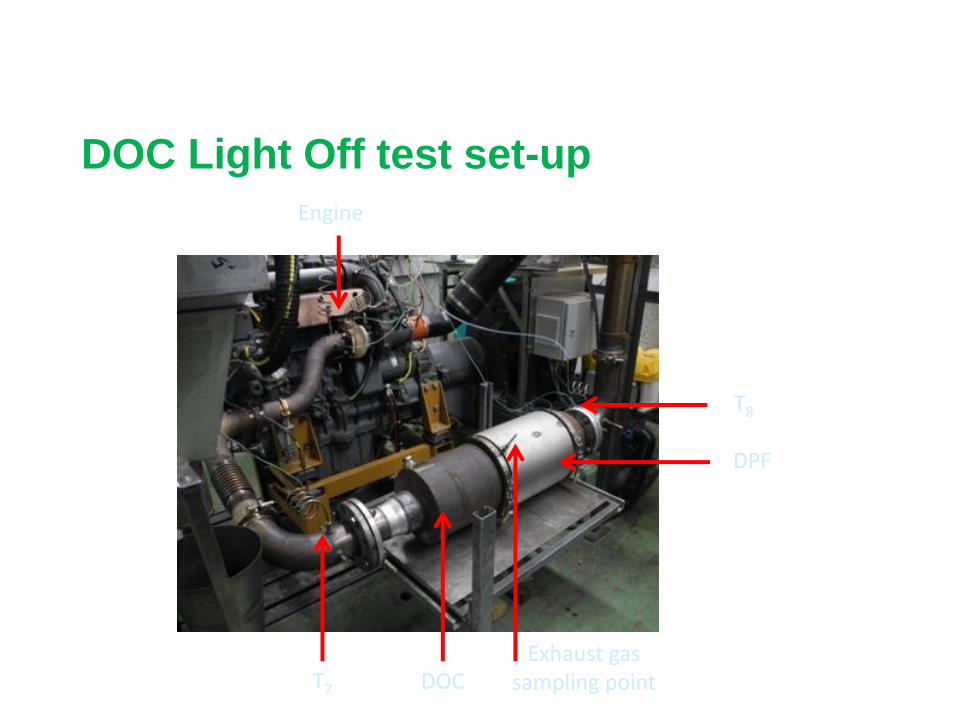
DOC Light Off test set-up
Engine
T7 DOCExhaust gas
sampling point
DPF
T8

DOC Light off test during load step
needs chassis
dynamometer
T7: before DPF; T8: after DPF; Dp7: before DPF
Kco
[%
]en
gin
e t
orq
ue [
Nm
]
tem
pera
ture
[°C
]
0
50
100
150
200
250n = 1400 rpm / M = 116 Nm / P = 17kW
M
T8
T7
CO
, H
CF
ID [
pp
m]
0
80
160
240
320
400
0 100 200 300 400 500 600 700 800
time [s]
CO engine out
CO after DOC
Transition from idle to cruise
0
20
40
60
80
100
100 120 140 160 180 200 220 240
temperature T7 [°C]
T7°C max during free acceleration at 2000 rpm, hold for 10 s
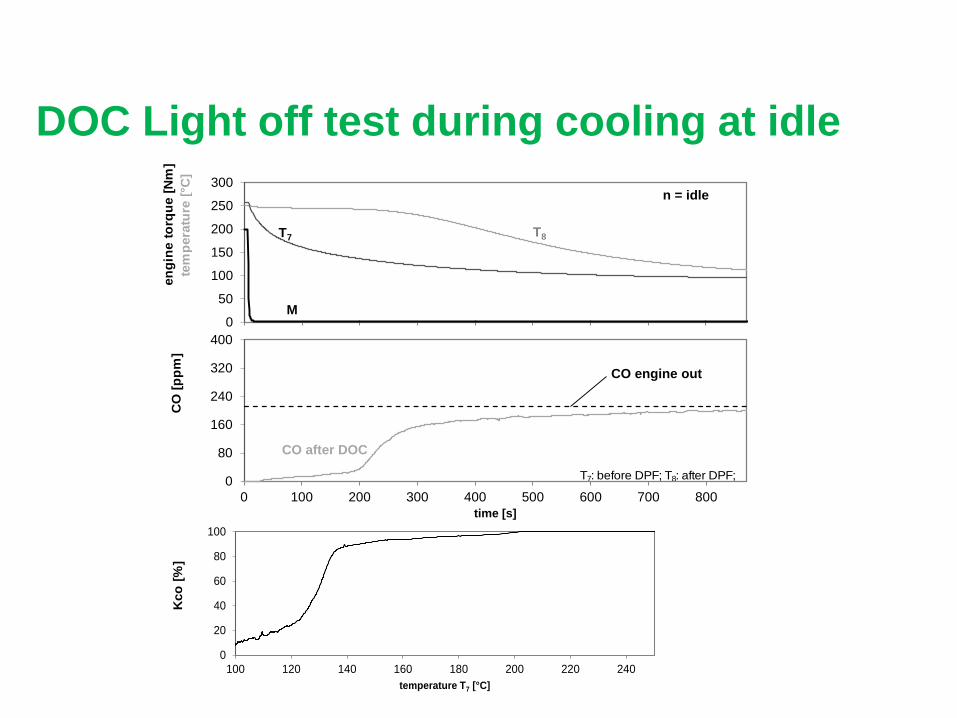
DOC Light off test during cooling at idle
T7: before DPF; T8: after DPF; Dp7: before DPF
en
gin
e t
orq
ue [
Nm
]
tem
pera
ture
[°C
]C
O [
pp
m]
Kco
[%
]
0
80
160
240
320
400
0 100 200 300 400 500 600 700 800
time [s]
CO engine out
CO after DOC
0
50
100
150
200
250
300n = idle
M
T8T7
0
20
40
60
80
100
100 120 140 160 180 200 220 240
temperature T7 [°C]
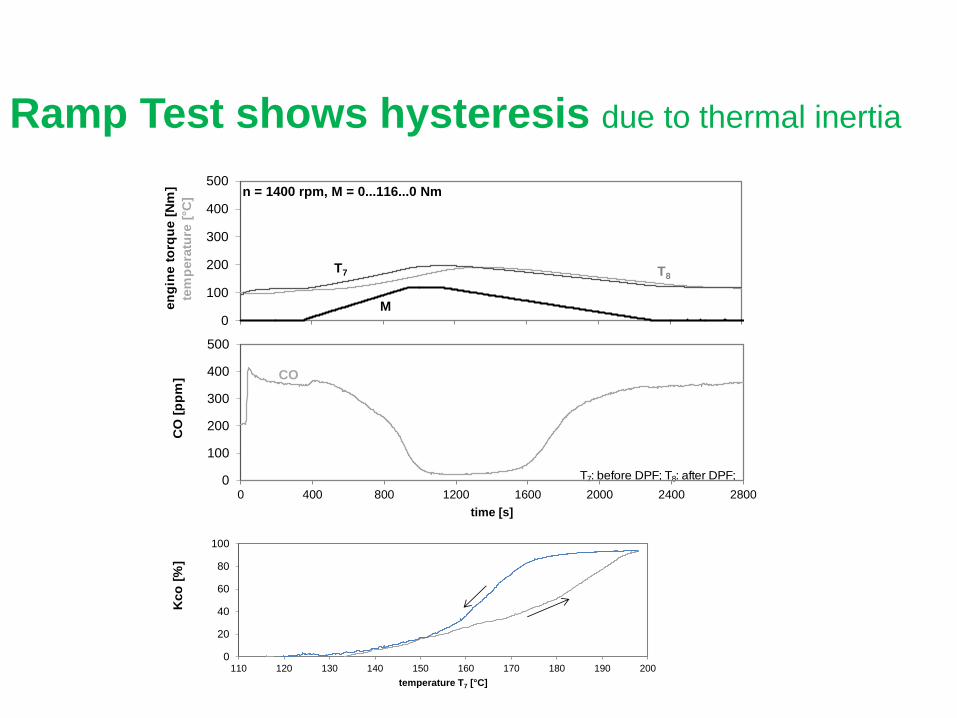
Ramp Test shows hysteresis due to thermal inertia
T7: before DPF; T8: after DPF; Dp7: before DPF
Kco
[%
]C
O [
pp
m]
en
gin
e t
orq
ue [
Nm
]
tem
pera
ture
[°C
]
0
20
40
60
80
100
110 120 130 140 150 160 170 180 190 200
temperature T7 [°C]
0
100
200
300
400
500
0 400 800 1200 1600 2000 2400 2800
time [s]
CO
0
100
200
300
400
500n = 1400 rpm, M = 0...116...0 Nm
M
T8T7

Summary and Conclusion
CO-conversion test during engine cooling at
idle after road operation
is easy to perform and fast
confirms proper function of DOC
detects malfunctions
Supplies quantitative data to either clean or
replace the CRT-DOC
Similar loadstep (ramp-) test for SCR to
check proper Adblue injection and catalyst
conversion stability
69
Inspection & Maintenance becomes very
important for DPF (+SCR) retrofit and first fit
Instruments are ready
- PN-Measurement at idle for DPF and Engine control
* Fleet Monitor with remote control
* DOC-conversion activity control
Regulations are needed
Periodic independent control is needed
Documentation is needed (onboard emission passport)

The scientific network
1997 first international ETH-NP-
workshop - 40 participants
Today ETH-NPC is the annual
event of UFP experts from
science to technology > 400
20th conference June 2016
13th to 16th – no participation fee
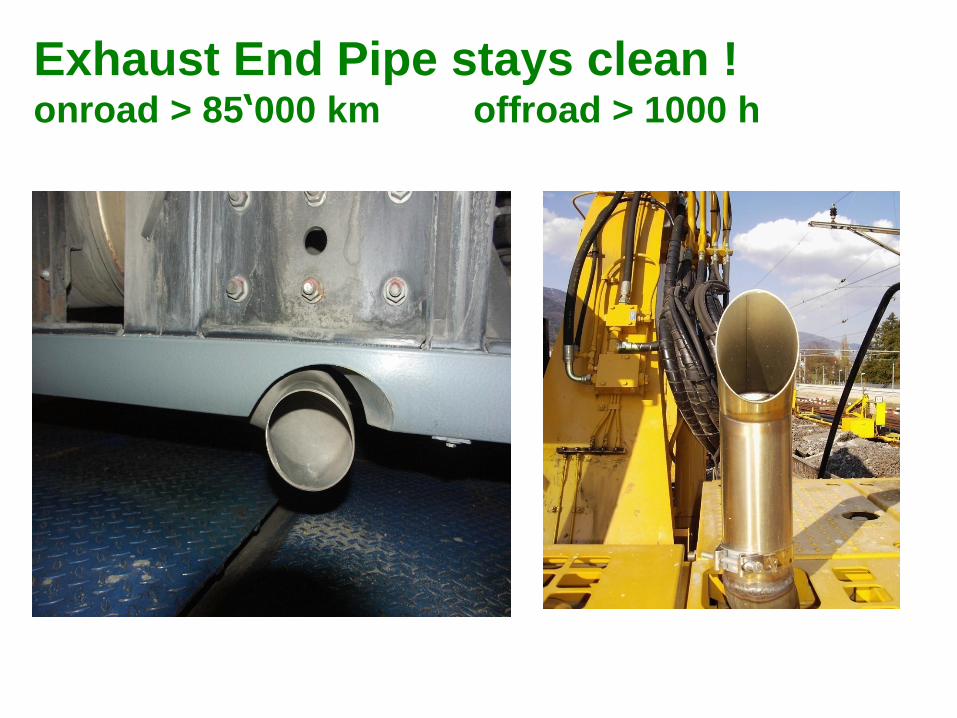
Exhaust End Pipe stays clean ! onroad > 85‘000 km offroad > 1000 h