Title Epileptic network of hypothalamic hamartoma: An EEG ...
31
RIGHT: URL: CITATION: AUTHOR(S): ISSUE DATE: TITLE: Epileptic network of hypothalamic hamartoma: An EEG-fMRI study. Usami, Kiyohide; Matsumoto, Riki; Sawamoto, Nobukatsu; Murakami, Hiroatsu; Inouchi, Morito; Fumuro, Tomoyuki; Shimotake, Akihiro; ... Takahashi, Ryosuke; Kameyama, Shigeki; Ikeda, Akio Usami, Kiyohide ...[et al]. Epileptic network of hypothalamic hamartoma: An EEG-fMRI study.. Epilepsy research 2016, 125: 1-9 2016-09 http://hdl.handle.net/2433/224936 © 2016. This manuscript version is made available under the CC-BY-NC-ND 4.0 license http://creativecommons.org/licenses/by-nc-nd/4.0/ / The full-text file will be made open to the public on 1 September 2017 in accordance with publisher's 'Terms and Conditions for Self-Archiving' / This is not the published version. Please cite only the published version. この論文は出版社版でありません。引用の際には出版社版をご確認ご利用ください。
Transcript of Title Epileptic network of hypothalamic hamartoma: An EEG ...

RIGHT:
URL:
CITATION:
AUTHOR(S):
ISSUE DATE:
TITLE:
Epileptic network of hypothalamichamartoma: An EEG-fMRI study.
Usami, Kiyohide; Matsumoto, Riki; Sawamoto, Nobukatsu;Murakami, Hiroatsu; Inouchi, Morito; Fumuro, Tomoyuki;Shimotake, Akihiro; ... Takahashi, Ryosuke; Kameyama,Shigeki; Ikeda, Akio
Usami, Kiyohide ...[et al]. Epileptic network of hypothalamichamartoma: An EEG-fMRI study.. Epilepsy research 2016, 125: 1-9
2016-09
http://hdl.handle.net/2433/224936
© 2016. This manuscript version is made available under the CC-BY-NC-ND 4.0 licensehttp://creativecommons.org/licenses/by-nc-nd/4.0/ / The full-text file will be made open to the public on 1 September2017 in accordance with publisher's 'Terms and Conditions for Self-Archiving' / This is not the published version. Pleasecite only the published version. この論文は出版社版でありません。引用の際には出版社版をご確認ご利用ください。

Epileptic network of hypothalamic hamartoma: an EEG-fMRI study
Kiyohide Usami1, Riki Matsumoto2,†, Nobukatsu Sawamoto1,3, Hiroatsu Murakami4, Morito
Inouchi1,5, Tomoyuki Fumuro6, Akihiro Shimotake1, Takeo Kato7, Tatsuya Mima3, Hiroshi
Shirozu4, Hiroshi Masuda4, Hidenao Fukuyama3, Ryosuke Takahashi1, Shigeki Kameyama4,‡,
Akio Ikeda2,†,‡ 1Department of Neurology, 2Epilepsy and Movement Disorders and Physiology, 3Human
Brain Research Center, 5Respiratory Medicine, and 7Pediatrics, Kyoto University, Graduate
School of Medicine, Kyoto Japan 6Research and Educational Unit of Leaders for Integrated Medical System, Kyoto University,
Kyoto, Japan 4Department of Neurosurgery, Nishi-Niigata Chuo National Hospital, Niigata, Japan
†To whom correspondence should be addressed.
Riki Matsumoto, MD, PhD and Akio Ikeda, MD, PhD.
Department of Epilepsy, Movement Disorders and Physiology, Kyoto University
Graduate School of Medicine, 54 Kawahara-cho, Shogoin, Sakyo-ku, Kyoto, 606-
8507, Japan
Phone number: +81 75 751 3662
Fax number: +81 75 751 9416
E-mail: [email protected] (R.M.), [email protected]
‡They (S.K. and A.I.) are equally senior authors.
Abbreviations: HH, hypothalamic hamartoma; EEG-fMRI, EEG with functional MRI; GS,
gelastic seizure; SISCOM, SPECT coregistered to MRI; DMN, default mode network
A Self-archived copy inKyoto University Research Information Repository
https://repository.kulib.kyoto-u.ac.jp

Highlights:
• We performed EEG-fMRI in eight HH patients with GS.
• EEG-fMRI revealed activation in or around the hypothalamus in 6/8 patients.
• Activation in subcortical tissues and deactivation including DMN were found.
• Subcortical network and DMN can be related each to GS and epileptic encephalopathy.
• EEG-fMRI enhances sensitivity in detecting the HH interface compared with SISCOM.
A Self-archived copy inKyoto University Research Information Repository
https://repository.kulib.kyoto-u.ac.jp
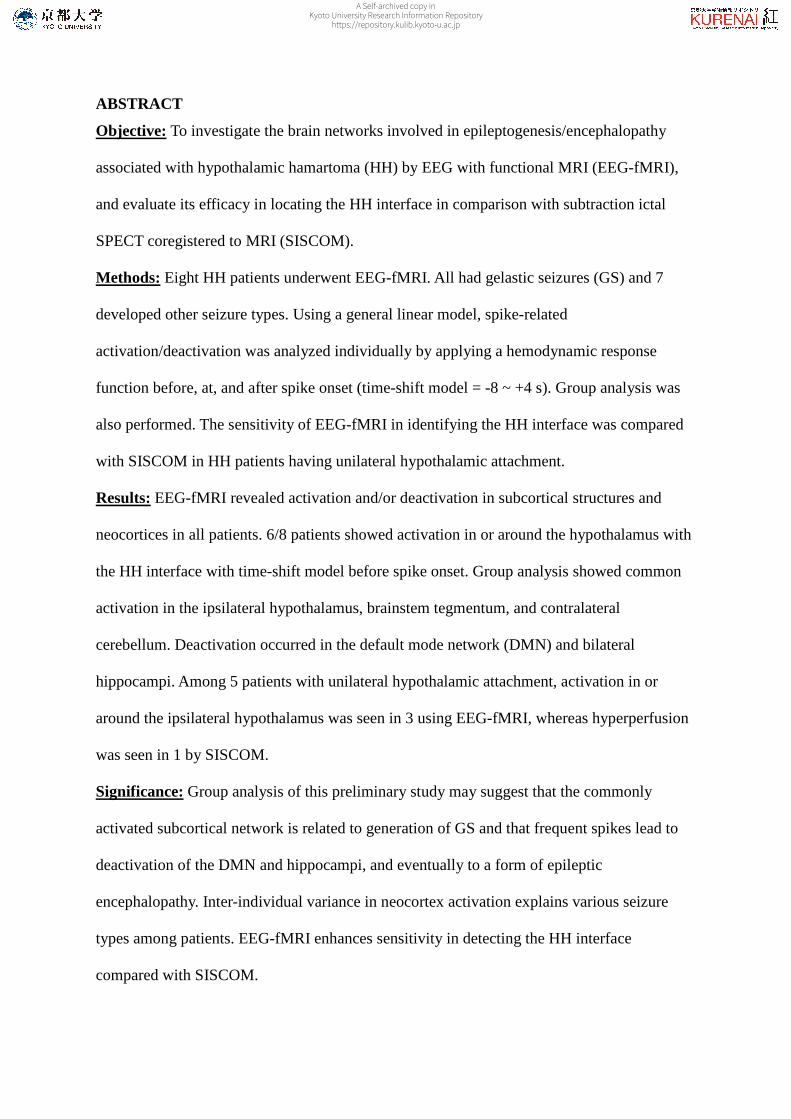
ABSTRACT
Objective: To investigate the brain networks involved in epileptogenesis/encephalopathy
associated with hypothalamic hamartoma (HH) by EEG with functional MRI (EEG-fMRI),
and evaluate its efficacy in locating the HH interface in comparison with subtraction ictal
SPECT coregistered to MRI (SISCOM).
Methods: Eight HH patients underwent EEG-fMRI. All had gelastic seizures (GS) and 7
developed other seizure types. Using a general linear model, spike-related
activation/deactivation was analyzed individually by applying a hemodynamic response
function before, at, and after spike onset (time-shift model = -8 ~ +4 s). Group analysis was
also performed. The sensitivity of EEG-fMRI in identifying the HH interface was compared
with SISCOM in HH patients having unilateral hypothalamic attachment.
Results: EEG-fMRI revealed activation and/or deactivation in subcortical structures and
neocortices in all patients. 6/8 patients showed activation in or around the hypothalamus with
the HH interface with time-shift model before spike onset. Group analysis showed common
activation in the ipsilateral hypothalamus, brainstem tegmentum, and contralateral
cerebellum. Deactivation occurred in the default mode network (DMN) and bilateral
hippocampi. Among 5 patients with unilateral hypothalamic attachment, activation in or
around the ipsilateral hypothalamus was seen in 3 using EEG-fMRI, whereas hyperperfusion
was seen in 1 by SISCOM.
Significance: Group analysis of this preliminary study may suggest that the commonly
activated subcortical network is related to generation of GS and that frequent spikes lead to
deactivation of the DMN and hippocampi, and eventually to a form of epileptic
encephalopathy. Inter-individual variance in neocortex activation explains various seizure
types among patients. EEG-fMRI enhances sensitivity in detecting the HH interface
compared with SISCOM.
A Self-archived copy inKyoto University Research Information Repository
https://repository.kulib.kyoto-u.ac.jp

Keywords: Gelastic seizure; Epileptic encephalopathy; Subcortical epilepsy; EEG-fMRI;
Ictal SPECT
A Self-archived copy inKyoto University Research Information Repository
https://repository.kulib.kyoto-u.ac.jp

1
1. INTRODUCTION 1
Hypothalamic hamartoma (HH) is a rare developmental malformation that has provided 2
important insight about epileptology (Berkovic et al., 1988; Mullatti et al., 2003; Striano et 3
al., 2012). HH is characterized by gelastic seizures (GS) which occur in almost all patients. 4
Such patients often develop other seizure types, i.e., partial and generalized seizures, and 5
cognitive/behavioral problems including memory deficits and mental retardation. Previous 6
studies showed that HH per se accounts for the generation of these seizures (Kahane et al., 7
2003; Kameyama et al., 2010; Kameyama et al., 2009; Kuzniecky, 2004; Munari et al., 1995; 8
Striano et al., 2012; Wethe et al., 2013). Therefore, the unique spectrum of symptoms in HH 9
has been regarded as the model of subcortical epilepsy and epileptic encephalopathy 10
(Kameyama et al., 2010; Striano et al., 2012). However, it remains unknown how the 11
epileptic activity propagates, and how cognitive/behavioral dysfunction develops. For 12
example, the networks associated with GS remain elusive, although the mammillo-thalamo-13
cingulate tract from HH or the pathway from the HH to the brainstem and cerebellum has 14
been postulated (Kahane et al., 2003; Kameyama et al., 2010). Therapeutically, stereotactic 15
radiofrequency thermocoagulation (SRT) has become one of the most useful surgical 16
interventions. SRT of the HH interface has yielded better outcomes for seizure freedom and 17
fewer surgical complications than a direct approach (Kameyama et al., 2010; Kameyama et 18
al., 2009). Subtraction ictal SPECT coregistered to MRI (SISCOM) has been used for 19
locating the HH interface (Kameyama et al., 2010), however, it is time-consuming and the 20
likelihood of detecting the HH interface individually is not high. 21
Here, we performed EEG with fMRI (EEG-fMRI) on eight patients with HH. EEG-fMRI 22
can detect blood-oxygen-level dependent (BOLD) changes that are related to interictal 23
discharges identified from scalp EEG (Lemieux et al., 2001; Warach et al., 1996). It was 24
reported to be clinically useful for localizing the epileptic focus and investigating epileptic 25
A Self-archived copy inKyoto University Research Information Repository
https://repository.kulib.kyoto-u.ac.jp
2
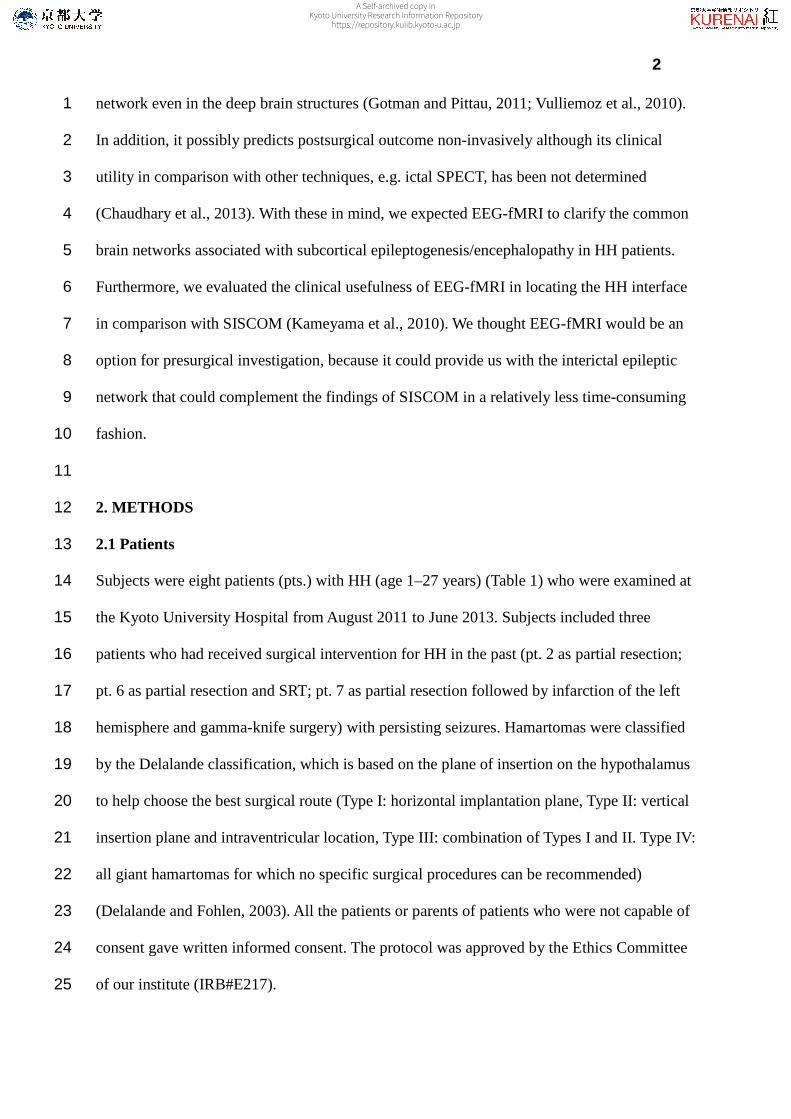
network even in the deep brain structures (Gotman and Pittau, 2011; Vulliemoz et al., 2010). 1
In addition, it possibly predicts postsurgical outcome non-invasively although its clinical 2
utility in comparison with other techniques, e.g. ictal SPECT, has been not determined 3
(Chaudhary et al., 2013). With these in mind, we expected EEG-fMRI to clarify the common 4
brain networks associated with subcortical epileptogenesis/encephalopathy in HH patients. 5
Furthermore, we evaluated the clinical usefulness of EEG-fMRI in locating the HH interface 6
in comparison with SISCOM (Kameyama et al., 2010). We thought EEG-fMRI would be an 7
option for presurgical investigation, because it could provide us with the interictal epileptic 8
network that could complement the findings of SISCOM in a relatively less time-consuming 9
fashion. 10
11
2. METHODS 12
2.1 Patients 13
Subjects were eight patients (pts.) with HH (age 1–27 years) (Table 1) who were examined at 14
the Kyoto University Hospital from August 2011 to June 2013. Subjects included three 15
patients who had received surgical intervention for HH in the past (pt. 2 as partial resection; 16
pt. 6 as partial resection and SRT; pt. 7 as partial resection followed by infarction of the left 17
hemisphere and gamma-knife surgery) with persisting seizures. Hamartomas were classified 18
by the Delalande classification, which is based on the plane of insertion on the hypothalamus 19
to help choose the best surgical route (Type I: horizontal implantation plane, Type II: vertical 20
insertion plane and intraventricular location, Type III: combination of Types I and II. Type IV: 21
all giant hamartomas for which no specific surgical procedures can be recommended) 22
(Delalande and Fohlen, 2003). All the patients or parents of patients who were not capable of 23
consent gave written informed consent. The protocol was approved by the Ethics Committee 24
of our institute (IRB#E217). 25
A Self-archived copy inKyoto University Research Information Repository
https://repository.kulib.kyoto-u.ac.jp

3
1
2.2 EEG-fMRI acquisition 2
EEG was obtained during fMRI, using a custom-made MR-compatible cap with 19 (for pt. 5) 3
or 23 (for other patients) Ag/AgCl scalp electrodes based on the 10-20 System, including 4
Fp1, Fp2, F7, F3, F4, F8, T7, C3, C4, T8, TP9, P7, P3, P4, P8, TP10, O1, and O2 referenced 5
to Cz (T1, T2, Fz, and Pz were added optionally) (EASYCAP, EASYCAP GmbH, 6
Herrsching, Germany). Electrocardiogram was also recorded. All the signals were transmitted 7
from an MR-compatible amplifier (BrainAmp MR plus, Brain Products GmbH, Munch, 8
Germany: sampled at 5 kHz) through an optic cable to a computer outside the MR scanner 9
room and stored on the computer. The EEG system was synchronized with the MRI scanner 10
clock. 11
A 3 Tesla MR scanner was used (Trio, Siemens, Erlangen, Germany). The MRI sequence 12
for the echo planar imaging (EPI), i.e., blood oxygenation-level dependent (BOLD) fMRI 13
(repetition time [TR] = 3,000 ms; echo time [TE] = 30 ms; flip angle [FA] = 90°; field of 14
view [FOV] = 192 × 192 mm; voxel size = 3 × 3 × 3 mm) was acquired with a one-channel 15
bird-cage head coil. The initial two scans were discarded to ascertain the steady-state of the 16
magnetization. Motion artifacts were minimized as much as possible by stabilizing patients’ 17
heads with a pillow filled with foam microspheres. Special care was taken to ensure the 18
patients’ comfort. Scans lasted 30–90 min in several runs per patient. T1-weighted, 19
magnetization-prepared, rapid acquisition with gradient echo (MPRAGE) images (TR = 20
2,000 ms; TE = 4.38 ms; FA = 8°; FOV = 176 × 192 mm; voxel size = 1 × 1 × 1 mm) were 21
also acquired with an eight-channel phased-array head coil for coregistration of the fMRI 22
results. By using this coil we expected to acquire a clearer anatomical image than one-23
channel coil does. 24
A Self-archived copy inKyoto University Research Information Repository
https://repository.kulib.kyoto-u.ac.jp

4
In all patients, SpO2 was monitored in preparation for hypoxemia by a pulse oximeter 1
under constant observation by a medical doctor in the scanner room. In order to perform the 2
scan safely with minimal motion artifacts, trichrofos, midazolam, or pentobarbital were used 3
to sedate patients, though pentobarbital was mainly used (Table 1). 4
5
2.3 EEG-fMRI pre-processing 6
First, MR and ballistocardiogram artifacts were removed in an offline manner according to a 7
previously established method (Allen et al., 2000; Allen et al., 1998). EEG was down-8
sampled to 250 Hz by BrainVision ANALYZER software (Brain Products GmbH, Munich, 9
Germany). In addition, the EEG signals were processed with 30-Hz low-pass and 0.53-Hz 10
high-pass filters using an in-house script in Matlab. The filtered EEG signals were inspected 11
by a certified electroencephalographer (R.M.), and the occurrence times of interictal 12
paroxysmal discharges were marked (See an example of identified interictal discharges in 13
Figure 1A). The interictal findings eligible for marking were chosen based on the criteria that 14
(1) their waveform and location corresponded with those in EEG that was taken clinically 15
before and also based on 10-20 system, and (2) when spikes were defined from multiple foci, 16
the most predominant and frequent population was chosen for the robust BOLD changes. 17
Functional data were pre-processed and analyzed using the FMRIB Software Library v5.0 18
(FSL, www.fmrib.ox.ac.jk/fsl). The echo planar imaging (EPI) data underwent motion 19
correction, and were unwarped according to field-map data by FSL, and smoothed with a 20
Gaussian kernel with a full-width at half-maximum of 5 mm, and high-pass filtered (cutoff: 21
100 s). 22
23
2.4 Individual EEG-fMRI analysis 24
A Self-archived copy inKyoto University Research Information Repository
https://repository.kulib.kyoto-u.ac.jp

5
fMRI data sets were analyzed based on an event-related design using a general linear model 1
(FEAT program, part of FSL [FMRIB's Software Library, www.fmrib.ox.ac.uk/fsl]). For the 2
timing of spikes as events, a canonical hemodynamic response function (HRF) consisting of a 3
double gamma function was convolved (phase = 0 s; standard deviations = 3 s, mean lag = 6 4
s). Then, considering the possibility that the patterns of BOLD signal change differ in 5
different areas of the brain, multiple time-shift models in which HRF was applied before and 6
after spikes were also produced (t = -8, -6, -4, -2, +2, +4 s) (Figure 1B). Previous studies 7
revealed that this technique successfully revealed BOLD signal changes preceding focal- and 8
generalized spike discharges (Hawco et al., 2007; Jacobs et al., 2009; Moeller et al., 2008). 9
Each time-shift model related to spikes was used as the explanatory variable of interest, and 10
eight nuisance covariates (six head motion parameters, and signals from the CSF and white 11
matter [WM]) were regressed out as in a previous fMRI study (Fox et al., 2005). Basically, 12
the areas of the CSF and WM were extracted from a standard brain image in MNI standard 13
space (ICBM-152: “MNI152_T1_2mm.nii.gz”) and non-linearly coregistered to the anatomy 14
image in each patient using FNIRT (www.fmrib.ox.ac.jk/fsl/fnirt). These processes were done 15
successfully with “fsl_anat” script in almost all cases. After binarization (0 or 1) of the CSF 16
and WM voxels, the images were coregistered to EPI space. In this coregistration process, 17
each voxel has one probabilistic value (0–1) for each patient’s CSF and WM. The time course 18
of the BOLD signal of the eigenvalues was calculated for each region where the value was ≥ 19
0.95 after the voxels with artifacts around the air-tissue interface were excluded manually. 20
Each of these values was then used to regress out the effect of the CSF and WM, which 21
reportedly involve much noise caused by the cardiac and respiratory cycles (Dagli et al., 22
1999; Windischberger et al., 2002); thus, we expected that this process enabled us to 23
sensitively detect activation/deactivation of the small region near the ventricle, i.e., the 24
hypothalamus. Time-series analysis was carried out using FILM with local autocorrelation 25
A Self-archived copy inKyoto University Research Information Repository
https://repository.kulib.kyoto-u.ac.jp

6
correction (Woolrich et al., 2001). In the individual EPI space, Z-statistic images were 1
thresholded using clusters determined by Z > 2.3 at voxel level and a corrected cluster 2
significance level of p < 0.007 (0.05/7; Bonferroni correction was made because we used 3
seven time-series models individually) (Worsley, 2001). The images were then coregistered 4
to each anatomy image. The laterality concordance between EEG spikes and cortical 5
activation was blindly evaluated by an author (R.M.) who did not analyze fMRI data. The 6
laterality of spikes was defined by the side on which focal spikes occurred, or the side on 7
which spikes had larger amplitude (twice the height of the other side), in the case of a 8
bilateral or generalized spike. The laterality of the fMRI cortical activation was defined by 9
the side containing the most significant cluster of cortical positive BOLD responses with 10
early time-shift models (t = -8 ~ 0 s). The results of earlier time shift models (-8 ~ 0 s) were 11
used for comparison based on previous reports (Hawco et al., 2007; Jacobs et al., 2009; 12
Moeller et al., 2008) because later models could involve the zones epileptic activity finally 13
spread to other than the areas that generate spikes. 14
15
2.5 Group analysis 16
Excluding one patient (pt. 5, 1-year-old female) in whom coregistration of the CSF and WM 17
was impossible, a random-effects group analysis was carried out using the FEAT program in 18
seven patients. Before analysis, MRI images were flipped in the left-right dimension in the 19
case of (1) patients with only the left side attachment or (2) those with left dominant 20
activation of the hypothalamus in the individual analysis (in case of bilateral attachment). Z-21
statistic images were thresholded using clusters determined by the criteria of Z > 2.3 and a 22
(corrected) cluster significance threshold of p = 0.007. Results were coregistered to the 23
common MR image in MNI standard space. Thus, all the pathologic hemispheres were shown 24
in the right hemisphere in the MNI space. The impact of HH on image normalization was 25
A Self-archived copy inKyoto University Research Information Repository
https://repository.kulib.kyoto-u.ac.jp

7
thought be little. It is because HHs were small, especially in the case of Delalande 1
classification type II, or big ones in the type I or III tended to be removed in an automatic 2
process of brain-masking of the coregistration pipeline. 3
4
2.6 SPECT and SISCOM 5
In seven patients excluding pt. 6, interictal and ictal SPECT were performed. These patients 6
were not included in our previous studies (Kameyama et al., 2010) at Nishi-Niigata Chuo 7
Hospital. A T1-weighted volumetric scan (1.5 Tesla, Shimadzu, Kyoto, Japan) was used for 8
coregistration of SPECT images. The imaging techniques and method of SISCOM have been 9
reported elsewhere (Kameyama et al., 2010). 99mTc-ethyl cysteinate dimer (ECD) was 10
injected interictally and ictally. The ictal and interictal SPECT images, normalized according 11
to the global mean voxel counts, were subtracted to obtain ictal-to-interictal state difference 12
images. Areas with counts above two standard deviations in subtraction images were adopted 13
as significantly increased perfusion areas. Next, EEG-fMRI and SISCOM results were 14
compared in terms of their sensitivity to identify the HH interface. 15
16
3. RESULTS 17
3.1 Individual analysis 18
The areas that showed positive/negative BOLD activity (activation/deactivation) included 19
cortical (e.g., neocortices including the insula and anterior cingulate cortices) and subcortical 20
regions (e.g., the hypothalamus, thalamus, the caudate, brainstem, and cerebellum) to various 21
degrees in all patients. In all six patients who showed cortical BOLD responses with early 22
time-shift models (-8 ~ 0 s), the laterality of cortical activation was concordant with that of 23
EEG spikes (Table 2). In 6/8 patients, activation was observed at the HH interface of the 24
hypothalamus, or at its adjacent area, with early time-shift models (Table 2, and see Figure 2 25
A Self-archived copy inKyoto University Research Information Repository
https://repository.kulib.kyoto-u.ac.jp

8
for representative patients). Two patients (pt. 3 and 4), who did not show any activation in or 1
around the hypothalamus, had an intraventricular hamartoma (Delalande classification type 2
II) of smaller size compared with other patients (diameter < 10 mm). Thalamic BOLD 3
responses were observed in 6/8 patients with individual variance in activation/deactivation 4
patterns (activation; n = 2, deactivation: n = 2, mixed: n = 2). The summary of 5
activation/deactivation is shown in Table 3. 6
7
3.2 Group analysis 8
Group analysis revealed activation regions in the ipsilateral hypothalamus and brainstem 9
tegmentum with earlier time-shift models, and bilateral cerebellar activation (that was 10
dominant in the contralateral side) with later models (Figure 3). Deactivation areas included 11
the cunei, bilateral thalami, caudate nuclei, hippocampi, paracentral gyri, and parts of the so-12
called default mode network (DMN), i.e., the precunei, and inferior lateral parietal lobules. 13
14
3.3 Comparison between EEG-fMRI and SISCOM 15
Both recording and analyses were successfully performed in 8/8 patients with EEG-fMRI and 16
5/7 patients with SISCOM (no seizure was captured in two patients). The laterality of EEG-17
fMRI (see above) was concordant to that of EEG spikes in 6/8 patients, while that of 18
SISCOM (hyperperfusion) in 2/7 patients. Both EEG-fMRI and SISCOM were examined in 19
five patients with unilateral HH attachment. The sensitivity to detect the activation area of the 20
ipsilateral hypothalamus (i.e., HH interface) or its adjacent area was present in 3/5 patients 21
with EEG-fMRI and 1/5 patients with SISCOM (Table 2). 22
23
4. DISCUSSION 24
4.1 Strength of this study 25
A Self-archived copy inKyoto University Research Information Repository
https://repository.kulib.kyoto-u.ac.jp

9
We applied EEG-fMRI to patients with HH and revealed that its epileptic network comprised 1
both neocortices and subcortical structures. Spike-related BOLD responses were observed 2
interictally in all patients in various regions either with activation (positive BOLD) or 3
deactivation (negative BOLD). In 6/8 patients, the hypothalamus with the HH interface or its 4
adjacent area showed activation with a time-shift model before spike onset. Group analysis 5
showed activation in the ipsilateral hypothalamus, brainstem tegmentum, and contralateral 6
cerebellum. Deactivation was observed in the DMN and hippocampi. Among 5 patients with 7
unilateral hypothalamic attachment, activation was observed at and around the attachment 8
(HH interface) in 3/5 patients with EEG-fMRI whereas hyperperfusion was detected in 1/5 9
patients by SISCOM. 10
Recently, several lines of evidence suggested the utility of the time-shift models before 11
spike onset for locating areas of cortical activation concordant with focal EEG spikes in 12
partial epilepsy (Bagshaw et al., 2004; Jacobs et al., 2007; Jacobs et al., 2009). Prespike 13
models were also reported to be useful for EEG-fMRI analysis of generalized epilepsy 14
(Moeller et al., 2008). In line with these studies, we successfully detected lateralized cortical 15
activation and hypothalamic activation using the prespike models. What generates the 16
prespike BOLD responses is not exactly known, but some mechanisms are suggested: the 17
different temporal profile of the hemodynamic response function for epileptic activity (Kang 18
et al., 2003), or the metabolic process of neuronal or non-neuronal origin involving glial 19
structures that precedes the epileptic spikes (Pittau et al., 2011). 20
Some evidence shows the relationship between HH and various types of seizures including 21
GS. One stereo-EEG study of a patient with HH revealed that GS was well correlated to ictal 22
discharges in the HH (Munari et al., 1995). Another study showed that direct stimulation of 23
HH through depth electrodes evoked GS (Kahane et al., 2003). Other studies revealed that 24
ictal SPECT showed hyperperfusion in HH (Kuzniecky et al., 1997) or its interface to the 25
A Self-archived copy inKyoto University Research Information Repository
https://repository.kulib.kyoto-u.ac.jp

10
hypothalamus (Kameyama et al., 2010). Finally, it has also been shown that GS, focal and 1
generalized seizures, and associated cognitive/behavioral symptoms can improve after 2
appropriate surgery in HH (Kameyama et al., 2010; Kameyama et al., 2009; Striano et al., 3
2012; Wethe et al., 2013). 4
Variable activation/deactivation patterns among individual patients most likely reflect 5
various seizure types other than GS, while the other clinical profiles, such as the size of the 6
HH and use of anti-epileptic drugs might be also responsible. Despite this variability, group 7
analysis showed activation in subcortical structures such as the hypothalamus and brainstem, 8
especially with early time-shift models, and the cerebellum with later time-shift models. Our 9
EEG-fMRI analysis based on interictal findings of HH emphasize the existence of a common 10
epileptic network often involved in patients having HH with GS, and reinforce the 11
importance of the subcortical epileptic network that Kameyama and colleagues addressed in a 12
previous SISCOM study (Kameyama et al., 2010). Ictal SPECT performed during GS 13
showed, at a group level, involvement of the ipsilateral hypothalamus, mediodorsal (MD) 14
nucleus of the thalamus and putamen, bilateral pontine tegmentum, and contralateral inferior 15
semilunar lobule of the cerebellum (Kameyama et al., 2010). Based on lesion studies (Parvizi 16
et al., 2001), it is suggested that the execution of laughter is automatically regulated by the 17
cerebropontocerebellar pathway, which decussates before entering the middle cerebellar 18
peduncle. Additionally, stimulation of a small fiber bundle within the dorsal midbrain 19
tegmentum reportedly induced a laughing-like reaction in primates (Weinstein and bender, 20
1943). The findings of previous EEG-fMRI studies with a smaller number of patients having 21
HH (Kokkinos et al., 2012; Leal et al., 2009) are consistent with the existence of a network 22
including the mammillo-thalamo-cingulate tract (Kahane et al., 2003). Some patients in our 23
study showed involvement of the hippocampi and thalamus (see Figure 2). The mammillo-24
thalamo-cingulate tract could be another epileptic network involved in HH. The present EEG-25
A Self-archived copy inKyoto University Research Information Repository
https://repository.kulib.kyoto-u.ac.jp

11
fMRI study showed thalamic deactivation at a group level, with large inter-individual 1
variability in terms of BOLD response patterns. This observation is consistent with some 2
EEG-fMRI studies of generalized epilepsy, which have shown either activation or 3
deactivation of the thalamus, either ictally or interictally (Aghakhani et al., 2004; Carney et 4
al., 2010; Gotman et al., 2005; Hamandi et al., 2006; Moeller et al., 2008; Siniatchkin et al., 5
2011). Multiple variables is likely to determine the strength that the HH affect the thalamus 6
via its epileptic activity, including the patients’ age, the size of the HH and the location of its 7
attachment. They may explain the inter-individual variability, but we need more patients for 8
analysis. 9
The regions of the DMN, which show increased brain activity at rest (Raichle et al., 2001), 10
showed activation/deactivation in our study. It has been reported these areas are involved in 11
epileptic discharges in frontal- and temporal lobe epilepsy, posterior quadrant epilepsy and 12
idiopathic generalized epilepsy (Fahoum et al., 2012; Gotman et al., 2005; Laufs et al., 2007). 13
The network was evaluated in terms of the impairment of attention (Gotman et al., 2005) or 14
cognitive dysfunction when damaged in neurodegenerative disorders such as Alzheimer’s 15
disease (Johnson et al., 1998). Deactivation was also found in the bilateral hippocampi in the 16
present study, which is thought to be related to memory encoding, consolidation, and retrieval 17
(Carr et al., 2011). If frequent epileptic discharges from HH involve both the DMN and 18
hippocampi, the core regions of the memory network from early childhood, there might be an 19
interruption of the normal cognitive development process, and eventually a part of epileptic 20
encephalopathy. 21
Ictal SPECT generally has a diagnostic value in locating the seizure onset zone among 22
neuroimaging techniques (Spencer, 1994); however, in our pilot study, interictal EEG-fMRI 23
of HH had no less sensitivity than SISCOM in detecting regional activation in and around the 24
hypothalamus or lateralized cortical activation concordant with EEG spikes. This is partly 25
A Self-archived copy inKyoto University Research Information Repository
https://repository.kulib.kyoto-u.ac.jp

12
due to the higher spatiotemporal resolution of fMRI, which is sensitive enough to detect the 1
small and transient HH-related epileptic brain activity. Furthermore, EEG-fMRI requires a 2
short recording time of ~2 hours including preparation, as opposed to SISCOM, which 3
requires seizure recording that usually takes a long time for patients and medical staffs. 4
Therefore, we suggest that EEG-fMRI is a more practical and useful tool to identify the 5
laterality of HH attachment for surgical treatment by SRT. 6
7
4.2 Limitations 8
We should also be cautious in interpretation of the present data as follows. First, the variety 9
of the age, drugs that were used for sedation, and the status of pre-/post-operation of the 10
patients are all confounding factors that may influence the results in this preliminary study as 11
mentioned earlier. The sample size of the patients is small in the present study, and future 12
studies with a larger cohort warrant the validity of the findings in this small pilot study. Some 13
patients might have slept during recording and it would affect results in terms of BOLD 14
response through metabolic change. However, event-related design that our study used is 15
immune to sleep-related change compared to block design because individual spikes are 16
extremely transient than sleep. Second, the difference in activation patterns in terms of the 17
location of HH attachment to the hypothalamus could not be evaluated due to the small 18
number of patients. Third, we arbitrarily analyzed the most frequent interictal discharges in 19
each patient. However, these discharges could contain epileptic activities that have no direct 20
relationship with HH, or activities from secondary epileptic foci. Last, EEG-fMRI has an 21
intrinsic methodological limitation. Spikes must be large enough in amplitude to be detected 22
in the filtered EEG, and frequent enough to reveal the areas of statistical significance in fMRI 23
analysis. This contrasts with ictal SPECT that does not require EEG for analysis. A large 24
A Self-archived copy inKyoto University Research Information Repository
https://repository.kulib.kyoto-u.ac.jp

13
cohort study is warranted in the future to establish analysis methods, sensitivity, and clinical 1
utility of EEG-fMRI for detecting seizure onset zones in patients with HH. 2
3
5. Conclusion 4
In this study, we showed that EEG-fMRI in patients with HH detected brain areas possibly 5
involved in epileptogenesis/encephalopathy, and that it had comparable sensitivity with 6
SISCOM in detecting the HH interface. Future studies using EEG-fMRI would further 7
expand our understanding about HH and its epileptogenesis, and corroborate the clinical 8
usefulness of this technique. 9
10
Conflicts of Interest: none. 11
12
Acknowledgments RM has received support from grant of Japan Ministry of Education, 13
Culture, Sports, Science and Technology (MEXT): Grant-in-Aid for Scientific Research (C) 14
23591273, Grant-in-Aid for Exploratory Research 26560465, and AI has received support 15
from MEXT: Grant-in-Aid for Scientific Research on Innovative Areas 15H05874. The 16
remaining authors have no conflicts of interest. Department of Epilepsy, Movement Disorders 17
and Physiology, Kyoto University Graduate School of Medicine is an endowment 18
department, supported by grants from GlaxoSmithKline K.K., Nihon Kohden Corporation, 19
Otsuka Pharmaceutical Co., and UCB Japan Co., Ltd. The authors thank Dr. Takeharu 20
Kunieda from the department of Neurosurgery, Kyoto University Graduate School of 21
Medicine, for introducing a patient to us and Dr. Keiko Saito from the department of 22
Pediatrics, Kyoto University Graduate School of Medicine, for the help with data acquisition. 23
24
25
A Self-archived copy inKyoto University Research Information Repository
https://repository.kulib.kyoto-u.ac.jp

14
REFERENCES 1
Aghakhani, Y., Bagshaw, A.P., Benar, C.G., Hawco, C., Andermann, F., Dubeau, F., Gotman, 2
J., 2004. fMRI activation during spike and wave discharges in idiopathic generalized 3
epilepsy. Brain 127, 1127-1144. 4
Allen, P.J., Josephs, O., Turner, R., 2000. A method for removing imaging artifact from 5
continuous EEG recorded during functional MRI. Neuroimage 12, 230-239. 6
Allen, P.J., Polizzi, G., Krakow, K., Fish, D.R., Lemieux, L., 1998. Identification of EEG 7
events in the MR scanner: the problem of pulse artifact and a method for its subtraction. 8
Neuroimage 8, 229-239. 9
Bagshaw, A.P., Aghakhani, Y., Benar, C.G., Kobayashi, E., Hawco, C., Dubeau, F., Pike, 10
G.B., Gotman, J., 2004. EEG-fMRI of focal epileptic spikes: analysis with multiple 11
haemodynamic functions and comparison with gadolinium-enhanced MR angiograms. Hum 12
Brain Mapp 22, 179-192. 13
Berkovic, S.F., Andermann, F., Melanson, D., Ethier, R.E., Feindel, W., Gloor, P., 1988. 14
Hypothalamic hamartomas and ictal laughter: Evolution of a characteristic epileptic 15
syndrome and diagnostic value of magnetic resonance imaging. Ann Neurol 23, 429-439. 16
Carney, P.W., Masterton, R.A., Harvey, A.S., Scheffer, I.E., Berkovic, S.F., Jackson, G.D., 17
2010. The core network in absence epilepsy. Differences in cortical and thalamic BOLD 18
response. Neurology 75, 904-911. 19
Carr, M.F., Jadhav, S.P., Frank, L.M., 2011. Hippocampal replay in the awake state: a 20
potential substrate for memory consolidation and retrieval. Nat Neurosci 14, 147-153. 21
Chaudhary, U.J., Duncan, J.S., Lemieux, L., 2013. Mapping hemodynamic correlates of 22
seizures using fMRI: A review. Hum Brain Mapp 34, 447-466. 23
Dagli, M.S., Ingeholm, J.E., Haxby, J.V., 1999. Localization of cardiac-induced signal change 24
in fMRI. Neuroimage 9, 407-415. 25
A Self-archived copy inKyoto University Research Information Repository
https://repository.kulib.kyoto-u.ac.jp

15
Delalande, O., Fohlen, M., 2003. Disconnecting surgical treatment of hypothalamic 1
hamartoma in children and adults with refractory epilepsy and proposal of a new 2
classification. Neurol Med Chir (Tokyo) 43, 61-68. 3
Fahoum, F., Lopes, R., Pittau, F., Dubeau, F., Gotman, J., 2012. Widespread epileptic 4
networks in focal epilepsies: EEG-fMRI study. Epilepsia 53, 1618-1627. 5
Fox, M.D., Snyder, A.Z., Vincent, J.L., Corbetta, M., Van Essen, D.C., Raichle, M.E., 2005. 6
The human brain is intrinsically organized into dynamic, anticorrelated functional networks. 7
Proc Natl Acad Sci U S A 102, 9673-9678. 8
Gotman, J., Grova, C., Bagshaw, A., Kobayashi, E., Aghakhani, Y., Dubeau, F., 2005. 9
Generalized epileptic discharges show thalamocortical activation and suspension of the 10
default state of the brain. Proc Natl Acad Sci U S A 102, 15236-15240. 11
Gotman, J., Pittau, F., 2011. Combining EEG and fMRI in the study of epileptic discharges. 12
Epilepsia 52 Suppl 4, 38-42. 13
Hamandi, K., Salek-Haddadi, A., Laufs, H., Liston, A., Friston, K., Fish, D.R., Duncan, J.S., 14
Lemieux, L., 2006. EEG-fMRI of idiopathic and secondarily generalized epilepsies. 15
Neuroimage 31, 1700-1710. 16
Hawco, C.S., Bagshaw, A.P., Lu, Y., Dubeau, F., Gotman, J., 2007. BOLD changes occur 17
prior to epileptic spikes seen on scalp EEG. Neuroimage 35, 1450-1458. 18
Jacobs, J., Kobayashi, E., Boor, R., Muhle, H., Stephan, W., Hawco, C., Dubeau, F., Jansen, 19
O., Stephani, U., Gotman, J., Siniatchkin, M., 2007. Hemodynamic responses to interictal 20
epileptiform discharges in children with symptomatic epilepsy. Epilepsia 48, 2068-2078. 21
Jacobs, J., Levan, P., Moeller, F., Boor, R., Stephani, U., Gotman, J., Siniatchkin, M., 2009. 22
Hemodynamic changes preceding the interictal EEG spike in patients with focal epilepsy 23
investigated using simultaneous EEG-fMRI. Neuroimage 45, 1220-1231. 24
A Self-archived copy inKyoto University Research Information Repository
https://repository.kulib.kyoto-u.ac.jp

16
Johnson, K.A., Jones, K., Holman, B.L., Becker, J.A., Spiers, P.A., Satlin, A., Albert, M.S., 1
1998. Preclinical prediction of Alzheimer's disease using SPECT. Neurology 50, 1563-1571. 2
Kahane, P., Ryvlin, P., Hoffmann, D., Minotti, L., Benabid, A.L., 2003. From hypothalamic 3
hamartoma to cortex: what can be learnt from depth recordings and stimulation? Epileptic 4
Disord 5, 205-217. 5
Kameyama, S., Masuda, H., Murakami, H., 2010. Ictogenesis and symptomatogenesis of 6
gelastic seizures in hypothalamic hamartomas: an ictal SPECT study. Epilepsia 51, 2270-7
2279. 8
Kameyama, S., Murakami, H., Masuda, H., Sugiyama, I., 2009. Minimally invasive magnetic 9
resonance imaging-guided stereotactic radiofrequency thermocoagulation for epileptogenic 10
hypothalamic hamartomas. Neurosurgery 65, 438-449; discussion 449. 11
Kang, J.K., Benar, C., Al-Asmi, A., Khani, Y.A., Pike, G.B., Dubeau, F., Gotman, J., 2003. 12
Using patient-specific hemodynamic response functions in combined EEG-fMRI studies in 13
epilepsy. Neuroimage 20, 1162-1170. 14
Kokkinos, V., Zountsas, B., Kontogiannis, K., Garganis, K., 2012. Epileptogenic networks in 15
two patients with hypothalamic hamartoma. Brain Topogr 25, 327-331. 16
Kuzniecky, R., 2004. Catastrophic focal epilepsy. Epilepsia 45 Suppl 4, 2-3. 17
Kuzniecky, R., Guthrie, B., Mountz, J., Bebin, M., Faught, E., Gilliam, F., Liu, H.G., 1997. 18
Intrinsic epileptogenesis of hypothalamic hamartomas in gelastic epilepsy. Ann Neurol 42, 19
60-67. 20
Laufs, H., Hamandi, K., Salek-Haddadi, A., Kleinschmidt, A.K., Duncan, J.S., Lemieux, L., 21
2007. Temporal lobe interictal epileptic discharges affect cerebral activity in "default mode" 22
brain regions. Hum Brain Mapp 28, 1023-1032. 23
A Self-archived copy inKyoto University Research Information Repository
https://repository.kulib.kyoto-u.ac.jp

17
Leal, A.J., Monteiro, J.P., Secca, M.F., Jordao, C., 2009. Functional brain mapping of ictal 1
activity in gelastic epilepsy associated with hypothalamic hamartoma: a case report. Epilepsia 2
50, 1624-1631. 3
Lemieux, L., Salek-Haddadi, A., Josephs, O., Allen, P., Toms, N., Scott, C., Krakow, K., 4
Turner, R., Fish, D.R., 2001. Event-related fMRI with simultaneous and continuous EEG: 5
description of the method and initial case report. Neuroimage 14, 780-787. 6
Moeller, F., Siebner, H.R., Wolff, S., Muhle, H., Boor, R., Granert, O., Jansen, O., Stephani, 7
U., Siniatchkin, M., 2008. Changes in activity of striato-thalamo-cortical network precede 8
generalized spike wave discharges. Neuroimage 39, 1839-1849. 9
Mullatti, N., Selway, R., Nashef, L., Elwes, R., Honavar, M., Chandler, C., Morris, R., Jarosz, 10
J., Buchanan, C., Polkey, C., 2003. The clinical spectrum of epilepsy in children and adults 11
with hypothalamic hamartoma. Epilepsia 44, 1310-1319. 12
Munari, C., Kahane, P., Francione, S., Hoffmann, D., Tassi, L., Cusmai, R., Vigevano, F., 13
Pasquier, B., Betti, O.O., 1995. Role of the hypothalamic hamartoma in the genesis of 14
gelastic fits (a video-stereo-EEG study). Electroencephalogr Clin Neurophysiol 95, 154-160. 15
Parvizi, J., Anderson, S.W., Martin, C.O., Damasio, H., Damasio, A.R., 2001. Pathological 16
laughter and crying: a link to the cerebellum. Brain 124, 1708-1719. 17
Pittau, F., Levan, P., Moeller, F., Gholipour, T., Haegelen, C., Zelmann, R., Dubeau, F., 18
Gotman, J., 2011. Changes preceding interictal epileptic EEG abnormalities: comparison 19
between EEG/fMRI and intracerebral EEG. Epilepsia 52, 1120-1129. 20
Raichle, M.E., MacLeod, A.M., Snyder, A.Z., Powers, W.J., Gusnard, D.A., Shulman, G.L., 21
2001. A default mode of brain function. Proc Natl Acad Sci U S A 98, 676-682. 22
Siniatchkin, M., Coropceanu, D., Moeller, F., Boor, R., Stephani, U., 2011. EEG-fMRI 23
reveals activation of brainstem and thalamus in patients with Lennox-Gastaut syndrome. 24
Epilepsia 52, 766-774. 25
A Self-archived copy inKyoto University Research Information Repository
https://repository.kulib.kyoto-u.ac.jp

18
Spencer, S.S., 1994. The relative contributions of MRI, SPECT, and PET imaging in epilepsy. 1
Epilepsia 35 Suppl 6, S72-89. 2
Striano, S., Santulli, L., Ianniciello, M., Ferretti, M., Romanelli, P., Striano, P., 2012. The 3
gelastic seizures-hypothalamic hamartoma syndrome: facts, hypotheses, and perspectives. 4
Epilepsy Behav 24, 7-13. 5
Vulliemoz, S., Lemieux, L., Daunizeau, J., Michel, C.M., Duncan, J.S., 2010. The 6
combination of EEG source imaging and EEG-correlated functional MRI to map epileptic 7
networks. Epilepsia 51, 491-505. 8
Warach, S., Ives, J.R., Schlaug, G., Patel, M.R., Darby, D.G., Thangaraj, V., Edelman, R.R., 9
Schomer, D.L., 1996. EEG-triggered echo-planar functional MRI in epilepsy. Neurology 47, 10
89-93. 11
Weinstein, E.A., bender, M.B., 1943. Integrated facial patterns eliceted by stimulation of the 12
brain stem. Archives of Neurology and Psychiatry 50, 34-42. 13
Wethe, J.V., Prigatano, G.P., Gray, J., Chapple, K., Rekate, H.L., Kerrigan, J.F., 2013. 14
Cognitive functioning before and after surgical resection for hypothalamic hamartoma and 15
epilepsy. Neurology 81, 1044-1050. 16
Windischberger, C., Langenberger, H., Sycha, T., Tschernko, E.M., Fuchsjager-Mayerl, G., 17
Schmetterer, L., Moser, E., 2002. On the origin of respiratory artifacts in BOLD-EPI of the 18
human brain. Magn Reson Imaging 20, 575-582. 19
Woolrich, M.W., Ripley, B.D., Brady, M., Smith, S.M., 2001. Temporal autocorrelation in 20
univariate linear modeling of FMRI data. Neuroimage 14, 1370-1386. 21
Worsley, K.J., 2001. Statistical analysis of activation images., in: Jezzard, P., Matthews, P.M., 22
Smith, S.M. (Eds.), Functional MRI: An Introduction to Methods. Oxford University Press, 23
Oxford, pp. 251-270. 24
25
26
A Self-archived copy inKyoto University Research Information Repository
https://repository.kulib.kyoto-u.ac.jp

19
FIGURE LEGENDS 1
Figure 1. 2
(A) An example of identified interictal paroxysmal discharges from pt. 2 is displayed (arrow). 3
(B) Time-shift model of hemodynamic response function (HRF). For the timing of spikes as 4
events (such as the spike shown in A), the canonical HRF consisting of a double gamma 5
function was convolved (yellow trace). The model was shifted in steps of 2 s, creating 6 6
additional models to account for the differences in the time-course of blood oxygenation-7
level dependent (BOLD) signal changes associated with different brain regions. 8
9
Figure 2. 10
Representative findings of EEG-fMRI analysis and SISCOM. In two patients, representative 11
slices with time-shift models are shown. Arrowheads show the hamartoma and attachment 12
side in each patient. The voxels with significant activation [positive blood oxygenation-level 13
dependent (BOLD)] /deactivation (negative BOLD) by cluster-level statistics (p < 0.007 after 14
Bonferroni correction) are overlaid on each anatomical image. (A) In pt. 2 with left side 15
attachment to the hypothalamic hamartoma (HH), activation was observed in the HH 16
interface of the left hypothalamus and left lateral frontal cortex (t = -2). The result was 17
comparable with that of the subtraction ictal SPECT coregistered to MRI (SISCOM). Other 18
activations included the bilateral cerebellum (contralateral side dominant), and lateral 19
temporal lobes. Deactivations included the bilateral cunei, bilateral precunei, bilateral 20
hippocampi, and bilateral thalami. (B) In pt. 8 with bilateral attachments to the HH, 21
activations included the HH interface of the left hypothalamus, and left hippocampus and 22
amygdala. SISCOM did not yield significant hyperperfusion at and around HH. Deactivation 23
included the precunei, medial frontal cortices, and bilateral thalami. The regions satisfying p 24
< 0.007 by cluster-level statistics are shown for the EEG-fMRI analysis. 25
A Self-archived copy inKyoto University Research Information Repository
https://repository.kulib.kyoto-u.ac.jp

20
1
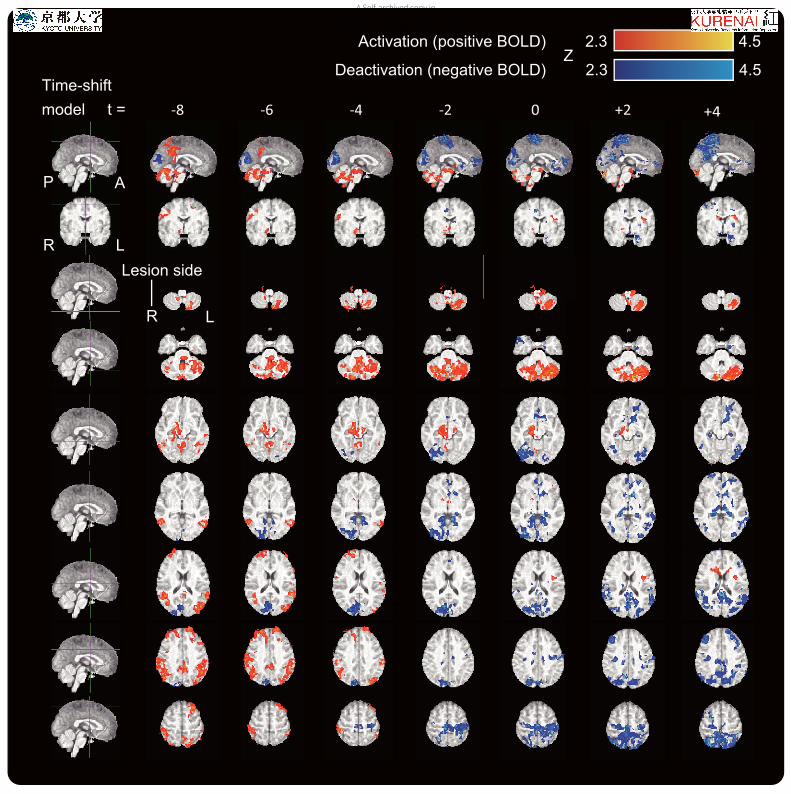
Figure 3. 2
Group analysis of EEG-fMRI. Group analysis of seven patients revealed the common 3
epileptic network associated with epilepsy with HH. Before group analysis, MRI images were 4
flipped in the left-right dimension so that the right hemisphere shows the side of attachment 5
(unilateral attachment) or that of predominant hypothalamic activation (bilateral attachment). 6
The voxels with significant activation/deactivation by cluster-level statistics (p < 0.007 after 7
Bonferroni correction) are overlaid on the group mean anatomical image in the MNI standard 8
space. Activations included the ipsilateral hypothalamus, brainstem tegmentum, bilateral 9
precunei, and lateral parietal lobes, mainly with early time-shift models, and the contralateral 10
dominant bilateral cerebellum (contralateral dominant) with later time-shift models. 11
Deactivations included the ipsilateral cuneus, bilateral caudate nuclei, thalami, hippocampi, 12
precunei, and lateral parietal lobes.13
A Self-archived copy inKyoto University Research Information Repository
https://repository.kulib.kyoto-u.ac.jp

21
Table 1 Clinical profiles of patients 1
Patient No.,
Age/gender
Hamartoma Gelastic
Sz Other types of Sz Complication AED Attachment side
Delalande classification
Maximum diameter (mm)
1. 15/M L III 20 + GTC PP VPA, CBZ 2. 8/M L III 16 + GTC, TC, CPS PP, BD, MR CZP, CLB, LTG 3. 3/M R II 7 + - BD VPA, LTG 4. 27/M R II 8 + GTC, SPS - CBZ 5. 1/F R II 10 + GTC - ZNS, LEV
6. 19/F Bilateral I 13 + AT PP, MR VPA, CBZ, GBP, TPM
7. 13/M Bilateral III 30 + TC, CPS PP, BD, MR CBZ, TPM, SL 8. 23/F Bilateral I 16 + GTC, CPS PP, BD VPA
Abbreviations: Sz = seizure, GTC = generalized tonic clonic, CPS = complex partial Sz, TC = tonic Sz, SPS = simple partial Sz, AT = atonic Sz, 2
PP = precocious puberty, BD = behavioral disorder, MR = mental retardation. 3
AED = antiepileptic drug 4
5
A Self-archived copy inKyoto University Research Information Repository
https://repository.kulib.kyoto-u.ac.jp

22
Table 2 Activation (positive BOLD) revealed by EEG-fMRI and SISCOM results 1
EEG-fMRI SISCOM
Patient No., Age/Gender
Spike location
Sedation: pentobarbital
(mg/kg)
Total recording time (min)
No. of analyzed
spikes
Laterality concordance between EEG
spike and cortical
activation from t = -8 to 0
model
Activation in or around the
hypothalamus which has the HH interface (The earliest model that
showed activation)
Laterality concordance
between EEG spike and cortical
hyperperfusion (the cortex showing most
significant hyperperfusion)
Hyperperfusion in or around
the hypothalamus which has the HH
interface
1. 15/M L PQ 2.8 70 73 n.d. ✓ ( -2) No Sz recorded 2. 8/M L FC 2.5 56 41 ✓ (L LF/ P) ✓ ( -2) ✓ (L T, L P) ✓ 3. 3/M L FC (ST) 16.2 56 9 n.d. n.d. - (Not clear, R O) n.d. 4. 27/M R AQ - 90 17 ✓ (R O) n.d. No Sz recorded
5. 1/F G (R > L) 2.6 (+trichlofos 0.5 mg/kg) 77 9 ✓ (R MF) ✓ (-2)
✓ (Not clear, R insula) n.d.
6. 19/F Bilateral F (L > R)
1.31 (+midazolam 0.65 mg/kg)
56 451 ✓ (L LF) ✓ (-8) Not done
7. 13/M G (L > R) 1.9 30 434 ✓ (L LF) ✓ ( -8) - (L G, R MF) ✓ 8. 23/F L AQ - 56 39 ✓ (L P) ✓ ( -2) - (Not clear, R FP) n.d.
Abbreviations: Sz = seizure. PQ = posterior quadrant, FC = frontocentral, ST = sharp transients, AQ = anterior quadrant, G = generalized, F = 2
frontal. MF = medial frontal, LF = lateral frontal, P = parietal, T = temporal, O = occipital, FP = frontal pole, “n.d.” = no cortical BOLD activity 3
(EEG-fMRI) / no hyperperfusion (SISCOM) detected.4
A Self-archived copy inKyoto University Research Information Repository
https://repository.kulib.kyoto-u.ac.jp

23
Table 3 Summary of Activation/Deactivation by EEG-fMRI1
Patient No., Age/Gender
Deep brain Frontal-Parietal
Hypo-thalamus Thalamus Caudate Midbrain Cerebellum
Central sulcus
Oper-culum
Lateral Frontal
Medial Frontal Insula Lateral
parietal
Precuneus /posterior cingulate
1. 15/M Aa Aa Aa Ac D D Db D D D D 2. 8/M Ab Ab/D D Dc Ac Ac Ac/D Aa ,b/D Ab/D A/D Aa, b/D Ab /D 3. 3/M D Db Db 4. 27/M D Ab Ab 5. 1/F Aa, b Aa, b Aa Aa D D Aa, b Db A 6. 19/F A A/D D A Aa, c/D A/D Aa /D Aa, b/D Aa /D A/D Aa /D Aa /D 7. 13/M Aa /D D D A Aa, c/D Aa /D Aa /D Aa, b/D D D Aa /D Aa /D 8. 23/F Ab D D D Ab/D Ab/D Aa /D D
Patient No., Age/Gender
Temporal Occipital
Lateral medial 1. 15/M D D 2. 8/M Ac/D Db D 3. 3/M Db 4. 27/M Aa, b 5. 1/F D Ab 6. 19/F Aa/D D A/D 7. 13/M Aa/D Aa/D Aa /D 8. 23/F Ab Ab Ab/D
Abbreviation; A: activation, D: deactivation.
a: the earliest time-shift model activation,
b: ipsi/unilateral dominant,
c: contralateral dominant.
A Self-archived copy inKyoto University Research Information Repository
https://repository.kulib.kyoto-u.ac.jp

-6 +6time (s)
0
spike
A
B
Fp1-A1
F3-A1
C3-A1
P3-A1
Fp2-A2
F4-A2
C4-A2
P4-A2
O1-A1
F7-A1
T1-A1
T3-A1
T5-A1
F8-A2
T2-A2
T4-A2
T6-A2
Fz-A1
Pz-A1ECG
Cz-A2
O2-A2
1 s200 µV-
A Self-archived copy inKyoto University Research Information Repository
https://repository.kulib.kyoto-u.ac.jp
kusami1
タイプライターテキスト
Fig. 1

A
B
t = -2
SISCOM
t = 0 +2 +4
t = -2
SISCOM
t = -4 0
ictal: GTCS
Activation
Deactivation
2.3 4.5
2.3 4.5
Z
EEG-fMRI
2 5Z
SISCOM
Z
R L
R L
R L
R L
A Self-archived copy inKyoto University Research Information Repository
https://repository.kulib.kyoto-u.ac.jp
kusami1
タイプライターテキスト
Fig. 2
-8 -6 -4 -2 0 +2 +4
Activation (positive BOLD)
Deactivation (negative BOLD)
2.3 4.5
2.3 4.5Z
R L
R L
P A
Time-shift model t =
Lesion side
A Self-archived copy inKyoto University Research Information Repository
https://repository.kulib.kyoto-u.ac.jp
kusami1
タイプライターテキスト
Fig. 3