Tirupur (India) Knitwear
32
Trivikram Arun Sumeet Bhalla Joe Fraser Kevin Nicholson Harvard University The Microeconomics of Competitiveness Professor Michael E. Porter Project Advisor: Professor Niels Ketelhöhn TIRPUR KNITWEAR CLUSTER TAMIL NADU, INDIA 6 th May 2011
Transcript of Tirupur (India) Knitwear

Trivikram Arun Sumeet Bhalla Joe Fraser Kevin Nicholson
Harvard University
The Microeconomics of Competitiveness
Professor Michael E. Porter
Project Advisor: Professor Niels Ketelhöhn
TIRPUR KNITWEAR CLUSTER
TAMIL NADU, INDIA
6th May 2011

Acknowledgement
The authors are beholden to the Institute for Strategy and Competitiveness (ISC) of Harvard
Business School for all the experience and learning this research project exposed them to. The
authors would like to express their sincere gratitude to Professor Michael Porter for his teaching
and guidance throughout the course. The authors would also like to thank Professor Niels
Ketelhohn for his feedback and support during the research project.
In addition, the authors would like to specially express their sincere gratitude to the following
persons for their time during interviews and for sharing cluster and trade specific data.
(i) Mr. A. Sakthivel, President, Federation of Indian Exporters Organisation (FIEO),
Ministry of Commerce, Government of India. Mr. A. Sakthivel is also the President of
Tirupur Exporters Association (TEA) and the Managing Director of Poppys Knitwear
Private Ltd, one of the leading knit wear exporters in Tirupur.
(ii) Mr. Susanta Sekhar, Director, Ministry of Textiles, Government of India.
(iii) Mr. Mukesh Gulati, Executive Director, Foundation of MSME Clusters, India.
(iv) Mr. S. Sakthivel, Executive Secretary, Tirupur Exporters Association, Tirupur, Tamil
Nadu, India.

1
1. Executive Summary Though India’s GDP grew close to 8% between 2001 and 2010, this growth has not been
inclusive. Poverty has increased in absolute terms, and the country faces severe constraints in:
providing social mobility for its burgeoning population, social and physical infrastructure,
overcoming fiscal deficit, and reforming an increasingly fractured political system. These
challenges combined with corruption and laxity in enforcing standards and regulations at the
state (Tamil Nadu) level, have weakened the competitiveness of the Tirupur knitwear cluster.
Interviews and extensive research have highlighted that the Tirupur cluster exported
$2.5B in 2010, and exports grew at a 15% CAGR since 1990. The cluster provides direct
employment to 350K workers and the number of manufacturing units grew from 1 in 1925 to
6250 in 2010. However, the export centric cluster is exposed to volatilities in foreign markets
and continues to produce low-value products. The cluster has weak local demand, moderate
factor conditions, moderate context for firm strategy and rivalry, and strong related and
supporting industries. There is an urgent need to address cluster specific deficiencies for long-
term competitiveness. These include a) strengthening infrastructure, b) innovating to produce
high-value products and c) balancing export and domestic revenue channels. Policy
recommendations for India, Tamil Nadu and the Tirupur cluster have been presented.
For firms Shift away from price based competition to high-value product design, customisation, quality and international brand building via innovation.
Focus on local branding for better outreach into domestic markets. Partner with local training institutes to promote process, product innovation
For Government
Upgrade power, port and road infrastructure within and outside Tirupur. Encourage public procurement from cluster to invigorate domestic demand. Encourage large-scale production by providing world-class one stop
infrastructure facilities. For IFCs Develop a comprehensive pro-active long-term cluster strategy for Tirupur.
Encourage partnership among local colleges/institutions, cluster firms and foreign design centers to develop human capital and a knowledge culture.
Summary of Cluster Recommendations

2
2. India and its Competitive Position
2.1 Profile and Endowments With a population of over 1.2B inhabitants (Census of India, 2011) and a nominal gross domestic
product (GDP) of over $1.5 trillion (India Economic Survey, 2011), India is the world’s second
largest country by population and ninth largest economy by GDP. India is a country with a 5000
year history, rich in culture and diversity of religions and languages. India is rich in coal, iron
ore, bauxite, and copper ore, and is one of the largest producers of iron in the world. Major
portion of electricity is generated from coal and it is estimated that India has around 92B tons of
proven coal reserves, enough to last for over a century.1 Moderate reserves of oil have been
found off the coast of the states of Assam, Maharashtra and Gujarat. India is blessed with
extraordinary land fertility. In terms of cultivable area, India is well-endowed with nearly three-
fifth of its geographical area cultivable.2 When India gained independence from Britain in 1947,
she inherited a parliamentary democracy, the common law, a robust civil service/administration
system, and an expansive railway infrastructure. In early 2011, India had 28 states and 7 union
territories, and was the world’s largest democracy.
2.2 Macroeconomic Competitiveness - Macroeconomic Policies:
2.2.1 From independence through the 1980s, India’s economy grew at 3.5% referred to as the
“Hindu rate of growth” by the late economist Raj Krishna (Ahluwalia, 1995). Import
substitution, license-quota, technological stagnancy and corruption handicapped India’s
competitiveness during this period (Ahluwalia, 1995). Government nationalization efforts and
accumulation of foreign debt engendered domestic investment and higher growth (7.6%) in the
1 Ministry of Coal, Government of India, “Coal: Choice for Indian Energy,” http://www.coal.nic.in/welcome.html, accessed April 2011. 2 Centre for Policy Studies, “A Land of Rare Natural Endowments,” http://www.cpsindia.org/downloads/timeless/Section%201.pdf, accessed April 2011.

3
late 1980s (Vietor, 2009), until the 1991 balance of payment crisis imploded the economy. Dr.
Manmohan Singh, the Finance Minister at the time and current Prime Minister of India began the
process of liberalising India’s economy by reducing taxes and tariffs, encouraging FDI, and
privatizing public-sector industries. This saw the beginning of an era of high growth.
India’s economic growth over the past decade has mostly hovered over 8% per year, a bit slower
than China’s but faster than that of the rest of Asia and the world (Figure 1). However, India’s
average annual growth in GDP per capita is 6% compared to China’s 10% (Figure 2). This is
largely due to India’s high population growth of ~1.5% per annum (EIU, 2011), which poses a
major challenge for India.
2.2.2 As India’s economy has grown, so has its labor productivity and wages. India’s labor
productivity increased an average of 5.5% per year over the past decade, more than most other
countries in Asia; however China’s labor productivity growth of 9.5% far exceeded India’s (EIU,
2011). India’s growth in real wages (18.5%) annually over the past decade was nearly twice that
of China’s (12.3%) (EIU, 2011). While this across-the-board growth bodes well for India’s
macroeconomic competitiveness, it underlies an equally significant concern: India’s labor
allocation. Figure 3 delineates the composition of India’s economy, whereas Figure 4 reveals
India’s labour allocation. Majority of Indian workers work in the agricultural sector, which
Figure 1: Real GDP Growth (2001-2010) Figure 2: Growth per Capita GDP (2001-2010)
Source: Economist Intelligence Unit, 2011 Source: Economist Intelligence Unit, 2011

4
represents a mere sixth of India’s
economy. As the sector share of
agriculture to GDP is shrinking,
India faces a major challenge to
redistribute employment away
from agriculture.
2.2.3 When it comes to attracting Foreign Direct Investment (FDI), India performs moderately
when compared to other export driven economies of similar maturity. India outperformed its
neighbors including Indonesia, Thailand, and Vietnam on net FDI inflows as a percentage of
national GDP (World Bank, 2011). Additionally, India has resisted the international downward
trend, experiencing an increase of 2-3% of GDP between 2007 and 2009 (World Bank, 2011).
An analysis of Net FDI Inflows in Figure 5 indicates that China has far outpaced India in
attracting FDI. Despite a decrease in FDI inflows since 2008, China still attracted $96B in 2009,
as opposed to India’s $37B (Figure 5).
Even with India’s recent trend in attracting
a greater amount of FDI as a percentage of
GDP, it still has a long way to go in order to
match China. FDI attraction is crucial for
India’s economic growth, as foreign
investment is required for major infrastructure projects in the absence of large domestic capital
sources. Between 2000 and 2008, Services ($14.3B) and Computer Software and Hardware
($7.5B) attracted the lion’s share of India’s total FDI. During this period, the textiles sector
attracted only $538M in FDI (Alfaro and Iyer, 2009). The low FDI levels in the Textiles sector
signify the limited capital intensity of textiles operations in India, making it unattractive for
Figure 4: Sector Share of Workforce
Source: Economist Intelligence Unit, 2011
Source: Economist Intelligence Unit; 2011
Figure 5: FDI Net Inflows (US $ Billions)
Figure 3: Sector Share of GDP
Source: Euromonitor International, 2011; UNCTAD, 2011

5
foreign investors. Overall assessment of India’s performance in FDI is mixed. While foreign
investors are increasingly being attracted to high-tech sectors such as services, IT, and telecom,
other sectors such as textiles, petrochemicals and power have struggled to offer an attractive
value proposition for foreign investors. This variability in FDI levels questions diversity of
India’s national competitiveness.
2.2.4 India’s fiscal policy has been to spend borrowed money, resulting in its national debt equal
to 60% of GDP as against 22% for China and 31% for developing Asian economies (Figure 6).
High national debt has the potential to slow down growth and cause inflation (Reinhardt et.al,
2010). India has struggled to keep inflation under control. India’s inflation rate exceeds that of its
neighbors and has nearly doubled from 6.4% in 2007 to 12% in 2010 (Figure 7). Both debt and
rising inflation threaten India’s macroeconomic competitiveness.
2.3 Macroeconomic Competitiveness - Political Institutions & Social Infrastructure
2.3.1 Modeled after the British Westminster system, India’s parliamentary government
represents a vast heterogeneous society that has subsequently spawned a large number of
coalitions. In early 2011, India had 26 prominent national and regional political parties, and
hundreds of smaller political parties.3 Regional parties have gained significant influence over the
3 The Election Commission of India, “Constitution of Political Parties,” http://eci.nic.in/eci_main/mis‐Political_Parties/Constitution_PoliticalParties.asp, accessed April 2011.
Figure 6: Net Government Debt Figure 7: Consumer Price Index (CPI)
Source: Economist Intelligence Unit, 2011 Source: Economist Intelligence Unit, 2011

6
last 40 years as they project themselves to represent the marginalized sections of the society
(Chawla, 2009). As a result, the power balance has over the last decade shifted from the central
government to state governments (Vietor, 2009) and policy making at the national level has been
hamstrung by parochial considerations limited to specific states or communities.
2.3.2 The weighty challenges of social infrastructure weaken India’s competitiveness. Though
the percentage living below the poverty line decreased from 60% (1981) to 42% (2005), in
absolute terms, the number of Indians living at or below $1.25 a day increased from 451M in
1981 to 456M in 2005 (World Bank, 2010). Furthermore, India ranks 119th out of 169 countries
(30 spots below China) on the United Nations’ Human Development Index (HDI), a comparative
measure of life expectancy, literacy, education, and standards of living. India needs to grow at a
rate of at least 10% per annum to get rid of chronic poverty, ignorance, and disease which still
afflict millions of its citizens (Singh, 2008).
2.4 Microeconomic Competitiveness - Quality of National Business Environment
2.4.1 India’s exports grew significantly in size and share between 1997 and 2007 (Figure 8).
Textiles constitute one of the largest and fastest growing subsets of India’s exports.
Figure 8: India’s Export Market Share and Growth
Source: Institute for Strategy and Competitiveness, Cluster Study 2006

7
2.4.2 Restraining India are a complex regulatory regime and protectionist policies that work
together to make India a difficult place to do efficient business. According to the World Bank,
India currently ranks 134th out of 183 countries in terms of ease of doing business. The ranking,
seen in Figure 9, indicates that India lags behind its current GDP per capita ranking of 70 in
numerous important categories, highlighting the extent to which India’s regulatory regime
hinders its macroeconomic competitiveness.
2.4.3 The problems with India’s regulatory regime are further exemplified by the complexities of
the nation’s tax code and contract enforcement system. Both contract enforcement and tax
collection play a critical role in determining the climate of a nation’s business environment. The
World Bank’s research indicates that those doing business in India spend much more time and
money during the course of enforcing contracts and paying their taxes (Figure 10). To continue
growing, India must address these regulatory barriers.
2.4.4 The cumulative effect of these constraints is summarised in the National Diamond (Figure
11). India’s factor conditions are helped by aspects of its growing capital markets, financial
services, education and administrative setup (colonial legacy), but severely hampered by
overstrained public infrastructure (power, roads, ports) and low internet penetration (~3% of total
Figure 9: India – Ease of doing business
Source: World Bank, 2011
Figure 10: Enforcing Contracts and Paying Taxes
Source: World Bank Doing Business, 2011

8
Figure 11: India National Diamond
population). While India provides strong investor protection and effective anti-trust policies, the
context for firm strategy and rivalry is weakened by India’s complex regulatory regime, poor
enforcement of regulation, corruption,4
and protectionist policies. India’s
national diamond is balanced by strong
local demand conditions emanating
from a larger and sophisticated
population of buyers, and government
success in promoting key industries. But
local demand is constrained by poor
enforcement of quality, safety and
environmental standards and weak consumer protection laws. India’s related and supporting
industries (RSI) are also a boon, with large local supplier quantity, and consistent availability of
both agricultural products and industrialized regions with critical machinery. However RSIs are
hampered by lack of specialised R&D and training services.
3.0 Tamil Nadu and Its Competitive Position
3.1 Profile and Endowments: The southern state of Tamil Nadu with a population of 72M is the
seventh most populous Indian state and is the eleventh largest Indian state, as measured by
geographic area (Census of India, 2011). Tamil Nadu is heavily dependent on monsoon rains,
and is prone to droughts when the monsoons fail. The climate of the state ranges from dry sub-
humid to semi-arid. Tamil Nadu is an agricultural state and is a major producer of sugar cane,
4 India scores 3.3 out of 10, where 0 represents being most corrupt ‐ Global Edge, “Corruption Perception Index”, http://globaledge.msu.edu/countries/india/rankings/, accessed May 2011
Source: Interviews; Team analysis

9
food grains (rice, maize, millet), and horticulture.5 With the third longest coastline in India,
Tamil Nadu represented 27.54% of the total value of fish and fishery products exported by India
in 2006.6 Tamil Nadu is also a leader in poultry and fisheries production. Tamil Nadu has a long
tradition of venerable culture. Tamil Nadu is known for its rich tradition of literature, music and
dance which continue to flourish today. Unique cultural features like Bharatanatyam (dance),
Tanjore painting, and Tamil architecture were developed and continue to be practised in Tamil
Nadu. The state is among the most industrialized in the nation and is home to the “Textile Valley
of India”, and to India’s largest knitwear cluster located at Tirupur.
3.2 State Economic Competitiveness
3.2.1 Tamil Nadu’s gross state GDP (GSDP) of $73B makes it the third largest economy in India
(IBEF, 2010). The state has a higher literacy rate (80.30%) compared to the national average
(74%), higher per capital GDP than the national average, and is amongst the highest FDI
attracting states in India (Table 1). Tamil Nadu has a stable political environment with electoral
results providing a single-party government over the last four decades. Successive state
5 Titi Tudorancea Bulletin, “Tamil Nadu Profile”, http://www.tititudorancea.com/z/tamil_nadu.htm, accessed May 2011. 6 Ibid.
Table 1: Macroeconomic Parameters Table 2: Factor Inputs
Source: IBEF, 2010 Note: GSDP is Gross State Domestic Product
Source: IBEF, 2010
10
governments have been committed towards creating a progressive business environment (IBEF,
2010). The state has largely peaceful living conditions and has low crime rate, making it an
attractive destination for industries.
3.2.2 Quality of State Business Environment
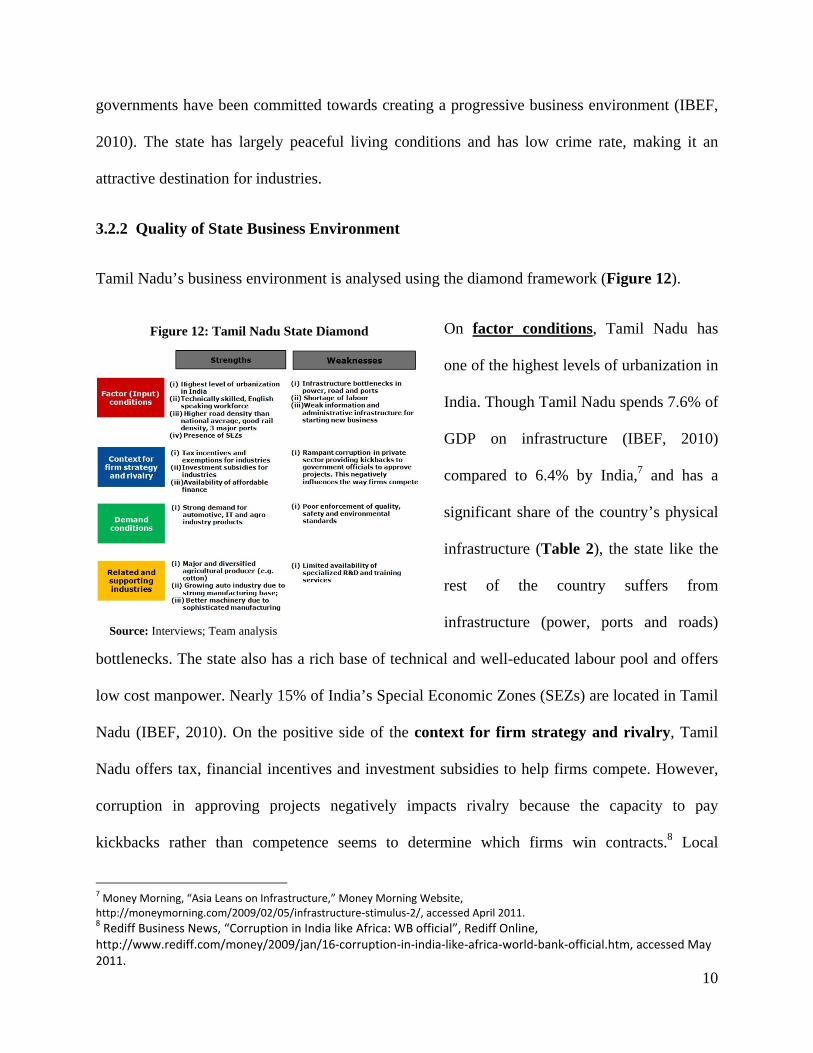
Tamil Nadu’s business environment is analysed using the diamond framework (Figure 12).
On factor conditions, Tamil Nadu has
one of the highest levels of urbanization in
India. Though Tamil Nadu spends 7.6% of
GDP on infrastructure (IBEF, 2010)
compared to 6.4% by India,7 and has a
significant share of the country’s physical
infrastructure (Table 2), the state like the
rest of the country suffers from
infrastructure (power, ports and roads)
bottlenecks. The state also has a rich base of technical and well-educated labour pool and offers
low cost manpower. Nearly 15% of India’s Special Economic Zones (SEZs) are located in Tamil
Nadu (IBEF, 2010). On the positive side of the context for firm strategy and rivalry, Tamil
Nadu offers tax, financial incentives and investment subsidies to help firms compete. However,
corruption in approving projects negatively impacts rivalry because the capacity to pay
kickbacks rather than competence seems to determine which firms win contracts.8 Local
7 Money Morning, “Asia Leans on Infrastructure,” Money Morning Website, http://moneymorning.com/2009/02/05/infrastructure‐stimulus‐2/, accessed April 2011. 8 Rediff Business News, “Corruption in India like Africa: WB official”, Rediff Online, http://www.rediff.com/money/2009/jan/16‐corruption‐in‐india‐like‐africa‐world‐bank‐official.htm, accessed May 2011.
Figure 12: Tamil Nadu State Diamond
Source: Interviews; Team analysis

11
demand conditions in sectors such as IT, automotive and agri-products are strong and more
sophisticated than most other states in India. However, the state suffers from poor enforcement
of quality, safety9 and environment standards (Rangarajan, 2010). Tamil Nadu has numerous
agricultural and horticultural related and supporting industries. The strong and growing
medical, IT and automotive manufacturing base has given birth to foreign manufacturing units
(e.g. Motorola, Nokia, Hyundai etc.) in the state. The state hosts traditional music festivals and is
home to the popular Tamil film industry.
4. National and State Recommendations
4.1 National Recommendations
India needs to initiate bold reforms in four key areas namely (a) creating employment
opportunities for its burgeoning population to reduce disguised unemployment (e.g. in
agricultural sector), (b) addressing growing fiscal deficit, which is straining social and
infrastructure development expenditure, (c) urgently addressing population rise, which creates
shortages everywhere and raises the incentives for rent seeking, (d) reforming the political
system to restrict the number of political parties with regional and narrow aspirations, which
subordinate growth to populism, which support discrimination at the expense of merit, and which
halts progress due to slow decision-making.
4.1.1 Large-scale manufacturing and SEZs to create jobs: To achieve this objective: First, a
floor on the size of large-scale manufacturing projects and SEZs should be set. For this, India
must move to strengthen property rights by resolving land acquisition issues for industrial
projects and SEZs by rescinding the urban land ceiling act across the country and increasing
transparency in land ownership by computerising land records. SEZs should be strengthened by
9 The Hindu, “Need for enforcement of road safety regulations”, Hindu Online, http://www.hindu.com/2010/05/01/stories/2010050161170300.htm, accessed May 2011.

12
improving the quality of the physical and administrative infrastructure rather than providing tax
sops, which would only divert economic activity from the rest of the economy into SEZs.
Second, the government should earmark critical sectors (e.g. utilities, roads, airports, ports) for
proactive FDI attraction. Moves to reduce regulatory burdens and simplify the tax system via a
flat tax rate10 will positively impact FDI inflows into these sectors. Thirdly, red-tape associated
with new business creation should be reduced by allowing contract enforcement through
automation, transparency & communication. The country should move towards a “single
window clearance” for Small and Medium Enterprises (SMEs) particularly credit-constrained
businesses from low-income households. Finally, government should collaborate with private
sector to promote life-long learning and skills development initiatives for low-skilled workers in
order to enable upward social mobility.
4.1.2 Remove subsidies to address deficit: India must end voter-friendly policies, such as fuel
subsidies, free power, cheap fertilizer and farm loan forgiveness. Money should instead be spent
to improve social infrastructure (education and health) and physical infrastructure (roads, ports,
utilities). India should aim for a balance sheet that is robust enough to allow increase in public
liabilities by 10% - 20% in short-life for stimulus packages during down-turns. For this, a debt-
to-GDP ratio of less than 30% is required during good times. Medium-term fiscal consolidation
involving a substantial reduction of public sector indebtedness is an urgent task for the future.
4.1.3 Population Control: Half of India’s future excess population growth is expected to come
from its six poorest states. The broad population targets set by the central government have been
poorly implemented by these states. The government must launch precise and strict guidelines to
implement population control measures. In the short-term, these could include continuation of
10 The Government has already initiated reforms in this direction with the initiation of the direct tax bill and GST
13
cash incentives to slow birth rate and restricting public benefits only for parents participating in
family planning. Simultaneously, the government, private sector and civil societies should
partner to chalk out a long-term streamlined effort to increase spending and oversight on rural
family planning in poor states to change deeply ingrained customs such as teenage marriages.
4.1.4 Reforming the political setup: Firstly, the Election Commission of India should restrict
the number of political parties by derecognising smaller political parties based on their
performance, banning the offer of freebies to woo voters before elections, increasing the number
of primary members required to form a political party, and increasing the security deposit to
eliminate non-serious candidates. Secondly, the first-past-the-post system should be abolished
and replaced with a two-stage electoral process, in which a second round of elections (with top
two candidates from first round) will decide the winner if no candidate gets at least 50% of the
votes polled in the first round. Thirdly, simultaneous elections should be held at the central and
state levels to allow the regime in power to take tough decisions without fear of a backlash in the
next round of state/central elections (whichever comes earlier).
4.2 State Recommendations
4.2.1 Improving availability of R&D and Training Services
Improving the quality of the educated work force is both the responsibility of the public and
private sectors. The private sector should be mandated to invest in the education system via
public-private partnerships to solve the funding problem. Aside from providing the necessary
funds and equipment, the private sector should offer R&D internships and apprenticeships
positions to augment the knowledge gained in classrooms, especially at the higher secondary,
vocational and university levels.
14
4.2.2 Enforce stringent quality, safety and environmental standards: The government ought
to enforce strict quality, safety and environment standards by increasing political and executive
transparency/accountablity in the approval process. Rules should be simplified, made public, and
the staged approval process (along with the approving authority) should be computerised and
made public. Fast track courts should be setup to resolve violations within six months.
The national and state recommendations are not mutually exclusive. The federal setup
requires active coordination between the central/state agencies, private sector and civil societies
to execute these recommendations.
5. The Global and Indian Knitwear Industry
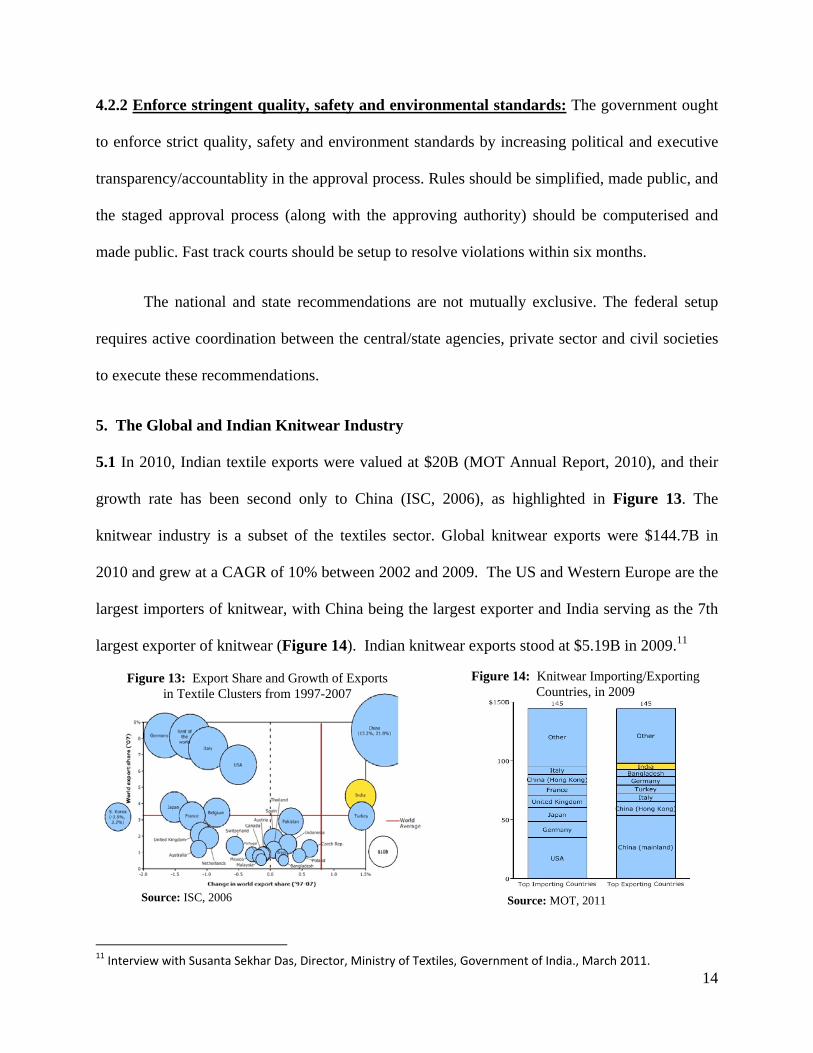
5.1 In 2010, Indian textile exports were valued at $20B (MOT Annual Report, 2010), and their
growth rate has been second only to China (ISC, 2006), as highlighted in Figure 13. The
knitwear industry is a subset of the textiles sector. Global knitwear exports were $144.7B in
2010 and grew at a CAGR of 10% between 2002 and 2009. The US and Western Europe are the
largest importers of knitwear, with China being the largest exporter and India serving as the 7th
largest exporter of knitwear (Figure 14). Indian knitwear exports stood at $5.19B in 2009.11
11 Interview with Susanta Sekhar Das, Director, Ministry of Textiles, Government of India., March 2011.
Figure 14: Knitwear Importing/Exporting Countries, in 2009
Source: MOT, 2011 Source: ISC, 2006
Figure 13: Export Share and Growth of Exports in Textile Clusters from 1997-2007

15
5.2 A cluster refers to a geographically proximate group of interconnected companies and
associated institutions involved in the knitwear value chain (Porter, 1998). The knitwear value
chain comprises of procuring yarns, knitting panels, cutting or trimming cloth, assembling
panels, finishing, and selling in the domestic market or export markets. Table 3 presents the
major advantages and weaknesses of key competing export centric clusters in the region.
China: The Guandong province in China, which has the largest knitwear production base in
China in terms of production volume and which contributes to a third of the country’s knitwear
exports, has three main clusters – Shaxi, Xingtang, and Xiqiao (Li & Fung, 2006). These export
centric clusters cumulatively exported $21.9B in 2009,12 and are supported by the government on
cluster infrastructure (utilities, roads, ports, etc.) and the higher export duty drawback (15%)
offered to knitwear exporters.13 To build scale and increase the cluster’s competitiveness, the
Chinese government has supported large-scale manufacturing. However, rising labor costs, IP
violations, and the lack of independent Institutions for Collaboration (IFCs) are key issues
confronting the Chinese textile cluster (Elsayed et.al, 2006).
India: The Tirupur knitwear cluster exported $2.5B in 2010 corresponding to 66% of its total
value and over 40% of India’s total knitwear exports (TEA, 2011). The Tirupur cluster has
abundant access to raw materials (cotton) and is supported by strong IFCs. The cluster is known
for its entrepreneurial talent among SMEs and for its ability to fulfill orders with short lead times
of 2-4 weeks. The cluster, however, suffers from poor infrastructure support (in power, ports,
roads), low R&D, pollution and relatively higher logistics costs.
12 People’s Daily, “Guangdong garment exports decline,” People’s Daily Company website, http://english.peopledaily.com.cn/90001/90778/90861/6853721.html, accessed April 2011. 13 Export Duty Drawback is a refund on the levied duty offered by the Government to exporters

16
Bangladesh: Bangladesh has a growing export-centric knitwear production base and exported
$6.2B in 2009.14 Bangladesh benefits from the duty free export status awarded by the EU and
Canada, allowing exporters to offer a price at least 10% lower than competing clusters to their
buyers. This cluster imports raw materials, suffers from pollution, and low R&D.
Vietnam: Vietnam exported $3.97B of knitwear in 2009 (MOT, 2011) and benefits from exports
to Japan from the Vietnam-Japan Partnership Agreement (VJEPA).17 Vietnamese knitwear
products have good workmanship and product quality.18 Furthermore, the government has
embarked on an effort to increase the localisation rate of raw materials, particularly raw cotton,
14 Export promotion bureau. “Exports from Bangladesh,” Ministry of Commerce website,
http://www.epb.gov.bd/index.php?NoParameter&Theme=default&Script=exporttrend, accessed April 2011. 15 Interview with Mr. A. Sakthivel, President – The Federation of Indian Exporters Association, March 2011. 16 Ibid. 17 Vietnam Textile and Garment Industry Exhibition, “Textile and garment export may achieve $13B target in 2011,” http://www.vtgvietnam.com/marketnews_detail.asp?serno=201, accessed April 2011. 18 Ibid.
Location Main competitive advantages15
Major Weakness16
Overall Trend
2009 Cluster Exports (Billions)
2010 Country Textile Exports (Billions)
China ‐ Guandong (Shaxi, Xintang, Xiqiao clusters)
Strong infrastructure; higher duty drawback
Few IFCs; rising labour costs; IP violation
$21.9 $206
India – Tamil Nadu (Tirupur cluster)
Access to raw materials; strong IFCs; entrepreneurial talent; short lead‐time
Poor infrastructure; pollution; low R&D
$2.25 $20
Bangladesh (Chittagong, Dhaka, Gazipur and Narayanganj
Duty free exports to EU and Canada
Pollution; Low R&D
$6.2 $12.1
Vietnam (North Vietnam)
High workmanship; product quality; Localization of raw materials; Low‐cost labour
Productivity level is not adequately competitive
$3.97 $11.2
Pakistan Availability of raw materials; low‐cost labour
Outdated machinery, technology; Low skill level; Poor quality fibre
No specific cluster
$10
Table 3: Key Competing Knitwear Clusters in the South-Asia/Far-East region
Source: Interviews with officials from TEA, Ministry of Textiles

17
from 46% to 60% in 2011.19 The biggest concern for Vietnam is that productivity levels are not
adequately competitive. .
Pakistan: Though Pakistan exported $10B of textiles in 2010,20 its textiles production has shown
signs of decline (Shaikh et. al, 2010). Despite access to raw materials and low-cost labor,
Pakistani knitwear production suffers from outdated machinery and technology, high defect
rates, and low skill-level among its workforce (Shaikh et. al, 2010).
All of the above clusters lack brand leverage, and depend on the foreign buyer’s brand leverage.
6. Tirupur Knitwear Cluster History & Performance
6.1 History & Evolution
The origins of the Tirupur cluster date back to colonial times. Given its location in the middle of
a cotton farming belt, Tirupur is an ideal setting for cotton knitwear manufacturing (Cawthorne,
1995). In 1925, Tirupur opened its first cotton knitting factory. During the 1930s, long strikes
occurred in knitting factories in nearby cities, resulting in the establishment of many new
knitting factories in Tirupur (TEA, 2011). Producing mostly white vests, Tirupur benefited from
the popular belief that the purity of the local water supply yielded the whitest vests in India
(Ramaswamy et.al, 2003). Correspondingly, domestic demand surged during the 1940s, resulting
in significant growth. After an Italian garment manufacturer visited Tirupur to source cheap
knitwear in the 1970s, exports began and grew significantly in the 1980s (TEA, 2011).
6.2 Cluster constituents: Figure 15 depicts the Tirupur cluster map. Entities shaded yellow are
located in Tirupur, whereas those shaded pink only have dealerships based in Tirupur
(manufacturing transpires in other parts of Tamil Nadu and/or India). The heart of the cluster is
the production, which consists of over 6,250 companies specializing in garment making, knitting,
19 Ibid. 20 Business Recorder, “Textile exports surge 30.43pc in nine months,” Business Recorder website, Extrapolated for 12 months based on data quoted on http://www.brecorder.com/pakistan/industries‐a‐sectors/11758‐textile‐exports‐surge‐3043pc‐in‐nine‐months.html, accessed April 2011.

18
dyeing, and other activities. As clearly evidenced in the map, the cluster has a very strong
presence of IFCs. There are over 23 Trade and Industry Associations, 16 educational institutions,
and 38 banks supporting the cluster. Finally, the cluster is influenced by both the Central and
State Government policies, such as environmental, manufacturing and trade policies.
6.3 Cluster performance
Most indicators demonstrate growth in the
cluster. Firstly, the number of manufacturing
units has grown at a rate of 3% annually since
1995 to reach 6,250 units in 2010 (Figure 16).
Secondly, exports have been growing rapidly at
a 15% CAGR since 1990 to reach $2.5B in 2010, while domestic demand has been stagnant at
~$900M (Figure 17).21 The average price per item of clothing sold (to export market) has
remained almost flat at $2.4 per item (Figure 18 shows price was $2.3 in 1995, and $2.4 in
21 Interview with Mr. S. Sakthivel, Executive Secretary to the President of TEA, March 2011.
Source: TEA, 2011
Figure 16: Number of Manufacturing Units
Source: TEA, 2011, Footnote 20
Figure 15: Tirupur Knitwear Cluster Map

19
2005), signifying that the cluster continues to produce low-value products, such as T-shirts and
inner wear. Corresponding margins for manufacturers have been very low.
6.4 Impact of cluster on social prosperity
This cluster has positively impacted employment, which has been rising dramatically to reach
350k employees in 2010, an increase from 87k in 1995 (Figure 19). However, recent high
inflation has resulted in falling real wages for the past four years, as seen in Figure 20. To some
extent, the fall in real wage due to inflation has been counter balanced by a labour shortage
caused by the government national rural employment guarantee program (NREGA).22
6.5 Tirupur Knitwear Cluster: Competitiveness Assessment
Tirupur’s competitiveness is characterised by weak local demand conditions, moderate factor
conditions, context for strategy & rivalry and strong related & supporting industries (Figure 21). 22 The Mahatma Gandhi National Rural Employment Guarantee Act aims at enhancing the livelihood security of people in rural areas by guaranteeing hundred days of wage‐employment in a financial year to a rural household whose adult members volunteer to do unskilled manual work.
Figure 17: Total production
Source: TEA, 2011
Figure 18: Average Price per unit at gate
Source: Estimation from interviews
Figure 19: CPI-Adjusted Wage Rates
Source: Indiastat; Duraiswamy, 2006
Figure 20: Number of People Employed
Source: UNIDO, 1997; TEA, 2011

20
6.5.1 Moderate Factor Conditions: First and foremost, Tirupur has an abundant local supply of
cotton because India is the world’s second largest cotton grower and roughly 25% of India’s
cotton is grown in the southern states.23 Secondly, Tirupur has a large supply of cheap labor
around the city.
Tirupur district, (an area of 5200 sq. km. around Tirupur city), has a population of 1.9M people
of which roughly 60% live in rural areas (many of whom can be brought in to work in the
23 Cotton Corporation of India Website, http://www.cotcorp.gov.in/statistics.asp#area, accessed April 2011.
Figure 21: Tirupur Knitwear Cluster Diamond Analysis
Source: Interviews; Team analysis
Figure 22: International Wage Rate Comparison
Source: Indiastat; Duraiswamy, 2006; O’Rourke, 2008
Figure 23: Container Vessel Turnaround time
Source: Footnotes 30 and 31
21
knitwear cluster, as required).24 Wage rates of Tirupur’s garment workers are as of now also
relatively low at $0.38/hr (Duraiswamy, 2006)25 compared to many other knitwear-producing
countries, such as China at $0.86/hr (O’Rourke, 2008). Thirdly, Tirupur has many financial
institutions dedicated to the knitwear cluster. Bank density is high at one branch per 3,100
people26 versus 3,568 people in USA (Kumar et.al, 2005). There are also various government-
backed institutions setup to improve access to finance for firms in the cluster, such as National
Small Industries Corporation (NSIC) and the Small Industries Development Bank of India
(SIDBI) (Rangarajan, 2005). Fourthly, there are 16 institutions producing educated human
capital via both part-time and full-time courses relating to the knitwear cluster (TEA, 2011). For
instance, the NIFT-TEA Knitwear Fashion Institute produces 200 graduates per year and offers
courses in knitting, fashion-designing, merchandizing, apparel manufacturing and management
(TEA, 2011). Roughly 80% of these graduates are said to remain in Tirupur post-graduation.27
Despite these numerous strengths, lack of infrastructure is a major weakness. Tamil
Nadu spends 7.6% of GDP on infrastructure compared to 9% of GDP by China.28 Only 50% of
the allocated infrastructure budget reportedly reached its intended purpose as the rest is lost due
to corruption at various levels.29 Tirupur faces a chronic shortage of electricity, with the cluster
suffering from nearly 6 hours of power outage every day.30 Firms rely on diesel generators,
which double the cost of power. Shipping ports are relatively slower and inefficient; Figure 23
shows average container vessel turnaround time is 4.4 days in India compared to 10 hours in
24 Tirupur District Website, http://www.tiruppur.tn.nic.in/areapop.html, accessed April 2011. 25 The dependence on low wage rates for competitiveness may not be sustainable as wage rates are likely to raise over time as
is seen in the case in China. 26 Calculated using population of Tirupur and number of bank branches from Tirupur Mobi Website,
http://tirupur.mobi/directory/banks.php, accessed April 2011. 27 Interview with Mr. S. Sakthivel, Executive Secretary to the President of TEA, March 2011. 28 Money Morning, “Asia Leans on Infrastructure,” Money Morning Website, http://moneymorning.com/2009/02/05/infrastructure‐stimulus‐2/, access April 2011. 29 Press Quote by India’s Home Minister, “Half of India's road budget wasted: Chidambaram”, Economictimes.Indiatimes.com, accessed May 2011. 30 Interview with Mr. S. Sakthivel, Executive Secretary to the President of TEA, March 2011.

22
Hong Kong.31 32 Tirupur is also located very far away from ports; the closest port is 238km from
Tirupur.33 The poor quality of state roads increases logistics costs. Prior to the establishment of
Tamil Nadu Water Investment Company Ltd (TWIC) in 2001, Tirupur relied on hundreds of
tanker trucks to deliver water daily.34 TWIC, together with Tirupur Exporter Association (TEA)
and Infrastructure Leasing and Financial Services Limited (IL&FS) promoted a $220M water
project to supply water from the Cauvery River located about 55 Kms from Tirupur for industrial
and domestic use. The government also mandated the private sector to build waste-effluent
treatment plants to meet demands of the industry (although operational issues exist, as discussed
in the context for strategy and rivalry section below).35 TEA, an IFC, also led development of an
Inland Container Depot (ICD) to reduce time taken to complete shipping port customs
procedures when importing/exporting goods (TEA, 2011). Despite these improvements,
infrastructure bottlenecks weaken the competitiveness of the cluster. Further weaknesses include
a shortage of skilled and unskilled labor and insufficient housing availability for workers.36 As
the cluster has grown, these weaknesses have increased in significance.
6.5.2 Weak Local Demand: Tirupur is an export-centric cluster and local demand for the cluster
is weak. Since 2005, domestic demand has stagnated at ~$900M, whereas exports have grown
from $1.4B to $2.5B.37 Products sold in the local channels are unsophisticated and consist of
mostly inner-wear. The value add of products sold to foreign buyers is higher than that sold to
domestic buyers, as reflected in the higher average price per item of knitwear sold to
31 Business Standard, “Rise in turnaround time at ports a worry,” Business Standard Website,http://www.business‐standard.com/india/news/%5Crise‐in‐turnaround‐time‐at‐portsworry%5C/126969/on,accessed April 2011. 32 Hamburg Sud, “Ports & Terminals,” Company Website, http://www.hamburgsudline.com/hsdg/en/hsdg/regionalinformation/hongkong/hongkong_1/portsterminals/portsterminals_2.jsp, accessed April 2011. 33 Distances between Tirupur and nearby ports plotted using Google Maps. 34 Interview with Mr. S. Sakthivel, Executive Secretary to the President of TEA, March 2011. 35 Ibid. 36 Ibid. 37 Ibid.
23
international buyers ($2.41 in 2010).38 International companies set the quality standards in the
cluster, as design capability within the cluster is perceived as insufficient.
6.5.3 Strong Related & Supporting Industries (R&SI): Many RSIs exist in and around the
Tirupur cluster. These RSIs include yarn & thread suppliers, dye & chemical manufacturers,
packing material suppliers, and various other accessory producers, such as buttons. These
products are manufactured domestically and manufacturers either have agents representing them
in Tirupur or have setup their own sales depots (Apex Cluster Development Services, 2009).
The proximity of these RSIs enables various benefits, such as constant communication on
emerging needs. For example, manufacturers of dyes and chemicals are known to meet often
with firms in the knitwear cluster to grasp emerging needs and to educate garment producers on
new technologies.39 Tirupur’s numerous second-hand and reject goods dealers distribute rejected
export garments to domestic retailers across India. One noteworthy weakness with RSIs is that
knitting equipment manufacturers are not located nearby, since most equipment is imported from
foreign producers.40 That said, the cluster has many strong IFCs. There are 23 Trade & Industry
Associations including flagship IFCs such as TEA, South India Hosiery Manufacturers
Association (SIHMA) and Tirupur Bleachers Association (TBA). IFC initiatives include TEA
spearheading the building of private “industrial parks”, providing world class infrastructure such
as manufacturing, constant power, water, road connectivity, drainage, sewerage, and security.
TEA hosts the “India Knit Fair” to attract worldwide buyers to the cluster, created a joint venture
(JV) with St. John Freight Systems Ltd. to create a distribution center in Europe, and
collaborated with Microsoft to create a local “Intranet” called e-readiness to facilitate
collaboration between SMEs within the cluster (TEA, 2011). 38 The products sold domestically are mostly inner wear and export rejects. The mean value is half that of export products (INR 45). 39 Interview with Mr. S. Sakthivel, Executive Secretary to the President of TEA, March 2011. 40 Interview with Mr. A. Sakthivel, President – The Federation of Indian Exporters Association, March 2011.
24
6.5.4 Moderate Context for Firm Strategy & Rivalry (CFS&R): Tirupur has both positives
and negatives with respect to CFS&R leading to an overall “moderate” assessment. On the
strengths, firstly there appear to be low entry barriers for firms in this cluster. The lack of brand
equity, vertical integration and scale in this cluster facilitates entry for relatively small companies
i.e. 54% of firms are export-oriented micro/small enterprises with less than $2M in turnover.
Secondly, the withdrawal of the Multi-Fiber Agreement in 2005 led to the abolition of quotas,
which limited the amount a developing country could export. As a result, competition has since
increased between Tirupur and other international knitwear clusters. It has also increased price-
based competition within the cluster. In 2009, there were only 20 firms out of the 2,500
manufacturers with a turnover of over $25M; high turnover enables firms to extract economies of
scale to reduce product price (Apex Cluster Development Services, 2009). Since 2005, units
have competed on price to win orders from buyers, which has resulted in the shutdown of over
250 inefficient SMEs.41 Thirdly, IFCs have helped foster rules by playing a quasi-judiciary role
in resolving business/labor disputes; additionally, IFCs are a collective force to lobby with the
government and forcefully represent firm’s interests.
Nevertheless, there are many weaknesses in the cluster’s CFS&R. First, the enforcement
of regulations within the cluster has been weak. For example, firms flouting regulations on the
handling and treatment of wastes from dyeing units have polluted nearby farmlands and the
water table.42 In response, the Madras High Court, in February 2011, ordered the shutdown of all
dyeing units in Tirupur, thereby disrupting operations.43 Secondly, prior attractive incentives to
establish SMEs within the cluster actually disincentivized large-scale production. Lack of land,
41 Interview with Mr. A. Sakthivel, President – The Federation of Indian Exporters Association, March 2011. 42 Vimal Kumar, “Noyyal continues to be polluted,” The Hindu Website, http://www.hindu.com/2011/03/29/stories/2011032962170500.htm, accessed April 2011. 43 The Times of India, “After Tirupur dyeing units, officials to face govt action,” Times of India Online, http://articles.timesofindia.indiatimes.com/2011‐02‐04/chennai/28358640_1_dyeing‐units‐noyyal‐unit‐and‐effluent‐treatment, accessed April 2011.

25
labor or capital incentives for large-scale production within the cluster has put the cluster at a
cost disadvantage relative to competing clusters in China. Thirdly, there is a lack of motivation
to compete on innovation because foreign buyers dictate the technology and because local
demand remains unsophisticated. Finally, the central government’s raw cotton trade policy may
need review. As per the terms of the World Trade Organization (WTO), both cotton exports and
imports in India are under Open General License (OGL). However, the price of raw cotton has
increased from Rs 23,000 per bale in late 2009 to Rs 61,360 per bale in early 2011 – a 166%
increase – because the surge of cotton exports actually reduced the domestic availability of
cotton yarn.44 Any increase in the domestic price of raw cotton/yarn increases cost of knitwear
production in Tirupur. To protect the Tirupur cluster, in April 2010, the government effectively
banned export of raw cotton, cotton waste and carded/combed cotton to control rising prices and
bolster supplies in the domestic market. In May 2010, cotton exports were moved from "free" to
the "restricted" list, permitting shipments only under license.45 In September 2010, the
government announced guidelines, which permitted duty-free cotton exports of up to 5.5M bales
out of the total 32.5M bales produced in 2010.46 A prohibitive duty came into effect when
exporters reached this ceiling. Besides, the government mandated registration of export
contracts via an online system.47 While such government intervention to hand-hold industry has
helped the cluster, putting in place an established WTO compliant mechanism to seamlessly
permit the free exports of cotton when there is surplus domestic production and duty free imports
of cotton when domestic production sharply falls or fails is necessary.
44 The Times of India, “Ban on Cotton Export demanded,” Times of India Online, http://timesofindia.indiatimes.com/city/varanasi/Ban‐on‐cotton‐export‐demanded/articleshow/8040746.cms, accessed April 2011. 45 Sarah, C. Thomasson, “India: A Cotton Giant,” Textile World Asia. http://www.textileworldasia.com/Articles/2010/September/July_August_September_Issue/Country_Profile_India.html, accessed April 2011. 46 Business Standard, “Govt to review cotton export quota on Nov 15,” Business Standard website. http://www.business‐standard.com/india/news/govt‐to‐review‐cotton‐export‐quotanov‐15/407011/, accessed April 2011 47 Ibid.
26
7. Strategic Vision and Recommendations for the Tirupur Cluster
7.1 Cluster analysis has highlighted the need to address fundamental deficiencies to ensure long-
term competitiveness of the cluster. Key pressure points include:
Providing world class infrastructure: Infrastructure constraints/shortages increase transaction
costs due to rent seeking. Infrastructure in power, roads, ports, logistics, and housing for
workers should be upgraded and expanded to match demand increases. Greater enforcement of
regulations among firms is imperative to minimise impact on the environment.
Innovating to produce high-value products using latest technology: It is crucial for cluster
constituents to focus on innovation in fibre-mix, process, and design technology to produce high
value products. This will help position Tirupur as the global epicenter of knitwear production.
Balancing export and domestic revenue channels: The cluster could balance domestic and export
sales to prevent overexposure to competition from other regional clusters selling similar
products. Such a balance will shield against volatility in foreign markets and rupee appreciation.
7.2 Recommendations for firms: Firms could differentiate themselves in the quota free world,
where international buyers have more choices to source knitwear requirements. It is
recommended that firms look beyond competing on cost and instead focus on: (i) high value
product design and development for international brand building, (ii) local branding for better
outreach into domestic markets, (iii) greater customization, (iv) services providing buyers access
to electronically integrated supply chain, and (v) higher product quality. Firms would need to
focus on process innovation to execute these objectives without increasing cost. To achieve
these goals, it is recommended that firms deploy the following four-pronged strategy.
First, manufacturers within Tirupur, along with local IFCs such as NIFT-TEA, should use their
existing links with foreign buyers to collaborate with overseas design schools to acquire skills
27
related to designing fashion and high value products, such as sports-wear and business attire.
Larger firms with access to capital should invest in new product technology to move up the value
chain. Secondly, firms should partner with high-end domestic retail outlets such as Tata
Westend, Birla Nuovo to build a local brand for Tirupur products. Thirdly, firms should link
their supply chains electronically through increased usage of information technology for better
operational efficiency in a subcontracting-driven cluster. Fourthly, to support product quality,
firms should invest in capital equipment to stay competitive and work closely with local training
institutions to reorient their curriculum to provide more practical exposure to process innovation,
product management, and quality control for meeting the expectations of the industry.
While these strategies are by no means exhaustive, they could greatly supplement
existing strengths, such as short lead-time and entrepreneurial talent within firms.
7.3 Recommendations for Central Government and the State Government of Tamil Nadu: It is recommended that the government follow a five-pronged strategy for enhancing the
competitiveness of the Tirupur cluster. First, it is imperative that the central and state
governments help to upgrade power, road and port infrastructures within and around Tirupur. A
dedicated power plant for the Tirupur cluster funded with public and private equity should be
immediately approved and deployed. In accordance with the National Maritime Policy,48 the
three closest ports to Tirupur, which are currently operating at 90% capacity against the optimal
70% level, should be expanded and streamlined with the ICD to shorten customs processing.
Secondly, government should stimulate process and product innovation within the cluster by
providing financial assistance for employee job training and for investments in R&D through the
16 local institutions. Thirdly, as a fly wheel against export demand fluctuations, government
could encourage public procurement of knitwear from the cluster for establishments such as
48 A National Maritime Policy has been planned to lay down the vision & strategy for the sector till 2025.

28
government run schools. Fourthly, government should heed China’s example and encourage
large scale production by providing world-class infrastructure parks with land and capital
assistance to drive economies of scale in production. Finally, despite Tirupur’s electoral
significance, bi-partisan consensus at the highest levels in the state government should seek
stringent enforcement of regulations pertaining to labor and pollution-related violations within
Tirupur. Substantial subsidy for capital investment in modernisation of combined effluent
treatment plants may be provided to motivate firms to address issues relating to effluent control.
A similar low-cost credit facility could be devised to bolster private investment in housing.
7.4 Recommendations for IFCs: While the cluster has numerous, independent and specialised
IFCs, these institutions should aim to increase their impact on the functioning of the cluster.
Flagship IFCs, such as the TEA and SIMHA, should develop a comprehensive long-term cluster
strategy, instead of rolling out initiatives on an ad-hoc and reactive basis. These IFCs must help
to establish a partnership among local colleges/institutions, local firms and foreign design centers
to develop human capital and grow expertise in high-value product design and development.
Existing initiatives, such as the TEA-Portal and Microsoft e-readiness program, should be
expanded to promote a ‘Knowledge Culture’ within the cluster. All IFCs have an important role
to play by partnering with the media to educate firms within the cluster on the importance of
following regulations, best practices and quality standards across the value chain to promote
innovation and reduce transaction costs.

29
References
Ahluwalia, Montek. (1995). “Economic Reforms for the Nineties.” First Raj Krishna Memorial Lecture. Alfaro, L. and Iyer, L. (2009). “Special Economic Zones in India: Public Purpose and Private Property.” Boston: Harvard Business School. Apex Cluster Development Services. (2009). “Diagnostic Study: Tirupur Knitwear and Apparel Cluster.” Report prepared for the Small Industries Development Bank of India (SIDBI). Cawthorne, P. (1995). “Of Networks and Markets: The Rise and Rise of a South Indian Town, the Example of Tirupur’s Cotton Knitwear Industry.” Census of India. (2011). “Provisional Population Totals.” Paper 1., Series 1. Chawla, Prabhu. “The Allied Forces.” India Today., March 2009 edition. Duraiswamy, S and Karthikeyan, G. (2006). “Wage settlement agreement between TEA and representatives of Workers’ Union.” Economic Intelligence Unit (EIU). (2011). “Global Database.” Elsayed, A., Kulich, R., Lake, Lisa and Megahed, Sarah. (2006). “The Chinese Apparel Cluster in Guangdong.” MOC Project Report. Euromonitor International. (2011). “Global Database.” Gulati, Mukesh. (2011). Email interview with Executive Director of the Foundation of MSME Clusters by Trivikram Arun, February 2011. India Economic Survey. (2011). “State of the Economy and Prospects.” Chapter 1. India Brand Equity Foundation (IBEF). (November 2010). “Tamil Nadu Presentation.” IndiaStat. (2011). “Indiastat Database.” Institute of Strategy & Competitiveness (ISC). (2006). "Cluster Mapping Project." Jassin O’Rourke Group. (2008). “Global Apparel Manufacturing Labor Cost Analysis.” Kumar, Anjali., Beck, Thorsten., Campos, Cristine and Chattopadhyah, Soumya. (2005). “Accessing Financial Access in Brazil.” World Bank Working Paper No 50., p.9. Li & Fung. (2006). “Textile and Apparel Clusters in China.” Industrial Cluster Series., pp.5.

30
Ministry of Textiles (MOT). (2010). “2009-2010 Annual Report.” p.46. Ministry of Textiles. (2011) “Knitwear Trade Data.” Porter, M., E. (1998). On Competition. Boston: Harvard Business School Press. Ramaswamy, R and Erkman, S. (2003). “Applied Industrial Ecology - A New Platform for Planning Sustainable Societies.” Chapter 5., Case Study of The Textile Industry In Tirupur. Rangarajan, K. (2005). “Case Study of Tirupur.” presented to UNIDO. Rangarajan., Rajesh. (2010). “Lessons from a model of public participation in environmental enforcement in India.” Centre for Development Finance., pg 5. Reinhart, Carmen and Rogoff, Kenneth. “Why we should expect low growth amid debt.” Financial Times., January 27, 2010. Sakthivel, A. (2011). Interview with the President of The Federation of Indian Exporters Association by Trivikram Arun. March 2011 Sakthivel, S. (2011). Interview with the Executive Secretary of the Tirupur Exporters Association (TEA) by Trivikram Arun and Sumeet Bhalla. March 2011. Sekhar, Susanta. (2011). Email interview with a Director from the Ministry of Textiles, Government of India by Trivikram Arun, March 2011. Singh, Manmohan. “PM's reply to the debate on the Motion of Confidence in the Lok Sabha.” July 22, 2008. Singh, Manmohan. “PM's reply to the debate on the Motion of Confidence in the Lok Sabha.” July 22, 2008. Tirupur Exporters Association (TEA). (2011). “Tirupur Cluster – A Success Story.” UNCTAD. (2011). “Global Statistics.” UNIDO. (1997). “Diagnostic Study – The Cotton Knitwear Cluster, Tirupur.” UNIDO cluster development program, New Delhi. Vietor, K., and Forrest, N. (2009). “India: Democracy and Development.” Boston: Harvard Business School Press. World Bank. (2011). “World Data Bank.” World Bank. (2011). “Doing Business Rankings.”