Till van Treeck The Corporate Sector and the Current Account
48
uni-due.de/soziooekonomie/wp ifso working paper Jan Behringer Till van Treeck 2019 no.1 The Corporate Sector and the Current Account
Transcript of Till van Treeck The Corporate Sector and the Current Account
uni-due.de/soziooekonomie/wp
ifso working paper
Jan BehringerTill van Treeck
2019 no.5
The Corporate Sector and the Current Account
uni-due.de/soziooekonomie/wp
ifso working paper
Jan BehringerTill van Treeck
2019 no.1
The Corporate Sector and the Current Account

The corporate sector and the current account∗
Jan Behringer
Macroeconomic Policy Institute (IMK)
University of Würzburg
Till van Treeck
University of Duisburg-Essen
Macroeconomic Policy Institute (IMK)
February 28, 2019
Abstract
In this paper, we analyze how corporate sector behavior has affected national current account
balances in a sample of 25 countries for the period 1980-2015. A consistent finding is that
an increase (decrease) in corporate net lending leads to an increase (decrease) in the current
account, controlling for standard current account determinants. We disentangle the current
account effects of corporate saving and investment and we explore a number of alternative ex-
planations of our results, including incomplete piercing of the “corporate veil” by households,
foreign direct investment activities, a temporary crisis phenomenon, and changes in income
inequality. We conclude that corporate sector saving is an important driver of macroeconomic
trends and that the rise of corporate net lending especially in a number of current account
surplus countries has contributed considerably to global current account imbalances.
Keywords: Corporate sector, sectoral financial balances, current account determinants
JEL Classifications: D15, E21, F41, G35
∗Jan Behringer, Macroeconomic Policy Institute (IMK), Hans-Böckler-Straße 39, 40476 Düsseldorf, Germany,Email: [email protected]. Till van Treeck, Institute for Socio-Economics, University of Duisburg-Essen,Lotharstraße 65, 47057 Duisburg, Germany, Email: [email protected]. Financial support of the Institute forNew Economic Thinking is gratefully acknowledged. We would like to thank Thomas Ferguson, Steven Fazzari, Eck-hard Hein, Michael Kumhof, Alan Taylor, Thomas Theobald and seminar participants at the DIW Berlin Seminar onMacroeconomics and Econometrics, the INET annual conference in Paris, the OeNB conference in Vienna, the MaxPlanck Institute for the Study of Societies research conference in Cologne, and the Deutsche Bundesbank/IMK work-shop in Düsseldorf for helpful comments and advice. Of course, all errors are ours.
1
1 Introduction
In this paper, we analyze how changes in corporate sector behavior affect national current account
balances. While the global rise of corporate saving recently has received growing attention (Chen
et al., 2017), it also has been noted that a number of countries with persistent current account
surpluses, such as Germany, Japan, the Netherlands, or South Korea, are characterized by high
and rising corporate financial surpluses. By contrast, major current account deficit countries, such
as the United States or the United Kingdom, feature no, or less pronounced, secular upward trends
in corporate net lending (IMF, 2017).
At the theoretical level, the standard model of intertemporally optimizing households with
rational expectations predicts that the saving behavior of the non-household sectors, i.e., the gov-
ernment and the private corporate sector, has no influece on total saving and on the current account
(Obstfeld and Rogoff, 1995). In particular, to the extent that households own domestic corpora-
tions, household saving behavior should offset differences in corporate saving. However, a rise
(fall) in corporate saving leads to a higher (lower) current account if private households fail to see
through the “corporate veil”, i.e., if higher (lower) corporate saving is not fully offset by lower
(higher) household saving. This mechanism is conceptually similar to non-Ricardian saving be-
havior by households, which implies that a rise (fall) in government saving leads to a rise (fall)
in aggregate saving, and hence the current account, because households fail to adjust personal
savings downwards (upwards).
In standard panel estimations of current account determinants, based on the intertemporal
maximization problem of the representative households in the tradition of Obstfeld and Rogoff
(1995), the issue of non-household sector saving is dealt with in an asymmetric fashion. On the
one hand, most current account estimations routinely test for non-Ricardian effects by introducing
the fiscal balance as an explanatory variable. A robust finding is that the fiscal balance is positively
linked with the current account, which is interpreted as evidence that households do not fully offset
changes in government saving (e.g. Ali Abbas et al., 2011; Bluedorn and Leigh, 2011; Kumhof
and Laxton, 2013; Phillips et al., 2013). By contrast, the potential current account effects linked
to incomplete piercing of the corporate veil have not been systematically addressed in the existing
literature. This is all the more surprising since, in an accounting sense, the main difference between
current account surplus and current account deficits countries in the recent past has been that the
corporate financial balance has displayed a rising trend in the surplus countries but not in the deficit
countries (reflecting primarily differences in corporate saving). By contrast, household financial
balances (and household saving) differ less between surplus and deficit countries (see IMF, 2017).
The contribution of the present article is to analyze the current account effects of corporate
2
sector behavior for a sample of 25, mainly industrialized, countries for the period 1980-2015. One
important challenge is to disentangle the channels through which the corporate sector financial
balance may affect the current account balance. At an accounting level, cross-country differences
in corporate saving play a larger and more persistent role for current account balances than invest-
ment differentials. Including corporate sector saving in current account estimations also provides
the most direct test of the corporate veil. However, we also assess the rationale for including cor-
porate investment in addition to the standard control variables in our current account estimations,
as discussed by Ca’Zorzi et al. (2012). Moreover, we consider the possibility that the current ac-
count effects of the corporate financial balance are due to international investment positions linked
to foreign direct investment (FDI) activities, as suggested by Avdjiev et al. (2018). On the one
hand, FDI flows may account for deviations of domestic business investment from its desired level
for given values of the fundamental variables included in the current account estimation. On the
other hand, differences in the accounting treatment of income derived from cross-border direct
investment and portfolio investment activities may distort measures of national income, saving,
and the current account. Another question that we address is to what extent the contribution of
corporate net lending to current account imbalances is a temporary phenomenon that is related to
the global financial crisis starting in 2007, which may have affected corporations’ and households’
precautionary savings motives. IMF (2017) tentatively suggests that the corporate veil thickened
as a result of the crisis, noting that the time-series and cross-country correlation between corpo-
rate and household saving turned positive for the period 2009-2015. Similarly, Gruber and Kamin
(2016) discuss the possibility of a structural break in corporate saving behavior caused by the
global financial crisis. Finally, we ask whether the current account effects of corporate saving may
be associated with changes in income inequality, a possibility discussed by Kumhof et al. (2012)
and Dao and Maggi (2018). Rather than reflecting incomplete piercing of the corporate veil, a
positive correlation between corporate saving and national saving may actually be due to differ-
ential saving propensities of higher-income and lower-income households. Since the former own
a disproportionate share of corporate wealth, higher corporate saving may be explained through
a (financial) wealth term in shareholders’ utility function. In other words, shareholders may have
decided, against the backdrop of higher income inequality, to keep a higher share of their rising
incomes as savings within firms. Consistent with this explanation, Dao and Maggi (2018) and IMF
(2018) hypothesize that higher corporate saving may reinforce the aggregate demand and current
account effects stemming from rising personal income and wealth inequality.
Our main findings are as follows. Firstly, we find significant effects of changes in the corporate
sector variables (the corporate financial balance or corporate saving and investment separately) on
the current account balance, which are of the same order of magnitude as the effect of a change
3
in the government financial balance, controlling for other determinants of the current account.
The current account effects of corporate saving are robust throughout our various specifications,
whereas the effects of corporate investment are sensitive to the inclusion of high-investment Asian
countries. Accounting for cross-country and time-series variations in corporate sector balances
contributes sizably to understanding national current account balances. Secondly, the effects of
corporate saving and investment persist when FDI activities are controlled for. Thirdly, we do not
find evidence that the corporate veil thickened as a result of the global financial crisis starting in
2007. Since the wake of the crisis, the cross-country pattern of corporate net lending has changed
somewhat, but it continues to affect national current account balances. Finally, the effects of
corporate saving on the current account are unlikely to be merely the reflection of demand effects
arising from changes in personal income inequality, since the effect of a rise in top household
income shares on the current account balance points in the opposite direction of a rise in corporate
saving.
The remainder of this paper is structured as follows. In Section 2, we review the theoretical
and empirical literature relating to the macroeconomic effects of corporate sector behavior and its
implications for the current account. Section 3 discusses important stylized facts about sectoral
financial balances and the current account in some selected large economies with a focus on trends
in corporate saving and investment. Section 4 presents the empirical analysis. Section 5 concludes.
2 Literature review
The contribution of our paper is to analyze the macroeconomic implications of corporate sector
behavior within a panel estimation analysis of current account positions. It builds on three strands
in the literature. Firstly, our work is related to a large body of studies that analyze current account
determinants but so far has not addressed the role of the corporate sector in a rigorous fashion.
Secondly, there is an emerging literature, based on sector-level and firm-level data, documenting
the trend towards rising corporate net lending positions across countries in recent decades. A third
strand in the literature has developed formal tests of the corporate veil, albeit not in relation to
current account balances.
2.1 Current account determinants
In face of the widening of current account imbalances especially since the 1980s and prior to the
global financial crisis starting in 2007, a number of competing hypotheses have been put forward.
These include the twin deficit hypothesis that current accounts are driven by government deficits
(Ali Abbas et al., 2011; Bluedorn and Leigh, 2011; Kumhof and Laxton, 2013); the savings-glut
4
hypothesis that high savings in emerging markets are responsible for their current account sur-
pluses (Chinn and Ito, 2007); the demographic hypothesis that population structure and life-cycle
savings dynamics have contributed to current account imbalances (Cooper, 2008; Dao and Jones,
2018); the asset bubble explanation that wealth effects are the main force behind saving-investment
imbalances (Fratzscher and Straub, 2009); the financial-development argument that countries with
deeper financial markets attract foreign saving flows resulting in current account deficits (Gruber
and Kamin, 2007; Caballero et al., 2008); the structural policy hypothesis that product and labor
market regulations are important drivers of current accounts (Kerdrain et al., 2010); and the in-
come distribution hypothesis that the relative stagnation of middle class incomes has contributed
to either aggregate demand deficiency and current account surpluses or debt-financed consump-
tion and current account deficits in different countries (Kumhof et al., 2012 and Behringer and van
Treeck, 2018). However, there is as of yet no consensus as to the relative importance of various
factors in explaining the emergence and evolution of global imbalances. Chinn et al. (2011, p. 18)
suggest the possibility of missing variables in existing estimation models.
The aforementioned hypotheses essentially focus on the household sector as the driving force
behind national current account balances, in line with the underlying theoretical framework pro-
posed by Obstfeld and Rogoff (1995). The role of the corporate sector has not been systematically
addressed in the literature. Our analysis of the current account effects of corporate sector saving
and investment is, however, conceptually related to two of the aforementioned hypotheses, namely,
the twin deficit hypothesis and the income distribution hypothesis. In the existing literature the
government financial balance is routinely included in current account panel regression analyses
and it is systematically found to be quantitatively important. According to existing estimates, a
1 percentage point increase (decrease) in the fiscal balance leads to an increase (decrease) in the
current account of between 0.2 and 0.5 percentage points (Lee et al., 2008; Phillips et al., 2013).
The standard explanation of this finding refers to non-Ricardian behavior by households, i.e.,
households do not fully incorporate government saving into personal saving decisions. Although
corporate saving (corporate net lending) together with government saving (the fiscal balance) con-
stitute the non-household part of domestic saving (the current account balance), corporate saving
or the corporate financial balance have not been among the standard explanatory variables in the
existing literature on the determinants of current account balances. Moreover, a number of recent
works have pointed at a negative link between (top-end) income inequality and national current
account balances (Kumhof et al., 2012; Behringer and van Treeck, 2018). To the extent that a rise
in corporate saving as a percent of GDP implies a more unequal income distribution (e.g. when
it is assumed that corporate retained earnings accrue proportionally to equity wealth, as suggested
by Piketty et al., 2017), one may ask whether changes in corporate saving and personal income
5
inequality have similar macroeconomic effects in terms of current account balances (see also Dao
and Maggi, 2018).
2.2 Recent changes in corporate behavior
Although the trend towards higher corporate net lending in some countries has been discussed in
policy circles for some while (e.g. IMF, 2006; André et al., 2007), the academic literature has been
relatively silent on the macroeconomic implications of corporate sector saving and investment.
The lack of attention to corporate net lending as a potential driver of macroeconomic trends has
been noted in recent literature (Gruber and Kamin, 2016; IMF, 2017; Dao and Maggi, 2018).
Chen et al. (2017) document the global rise in corporate saving using both national accounts
and firm-level data. They show that, while the sectoral composition of global investment has
remained largely stable over time, the sectoral composition of global saving has undergone sub-
stantial changes since 1980. In particular, saving by corporations has increased by nearly 5 per-
centage points relative to GDP whereas saving by household has decreased by nearly 6 percentage
points (whereas government saving has not exhibited secular trends relative to GDP). While Chen
et al. (2017) show, based on a general equilibrium model, that changes including declines in the
real interest rate, the price of investment, corporate income taxes and increases in markups may
explain the global rise in corporate saving, their descriptive analysis of national accounts data re-
veals sizable cross-country differences in the trends of corporate saving over time. Although Chen
et al. (2017) emphasize the fact that corporate saving has increased in all ten of the world’s largest
economies, the rise in the corporate saving rate (corporate saving as a percentage of corporate
value added) has been more than four times larger in such countries as China, Japan, and South
Korea than in the United Kingdom and the United States. It has also been considerably larger in
France and Germany than in the United Kingdom and the United States. However, Chen et al.
(2017) do not inquire into the implications of such cross-country differences in corporate saving
for current account developments.
A detailed descriptive analysis of trends in corporate sector behavior with a view to connecting
with the macro literature is provided by Dao and Maggi (2018), who employ both cross-country
national accounts and firm-level data. While confirming the finding by Chen et al. (2017) that the
increase in corporate excess saving is a robust feature across major economies, Dao and Maggi
(2018) note that the rise in corporate saving and net lending clearly has been most pronounced
in countries with persistent current account surpluses. They find that the trend towards higher
corporate saving is driven by rising profitability, lower financing costs, and reduced tax rates and
they analyze the motives for corporations’ increased cash holding at the expense of other uses of
corporate saving including fixed capital investment. Although Dao and Maggi (2018) emphasize
6
the potentially sizable implications for current accounts across countries, they do not formally test
for such effects.
Gruber and Kamin (2016) focus on corporate behavior in the aftermath of the global financial
crisis that started in 2007. They demonstrate that levels of corporate net lending rose significantly
in most OECD economies after the crisis and ask whether this recent upward trend constitutes a
break with the past in corporate behavior. However, they conclude from their empirical analysis
that the sharp declines in corporate investment after the crisis were generally consistent with past
responses of investment to movements in fundamentals. In particular, they find little evidence that
firms were reducing investment to strengthen their balance sheets, as payments to shareholders
remained strong and were uncorrelated with investment. They conclude, therefore, that the in-
crease in corporate net lending since the crisis must either be due to a crisis-induced structural
break in corporate saving behavior, as corporate investment behaved largely as might be expected
given the persistent weakness in growth, or due to endogenous responses of both investment and
saving behavior to the global financial crisis. The analysis by Gruber and Kamin (2016) only
superficially touches upon the question of whether cross-country differences in corporate saving
and investment may contribute to current account (im)balances. In their descriptive analysis, they
show that countries where corporate net lending increased relatively strongly between 2002-2008
and 2009-2015 experienced a relatively larger increase in the current account balance. However,
Gruber and Kamin (2016) do not systematically examine cross-country differences in corporate
saving and investment and their implications for current account balances either before or after the
global financial crisis.
2.3 The corporate veil
Even although the potential importance of the corporate veil is generally recognized at the concep-
tual level (Atkinson, 2009), there are surprisingly few empirical analyses of the macroeconomic
effects of corporate saving behavior.
It may be useful to begin the following discussion with a definition of the corporate veil. A
corporate veil would exist if a shift in the distribution of an individual’s wealth among corporate
and non-corporate forms, holding her overall wealth constant, affected that individual’s consump-
tion (Auerbach and Hassett, 1991). In line with this definition, the following general consumption
function can be used to design a formal test of the corporate veil (see Poterba, 1991):
C = α0 + α1HW + α2NHW + α3DIV + ε (1)
7
where household consumption, C, is a function of human wealth, HW, non-human wealth, NHW,
and dividends, DIV . If households pierce the corporate veil and dividends convey no information
about future corporate profits that is not also reflected in share values, then α3 should be zero. Sup-
pose a corporation decides to increase its saving, that is, to retain earnings rather than distribute
them as dividends. Any sophisticated shareholder should understand that their net worth has in-
creased and reduce their savings correspondingly in order to re-establish their optimal life-cycle
consumption. By contrast, if households fail to fully see through the corporate veil, total national
saving is affected by corporate profit retention policies because α3 > 0. In theory, α3 > 0 could
also be due to liquidity constraints, but in practice such liquidity constraints are a lot less likely
to apply to consumption supported by corporate wealth, compared with other forms of wealth,
because shareholders typically are wealthier and more creditworthy than the average individual.
An alternative way in which a rise in corporate saving might influence total saving even in the
absence of a “thick” corporate veil is through the distribution of income. If an increase in corporate
saving as a percentage of GDP is the reflection of a higher profit share of GDP (as seems to be
the case empirically, see Karabarbounis and Neiman, 2014; Chen et al., 2017; Behringer and
van Treeck, 2018), then it may be associated with a change in the economy-wide saving rate if
wealthier households benefit disproportionally from the rise in the profit share and have a lower
marginal propensity to consume (α2 < α1 in Equation 1). In the empirical analysis to be presented
in Section 4, we will thus control for income distribution when testing for the existence of a
corporate veil in our current account estimations.
There is some formal evidence for the corporate veil in different strands of the literature that
developed independently of the literature on current account determinants, but the results from
previous studies are mixed. Feldstein and Fane (1973) and Feldstein (1973) found a positive
marginal propensity to consume from corporate retained earnings which was, however, lower
than the marginal propensity to consume from income. Similar results were found by Sumner
(2004), based on estimations of the aggregate consumption function for the U.K. Poterba (1991)
and Monogios and Pitelis (2004) and Baker et al. (2007) report evidence of a significant corporate
veil for different Anglo Saxon countries. Grigoli et al. (2018) in a panel estimation analysis for a
sample of 165 countries for the period 1981-2012 find that a rise in the corporate saving-to-gross
domestic income ratio by one percentage points leads to a decrease in the household saving-to-
gross domestic income ratio by 0.58 percentage points, i.e., households do not fully offset the rise
in corporate saving. According to the results by Bebczuk and Cavallo (2016), for a sample of 47
countries over 1995-2013, a $1 increase in business saving raises private saving by $0.6.
8
3 The data
This section documents a number of stylized facts of corporate sector and current account bal-
ances. We focus primarily on the G7 economies and China. These eight countries accounted for
more than 60% of global GDP during the last decade. Figure 1 shows the evolution of GDP-
weighted averages of corporate saving, investment and net lending for the G7 countries over the
period 1980-2015.1 It shows that corporate net lending was negative throughout the 1980s and
1990s, turned positive at the beginning of the 2000s and has remained in positive territory since
then. Moreover, it is obvious from Figure 1 that the rise in corporate net lending has been driven
primarily by the rise in corporate saving. Corporate investment shows cyclical fluctuations around
a largely constant trend, even though the sharp decline of corporate investment during the global
financial crisis after 2007 may constitute a break with the past in corporate behavior.
Figure 2 contains the same information as Figure 1, but now separately for each of the G7
countries and China. We can observe a pronounced secular upward trend in the corporate financial
balance driven by a rise in corporate saving especially in Germany, Italy and Japan. By compar-
ison, in Canada, France and the United Kingdom, variations in corporate net lending are more of
a cyclical nature, and they are less clearly driven by corporate saving. In the United States, there
is no clear trend over time in either corporate saving or corporate investment prior to the outbreak
of the financial crisis, which triggered both a rise in corporate saving and a fall in corporate in-
vestment. In China, we observe pronounced and long-lasting swings in both corporate saving and
corporate investment since 1990.
Figure 3 shows the development of current account balances and sectoral financial balances
for the G7 countries and China for the period 1980-2015. China, Germany, Japan, the United
Kingdom, and the United States were those countries with the largest current account balances
worldwide just before the Great Recession. In Germany and Japan, in particular, the corporate
sector turned from a pronounced net borrowing position in the 1980s and 1990s to a large and
persistent net lending position since the late 1990s/early 2000s. The corporate sector thus accounts
for a large part of the build-up of current account surpluses in these countries prior to the Great
Recession. In recent years, both China and Japan have significantly reduced their current account
surpluses, whereas Germany has maintained a large current account surplus of about 7 percent of
GDP, which corresponds roughly to its pre-crisis level. In the case of Japan, the re-balancing of
the current account in the wake of the financial crisis was due primarily to the decrease of the fiscal
balance, while corporate net lending fluctuated around its pre-crisis level of 8 percent of GDP. In
1We do not include China here because it is a clear outlier in terms of both the corporate saving-to-GDP ratio andthe corporate investment-to-GDP ratio; see Figure 2.
9
China, much of the pre-crisis increase of the current account balance since the 1980s, as well as
the subsequent re-balancing, were driven primarily by movements in corporate net lending. The
United Kingdom and the United States, the two main current account deficit countries prior to the
global financial crisis, experienced large decreases in the household financial balance during the
last two decades before the crisis, but no clear trend in the corporate financial balance. Overall,
there is little immediate evidence of an offsetting relationship between corporate and household
net lending across the G7 countries and China.
In Figure 4, we plot changes in the corporate financial balance (upper panel) against changes
in the current account balance (left panel) and against changes in the household financial balance
(right panel) for a sample of 25 countries (multi-year averages 1980/83 versus 2012/15). There
is a clear positive relationship between changes in the corporate financial balance and the current
account balance, despite a negative correlation of changes in the corporate and the household
financial balance. This pattern is prima facie consistent with the existence of a corporate veil.
Changes in corporate net lending feed through to the current account, even although they are
offset in part by opposite changes in household net lending. Note that plotting changes in the
government financial balance against changes in the current account and the household financial
balance (lower panel of Figure 4) yields a very similar picture.
In Figure 5, we plot changes in the corporate financial balance against changes in the current
account balance and the household financial balance for two sub-periods: prior to the global fi-
nancial crisis (upper panel, 1980/83 versus 2004/07), and since the outbreak of the crisis (lower
panel, 2004/07 versus 2012/15). Figure 5 reveals an even stronger correlation between changes in
corporate net lending and the current account for both sub-periods, compared to the full sample
period (see Figure 4). As can be seen in the upper panel of Figure 5, the pre-crisis emergence
of current account imbalances were largely driven by differences in corporate net lending, with
large increases in such large surplus countries as China, Japan, South Korea, the Netherlands and
Germany, and no or smaller increases in such large deficit countries as Spain, the United Kingdom
and the United States. By contrast, there was no clear relationship between changes in corporate
net lending and household net lending. For example, Japan, Spain and the United States all dis-
played similar decreases in the household financial balance despite very different current account
developments. For the post-crisis period, changes in the corporate financial balance and changes
in the household financial balance are uncorrelated, an observation that IMF (2017) interprets as
indicative of a thickening of a corporate veil. Corporate net lending played a considerable role for
current account rebalancing, e.g., in China, Japan, or Spain.
Figure 6 shows that the correlation with the current account balance is stronger for changes in
corporate saving than for changes in corporate investment. This observation suggests that move-
10
ments in corporate saving in particular feed through to the national saving-investment balance, in
line with the corporate veil argument.
In the next section, we test the corporate veil hypothesis more formally in a multivariate panel
estimation framework.
4 Empirical analysis
4.1 Analytical framework
The current account balance is defined as the difference between domestic saving and domestic
investment or equivalently as the sum of the financial balances (income minus expenditure, or
saving minus investment) of the private household, the corporate and the government sectors:
S − I = CA (2)
S HH + S CORP + S GOV − IHH − ICORP − IGOV = CA (3)
FBHH + FBCORP + FBGOV = CA (4)
where CA is the current account balance and S , I and FB denote, respectively, saving, invest-
ment and the financial balance of the household sector, HH, the corporate sector, CORP and the
government sector, GOV .
While Equation 2 provides the basis for estimating current account determinants in the state-
of-the art literature, the sectoral accounting perspective inherent in Equations 3 and 4 usually is not
made explicit in the literature. For example, the External Balance Assessment (EBA) methodology
developed by the IMF uses a refined version of Equation 2 as a starting point for the estimation
of current account equations. Combining this with a balance-of-payment constraint, a solvency
constraint and a multilateral constraint2, yields the following reduced form equation for the current
account balance (see Phillips et al., 2013):
CA = f (XI , XS , XCA, XCF ,Z,Zwo,∆R) (5)
2The multilateral constraint implies that each country’s variable should be measured relative to a GDP-weightedworld average of the same variable.
11
Equation 5 states that the current account is determined by the domestic output gap, Z, and the
world output gap, Zwo, changes in foreign exchange reserves ∆R, and a host of saving/consumption
shifters, XS , investment shifters, XI , export/import shifters, XCA, and capital account shifters, XCF .
Saving/consumption shifters include such variables as income per capita, demographics, expected
income (shifts in permanent income), social insurance, the budget balance, financial policies, the
institutional environment, and net exports of exhaustible resources. Investment shifters include
income per capita, expected income/output, governance, financial policies. Export/import shifters
include the world commodity price-based terms of trade. Capital account shifters include indica-
tors of global risk aversion, the “exorbitant privilege” that comes with reserve currency status, and
capital controls.
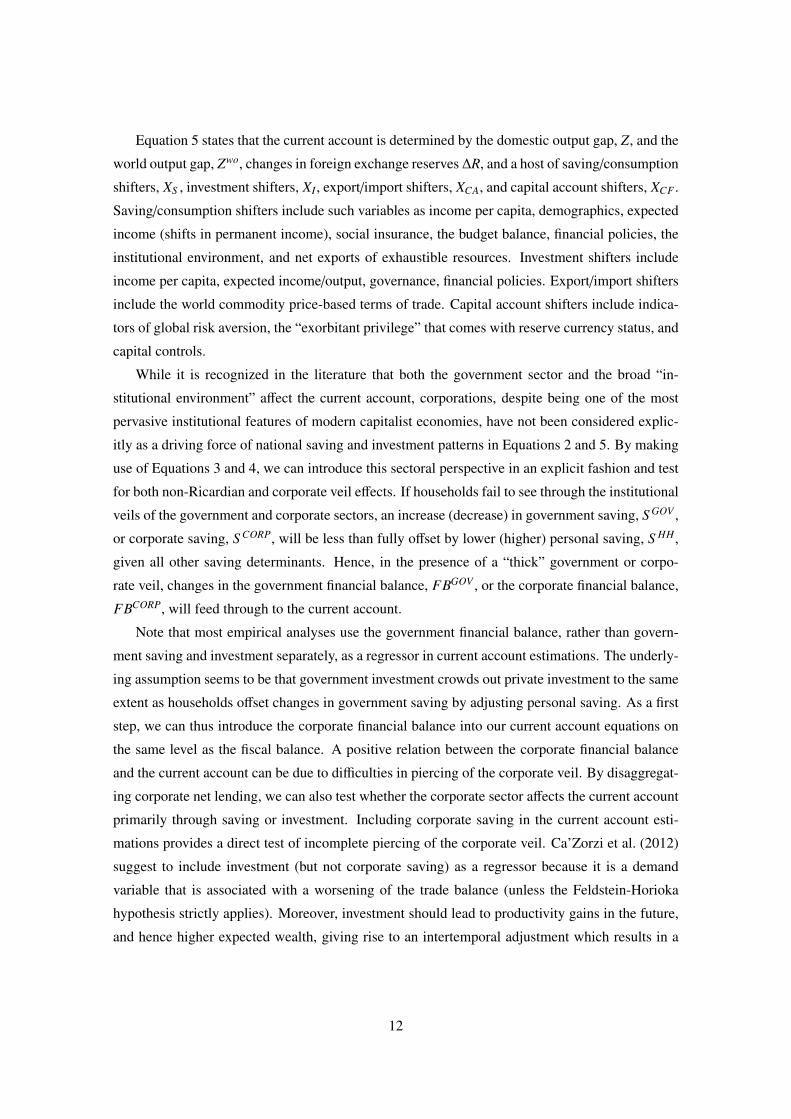
While it is recognized in the literature that both the government sector and the broad “in-
stitutional environment” affect the current account, corporations, despite being one of the most
pervasive institutional features of modern capitalist economies, have not been considered explic-
itly as a driving force of national saving and investment patterns in Equations 2 and 5. By making
use of Equations 3 and 4, we can introduce this sectoral perspective in an explicit fashion and test
for both non-Ricardian and corporate veil effects. If households fail to see through the institutional
veils of the government and corporate sectors, an increase (decrease) in government saving, S GOV ,
or corporate saving, S CORP, will be less than fully offset by lower (higher) personal saving, S HH ,
given all other saving determinants. Hence, in the presence of a “thick” government or corpo-
rate veil, changes in the government financial balance, FBGOV , or the corporate financial balance,
FBCORP, will feed through to the current account.
Note that most empirical analyses use the government financial balance, rather than govern-
ment saving and investment separately, as a regressor in current account estimations. The underly-
ing assumption seems to be that government investment crowds out private investment to the same
extent as households offset changes in government saving by adjusting personal saving. As a first
step, we can thus introduce the corporate financial balance into our current account equations on
the same level as the fiscal balance. A positive relation between the corporate financial balance
and the current account can be due to difficulties in piercing of the corporate veil. By disaggregat-
ing corporate net lending, we can also test whether the corporate sector affects the current account
primarily through saving or investment. Including corporate saving in the current account esti-
mations provides a direct test of incomplete piercing of the corporate veil. Ca’Zorzi et al. (2012)
suggest to include investment (but not corporate saving) as a regressor because it is a demand
variable that is associated with a worsening of the trade balance (unless the Feldstein-Horioka
hypothesis strictly applies). Moreover, investment should lead to productivity gains in the future,
and hence higher expected wealth, giving rise to an intertemporal adjustment which results in a
12
current account deficit (see Glick and Rogoff, 1995; Ca’Zorzi et al., 2012). A further rationale for
including corporate investment in the current account estimation (either indirectly as a component
of the corporate financial balance, or directly as a separate regressor) is that previous studies have
found that most variables commonly used in current account estimations appear to mainly operate
through the saving channel (Phillips et al., 2013).
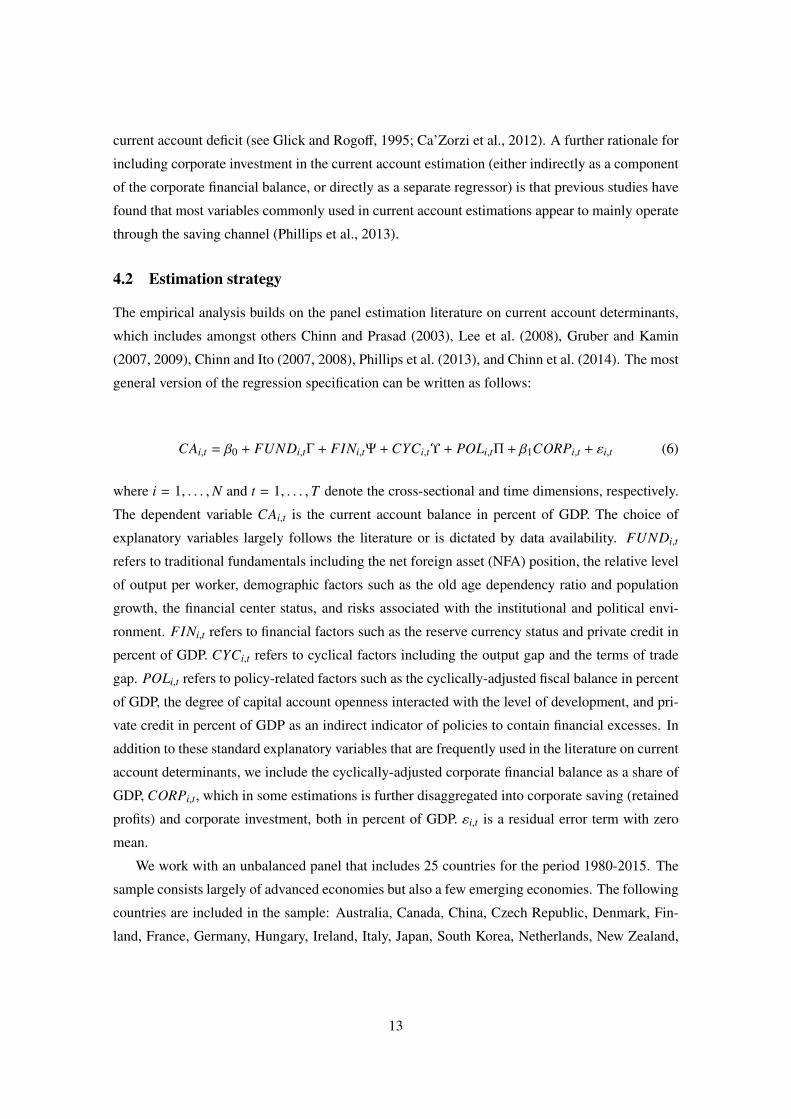
4.2 Estimation strategy
The empirical analysis builds on the panel estimation literature on current account determinants,
which includes amongst others Chinn and Prasad (2003), Lee et al. (2008), Gruber and Kamin
(2007, 2009), Chinn and Ito (2007, 2008), Phillips et al. (2013), and Chinn et al. (2014). The most
general version of the regression specification can be written as follows:
CAi,t = β0 + FUNDi,tΓ + FINi,tΨ + CYCi,tΥ + POLi,tΠ + β1CORPi,t + εi,t (6)
where i = 1, . . . ,N and t = 1, . . . ,T denote the cross-sectional and time dimensions, respectively.
The dependent variable CAi,t is the current account balance in percent of GDP. The choice of
explanatory variables largely follows the literature or is dictated by data availability. FUNDi,t
refers to traditional fundamentals including the net foreign asset (NFA) position, the relative level
of output per worker, demographic factors such as the old age dependency ratio and population
growth, the financial center status, and risks associated with the institutional and political envi-
ronment. FINi,t refers to financial factors such as the reserve currency status and private credit in
percent of GDP. CYCi,t refers to cyclical factors including the output gap and the terms of trade
gap. POLi,t refers to policy-related factors such as the cyclically-adjusted fiscal balance in percent
of GDP, the degree of capital account openness interacted with the level of development, and pri-
vate credit in percent of GDP as an indirect indicator of policies to contain financial excesses. In
addition to these standard explanatory variables that are frequently used in the literature on current
account determinants, we include the cyclically-adjusted corporate financial balance as a share of
GDP, CORPi,t, which in some estimations is further disaggregated into corporate saving (retained
profits) and corporate investment, both in percent of GDP. εi,t is a residual error term with zero
mean.
We work with an unbalanced panel that includes 25 countries for the period 1980-2015. The
sample consists largely of advanced economies but also a few emerging economies. The following
countries are included in the sample: Australia, Canada, China, Czech Republic, Denmark, Fin-
land, France, Germany, Hungary, Ireland, Italy, Japan, South Korea, Netherlands, New Zealand,
13
Norway, Poland, Portugal, Slovenia, South Africa, Spain, Sweden, Switzerland, United Kingdom,
and the United States. Variable definitions and data sources are provided in Appendix A.1.
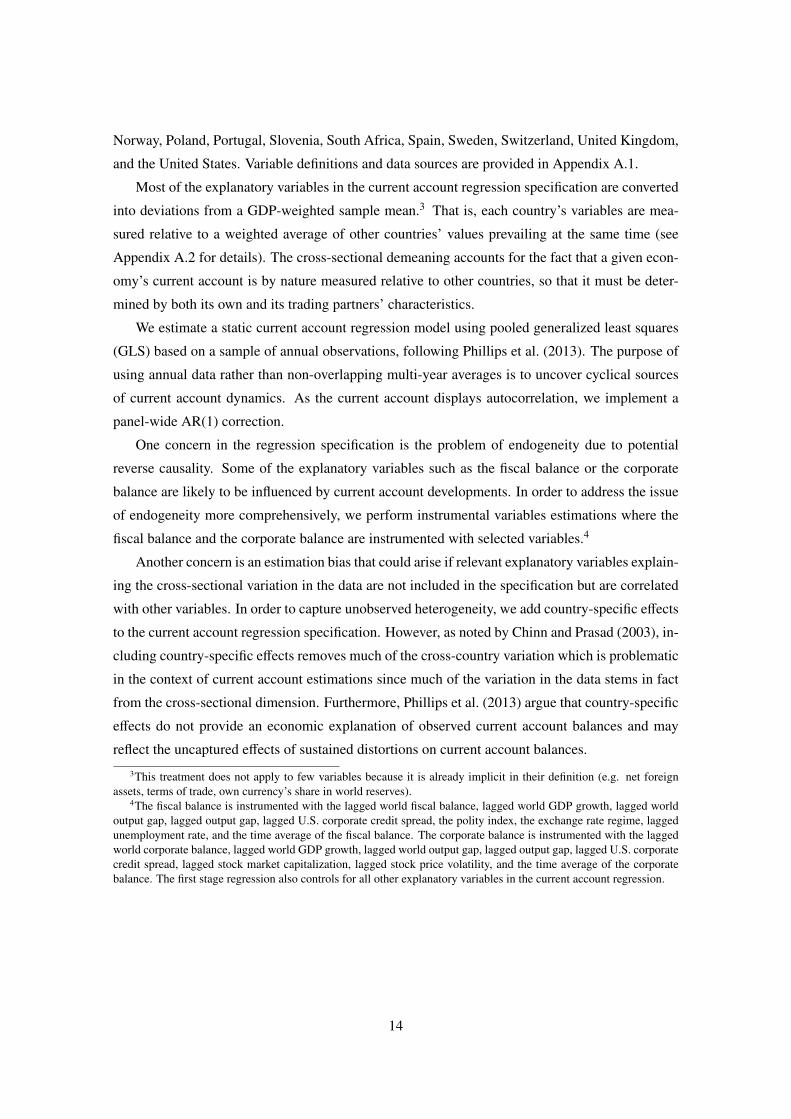
Most of the explanatory variables in the current account regression specification are converted
into deviations from a GDP-weighted sample mean.3 That is, each country’s variables are mea-
sured relative to a weighted average of other countries’ values prevailing at the same time (see
Appendix A.2 for details). The cross-sectional demeaning accounts for the fact that a given econ-
omy’s current account is by nature measured relative to other countries, so that it must be deter-
mined by both its own and its trading partners’ characteristics.
We estimate a static current account regression model using pooled generalized least squares
(GLS) based on a sample of annual observations, following Phillips et al. (2013). The purpose of
using annual data rather than non-overlapping multi-year averages is to uncover cyclical sources
of current account dynamics. As the current account displays autocorrelation, we implement a
panel-wide AR(1) correction.
One concern in the regression specification is the problem of endogeneity due to potential
reverse causality. Some of the explanatory variables such as the fiscal balance or the corporate
balance are likely to be influenced by current account developments. In order to address the issue
of endogeneity more comprehensively, we perform instrumental variables estimations where the
fiscal balance and the corporate balance are instrumented with selected variables.4
Another concern is an estimation bias that could arise if relevant explanatory variables explain-
ing the cross-sectional variation in the data are not included in the specification but are correlated
with other variables. In order to capture unobserved heterogeneity, we add country-specific effects
to the current account regression specification. However, as noted by Chinn and Prasad (2003), in-
cluding country-specific effects removes much of the cross-country variation which is problematic
in the context of current account estimations since much of the variation in the data stems in fact
from the cross-sectional dimension. Furthermore, Phillips et al. (2013) argue that country-specific
effects do not provide an economic explanation of observed current account balances and may
reflect the uncaptured effects of sustained distortions on current account balances.
3This treatment does not apply to few variables because it is already implicit in their definition (e.g. net foreignassets, terms of trade, own currency’s share in world reserves).
4The fiscal balance is instrumented with the lagged world fiscal balance, lagged world GDP growth, lagged worldoutput gap, lagged output gap, lagged U.S. corporate credit spread, the polity index, the exchange rate regime, laggedunemployment rate, and the time average of the fiscal balance. The corporate balance is instrumented with the laggedworld corporate balance, lagged world GDP growth, lagged world output gap, lagged output gap, lagged U.S. corporatecredit spread, lagged stock market capitalization, lagged stock price volatility, and the time average of the corporatebalance. The first stage regression also controls for all other explanatory variables in the current account regression.
14
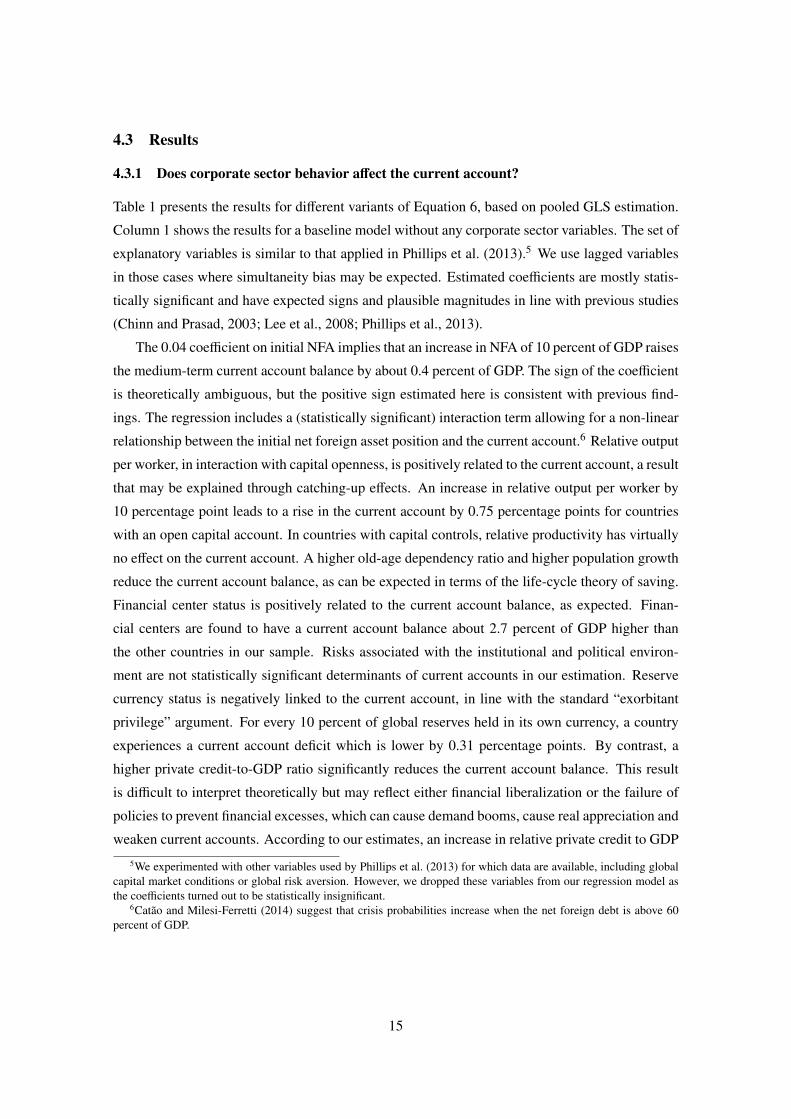
4.3 Results
4.3.1 Does corporate sector behavior affect the current account?
Table 1 presents the results for different variants of Equation 6, based on pooled GLS estimation.
Column 1 shows the results for a baseline model without any corporate sector variables. The set of
explanatory variables is similar to that applied in Phillips et al. (2013).5 We use lagged variables
in those cases where simultaneity bias may be expected. Estimated coefficients are mostly statis-
tically significant and have expected signs and plausible magnitudes in line with previous studies
(Chinn and Prasad, 2003; Lee et al., 2008; Phillips et al., 2013).
The 0.04 coefficient on initial NFA implies that an increase in NFA of 10 percent of GDP raises
the medium-term current account balance by about 0.4 percent of GDP. The sign of the coefficient
is theoretically ambiguous, but the positive sign estimated here is consistent with previous find-
ings. The regression includes a (statistically significant) interaction term allowing for a non-linear
relationship between the initial net foreign asset position and the current account.6 Relative output
per worker, in interaction with capital openness, is positively related to the current account, a result
that may be explained through catching-up effects. An increase in relative output per worker by
10 percentage point leads to a rise in the current account by 0.75 percentage points for countries
with an open capital account. In countries with capital controls, relative productivity has virtually
no effect on the current account. A higher old-age dependency ratio and higher population growth
reduce the current account balance, as can be expected in terms of the life-cycle theory of saving.
Financial center status is positively related to the current account balance, as expected. Finan-
cial centers are found to have a current account balance about 2.7 percent of GDP higher than
the other countries in our sample. Risks associated with the institutional and political environ-
ment are not statistically significant determinants of current accounts in our estimation. Reserve
currency status is negatively linked to the current account, in line with the standard “exorbitant
privilege” argument. For every 10 percent of global reserves held in its own currency, a country
experiences a current account deficit which is lower by 0.31 percentage points. By contrast, a
higher private credit-to-GDP ratio significantly reduces the current account balance. This result
is difficult to interpret theoretically but may reflect either financial liberalization or the failure of
policies to prevent financial excesses, which can cause demand booms, cause real appreciation and
weaken current accounts. According to our estimates, an increase in relative private credit to GDP
5We experimented with other variables used by Phillips et al. (2013) for which data are available, including globalcapital market conditions or global risk aversion. However, we dropped these variables from our regression model asthe coefficients turned out to be statistically insignificant.
6Catão and Milesi-Ferretti (2014) suggest that crisis probabilities increase when the net foreign debt is above 60percent of GDP.
15
by 10 percentage points is associated with a weaker current account by 0.28 percentage points.
The output gap enters significantly with a negative coefficient and reflects cyclical influences on
the current account balances. This means that the estimated coefficients on all other variables are
measuring their effects for given values of the relative output gap. The interaction term of the
terms of trade gap and trade openness is also statistically significant, with the expected positive
sign. At the sample mean for trade openness, an increase in the terms of trade relative to trend
by one percentage points is associated with an improvement of the current account of about 0.2
percent of GDP. The coefficient on the cyclically-adjusted fiscal balance implies that a percentage
point increase in the cyclically-adjusted government budget balance (relative to trading partners)
leads to a 0.13 percentage point increase in the current account balance in percent of GDP. This
result is in line with non-Ricardian household behavior.
When the cyclically-adjusted corporate financial balance is included in the model as an addi-
tional regressor (Column 2), the model fit improves, as indicated by the R-squared and the root
mean squared error (RMSE). The estimated coefficient on the corporate financial balance is highly
significant, and of positive sign. It implies that a 1 percentage point increase in corporate net lend-
ing (relative to trading partners) leads to a 0.13 percentage point increase in the current account.
Including only corporate saving in the current account regression (Column 3) leads to the same
result. A rise in corporate saving (relative to trading partners) by one percentage point increases
the current account by approximately 0.15 percentage points. This result is consistent with in-
complete piercing of the corporate veil. It is robust to the inclusion of corporate investment in
the regression (Column 5), but corporate investment itself does not have a significant effect on the
current account balance when included either alone or together with corporate saving (Columns
4 and 5). In Columns 6 and 7, we estimate the same equations separately for national saving
and national investment as the dependent variable. In line with Phillips et al. (2013), we find the
majority of the significant variables in the current account regressions appear to operate mainly
through the saving channel. Both corporate saving and corporate investment are significant in the
regressions for domestic saving and domestic investment. However, corporate saving raises total
saving more than it raises total investment, and corporate investment raises total investment more
than it raises total saving. These findings are again consistent with the results from the current
account regressions and with the corporate veil hypothesis. In Columns 8 and 9, the dependent
variable is the household financial balance. The effects of almost all of the explanatory variables
have the same size and are similar in magnitude as in the current account regressions, in line with
the theoretical focus on the household sector in intertemporal models of the current account. The
estimated effects of the corporate sector variables in the household financial balance regressions
suggest, however, that the total volumes of national saving and investment partly are beyond the
16
control of the household sector. Theoretically, when households fully pierce the corporate veil, an
increase in corporate saving should be fully offset by opposite changes in household saving, given
fundamentals. However, the coefficients on corporate net lending and corporate saving are just
-0.2 and -0.15, respectively.
The corporate sector variables included in the pooled regression of Table 1 are not only statisti-
cally, but also economically significant. The graphs shown in Figure 7 are based on the estimation
results reported in Column 3 of Table 1, where corporate saving is included as an explanatory vari-
able. While the upper panel of Figure 7 shows the overall very good performance of the model,
the bottom left graph shows that the corporate saving measure explains 10.5 percent of the other-
wise unexplained variation in current account balances. The bottom right graph of Figure 7 shows
that the corporate saving variable can explain a considerable part of the otherwise unexplained
cross-country variation in current account balances over the long run, and hence contributes to the
observed current account imbalances. For example, the corporate saving variable almost fully ex-
plains the average residuals of a current account regression without any corporate sector variables
for China, Japan, and the United Kingdom. Overall, we conclude that taking account of corporate
sector behavior significantly improves our understanding of the current account.7
4.3.2 Robustness
Table 2 presents several robustness checks. In Columns 1-2, both the fiscal balance and the corpo-
rate sector variables are instrumented, with results qualitatively very similar to those discussed in
the previous Subsection. Note that the estimated coefficients on both the fiscal and the corporate
financial balance are now larger, compared to the estimations reported in Table 1, and in line with
recent estimates for the instrumented cyclically-adjusted fiscal balance obtained by IMF (2018).
In Columns 3-4, country fixed effects are added to the regression models including either the
corporate financial balance (Column 3) or corporate saving and investment separately (Column
4) as explanatory variables. While the point estimates of each of the corporate sector variables
increase in absolute value, compared with the models from Table 1, Columns 2 and 5, corporate
investment now enters with a statistically significant coefficient. We hypothesize that this result is
in part due to persistent cross-country differences in the corporate investment-to-GDP ratio, with
east-Asian countries in particular being permanent outliers. To investigate this possibility further,
and because including country fixed effects has the inconvenience of effectively removing much
of the cross-country variation in the data, we also estimate the models for a smaller sample with
pooled GLS, excluding only the high-investment surplus economies China and South Korea (Table
7Note that the estimation results are robust to using non-financial corporate sector variables.
17
2, Columns 5-8). Corporate investment now turns out to have a statistically significant effect on
the current account.
The estimations reported in Columns 9-10 include net FDI flows as an additional regressor
to capture the increasingly important role for global firms as a possible explanation for the link
between corporate net lending and the current account. Although tracking the international foot-
prints of global firms in terms of the implications of their foreign portfolio and direct investment
strategies (Avdjiev et al., 2018) as well off-shore activities (Alstadsaeter et al., 2018) are a complex
issue that can only be (partially) addressed using firm-level micro data, a feasible robustness check
in a macro panel framework is to control for net FDI flows in the current account estimations. As
can bee seen in Columns 9-10 of Table 2, the estimated coefficients on the corporate sector vari-
ables remain virtually unchanged, compared with the models from Columns 2 and 5 in Table 1,
even when net FDI flows are added to the models.
4.3.3 Is the corporate veil effect a temporary crisis phenomenon?
We also address the question of whether the corporate veil thickened as a result of the global fi-
nancial crisis after 2007. This hypothesis is intuitively appealing because individual shareholders
may discount the value of profits retained by the corporations of which they are the owners in
an environment of uncertain future sales and profit opportunities, higher bankruptcy risk and in-
creased likelihood of a stock market downturn. As a result, shareholders’ consumption may be less
sensitive to corporate retained profits in times of crisis than in normal times, when shareholders
have a clearer perception of their permanent income which in part stems from claims on corporate
saving.
The results reported in Table 3 do not support such a hypothesis, however. In Columns 1-4,
the current account models including the corporate sector variables are estimated for the period
1980-2007. If anything, the effects of corporate net lending and corporate saving on the current
account are stronger for the pre-crisis sample than for the full sample (Columns 2-5 of Table 1).
Similarly, when the corporate sector variables are interacted with two different crisis dummies
in estimations over the full sample period, the estimated coefficients on these interaction terms are
quantitatively negligible and statistically insignificant. In Columns 5-6 of Table 3, we include a
dummy variable for the global financial crisis, which takes a value of one for the years 2008-2012,
in the regression model. Focusing on this particular crisis is warranted by the particular depth of
the Great Recession and its global repercussions. In Columns 7-8, we use a dummy variable for
country-specific systemic banking crises, based on Laeven and Valencia (2018). Including this
banking crisis dummy provides a more general test of a crisis-induced thickening of the corporate
veil. However, the results of the different specifications shown in Table 3 suggest that the current
18
account effects of the corporate sector cannot be explained as a temporary crisis phenomenon.
4.3.4 Is the corporate saving effect due to income inequality?
Finally, we can use our current account estimations for clarifying the relationship between corpo-
rate saving and household income inequality. Dao and Maggi (2018) argue that the observed pos-
itive link between corporate saving and the current account should not be surprising since higher
corporate saving reinforced rising wealth inequality and hence did not give rise to proportionately
higher aggregate household consumption. However, as can be seen in Figure 8, the cross-country
correlation of changes in corporate saving and changes in top-end personal income inequality is
actually negative in our sample. Moreover, changes in the top 1% household income share are
negatively correlated with changes in national current account balances, in contrast with the posi-
tive correlation between changes in corporate saving and changes in current account balances (see
Figures 8 and 6).
In Table 4, we show estimation models including both the corporate sector variables and dif-
ferent measures of personal income inequality. While the corporate veil effects are robust to this
extension of the model, household income inequality is found to have a consistently negative ef-
fect on the current account. Although this result may seem counterintuitive, it is consistent with
empirical evidence pointing at a negative effect of (top-end) income inequality on household and
national saving (“trickle-down consumption”). Bertrand and Morse (2016), for example, based on
1980-2008 expenditure data from the Consumer Expenditure Survey (CEX), show that non-rich
households in the United States consumed a larger share of their current income when exposed to
higher top income and consumption levels. Theoretically, this finding is consistent with consump-
tion externalities arising from a status-maintaining motive by middle and lower class households
(see also Frank, 2007; Heffetz, 2011; Frank et al., 2014; Agarwal et al., 2018). Bertrand and Morse
(2016) conclude that the U.S. personal saving rate in 2005, which was 1.5%, would have been be-
tween 3.5% and 3.9% if top income levels had grown at the same rate as the median income since
the 1980s. Kumhof et al. (2012) and Behringer and van Treeck (2018) obtain similar results in
macro panel estimation analyses of current account balances.
How is the finding of a negative current account effect of household inequality to be squared
with the positive effect of corporate saving? Although the present analysis does not allow any
definite conclusions, a potential explanation follows directly from the combined notions of trickle-
down consumption and corporate veil: Trickle-down consumption effects are triggered by higher
spending by high-income households on positional goods, to which lower-income households
react by trading off (non-positional) saving for (positional) consumption. Without a corporate veil,
an increase in corporate saving should have the same consumption and saving effects as an increase
19
in top household incomes. However, in the presence of a corporate veil, trickle-down consumption
effects will be smaller in countries where corporate saving increases more strongly, but where
top-end household income inequality increases less strongly. As Figure 8 suggests, changes in
corporate saving and top household income shares tend to be inversely related across countries,
since a high level of retained corporate sector profits in surplus countries such as Germany, Japan,
the Netherlands, or South Korea implies a lower level of top executive incomes and dividend
income in the household sector. Conversely, higher distributed profits and top management pay in
such deficit countries as the United Kingdom or the United States imply lower corporate retained
earnings.
5 Concluding remarks
Recent academic and policy-oriented debates have highlighted the importance of corporate sector
behavior as a driving force of macroeconomic trends (Karabarbounis and Neiman, 2014; Gru-
ber and Kamin, 2016; Chen et al., 2017; IMF, 2017; Dao and Maggi, 2018). This emerging
strand in the literature constitutes a departure from the long dominant individualistic foundations
of theoretical and empirical macroeconomics. The present paper contributes to these debates by
analyzing the role of the corporate sector in global current account imbalances. While the in-
tertemporal approach to the current account that has dominated the literature since the seminal
contribution by Obstfeld and Rogoff (1995) highlights the importance of individual optimizing
behavior for national saving-investment balances, our paper adds to the increasing recognition of
the non-household sectors as shaping macroeconomic dynamics beyond the control of decisions
made in the household sector.8 While the existing empirical literature has routinely tested for
non-Ricardian household behavior by including the fiscal balance as an explanatory variable in
current account regressions, we have argued in this paper that corporate sector behavior ought to
take center stage in the analysis of global current account imbalances.
The most significant and robust result of the present paper is that changes in corporate saving
have statistically and economically significant explanatory power for the understanding of na-
tional current account dynamics. This finding is robust to controlling for country-specific effects,
FDI flows, temporary crisis effects, and personal income inequality. At a theoretical basis, it is
consistent with incomplete piercing of the corporate veil.
The recent convergence of the macroeconomics literature and the literature on income and
wealth inequality in terms of the implications of corporate sector trends for both aggregate de-
8The focus on economic sectors as driving forces of macroeconomic outcomes has a long tradition in “structuralist”approaches to macroeconomics (see, for example, Godley and Lavoie, 2007).
20
mand dynamics and distributional dynamics (e.g. Zucman, 2014; Piketty et al., 2017; Autor et al.,
2017) entails promising avenues for future research. On the one hand, as our empirical analysis
shows, the current account effects of changes in distribution may differ considerably across coun-
tries depending on the extent to which they affect either personal income inequality or corporate
saving and wealth inequality. On the other hand, the growing prevalence of globally operating
firms poses important challenges to conventional analyses of both income and wealth inequality
measures and current account determinants. National current account balances are increasingly
driven by the decisions of multinational firms in a context of global value chains and interna-
tional tax optimization strategies, which interfere with intertemporal saving decisions by domestic
households (e.g. Avdjiev et al., 2018). While the present paper has highlighted the importance of
corporate sector behavior in a macro panel estimation framework, an important task for future re-
search is to analyze the macroeconomic implications of corporate sector behavior using firm-level
micro data.
21
References
Agarwal, S., Mikhed, V. and Scholnick, B. (2018), Does the Relative Income of Peers Cause
Financial Distress? Evidence from Lottery Winners and Neighboring Bankruptcies, Working
Papers 18-16, Federal Reserve Bank of Philadelphia.
Ali Abbas, S. M., Bouhga-Hagbe, J., Fatás, A., Mauro, P. and Velloso, R. C. (2011), ‘Fiscal policy
and the current account’, IMF Economic Review 59(4), 603–629.
Alstadsaeter, A., Johannesen, N. and Zucman, G. (2018), Who Owns the Wealth in Tax Havens?
Macro Evidence and Implications for Global Inequality, CEPR Discussion Papers 12779,
C.E.P.R. Discussion Papers.
André, C., Guichard, S., Kennedy, M. and Turner, D. (2007), Corporate net lending. A review of
recent trends, OECD Economics Department Working Papers 583, Organisation for Economic
Co-operation and Development.
Atkinson, A. B. (2009), ‘Factor shares: The principal problem of political economy?’, Oxford
Review of Economic Policy 25(1), 3–16.
Auerbach, A. J. and Hassett, K. (1991), Corporate Savings and Shareholder Consumption, in
‘National Saving and Economic Performance’, NBER Chapters, National Bureau of Economic
Research, Inc, pp. 75–102.
Autor, D., Dorn, D., Katz, L. F., Patterson, C. and Reenen, J. V. (2017), ‘Concentrating on the Fall
of the Labor Share’, American Economic Review 107(5), 180–185.
Avdjiev, S., Everett, M., Lane, P. R. and Shin, H. S. (2018), ‘Tracking the international footprints
of global firms’, BIS Quarterly Review .
Baker, M., Nagel, S. and Wurgler, J. (2007), ‘The effect of dividends on consumption’, Brookings
Papers on Economic Activity 38(1), 231–292.
Bebczuk, R. and Cavallo, E. (2016), ‘Is business saving really none of our business?’, Applied
Economics 48(24), 2266–2284.
Behringer, J. and van Treeck, T. (2018), ‘Income distribution and the current account’, Journal of
International Economics 114, 238 – 254.
Bertrand, M. and Morse, A. (2016), ‘Trickle-down consumption’, The Review of Economics and
Statistics 98(5), 863–879.
22
Bluedorn, J. and Leigh, D. (2011), ‘Revisiting the Twin Deficits Hypothesis: The Effect of Fiscal
Consolidation on the Current Account’, IMF Economic Review 59(4), 582–602.
Caballero, R. J., Farhi, E. and Gourinchas, P.-O. (2008), ‘An Equilibrium Model of "Global Im-
balances" and Low Interest Rates’, American Economic Review 98(1), 358–93.
Catão, L. A. and Milesi-Ferretti, G. M. (2014), ‘External liabilities and crises’, Journal of Inter-
national Economics 94(1), 18–32.
Ca’Zorzi, M., Chudik, A. and Dieppe, A. (2012), ‘Thousands of models, one story: Current
account imbalances in the global economy’, Journal of International Money and Finance
31(6), 1319–1338.
Chen, P., Karabarbounis, L. and Neiman, B. (2017), ‘The global rise of corporate saving’, Journal
of Monetary Economics 89, 1–19.
Chinn, M. D., Eichengreen, B. and Ito, H. (2011), A forensic analysis of global imbalances, NBER
Working Paper 17513, National Bureau of Economic Research, Inc.
Chinn, M. D., Eichengreen, B. and Ito, H. (2014), ‘A forensic analysis of global imbalances’,
Oxford Economic Papers 66(2), 465–490.
Chinn, M. D. and Ito, H. (2007), ‘Current account balances, financial development and institutions:
Assaying the world “saving glut”’, Journal of International Money and Finance 26(4), 546–569.
Chinn, M. D. and Ito, H. (2008), ‘Global current account imbalances: American fiscal policy
versus east asian savings’, Review of International Economics 16(3), 479–498.
Chinn, M. D. and Prasad, E. S. (2003), ‘Medium-term determinants of current accounts in indus-
trial and developing countries: an empirical exploration’, Journal of International Economics
59(1), 47–76.
Cooper, R. N. (2008), ‘Global imbalances: Globalization, demography, and sustainability’, Jour-
nal of Economic Perspectives 22(3), 93–112.
Dao, M. C. and Jones, C. (2018), Demographics, Old-Age Transfers and the Current Account,
IMF Working Papers 18/264, International Monetary Fund.
Dao, M. C. and Maggi, C. (2018), The Rise in Corporate Saving and Cash Holding in Advanced
Economies: Aggregate and Firm Level Trends, IMF Working Papers 18/262, International Mon-
etary Fund.
23
Feldstein, M. S. (1973), ‘Tax incentives, corporate saving, and capital accumulation in the United
States’, Journal of Public Economics 2, 159–171.
Feldstein, M. S. and Fane, G. (1973), ‘Taxes, corporate dividend policy and personal savings: The
British postwar experience’, The Review of Economics and Statistics 55(4), 399–411.
Frank, R. H. (2007), Falling Behind: How Rising Inequality Harms the Middle Class, University
of California Press.
Frank, R. H., Levine, A. S. and Dijk, O. (2014), ‘Expenditure cascades’, Review of Behavioral
Economics 1(12), 55–73.
Fratzscher, M. and Straub, R. (2009), Asset prices and current account fluctuations in G7
economies, Working Paper Series 1014, European Central Bank.
Glick, R. and Rogoff, K. (1995), ‘Global versus country-specific productivity shocks and the cur-
rent account’, Journal of Monetary Economics 35, 159–92.
Godley, W. and Lavoie, M. (2007), Monetary Economics - An Integrated Approach to Credit,
Money, Income, Production and Wealth, Palgrave Macmillan, Basingstoke, UK.
Grigoli, F., Herman, A. and Schmidt-Hebbel, K. (2018), ‘Saving in the world’, World Development
104(C), 257–270.
Gruber, J. and Kamin, S. (2009), ‘Do differences in financial development explain the global
pattern of current account imbalances?’, Review of International Economics 17(4), 667–688.
Gruber, J. W. and Kamin, S. B. (2007), ‘Explaining the global pattern of current account imbal-
ances’, Journal of International Money and Finance 26(4), 500 – 522.
Gruber, J. W. and Kamin, S. B. (2016), ‘The corporate saving glut and falloff of investment spend-
ing in OECD economies’, IMF Economic Review 64(4), 777–799.
Heffetz, O. (2011), ‘A test of conspicuous consumption: Visibility and income elasticities’, The
Review of Economics and Statistics 93(4), 1101–1117.
IMF (2006), Awash with cash: Why are corporate savings so high?, World Economic Outlook,
International Monetary Fund.
IMF (2017), External sector report, IMF Policy Paper, International Monetary Fund.
IMF (2018), External sector report, IMF Policy Paper, International Monetary Fund.
24
Karabarbounis, L. and Neiman, B. (2014), ‘The Global Decline of the Labor Share’, The Quarterly
Journal of Economics 129(1), 61–103.
Kerdrain, C., Koske, I. and Wanner, I. (2010), The impact of structural policies on saving, invest-
ment and current accounts, Economics Department Working Papers 815, OECD.
Kumhof, M. and Laxton, D. (2013), ‘Fiscal deficits and current account deficits’, Journal of Eco-
nomic Dynamics and Control 37(10), 2062–2082.
Kumhof, M., Ranciere, R., Lebarz, C., Richter, A. W. and Throckmorton, N. A. (2012), Income
inequality and current account imbalances, IMF Working Paper 12/08, International Monetary
Fund.
Laeven, L. and Valencia, F. (2018), Systemic Banking Crises Revisited, IMF Working Papers
18/206, International Monetary Fund.
Lane, P. R. and Milesi-Ferretti, G. M. (2007), ‘The external wealth of nations mark ii: Revised
and extended estimates of foreign assets and liabilities, 1970-2004’, Journal of International
Economics 73(2), 223–250.
Lee, J., Ostry, J. D., Prati, A., Ricci, L. A. and Milesi-Ferretti, G.-M. (2008), Exchange Rate As-
sessments: CGER Methodologies, IMF Occasional Papers 261, International Monetary Fund.
Monogios, Y. A. and Pitelis, C. (2004), ‘On (ultra) rationality and the corporate and government
veils’, The Manchester School 72(3), 382–402.
Obstfeld, M. and Rogoff, K. (1995), The intertemporal approach to the current account, in G. M.
Grossman and K. Rogoff, eds, ‘Handbook of International Economics’, Vol. 3 of Handbook of
International Economics, Elsevier, chapter 34, pp. 1731–1799.
Phillips, S., Catão, L., Ricci, L. A., Bems, R., Das, M., di Giovanni, J., Unsal, D. F., Castillo,
M., Lee, J., Rodriguez, J. and Vargas, M. (2013), The External Balance Assessment (EBA)
Methodology, IMF Working Papers, International Monetary Fund.
Piketty, T. (2003), ‘Income Inequality in France, 1901-1998’, Journal of Political Economy
111(5), 1004–1042.
Piketty, T. and Saez, E. (2003), ‘Income Inequality in the United States, 19131998’, The Quarterly
Journal of Economics 118(1), 1–41.
Piketty, T., Saez, E. and Zucman, G. (2017), ‘Distributional National Accounts: Methods and
Estimates for the United States’, The Quarterly Journal of Economics 133(2), 553–609.
25
Poterba, J. M. (1991), Dividends, Capital Gains, and the Corporate Veil: Evidence from Britain,
Canada, and the United States., A National Bureau of Economic Research Project Report, MIT,
pp. 49 – 71.
Quinn, D. (1997), ‘The correlates of change in international financial regulation’, American Polit-
ical Science Review 91, 531–551.
Quinn, D. P. and Toyoda, A. M. (2008), ‘Does capital account liberalization lead to growth?’,
Review of Financial Studies 21(3), 1403–1449.
Solt, F. (2016), ‘The standardized world income inequality database’, Social Science Quarterly
(97).
Sumner, M. (2004), ‘Corporate retentions and consumers’ expenditure’, The Manchester School
72, 119–130.
Zucman, G. (2014), ‘Taxing across Borders: Tracking Personal Wealth and Corporate Profits’,
Journal of Economic Perspectives 28(4), 121–148.
26
A Description of data
A.1 Variable definitions and data sources
Current account balance: The current account balance is defined as the sum of net exports of
goods and services, net primary income, and net secondary income as percent of GDP. Data for the
current account balance are taken from the World Economic Outlook (WEO) database (October
2018 version) provided by the International Monetary Fund (IMF).
Total investment: Gross capital formation is measured by the total value of gross fixed capital for-
mation and changes in inventories and acquisitions less disposals of valuables as percent of GDP.
Total saving is defined as the sum of the current account balance as percent of GDP and gross
capital formation as percent of GDP. Data are taken from the World Economic Outlook (WEO)
database (October 2018 version).
Household balance: The household financial balance is defined as gross saving minus gross capi-
tal formation and other capital expenditures as percent of GDP. Our primary source is the AMECO
database (May 2018 version) of the European Commission. For China, Korea, New Zealand and
South Africa, we use data from the national accounts statistics provided by the Eurostat database.
For Australia and Canada, we employ data from national statistical sources.
Net foreign assets: Net foreign assets are measured as total assets minus total liabilities as percent
of GDP. In order to capture possible nonlinearities in the relationship between the current account
and the net foreign asset position, we include an interaction term to allow for a different slope
when the net foreign asset position is below negative 60 percent of GDP. Data are taken from the
updated and extended version of the External Wealth of Nations Mark II database developed by
Lane and Milesi-Ferretti (2007).
Financial center status: We follow the External Balance Assessment (EBA) Methodology devel-
oped by Phillips et al. (2013) and include a dummy variable that equals one for small countries that
are considered as financial centers. In our regression sample these countries are the Netherlands
and Switzerland.
Output per worker, relative to top 3 economies: To measure a country’s relative stage of eco-
nomic development, we take the ratio of PPP converted GDP to working age population relative
to the average productivity of three large economies (Germany, Japan, and the United States). We
27
use GDP at PPPs in international dollars from the World Economic Outlook (WEO) database (Oc-
tober 2018 version). Data on working age population are taken from the 2017 Revision of World
Population Prospects provided by the United Nations. Relative output per worker is also interacted
with an indicator for capital account openness. The degree of a country’s capital account open-
ness is measured by the capital controls index developed by Quinn (1997) and Quinn and Toyoda
(2008). This index measures the magnitude of capital account liberalization and is scaled between
0 (no capital controls) and 1 (full capital controls).
Demographics: Demographic developments are proxied by the old-age dependency ratio, which
is constructed as the ratio of the population older than 65 years to the population between 30 and
64, and population growth. Data are taken from the 2017 Revision of World Population Prospects.
Reserve currency status: We use the share of a country’s own currency in the total stock of world
reserves as a proxy for the so-called “exorbitant privilege” of reserve currency countries. Data are
taken from the Currency Composition of Official Foreign Exchange Reserves (COFER) database
by the IMF.
Output gap: The output gap is measured by the Hodrick-Prescott filter. This procedure removes
the cyclical component from the long-term trend GDP. The HP filtered estimates of the output gap
are based on data over 1980-2013, using projections for 2018-2023. Data are in constant national
currency and taken from the World Economic Outlook (WEO) database (October 2018 version).
Terms of trade gap: The terms of trade are defined as the ratio between the index of export prices
and the index of import prices. The terms of trade gap is then measured by the Hodrick-Prescott
filter based on data over the period 1970-2016. We employ data from the national accounts statis-
tics provided by the OECD. For China, we use data from the World Development Indicators (WDI)
database (October 2018 version) by the World Bank. The resulting terms of trade gap series is then
interacted with an indicator of a countryâs trade openness. Trade openness is measured as the sum
of exports and imports of goods and services as percent of GDP. Data are taken from the World
Development Indicators (WDI) database (October 2018 version).
Institutional and political environment: In our regressions, we use a measure of the degree of
safety (or risk) associated with the institutional and political environment. This measure is a sum-
mary index of five indicators: socioeconomic conditions, investment profile, corruption, religious
tensions and democratic accountability. Each indicator is scaled between 0 and 1 and the summary
28
index is a simple average of the five sub-indices. A safer (i.e. less risky) institutional and political
environment is assigned higher ratings. Data are taken from the EBA dataset.
Private credit: We use private credit by deposit money banks and other financial institutions as
percent of GDP as a proxy for both “financial excesses” and financial development. The variable
measures the deviation form a country’s current level of credit provided to households and non-
financial corporations from its own historical average. Data are taken from the Global Financial
Development Database (GFDD) from the World Bank (July 2018 version). For Canada and New
Zealand, data are only available until 2008 and 2010. For the remaining period until 2015 we use
the latest available observation.
Cyclically-adjusted fiscal balance: The fiscal balance is defined as total general government
revenue minus total general government expenditures as percent of GDP. The cyclically-adjusted
fiscal balance is computed as the residual of a regression of the fiscal balance on the output gap. We
employ several sources for the fiscal balance. Our primary source is the AMECO database (May
2018 version) of the European Commission. As the Eurostat database and the OECD database
provide longer series for certain countries we complement the AMECO series with data from
these alternative sources. For China, Korea, New Zealand and South Africa, we use series from
the Eurostat database. For Belgium, Denmark, Italy, Netherlands, Norway, Sweden, Switzerland
and the United Kingdom, we employ data from the OECD database. For Australia and Canada,
we employ data from national statistical sources.
Cyclically-adjusted corporate balance: The corporate financial balance is defined as gross sav-
ing minus gross capital formation and other capital expenditures as percent of GDP. The cyclically-
adjusted corporate balance is computed as the residual of a regression of the corporate balance on
the output gap. We employ several sources for the corporate balance. Our primary source is the
AMECO database (May 2018 version) of the European Commission. For China, Korea, New
Zealand and South Africa, we use data from the national accounts statistics provided by the Euro-
stat database. For Australia and Canada, we employ data from national statistical sources.
Corporate saving and investment: Gross saving of the corporate sector is defined as disposable
income minus adjustments for the change in net equity of households in pension funds reserves
as percent of GDP. Gross capital formation of the corporate sector consists of gross fixed capital
formation, changes in inventories and acquisitions less disposals of valuables as percent of GDP.
Our primary source is the AMECO database (May 2018 version) of the European Commission.
29
For China, Korea, New Zealand and South Africa, we use data from the national accounts statis-
tics provided by the Eurostat database. For Australia and Canada, we employ data from national
statistical sources.
Foreign direct investment: We use net foreign direct investment flows as percent of GDP as a
proxy of the corporate sector globalization process. Net foreign direct investment flows are defined
as outward flows of foreign direct investment minus inward flows of foreign direct investment as
percent of GDP. Data are taken from the United Nations Conference on Trade and Development
(UNCTAD).
Economic crises: In order to examine whether the current account effects of corporate sector
behavior are different during economic crises we add interaction terms between corporate sector
variables and a variable for economic crises. For this purpose, we use a dummy variable for the
global financial crisis that equals one over the period 2008-2012 for all countries in the sample.
Alternatively, we use a dummy variable for banking crisis taken from the global database on sys-
temic banking crises by Laeven and Valencia (2018). Our sample of 25 countries over the period
1980-2015 includes 26 banking crises episodes.
Top income shares: We use different fiscal income top income share series from the World In-
equality Database (WID) as proxies for income inequality. These data are collected from personal
income tax returns following the methodology outlined in Piketty (2003) and Piketty and Saez
(2003). For Ireland, data on top 5% income shares are not available. We therefore use the mean of
the top 1% income share and the top 10% income share.
Gini coefficient: As an alternative measure of income inequality we use the Gini coefficient
of equivalized market household income (i.e. after taxes and transfers) of the Standardized In-
come Inequality Database (SWIID, version 7.1). For a detailed description of the dataset, see Solt
(2016).
A.2 Demeaning of explanatory variables
Since national current account balances are influenced both by domestic and foreign economic
conditions, most explanatory variables are converted into deviations from a weighted sample
mean. The sample mean is calculated across all countries for which data are available for a given
30
time period. Country-specific weighted averages of foreign variables are then constructed as fol-
lows:
X̃it = Xit −
∑Ji=1 (Wit ∗ Xit)∑J
i=1 Wit(7)
where Xit denotes the observation of the respective explanatory variable for country i and time
period t, and Wit stands for the weighting variable. For country-specific GDP weights we use
data from the World Economic Outlook (WEO) database (October 2018 version) provided by the
International Monetary Fund (IMF).
31
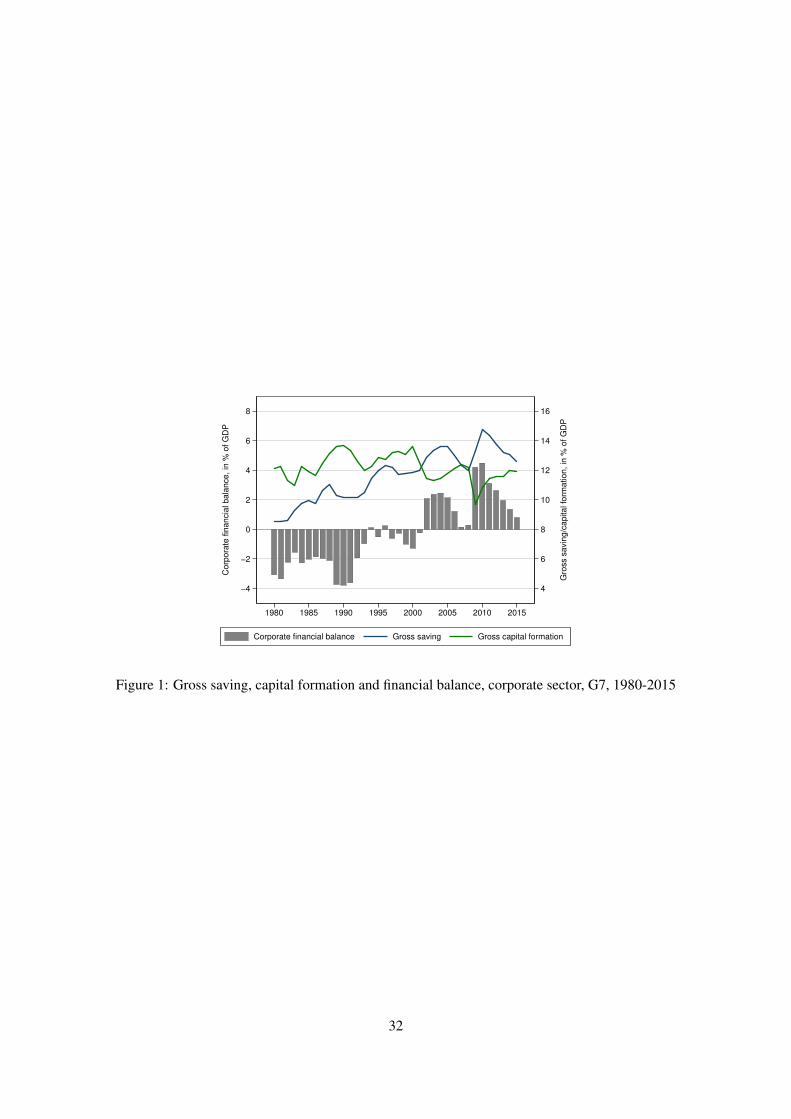
4
6
8
10
12
14
16
Gro
ss s
avin
g/c
ap
ita
l fo
rma
tio
n,
in %
of
GD
P
−4
−2
0
2
4
6
8
Co
rpo
rate
fin
an
cia
l b
ala
nce
, in
% o
f G
DP
1980 1985 1990 1995 2000 2005 2010 2015
Corporate financial balance Gross saving Gross capital formation
Figure 1: Gross saving, capital formation and financial balance, corporate sector, G7, 1980-2015
32
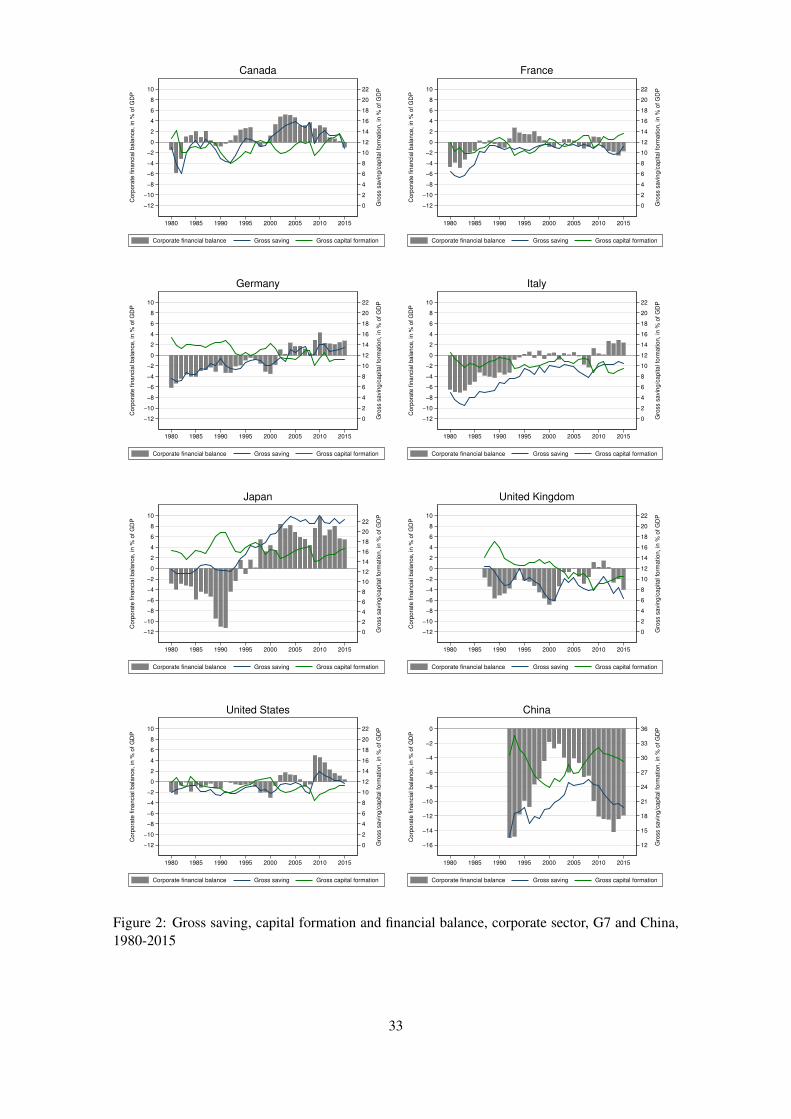
0
2
4
6
8
10
12
14
16
18
20
22
Gro
ss s
avin
g/c
apital fo
rmation, in
% o
f G
DP
−12
−10
−8
−6
−4
−2
0
2
4
6
8
10
Corp
ora
te fin
ancia
l bala
nce, in
% o
f G
DP
1980 1985 1990 1995 2000 2005 2010 2015
Corporate financial balance Gross saving Gross capital formation
Canada
0
2
4
6
8
10
12
14
16
18
20
22
Gro
ss s
avin
g/c
apital fo
rmation, in
% o
f G
DP
−12
−10
−8
−6
−4
−2
0
2
4
6
8
10
Corp
ora
te fin
ancia
l bala
nce, in
% o
f G
DP
1980 1985 1990 1995 2000 2005 2010 2015
Corporate financial balance Gross saving Gross capital formation
France
0
2
4
6
8
10
12
14
16
18
20
22
Gro
ss s
avin
g/c
apital fo
rmation, in
% o
f G
DP
−12
−10
−8
−6
−4
−2
0
2
4
6
8
10
Corp
ora
te fin
ancia
l bala
nce, in
% o
f G
DP
1980 1985 1990 1995 2000 2005 2010 2015
Corporate financial balance Gross saving Gross capital formation
Germany
0
2
4
6
8
10
12
14
16
18
20
22
Gro
ss s
avin
g/c
apital fo
rmation, in
% o
f G
DP
−12
−10
−8
−6
−4
−2
0
2
4
6
8
10
Corp
ora
te fin
ancia
l bala
nce, in
% o
f G
DP
1980 1985 1990 1995 2000 2005 2010 2015
Corporate financial balance Gross saving Gross capital formation
Italy
0
2
4
6
8
10
12
14
16
18
20
22
Gro
ss s
avin
g/c
apital fo
rmation, in
% o
f G
DP
−12
−10
−8
−6
−4
−2
0
2
4
6
8
10
Corp
ora
te fin
ancia
l bala
nce, in
% o
f G
DP
1980 1985 1990 1995 2000 2005 2010 2015
Corporate financial balance Gross saving Gross capital formation
Japan
0
2
4
6
8
10
12
14
16
18
20
22
Gro
ss s
avin
g/c
apital fo
rmation, in
% o
f G
DP
−12
−10
−8
−6
−4
−2
0
2
4
6
8
10
Corp
ora
te fin
ancia
l bala
nce, in
% o
f G
DP
1980 1985 1990 1995 2000 2005 2010 2015
Corporate financial balance Gross saving Gross capital formation
United Kingdom
0
2
4
6
8
10
12
14
16
18
20
22
Gro
ss s
avin
g/c
apital fo
rmation, in
% o
f G
DP
−12
−10
−8
−6
−4
−2
0
2
4
6
8
10
Corp
ora
te fin
ancia
l bala
nce, in
% o
f G
DP
1980 1985 1990 1995 2000 2005 2010 2015
Corporate financial balance Gross saving Gross capital formation
United States
12
15
18
21
24
27
30
33
36
Gro
ss s
avin
g/c
apital fo
rmation, in
% o
f G
DP
−16
−14
−12
−10
−8
−6
−4
−2
0
Corp
ora
te fin
ancia
l bala
nce, in
% o
f G
DP
1980 1985 1990 1995 2000 2005 2010 2015
Corporate financial balance Gross saving Gross capital formation
China
Figure 2: Gross saving, capital formation and financial balance, corporate sector, G7 and China,1980-2015
33
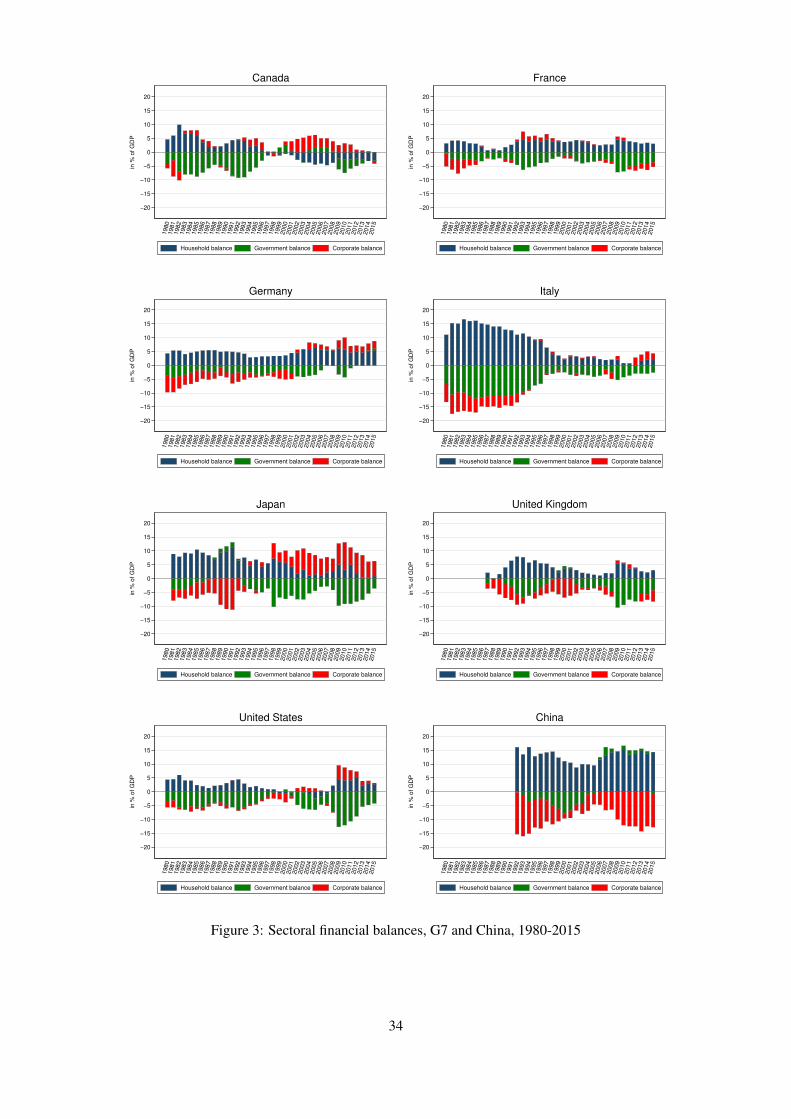
−20
−15
−10
−5
0
5
10
15
20
in %
of G
DP
1980
1981
1982
1983
1984
1985
1986
1987
1988
1989
1990
1991
1992
1993
1994
1995
1996
1997
1998
1999
2000
2001
2002
2003
2004
2005
2006
2007
2008
2009
2010
2011
2012
2013
2014
2015
Canada
Household balance Government balance Corporate balance
−20
−15
−10
−5
0
5
10
15
20
in %
of G
DP
1980
1981
1982
1983
1984
1985
1986
1987
1988
1989
1990
1991
1992
1993
1994
1995
1996
1997
1998
1999
2000
2001
2002
2003
2004
2005
2006
2007
2008
2009
2010
2011
2012
2013
2014
2015
France
Household balance Government balance Corporate balance
−20
−15
−10
−5
0
5
10
15
20
in %
of G
DP
1980
1981
1982
1983
1984
1985
1986
1987
1988
1989
1990
1991
1992
1993
1994
1995
1996
1997
1998
1999
2000
2001
2002
2003
2004
2005
2006
2007
2008
2009
2010
2011
2012
2013
2014
2015
Germany
Household balance Government balance Corporate balance
−20
−15
−10
−5
0
5
10
15
20
in %
of G
DP
1980
1981
1982
1983
1984
1985
1986
1987
1988
1989
1990
1991
1992
1993
1994
1995
1996
1997
1998
1999
2000
2001
2002
2003
2004
2005
2006
2007
2008
2009
2010
2011
2012
2013
2014
2015
Italy
Household balance Government balance Corporate balance
−20
−15
−10
−5
0
5
10
15
20
in %
of G
DP
1980
1981
1982
1983
1984
1985
1986
1987
1988
1989
1990
1991
1992
1993
1994
1995
1996
1997
1998
1999
2000
2001
2002
2003
2004
2005
2006
2007
2008
2009
2010
2011
2012
2013
2014
2015
Japan
Household balance Government balance Corporate balance
−20
−15
−10
−5
0
5
10
15
20
in %
of G
DP
1980
1981
1982
1983
1984
1985
1986
1987
1988
1989
1990
1991
1992
1993
1994
1995
1996
1997
1998
1999
2000
2001
2002
2003
2004
2005
2006
2007
2008
2009
2010
2011
2012
2013
2014
2015
United Kingdom
Household balance Government balance Corporate balance
−20
−15
−10
−5
0
5
10
15
20
in %
of G
DP
1980
1981
1982
1983
1984
1985
1986
1987
1988
1989
1990
1991
1992
1993
1994
1995
1996
1997
1998
1999
2000
2001
2002
2003
2004
2005
2006
2007
2008
2009
2010
2011
2012
2013
2014
2015
United States
Household balance Government balance Corporate balance
−20
−15
−10
−5
0
5
10
15
20
in %
of G
DP
1980
1981
1982
1983
1984
1985
1986
1987
1988
1989
1990
1991
1992
1993
1994
1995
1996
1997
1998
1999
2000
2001
2002
2003
2004
2005
2006
2007
2008
2009
2010
2011
2012
2013
2014
2015
China
Household balance Government balance Corporate balance
Figure 3: Sectoral financial balances, G7 and China, 1980-2015
34

AUSCAN
CHE
CHN CZE
DEU
DNK
ESP
FINFRA
GBR
HUN
IRL
ITA
JPN
KOR
NLDNOR
NZLPOLPRT
SVN
SWE
USA
ZAF
−10
−5
0
5
10
15
Curr
ent account bala
nce, in
% o
f G
DP
−5 0 5 10 15
Corporate financial balance, in % of GDP
AUS
CAN
CHE
CHN
CZE
DEU
DNKESP
FIN
FRA
GBR
HUN
IRL
ITA
JPN
KOR
NLD
NOR
NZL
POL
PRTSVN
SWE
USAZAF
−15
−10
−5
0
5
10
Household
fin
ancia
l bala
nce, in
% o
f G
DP
−5 0 5 10 15
Corporate financial balance, in % of GDP
AUSCAN
CHE
CHN CZE
DEU
DNK
ESP
FIN FRA
GBR
HUN
IRL
ITA
JPN
KOR
NLDNOR
NZLPOLPRT
SVN
SWE
USA
ZAF
−10
−5
0
5
10
15
Curr
ent account bala
nce, in
% o
f G
DP
−10 −5 0 5 10 15
Government financial balance, in % of GDP
AUS
CAN
CHE
CHN
CZE
DEU
DNKESP
FIN
FRA
GBR
HUN
IRL
ITA
JPN
KOR
NLD
NOR
NZL
POL
PRTSVN
SWE
USA ZAF
−15
−10
−5
0
5
10
Household
fin
ancia
l bala
nce, in
% o
f G
DP
−10 −5 0 5 10 15
Government financial balance, in % of GDP
Note: The figure shows the change in, respectively, the government financial balance and the corporate financial
balance in % of GDP (horizontal axis) against the change in, respectively, the current account balance in % of GDP
and the private household financial balance in % of GDP (vertical axis). Changes are calculated for the period
1980/83-2012/15 or for the longest available time span within this period.
Figure 4: Sectoral financial balances and current account balances, 1980-2015
35
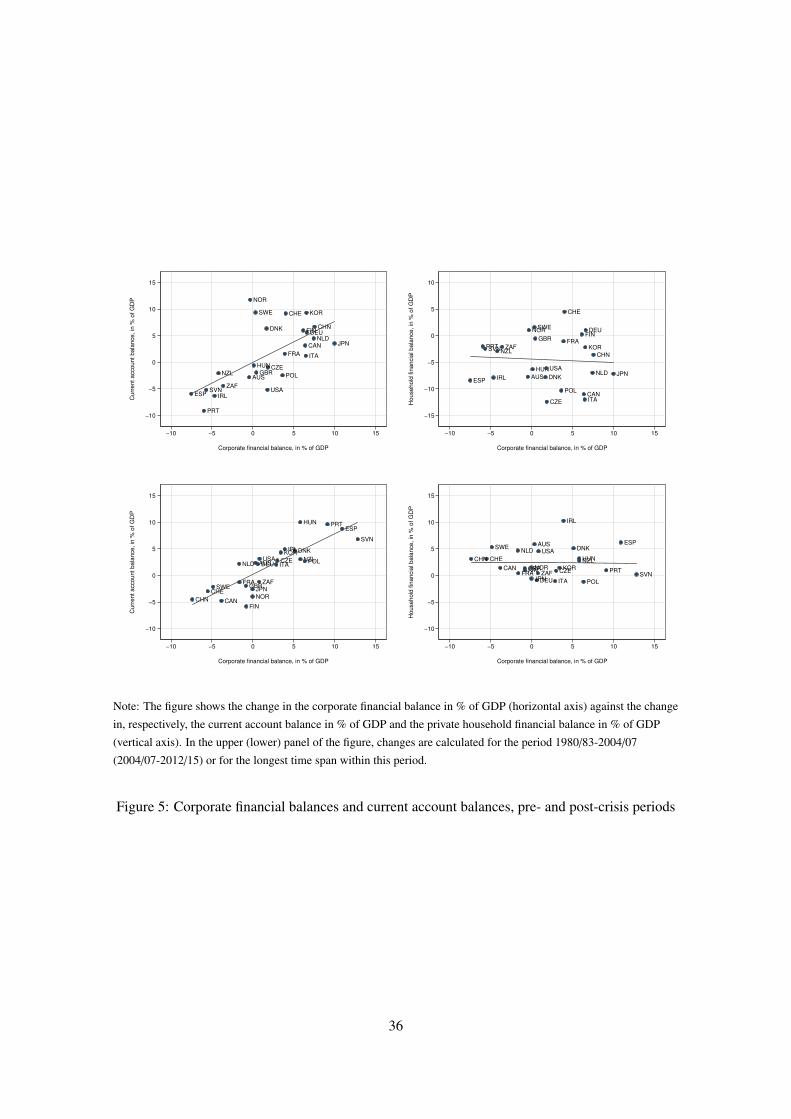
AUS
CAN
CHE
CHN
CZE
DEUDNK
ESP
FIN
FRA
GBRHUN
IRL
ITA
JPN
KOR
NLD
NOR
NZL POL
PRT
SVN
SWE
USAZAF
−10
−5
0
5
10
15
Curr
ent account bala
nce, in
% o
f G
DP
−10 −5 0 5 10 15
Corporate financial balance, in % of GDP
AUS
CAN
CHE
CHN
CZE
DEU
DNKESP
FINFRAGBR
HUN
IRL
ITA
JPN
KOR
NLD
NOR
NZL
POL
PRTSVN
SWE
USA
ZAF
−15
−10
−5
0
5
10
Household
fin
ancia
l bala
nce, in
% o
f G
DP
−10 −5 0 5 10 15
Corporate financial balance, in % of GDP
AUS
CAN
CHE
CHN
CZEDEU
DNK
ESP
FIN
FRAGBR
HUN
IRL
ITA
JPN
KOR
NLD
NOR
NZLPOL
PRT
SVN
SWE
USA
ZAF
−10
−5
0
5
10
15
Curr
ent account bala
nce, in
% o
f G
DP
−10 −5 0 5 10 15
Corporate financial balance, in % of GDP
AUS
CAN
CHECHN
CZE
DEU
DNKESP
FINFRA
GBR
HUN
IRL
ITAJPN
KOR
NLD
NORNZL
POL
PRTSVN
SWEUSA
ZAF
−10
−5
0
5
10
15
Household
fin
ancia
l bala
nce, in
% o
f G
DP
−10 −5 0 5 10 15
Corporate financial balance, in % of GDP
Note: The figure shows the change in the corporate financial balance in % of GDP (horizontal axis) against the change
in, respectively, the current account balance in % of GDP and the private household financial balance in % of GDP
(vertical axis). In the upper (lower) panel of the figure, changes are calculated for the period 1980/83-2004/07
(2004/07-2012/15) or for the longest time span within this period.
Figure 5: Corporate financial balances and current account balances, pre- and post-crisis periods
36
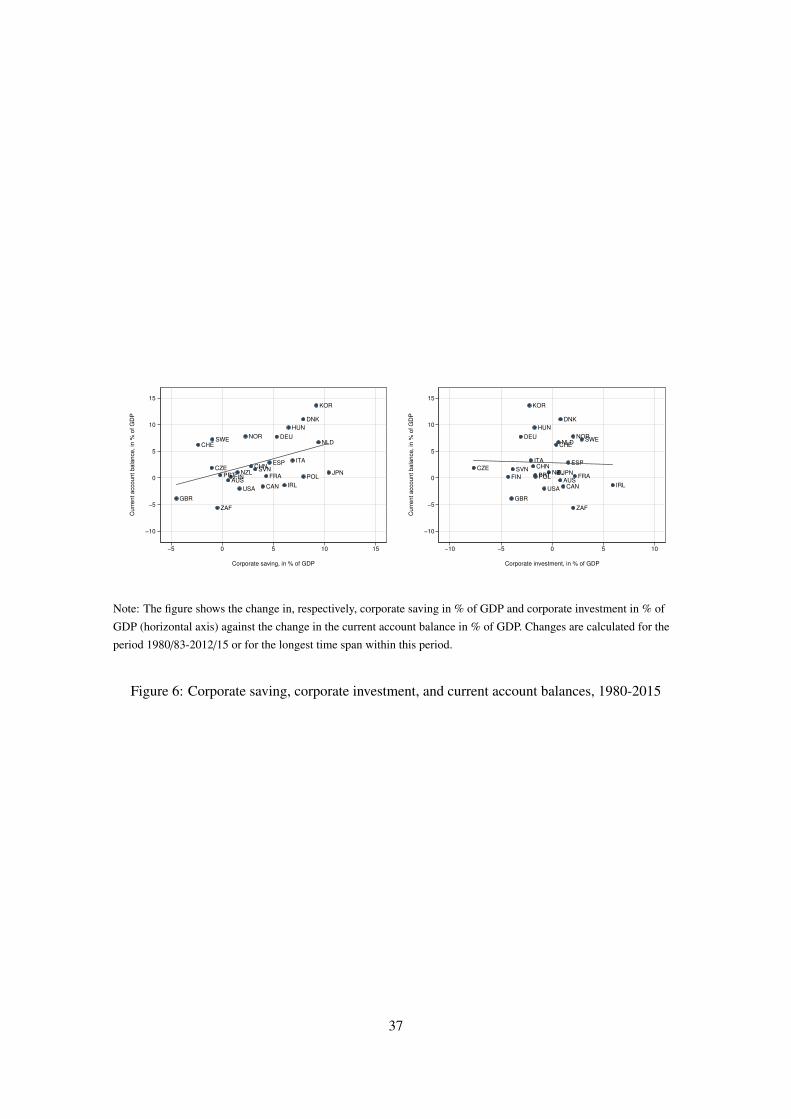
AUSCAN
CHE
CHNCZE
DEU
DNK
ESP
FIN FRA
GBR
HUN
IRL
ITA
JPN
KOR
NLDNOR
NZLPOLPRT
SVN
SWE
USA
ZAF
−10
−5
0
5
10
15
Curr
ent account bala
nce, in
% o
f G
DP
−5 0 5 10 15
Corporate saving, in % of GDP
AUSCAN
CHE
CHNCZE
DEU
DNK
ESP
FIN FRA
GBR
HUN
IRL
ITA
JPN
KOR
NLDNOR
NZLPOLPRT
SVN
SWE
USA
ZAF
−10
−5
0
5
10
15
Curr
ent account bala
nce, in
% o
f G
DP
−10 −5 0 5 10
Corporate investment, in % of GDP
Note: The figure shows the change in, respectively, corporate saving in % of GDP and corporate investment in % of
GDP (horizontal axis) against the change in the current account balance in % of GDP. Changes are calculated for the
period 1980/83-2012/15 or for the longest time span within this period.
Figure 6: Corporate saving, corporate investment, and current account balances, 1980-2015
37
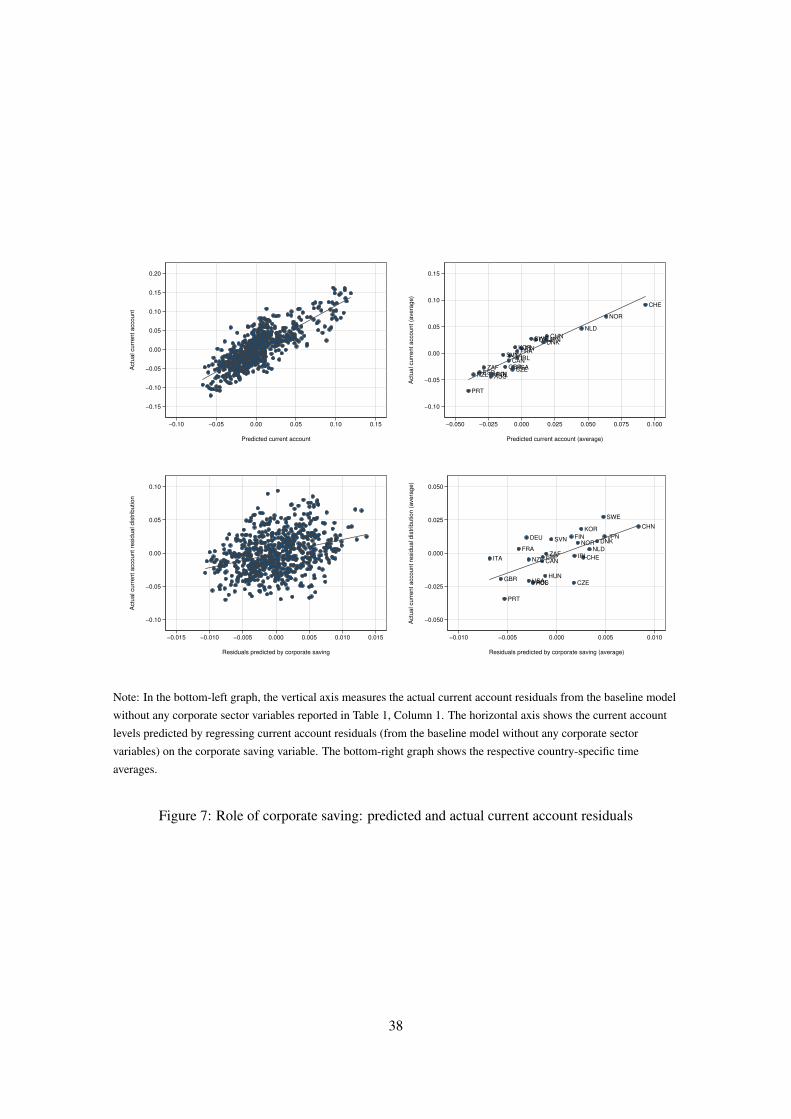
−0.15
−0.10
−0.05
0.00
0.05
0.10
0.15
0.20
Actu
al curr
ent account
−0.10 −0.05 0.00 0.05 0.10 0.15
Predicted current account
AUS
CAN
CHE
CHN
CZE
DEUDNK
ESP
FINFRA
GBRHUN
IRLITA
JPN
KOR
NLD
NOR
NZL POL
PRT
SVN
SWE
USAZAF
−0.10
−0.05
0.00
0.05
0.10
0.15
Actu
al curr
ent account (a
vera
ge)
−0.050 −0.025 0.000 0.025 0.050 0.075 0.100
Predicted current account (average)
−0.10
−0.05
0.00
0.05
0.10
Actu
al curr
ent account re
sid
ual dis
trib
ution
−0.015 −0.010 −0.005 0.000 0.005 0.010 0.015
Residuals predicted by corporate saving
AUS
CANCHE
CHN
CZE
DEUDNK
ESP
FIN
FRA
GBRHUN
IRLITA
JPN
KOR
NLDNOR
NZL
POL
PRT
SVN
SWE
USA
ZAF
−0.050
−0.025
0.000
0.025
0.050
Actu
al curr
ent account re
sid
ual dis
trib
ution (
avera
ge)
−0.010 −0.005 0.000 0.005 0.010
Residuals predicted by corporate saving (average)
Note: In the bottom-left graph, the vertical axis measures the actual current account residuals from the baseline model
without any corporate sector variables reported in Table 1, Column 1. The horizontal axis shows the current account
levels predicted by regressing current account residuals (from the baseline model without any corporate sector
variables) on the corporate saving variable. The bottom-right graph shows the respective country-specific time
averages.
Figure 7: Role of corporate saving: predicted and actual current account residuals
38
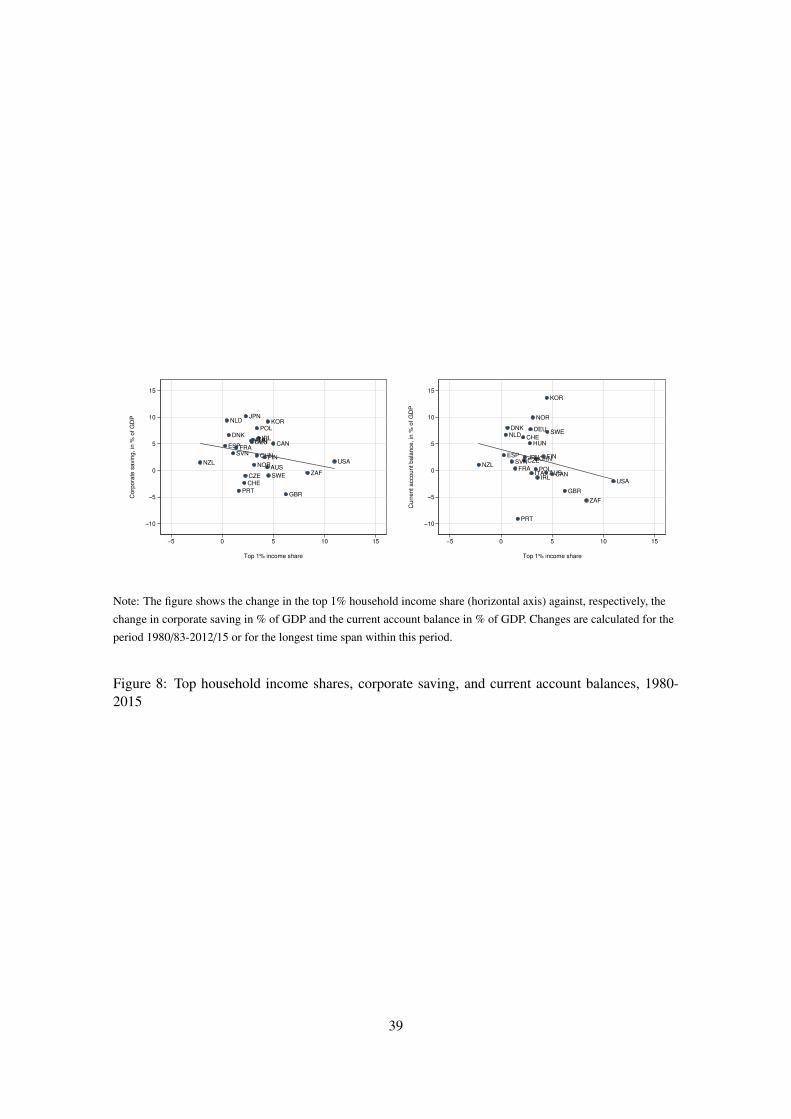
AUS
CAN
CHE
CHN
CZE
DEUDNK
ESP
FIN
FRA
GBR
HUNIRLITA
JPNKORNLD
NORNZL
POL
PRT
SVN
SWE
USA
ZAF
−10
−5
0
5
10
15
Corp
ora
te s
avin
g, in
% o
f G
DP
−5 0 5 10 15
Top 1% income share
AUSCAN
CHE
CHNCZE
DEUDNK
ESP FIN
FRA
GBR
HUN
IRLITA
JPN
KOR
NLD
NOR
NZLPOL
PRT
SVN
SWE
USA
ZAF
−10
−5
0
5
10
15
Curr
ent account bala
nce, in
% o
f G
DP
−5 0 5 10 15
Top 1% income share
Note: The figure shows the change in the top 1% household income share (horizontal axis) against, respectively, the
change in corporate saving in % of GDP and the current account balance in % of GDP. Changes are calculated for the
period 1980/83-2012/15 or for the longest time span within this period.
Figure 8: Top household income shares, corporate saving, and current account balances, 1980-2015
39
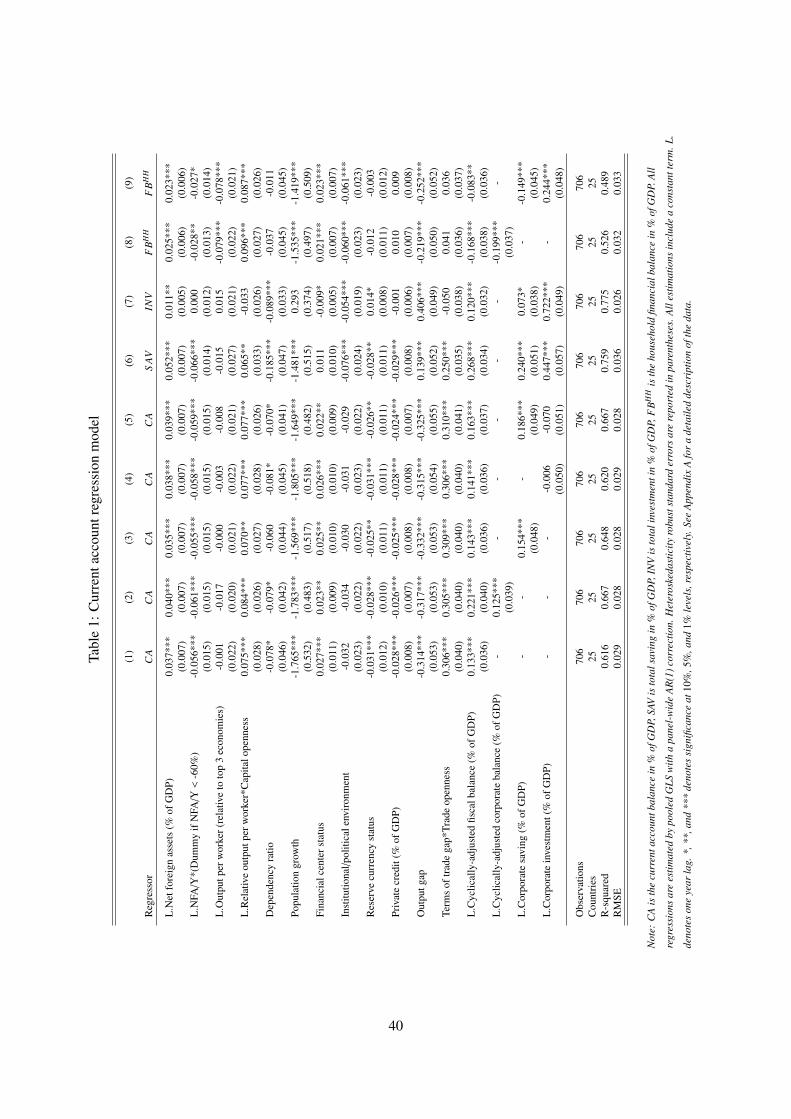
Tabl
e1:
Cur
rent
acco
untr
egre
ssio
nm
odel
(1)
(2)
(3)
(4)
(5)
(6)
(7)
(8)
(9)
Reg
ress
orC
AC
AC
AC
AC
AS
AV
INV
FB
HH
FB
HH
L.N
etfo
reig
nas
sets
(%of
GD
P)0.
037*
**0.
040*
**0.
035*
**0.
038*
**0.
039*
**0.
052*
**0.
011*
*0.
025*
**0.
023*
**(0
.007
)(0
.007
)(0
.007
)(0
.007
)(0
.007
)(0
.007
)(0
.005
)(0
.006
)(0
.006
)L
.NFA
/Y*(
Dum
my
ifN
FA/Y
<-6
0%)
-0.0
56**
*-0
.061
***
-0.0
55**
*-0
.058
***
-0.0
59**
*-0
.066
***
0.00
0-0
.028
**-0
.027
*(0
.015
)(0
.015
)(0
.015
)(0
.015
)(0
.015
)(0
.014
)(0
.012
)(0
.013
)(0
.014
)L
.Out
putp
erw
orke
r(re
lativ
eto
top
3ec
onom
ies)
-0.0
01-0
.017
-0.0
00-0
.003
-0.0
08-0
.015
0.01
5-0
.079
***
-0.0
78**
*(0
.022
)(0
.020
)(0
.021
)(0
.022
)(0
.021
)(0
.027
)(0
.021
)(0
.022
)(0
.021
)L
.Rel
ativ
eou
tput
perw
orke
r*C
apita
lope
nnes
s0.
075*
**0.
084*
**0.
070*
*0.
077*
**0.
077*
**0.
065*
*-0
.033
0.09
6***
0.08
7***
(0.0
28)
(0.0
26)
(0.0
27)
(0.0
28)
(0.0
26)
(0.0
33)
(0.0
26)
(0.0
27)
(0.0
26)
Dep
ende
ncy
ratio
-0.0
78*
-0.0
79*
-0.0
60-0
.081
*-0
.070
*-0
.185
***
-0.0
89**
*-0
.037
-0.0
11(0
.046
)(0
.042
)(0
.044
)(0
.045
)(0
.041
)(0
.047
)(0
.033
)(0
.045
)(0
.045
)Po
pula
tion
grow
th-1
.765
***
-1.7
83**
*-1
.569
***
-1.8
05**
*-1
.649
***
-1.4
81**
*0.
293
-1.5
35**
*-1
.419
***
(0.5
32)
(0.4
83)
(0.5
17)
(0.5
18)
(0.4
82)
(0.5
15)
(0.3
74)
(0.4
97)
(0.5
09)
Fina
ncia
lcen
ters
tatu
s0.
027*
**0.
023*
*0.
025*
*0.
026*
**0.
022*
*0.
011
-0.0
09*
0.02
1***
0.02
3***
(0.0
11)
(0.0
09)
(0.0
10)
(0.0
10)
(0.0
09)
(0.0
10)
(0.0
05)
(0.0
07)
(0.0
07)
Inst
itutio
nal/p
oliti
cale
nvir
onm
ent
-0.0
32-0
.034
-0.0
30-0
.031
-0.0
29-0
.076
***
-0.0
54**
*-0
.060
***
-0.0
61**
*(0
.023
)(0
.022
)(0
.022
)(0
.023
)(0
.022
)(0
.024
)(0
.019
)(0
.023
)(0
.023
)R
eser
vecu
rren
cyst
atus
-0.0
31**
*-0
.028
***
-0.0
25**
-0.0
31**
*-0
.026
**-0
.028
**0.
014*
-0.0
12-0
.003
(0.0
12)
(0.0
10)
(0.0
11)
(0.0
11)
(0.0
11)
(0.0
11)
(0.0
08)
(0.0
11)
(0.0
12)
Priv
ate
cred
it(%
ofG
DP)
-0.0
28**
*-0
.026
***
-0.0
25**
*-0
.028
***
-0.0
24**
*-0
.029
***
-0.0
010.
010
0.00
9(0
.008
)(0
.007
)(0
.008
)(0
.008
)(0
.007
)(0
.008
)(0
.006
)(0
.007
)(0
.008
)O
utpu
tgap
-0.3
14**
*-0
.317
***
-0.3
32**
*-0
.315
***
-0.3
25**
*0.
139*
**0.
406*
**-0
.219
***
-0.2
52**
*(0
.053
)(0
.053
)(0
.053
)(0
.054
)(0
.055
)(0
.052
)(0
.049
)(0
.050
)(0
.052
)Te
rms
oftr
ade
gap*
Trad
eop
enne
ss0.
306*
**0.
305*
**0.
309*
**0.
306*
**0.
310*
**0.
250*
**-0
.050
0.04
10.
036
(0.0
40)
(0.0
40)
(0.0
40)
(0.0
40)
(0.0
41)
(0.0
35)
(0.0
38)
(0.0
36)
(0.0
37)
L.C
yclic
ally
-adj
uste
dfis
calb
alan
ce(%
ofG
DP)
0.13
3***
0.22
1***
0.14
3***
0.14
1***
0.16
3***
0.26
8***
0.12
0***
-0.1
68**
*-0
.083
**(0
.036
)(0
.040
)(0
.036
)(0
.036
)(0
.037
)(0
.034
)(0
.032
)(0
.038
)(0
.036
)L
.Cyc
lical
ly-a
djus
ted
corp
orat
eba
lanc
e(%
ofG
DP)
-0.
125*
**-
--
--
-0.1
99**
*-
(0.0
39)
(0.0
37)
L.C
orpo
rate
savi
ng(%
ofG
DP)
--
0.15
4***
-0.
186*
**0.
240*
**0.
073*
--0
.149
***
(0.0
48)
(0.0
49)
(0.0
51)
(0.0
38)
(0.0
45)
L.C
orpo
rate
inve
stm
ent(
%of
GD
P)-
--
-0.0
06-0
.070
0.44
7***
0.72
2***
-0.
244*
**(0
.050
)(0
.051
)(0
.057
)(0
.049
)(0
.048
)
Obs
erva
tions
706
706
706
706
706
706
706
706
706
Cou
ntri
es25
2525
2525
2525
2525
R-s
quar
ed0.
616
0.66
70.
648
0.62
00.
667
0.75
90.
775
0.52
60.
489
RM
SE0.
029
0.02
80.
028
0.02
90.
028
0.03
60.
026
0.03
20.
033
Not
e:C
Ais
the
curr
enta
ccou
ntba
lanc
ein
%of
GD
P,SA
Vis
tota
lsav
ing
in%
ofG
DP,
INV
isto
tali
nves
tmen
tin
%of
GD
P,F
BH
His
the
hous
ehol
dfin
anci
alba
lanc
ein
%of
GD
P.A
ll
regr
essi
ons
are
estim
ated
bypo
oled
GLS
with
apa
nel-
wid
eA
R(1
)cor
rect
ion.
Het
eros
keda
stic
ityro
bust
stan
dard
erro
rsar
ere
port
edin
pare
nthe
ses.
All
estim
atio
nsin
clud
ea
cons
tant
term
.L.
deno
tes
one
year
lag.
*,**
,and
***
deno
tes
sign
ifica
nce
at10
%,5
%,a
nd1%
leve
ls,r
espe
ctiv
ely.
See
App
endi
xA
for
ade
taile
dde
scri
ptio
nof
the
data
.
40
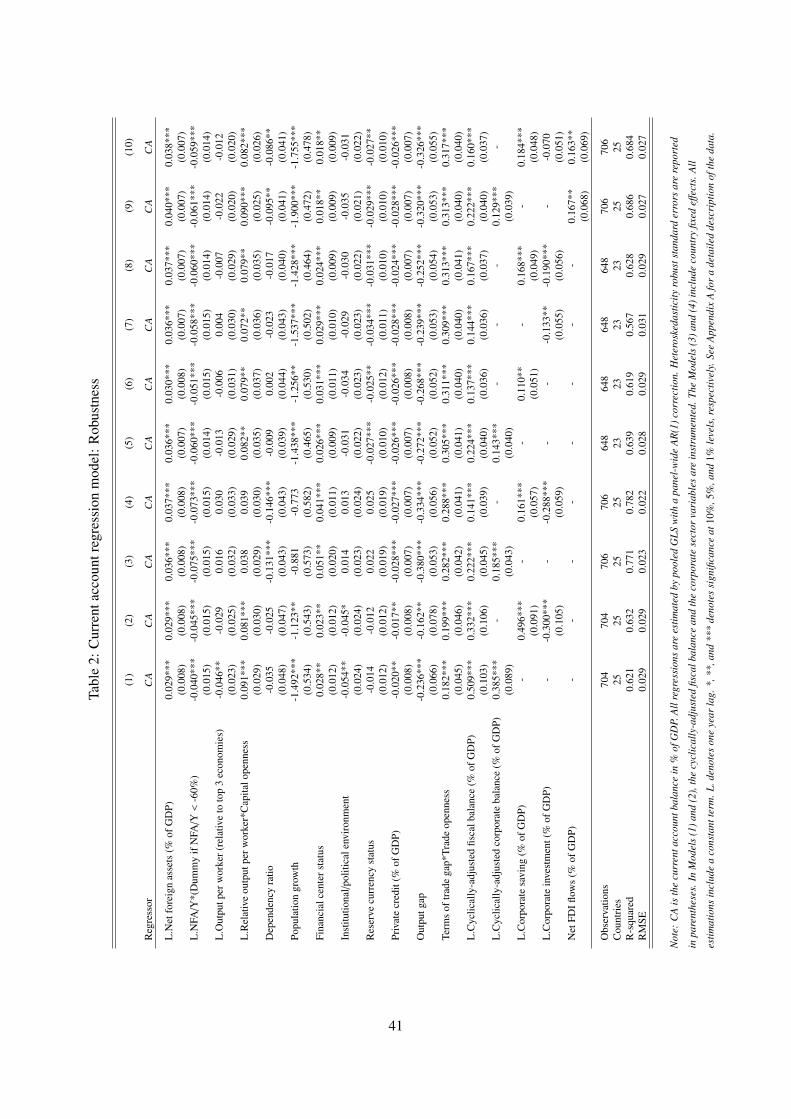
Tabl
e2:
Cur
rent
acco
untr
egre
ssio
nm
odel
:Rob
ustn
ess
(1)
(2)
(3)
(4)
(5)
(6)
(7)
(8)
(9)
(10)
Reg
ress
orC
AC
AC
AC
AC
AC
AC
AC
AC
AC
A
L.N
etfo
reig
nas
sets
(%of
GD
P)0.
029*
**0.
029*
**0.
036*
**0.
037*
**0.
036*
**0.
030*
**0.
036*
**0.
037*
**0.
040*
**0.
038*
**(0
.008
)(0
.008
)(0
.008
)(0
.008
)(0
.007
)(0
.008
)(0
.007
)(0
.007
)(0
.007
)(0
.007
)L
.NFA
/Y*(
Dum
my
ifN
FA/Y
<-6
0%)
-0.0
40**
*-0
.045
***
-0.0
75**
*-0
.073
***
-0.0
60**
*-0
.051
***
-0.0
58**
*-0
.060
***
-0.0
61**
*-0
.059
***
(0.0
15)
(0.0
15)
(0.0
15)
(0.0
15)
(0.0
14)
(0.0
15)
(0.0
15)
(0.0
14)
(0.0
14)
(0.0
14)
L.O
utpu
tper
wor
ker(
rela
tive
toto
p3
econ
omie
s)-0
.046
**-0
.029
0.01
60.
030
-0.0
13-0
.006
0.00
4-0
.007
-0.0
22-0
.012
(0.0
23)
(0.0
25)
(0.0
32)
(0.0
33)
(0.0
29)
(0.0
31)
(0.0
30)
(0.0
29)
(0.0
20)
(0.0
20)
L.R
elat
ive
outp
utpe
rwor
ker*
Cap
italo
penn
ess
0.09
1***
0.08
1***
0.03
80.
039
0.08
2**
0.07
9**
0.07
2**
0.07
9**
0.09
0***
0.08
2***
(0.0
29)
(0.0
30)
(0.0
29)
(0.0
30)
(0.0
35)
(0.0
37)
(0.0
36)
(0.0
35)
(0.0
25)
(0.0
26)
Dep
ende
ncy
ratio
-0.0
35-0
.025
-0.1
31**
*-0
.146
***
-0.0
090.
002
-0.0
23-0
.017
-0.0
95**
-0.0
86**
(0.0
48)
(0.0
47)
(0.0
43)
(0.0
43)
(0.0
39)
(0.0
44)
(0.0
43)
(0.0
40)
(0.0
41)
(0.0
41)
Popu
latio
ngr
owth
-1.4
92**
*-1
.123
**-0
.881
-0.7
73-1
.438
***
-1.2
56**
-1.5
37**
*-1
.428
***
-1.9
00**
*-1
.755
***
(0.5
34)
(0.5
43)
(0.5
73)
(0.5
82)
(0.4
65)
(0.5
30)
(0.5
02)
(0.4
64)
(0.4
72)
(0.4
78)
Fina
ncia
lcen
ters
tatu
s0.
028*
*0.
023*
*0.
051*
*0.
041*
**0.
026*
**0.
031*
**0.
029*
**0.
024*
**0.
018*
*0.
018*
*(0
.012
)(0
.012
)(0
.020
)(0
.011
)(0
.009
)(0
.011
)(0
.010
)(0
.009
)(0
.009
)(0
.009
)In
stitu
tiona
l/pol
itica
lenv
iron
men
t-0
.054
**-0
.045
*0.
014
0.01
3-0
.031
-0.0
34-0
.029
-0.0
30-0
.035
-0.0
31(0
.024
)(0
.024
)(0
.023
)(0
.024
)(0
.022
)(0
.023
)(0
.023
)(0
.022
)(0
.021
)(0
.022
)R
eser
vecu
rren
cyst
atus
-0.0
14-0
.012
0.02
20.
025
-0.0
27**
*-0
.025
**-0
.034
***
-0.0
31**
*-0
.029
***
-0.0
27**
(0.0
12)
(0.0
12)
(0.0
19)
(0.0
19)
(0.0
10)
(0.0
12)
(0.0
11)
(0.0
10)
(0.0
10)
(0.0
10)
Priv
ate
cred
it(%
ofG
DP)
-0.0
20**
-0.0
17**
-0.0
28**
*-0
.027
***
-0.0
26**
*-0
.026
***
-0.0
28**
*-0
.024
***
-0.0
28**
*-0
.026
***
(0.0
08)
(0.0
08)
(0.0
07)
(0.0
07)
(0.0
07)
(0.0
08)
(0.0
08)
(0.0
07)
(0.0
07)
(0.0
07)
Out
putg
ap-0
.236
***
-0.1
62**
-0.3
80**
*-0
.334
***
-0.2
72**
*-0
.268
***
-0.2
39**
*-0
.252
***
-0.3
20**
*-0
.326
***
(0.0
66)
(0.0
78)
(0.0
53)
(0.0
56)
(0.0
52)
(0.0
52)
(0.0
53)
(0.0
54)
(0.0
53)
(0.0
55)
Term
sof
trad
ega
p*Tr
ade
open
ness
0.18
2***
0.19
9***
0.28
2***
0.28
8***
0.30
5***
0.31
1***
0.30
9***
0.31
3***
0.31
3***
0.31
7***
(0.0
45)
(0.0
46)
(0.0
42)
(0.0
41)
(0.0
41)
(0.0
40)
(0.0
40)
(0.0
41)
(0.0
40)
(0.0
40)
L.C
yclic
ally
-adj
uste
dfis
calb
alan
ce(%
ofG
DP)
0.50
9***
0.33
2***
0.22
2***
0.14
1***
0.22
4***
0.13
7***
0.14
4***
0.16
7***
0.22
2***
0.16
0***
(0.1
03)
(0.1
06)
(0.0
45)
(0.0
39)
(0.0
40)
(0.0
36)
(0.0
36)
(0.0
37)
(0.0
40)
(0.0
37)
L.C
yclic
ally
-adj
uste
dco
rpor
ate
bala
nce
(%of
GD
P)0.
385*
**-
0.18
5***
-0.
143*
**-
--
0.12
9***
-(0
.089
)(0
.043
)(0
.040
)(0
.039
)L
.Cor
pora
tesa
ving
(%of
GD
P)-
0.49
6***
-0.
161*
**-
0.11
0**
-0.
168*
**-
0.18
4***
(0.0
91)
(0.0
57)
(0.0
51)
(0.0
49)
(0.0
48)
L.C
orpo
rate
inve
stm
ent(
%of
GD
P)-
-0.3
00**
*-
-0.2
88**
*-
--0
.133
**-0
.190
***
--0
.070
(0.1
05)
(0.0
59)
(0.0
55)
(0.0
56)
(0.0
51)
Net
FDIfl
ows
(%of
GD
P)-
--
--
--
-0.
167*
*0.
163*
*(0
.068
)(0
.069
)
Obs
erva
tions
704
704
706
706
648
648
648
648
706
706
Cou
ntri
es25
2525
2523
2323
2325
25R
-squ
ared
0.62
10.
632
0.77
10.
782
0.63
90.
619
0.56
70.
628
0.68
60.
684
RM
SE0.
029
0.02
90.
023
0.02
20.
028
0.02
90.
031
0.02
90.
027
0.02
7
Not
e:C
Ais
the
curr
enta
ccou
ntba
lanc
ein
%of
GD
P.A
llre
gres
sion
sar
ees
timat
edby
pool
edG
LSw
itha
pane
l-w
ide
AR
(1)c
orre
ctio
n.H
eter
oske
dast
icity
robu
stst
anda
rder
rors
are
repo
rted
inpa
rent
hese
s.In
Mod
els
(1)a
nd(2
),th
ecy
clic
ally
-adj
uste
dfis
calb
alan
cean
dth
eco
rpor
ate
sect
orva
riab
les
are
inst
rum
ente
d.Th
eM
odel
s(3
)and
(4)i
nclu
deco
untr
yfix
edeff
ects
.All
estim
atio
nsin
clud
ea
cons
tant
term
.L.d
enot
eson
eye
arla
g.*,
**,a
nd**
*de
note
ssi
gnifi
canc
eat
10%
,5%
,and
1%le
vels
,res
pect
ivel
y.Se
eA
ppen
dix
Afo
ra
deta
iled
desc
ript
ion
ofth
eda
ta.
41
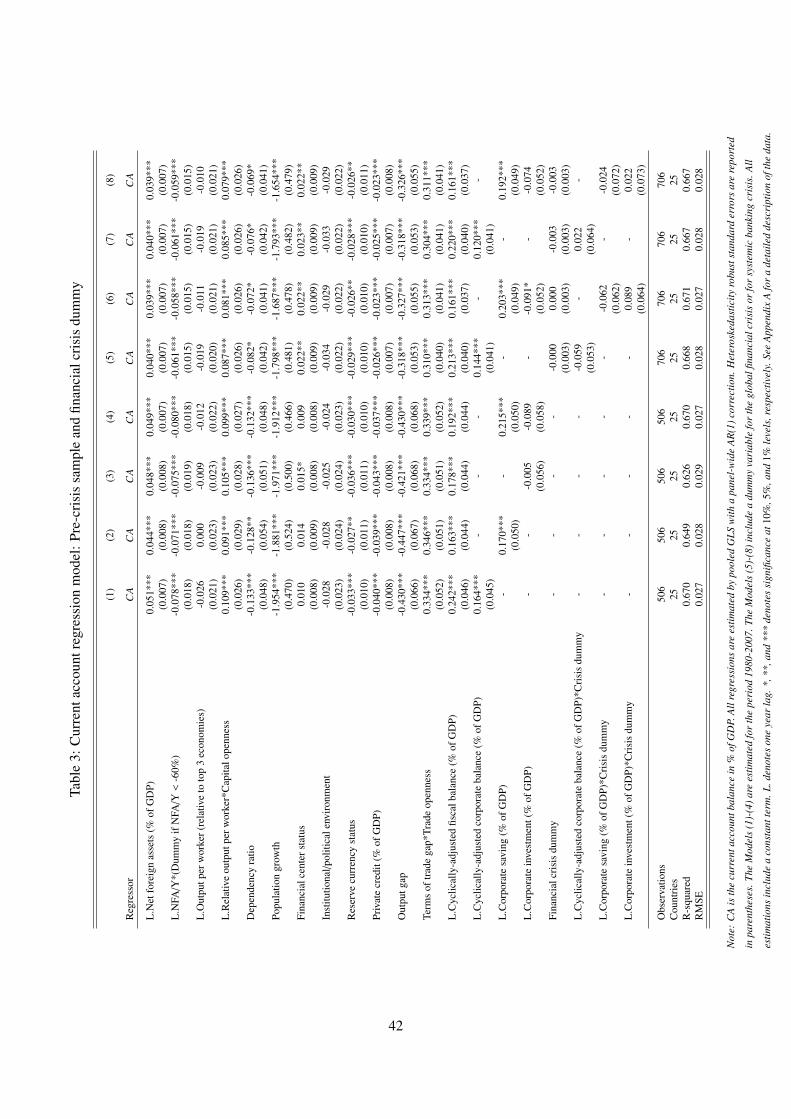
Tabl
e3:
Cur
rent
acco
untr
egre
ssio
nm
odel
:Pre
-cri
sis
sam
ple
and
finan
cial
cris
isdu
mm
y
(1)
(2)
(3)
(4)
(5)
(6)
(7)
(8)
Reg
ress
orC
AC
AC
AC
AC
AC
AC
AC
A
L.N
etfo
reig
nas
sets
(%of
GD
P)0.
051*
**0.
044*
**0.
048*
**0.
049*
**0.
040*
**0.
039*
**0.
040*
**0.
039*
**(0
.007
)(0
.008
)(0
.008
)(0
.007
)(0
.007
)(0
.007
)(0
.007
)(0
.007
)L
.NFA
/Y*(
Dum
my
ifN
FA/Y
<-6
0%)
-0.0
78**
*-0
.071
***
-0.0
75**
*-0
.080
***
-0.0
61**
*-0
.058
***
-0.0
61**
*-0
.059
***
(0.0
18)
(0.0
18)
(0.0
19)
(0.0
18)
(0.0
15)
(0.0
15)
(0.0
15)
(0.0
15)
L.O
utpu
tper
wor
ker(
rela
tive
toto
p3
econ
omie
s)-0
.026
0.00
0-0
.009
-0.0
12-0
.019
-0.0
11-0
.019
-0.0
10(0
.021
)(0
.023
)(0
.023
)(0
.022
)(0
.020
)(0
.021
)(0
.021
)(0
.021
)L
.Rel
ativ
eou
tput
perw
orke
r*C
apita
lope
nnes
s0.
109*
**0.
091*
**0.
105*
**0.
099*
**0.
087*
**0.
081*
**0.
085*
**0.
079*
**(0
.026
)(0
.029
)(0
.028
)(0
.027
)(0
.026
)(0
.026
)(0
.026
)(0
.026
)D
epen
denc
yra
tio-0
.133
***
-0.1
28**
-0.1
36**
*-0
.132
***
-0.0
82*
-0.0
72*
-0.0
76*
-0.0
69*
(0.0
48)
(0.0
54)
(0.0
51)
(0.0
48)
(0.0
42)
(0.0
41)
(0.0
42)
(0.0
41)
Popu
latio
ngr
owth
-1.9
54**
*-1
.881
***
-1.9
71**
*-1
.912
***
-1.7
98**
*-1
.687
***
-1.7
93**
*-1
.654
***
(0.4
70)
(0.5
24)
(0.5
00)
(0.4
66)
(0.4
81)
(0.4
78)
(0.4
82)
(0.4
79)
Fina
ncia
lcen
ters
tatu
s0.
010
0.01
40.
015*
0.00
90.
022*
*0.
022*
*0.
023*
*0.
022*
*(0
.008
)(0
.009
)(0
.008
)(0
.008
)(0
.009
)(0
.009
)(0
.009
)(0
.009
)In
stitu
tiona
l/pol
itica
lenv
iron
men
t-0
.028
-0.0
28-0
.025
-0.0
24-0
.034
-0.0
29-0
.033
-0.0
29(0
.023
)(0
.024
)(0
.024
)(0
.023
)(0
.022
)(0
.022
)(0
.022
)(0
.022
)R
eser
vecu
rren
cyst
atus
-0.0
33**
*-0
.027
**-0
.036
***
-0.0
30**
*-0
.029
***
-0.0
26**
-0.0
28**
*-0
.026
**(0
.010
)(0
.011
)(0
.011
)(0
.010
)(0
.010
)(0
.010
)(0
.010
)(0
.011
)Pr
ivat
ecr
edit
(%of
GD
P)-0
.040
***
-0.0
39**
*-0
.043
***
-0.0
37**
*-0
.026
***
-0.0
23**
*-0
.025
***
-0.0
23**
*(0
.008
)(0
.008
)(0
.008
)(0
.008
)(0
.007
)(0
.007
)(0
.007
)(0
.008
)O
utpu
tgap
-0.4
30**
*-0
.447
***
-0.4
21**
*-0
.430
***
-0.3
18**
*-0
.327
***
-0.3
18**
*-0
.326
***
(0.0
66)
(0.0
67)
(0.0
68)
(0.0
68)
(0.0
53)
(0.0
55)
(0.0
53)
(0.0
55)
Term
sof
trad
ega
p*Tr
ade
open
ness
0.33
4***
0.34
6***
0.33
4***
0.33
9***
0.31
0***
0.31
3***
0.30
4***
0.31
1***
(0.0
52)
(0.0
51)
(0.0
51)
(0.0
52)
(0.0
40)
(0.0
41)
(0.0
41)
(0.0
41)
L.C
yclic
ally
-adj
uste
dfis
calb
alan
ce(%
ofG
DP)
0.24
2***
0.16
3***
0.17
8***
0.19
2***
0.21
3***
0.16
1***
0.22
0***
0.16
1***
(0.0
46)
(0.0
44)
(0.0
44)
(0.0
44)
(0.0
40)
(0.0
37)
(0.0
40)
(0.0
37)
L.C
yclic
ally
-adj
uste
dco
rpor
ate
bala
nce
(%of
GD
P)0.
164*
**-
--
0.14
4***
-0.
120*
**-
(0.0
45)
(0.0
41)
(0.0
41)
L.C
orpo
rate
savi
ng(%
ofG
DP)
-0.
170*
**-
0.21
5***
-0.
203*
**-
0.19
2***
(0.0
50)
(0.0
50)
(0.0
49)
(0.0
49)
L.C
orpo
rate
inve
stm
ent(
%of
GD
P)-
--0
.005
-0.0
89-
-0.0
91*
--0
.074
(0.0
56)
(0.0
58)
(0.0
52)
(0.0
52)
Fina
ncia
lcri
sis
dum
my
--
--
-0.0
000.
000
-0.0
03-0
.003
(0.0
03)
(0.0
03)
(0.0
03)
(0.0
03)
L.C
yclic
ally
-adj
uste
dco
rpor
ate
bala
nce
(%of
GD
P)*C
risi
sdu
mm
y-
--
--0
.059
-0.
022
-(0
.053
)(0
.064
)L
.Cor
pora
tesa
ving
(%of
GD
P)*C
risi
sdu
mm
y-
--
--
-0.0
62-
-0.0
24(0
.062
)(0
.072
)L
.Cor
pora
tein
vest
men
t(%
ofG
DP)
*Cri
sis
dum
my
--
--
-0.
089
-0.
022
(0.0
64)
(0.0
73)
Obs
erva
tions
506
506
506
506
706
706
706
706
Cou
ntri
es25
2525
2525
2525
25R
-squ
ared
0.67
00.
649
0.62
60.
670
0.66
80.
671
0.66
70.
667
RM
SE0.
027
0.02
80.
029
0.02
70.
028
0.02
70.
028
0.02
8
Not
e:C
Ais
the
curr
enta
ccou
ntba
lanc
ein
%of
GD
P.A
llre
gres
sion
sar
ees
timat
edby
pool
edG
LSw
itha
pane
l-w
ide
AR
(1)c
orre
ctio
n.H
eter
oske
dast
icity
robu
stst
anda
rder
rors
are
repo
rted
inpa
rent
hese
s.Th
eM
odel
s(1
)-(4
)are
estim
ated
for
the
peri
od19
80-2
007.
The
Mod
els
(5)-
(8)i
nclu
dea
dum
my
vari
able
for
the
glob
alfin
anci
alcr
isis
orfo
rsy
stem
icba
nkin
gcr
isis
.All
estim
atio
nsin
clud
ea
cons
tant
term
.L.d
enot
eson
eye
arla
g.*,
**,a
nd**
*de
note
ssi
gnifi
canc
eat
10%
,5%
,and
1%le
vels
,res
pect
ivel
y.Se
eA
ppen
dix
Afo
ra
deta
iled
desc
ript
ion
ofth
eda
ta.
42
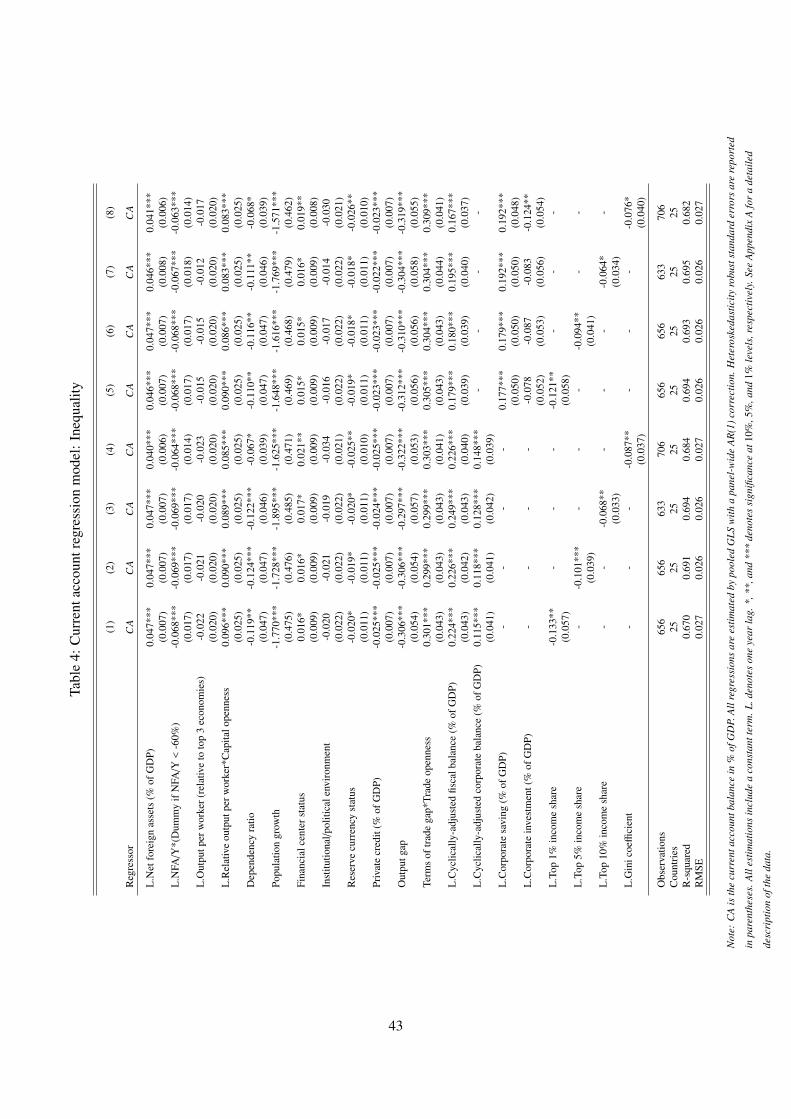
Tabl
e4:
Cur
rent
acco
untr
egre
ssio
nm
odel
:Ine
qual
ity
(1)
(2)
(3)
(4)
(5)
(6)
(7)
(8)
Reg
ress
orC
AC
AC
AC
AC
AC
AC
AC
A
L.N
etfo
reig
nas
sets
(%of
GD
P)0.
047*
**0.
047*
**0.
047*
**0.
040*
**0.
046*
**0.
047*
**0.
046*
**0.
041*
**(0
.007
)(0
.007
)(0
.007
)(0
.006
)(0
.007
)(0
.007
)(0
.008
)(0
.006
)L
.NFA
/Y*(
Dum
my
ifN
FA/Y
<-6
0%)
-0.0
68**
*-0
.069
***
-0.0
69**
*-0
.064
***
-0.0
68**
*-0
.068
***
-0.0
67**
*-0
.063
***
(0.0
17)
(0.0
17)
(0.0
17)
(0.0
14)
(0.0
17)
(0.0
17)
(0.0
18)
(0.0
14)
L.O
utpu
tper
wor
ker(
rela
tive
toto
p3
econ
omie
s)-0
.022
-0.0
21-0
.020
-0.0
23-0
.015
-0.0
15-0
.012
-0.0
17(0
.020
)(0
.020
)(0
.020
)(0
.020
)(0
.020
)(0
.020
)(0
.020
)(0
.020
)L
.Rel
ativ
eou
tput
perw
orke
r*C
apita
lope
nnes
s0.
096*
**0.
090*
**0.
089*
**0.
085*
**0.
090*
**0.
086*
**0.
083*
**0.
083*
**(0
.025
)(0
.025
)(0
.025
)(0
.025
)(0
.025
)(0
.025
)(0
.025
)(0
.025
)D
epen
denc
yra
tio-0
.119
**-0
.124
***
-0.1
22**
*-0
.067
*-0
.110
**-0
.116
**-0
.111
**-0
.068
*(0
.047
)(0
.047
)(0
.046
)(0
.039
)(0
.047
)(0
.047
)(0
.046
)(0
.039
)Po
pula
tion
grow
th-1
.770
***
-1.7
28**
*-1
.895
***
-1.6
25**
*-1
.648
***
-1.6
16**
*-1
.769
***
-1.5
71**
*(0
.475
)(0
.476
)(0
.485
)(0
.471
)(0
.469
)(0
.468
)(0
.479
)(0
.462
)Fi
nanc
ialc
ente
rsta
tus
0.01
6*0.
016*
0.01
7*0.
021*
*0.
015*
0.01
5*0.
016*
0.01
9**
(0.0
09)
(0.0
09)
(0.0
09)
(0.0
09)
(0.0
09)
(0.0
09)
(0.0
09)
(0.0
08)
Inst
itutio
nal/p
oliti
cale
nvir
onm
ent
-0.0
20-0
.021
-0.0
19-0
.034
-0.0
16-0
.017
-0.0
14-0
.030
(0.0
22)
(0.0
22)
(0.0
22)
(0.0
21)
(0.0
22)
(0.0
22)
(0.0
22)
(0.0
21)
Res
erve
curr
ency
stat
us-0
.020
*-0
.019
*-0
.020
*-0
.025
**-0
.019
*-0
.018
*-0
.018
*-0
.026
**(0
.011
)(0
.011
)(0
.011
)(0
.010
)(0
.011
)(0
.011
)(0
.011
)(0
.010
)Pr
ivat
ecr
edit
(%of
GD
P)-0
.025
***
-0.0
25**
*-0
.024
***
-0.0
25**
*-0
.023
***
-0.0
23**
*-0
.022
***
-0.0
23**
*(0
.007
)(0
.007
)(0
.007
)(0
.007
)(0
.007
)(0
.007
)(0
.007
)(0
.007
)O
utpu
tgap
-0.3
06**
*-0
.306
***
-0.2
97**
*-0
.322
***
-0.3
12**
*-0
.310
***
-0.3
04**
*-0
.319
***
(0.0
54)
(0.0
54)
(0.0
57)
(0.0
53)
(0.0
56)
(0.0
56)
(0.0
58)
(0.0
55)
Term
sof
trad
ega
p*Tr
ade
open
ness
0.30
1***
0.29
9***
0.29
9***
0.30
3***
0.30
5***
0.30
4***
0.30
4***
0.30
9***
(0.0
43)
(0.0
43)
(0.0
43)
(0.0
41)
(0.0
43)
(0.0
43)
(0.0
44)
(0.0
41)
L.C
yclic
ally
-adj
uste
dfis
calb
alan
ce(%
ofG
DP)
0.22
4***
0.22
6***
0.24
9***
0.22
6***
0.17
9***
0.18
0***
0.19
5***
0.16
7***
(0.0
43)
(0.0
42)
(0.0
43)
(0.0
40)
(0.0
39)
(0.0
39)
(0.0
40)
(0.0
37)
L.C
yclic
ally
-adj
uste
dco
rpor
ate
bala
nce
(%of
GD
P)0.
115*
**0.
118*
**0.
128*
**0.
148*
**-
--
-(0
.041
)(0
.041
)(0
.042
)(0
.039
)L
.Cor
pora
tesa
ving
(%of
GD
P)-
--
-0.
177*
**0.
179*
**0.
192*
**0.
192*
**(0
.050
)(0
.050
)(0
.050
)(0
.048
)L
.Cor
pora
tein
vest
men
t(%
ofG
DP)
--
--
-0.0
78-0
.087
-0.0
83-0
.124
**(0
.052
)(0
.053
)(0
.056
)(0
.054
)L
.Top
1%in
com
esh
are
-0.1
33**
--
--0
.121
**-
--
(0.0
57)
(0.0
58)
L.T
op5%
inco
me
shar
e-
-0.1
01**
*-
--
-0.0
94**
--
(0.0
39)
(0.0
41)
L.T
op10
%in
com
esh
are
--
-0.0
68**
--
--0
.064
*-
(0.0
33)
(0.0
34)
L.G
inic
oeffi
cien
t-
--
-0.0
87**
--
--0
.076
*(0
.037
)(0
.040
)
Obs
erva
tions
656
656
633
706
656
656
633
706
Cou
ntri
es25
2525
2525
2525
25R
-squ
ared
0.67
00.
691
0.69
40.
684
0.69
40.
693
0.69
50.
682
RM
SE0.
027
0.02
60.
026
0.02
70.
026
0.02
60.
026
0.02
7
Not
e:C
Ais
the
curr
enta
ccou
ntba
lanc
ein
%of
GD
P.A
llre
gres
sion
sar
ees
timat
edby
pool
edG
LSw
itha
pane
l-w
ide
AR
(1)c
orre
ctio
n.H
eter
oske
dast
icity
robu
stst
anda
rder
rors
are
repo
rted
inpa
rent
hese
s.A
lles
timat
ions
incl
ude
aco
nsta
ntte
rm.L
.den
otes
one
year
lag.
*,**
,and
***
deno
tes
sign
ifica
nce
at10
%,5
%,a
nd1%
leve
ls,r
espe
ctiv
ely.
See
App
endi
xA
for
ade
taile
d
desc
ript
ion
ofth
eda
ta.
43


uni-due.de/soziooekonomie/wp
Institute for Socio-EconomicsUniversity of Duisburg-Essen
Lotharstr. 65 47057 DuisburgGermany
uni-due.de/[email protected]
ifso working paperifso working papers are preliminary scholarly papers emerging from research at and around the Institute for Socio-Economics at the University of Duisburg-Essen.
All ifso working papers at uni-due.de/soziooekonomie/wp
ISSN 2699-7207
This work is licensed under a Creative Commons Attribution 4.0 International License