tibu-published article10.11648.j.jfa.20160404.13
9
Journal of Finance and Accounting 2016; 4(4): 179-187 http://www.sciencepublishinggroup.com/j/jfa doi: 10.11648/j.jfa.20160404.13 ISSN: 2330-7331 (Print); ISSN: 2330-7323 (Online) Case Report Debating the ‘Evolution of Accounting Equation’: A Cross-Case Analysis Approach Tibuhinda Ngonzi Department of Accountancy & Finance, St. Augustine University of Tanzania, Mwanza, Tanzania Email address: [email protected] To cite this article: Tibuhinda Ngonzi. Debating the ‘Evolution of Accounting Equation’: A Cross-Case Analysis Approach. Journal of Finance and Accounting. Vol. 4, No. 4, 2016, pp. 179-187. doi: 10.11648/j.jfa.20160404.13 Received: May 20, 2016; Accepted: May 30, 2016; Published: June 13, 2016 Abstract: This paper is an interrogation of the applicability of the recently introduced ‘new form of accounting equation’ and a ‘dynamic approach to accounting for capital structure’ (JFA 2013: 1(44) 55-63). It explicates the issues related to the methodological foundations at the base of the model specification and the estimated parameters. It goes on to conduct a cross-case analysis methodological approach to the same set of empirical data as a triangulation process. The outcomes confirm that the provided empirical evidence is not sufficient to demonstrate the pegging of the rate of change of equity and liabilities with respect to the change of assets to 36% and 64% values respectively. Rather this paper’s findings indicate that in the long term companies have used retained earnings and reserves to expel debt as a strategy to keep their debt levels low, except for firms with accumulated losses or excessive deficit. This paper also finds that firms have maintained certain debt levels but not maintained the logic suggested by the pay-off theory, and that the perking order was demonstrated through long-term adjustment process. This paper concludes that the new form of accounting equation is not pragmatically viable. The paper proceeds to make a contribution by developing a predictive dynamic model for capital structure based on lagged variables. Keywords: Accounting Equation, Cross-Case Analysis, Dynamic Model, Lagged Variables 1. Introduction For accounting purposes assets should equate to the sum of financing resources viz. capital and liabilities. That is, A=C+L as a truism, an identity. While it is true that the accounting equation shows the ‘equality’ between assets of a company and their financing, the accounting equation is a special function type, with only one degree of freedom. In this function, each variable on the RHS has a one-to-one (1:1) effect on the LHS. That is, a unit increase in the RHS array of variables will lead to the same unit increase in the LHS. That means, the coefficients of the variables on the RHS will always be unitary. This is explained by the fact that the equation is an expression of the recording of transactions evolving into balance sheet accounts [13]. It is a statement of the state of affairs as at a particular point in time. The undergoing presentation demonstrates the immediate problem of the ‘new form of accounting equation’ suggested in the Journal of Finance and Accounting (JFA 2013: 1(44)), which includes the error term for intangible resources. Given the importance of the practical implication of the accounting equation to accounting and financial reporting processes, this paper tasks itself to interrogating the applicability of the new proposed equation. It then proceeds to make a contribution by rigorously proposing a predictive model for capital structure decisions. There are two objectives to this: (1) to empirically test the validity of the regression generated parameters of the new form of accounting equation using a different methodological approach; and (2) to empirically test for the elements of pecking order and pay-off theories in corporate financing practices. The rest of the paper proceeds as follows. Section 1.1 revisits the ‘new form of accounting equation’ to unveil the pertinent issues presented in Sub-Sections 1.1.1 to 4. Section 1.2 presents a methodological alternative to aggregations: cross-case analysis, followed by its description and approach to data treatment in Section 2. Section 3 is the findings and
-
Upload
tibu-ngozi -
Category
Documents
-
view
24 -
download
0
Transcript of tibu-published article10.11648.j.jfa.20160404.13
Journal of Finance and Accounting 2016; 4(4): 179-187 http://www.sciencepublishinggroup.com/j/jfa doi: 10.11648/j.jfa.20160404.13 ISSN: 2330-7331 (Print); ISSN: 2330-7323 (Online)
Case Report
Debating the ‘Evolution of Accounting Equation’: A Cross-Case Analysis Approach
Tibuhinda Ngonzi
Department of Accountancy & Finance, St. Augustine University of Tanzania, Mwanza, Tanzania
Email address: [email protected]
To cite this article: Tibuhinda Ngonzi. Debating the ‘Evolution of Accounting Equation’: A Cross-Case Analysis Approach. Journal of Finance and Accounting.
Vol. 4, No. 4, 2016, pp. 179-187. doi: 10.11648/j.jfa.20160404.13
Received: May 20, 2016; Accepted: May 30, 2016; Published: June 13, 2016
Abstract: This paper is an interrogation of the applicability of the recently introduced ‘new form of accounting equation’ and
a ‘dynamic approach to accounting for capital structure’ (JFA 2013: 1(44) 55-63). It explicates the issues related to the
methodological foundations at the base of the model specification and the estimated parameters. It goes on to conduct a
cross-case analysis methodological approach to the same set of empirical data as a triangulation process. The outcomes confirm
that the provided empirical evidence is not sufficient to demonstrate the pegging of the rate of change of equity and liabilities
with respect to the change of assets to 36% and 64% values respectively. Rather this paper’s findings indicate that in the long
term companies have used retained earnings and reserves to expel debt as a strategy to keep their debt levels low, except for firms
with accumulated losses or excessive deficit. This paper also finds that firms have maintained certain debt levels but not
maintained the logic suggested by the pay-off theory, and that the perking order was demonstrated through long-term adjustment
process. This paper concludes that the new form of accounting equation is not pragmatically viable. The paper proceeds to make
a contribution by developing a predictive dynamic model for capital structure based on lagged variables.
Keywords: Accounting Equation, Cross-Case Analysis, Dynamic Model, Lagged Variables
1. Introduction
For accounting purposes assets should equate to the sum
of financing resources viz. capital and liabilities. That is,
A=C+L as a truism, an identity.
While it is true that the accounting equation shows the
‘equality’ between assets of a company and their financing,
the accounting equation is a special function type, with only
one degree of freedom. In this function, each variable on the
RHS has a one-to-one (1:1) effect on the LHS. That is, a
unit increase in the RHS array of variables will lead to the
same unit increase in the LHS. That means, the coefficients
of the variables on the RHS will always be unitary. This is
explained by the fact that the equation is an expression of
the recording of transactions evolving into balance sheet
accounts [13]. It is a statement of the state of affairs as at a
particular point in time.
The undergoing presentation demonstrates the immediate
problem of the ‘new form of accounting equation’ suggested
in the Journal of Finance and Accounting (JFA 2013: 1(44)),
which includes the error term for intangible resources. Given
the importance of the practical implication of the accounting
equation to accounting and financial reporting processes, this
paper tasks itself to interrogating the applicability of the new
proposed equation. It then proceeds to make a contribution
by rigorously proposing a predictive model for capital
structure decisions. There are two objectives to this: (1) to
empirically test the validity of the regression generated
parameters of the new form of accounting equation using a
different methodological approach; and (2) to empirically
test for the elements of pecking order and pay-off theories in
corporate financing practices.
The rest of the paper proceeds as follows. Section 1.1
revisits the ‘new form of accounting equation’ to unveil the
pertinent issues presented in Sub-Sections 1.1.1 to 4. Section
1.2 presents a methodological alternative to aggregations:
cross-case analysis, followed by its description and approach
to data treatment in Section 2. Section 3 is the findings and

180 Tibuhinda Ngonzi: Debating the ‘Evolution of Accounting Equation’: A Cross-Case Analysis Approach
discussion, while Sections 3.1 and 3.2 is a proposed approach
to dynamic modelling. Section 4 concludes the study, pointing
out the limitations to the study and the directions for future
research.
1.1. The ‘New Form of Accounting Equation’ Re-visited
The paper ‘Evolution of accounting equation: Evidence of
Companies quoted on Dar es Salaam stock exchange’ makes
efforts to re-define the standard accounting equation A= C +
L to a function of the form A = β0+ β1L + β2C+ε (here in
after referred to as ‘the new equation’), which the paper
expresses as the “new accounting equation [12]”. In the new
equation, β0 is a constant term, β1 is the rate of change of
assets per unit change in liabilities and β2 is the rate of
change of assets per unit change in capital (or equity). The
explanation given to the error term is that it takes care of the
“many business activities, for example, type of business, type
of assets, loan and capital location and human capital [12]”.
The attached significance of the error term is that “even when
‘C’ and ‘L’ are zero (before obtaining capital or loan) an
entrepreneur may be having an idea, place to do business,
skills and even how to get funds [12]”.
The positing means, according to the author, the standard
accounting equation leaves out such important components
of assets.
In the discussion, the paper describes the results of the
regression analysis of 15 companies data listed on the Dar
es Salaam Stock Exchange (DSE) for the period 2005 to
2008 as conclusively providing an answer to the question
involving the ‘acceptable proportions of equity and debt’ as
36% and 64% respectively. The test results also indicate
that the specified model is also estimated as
A=4408+1.1L+0.147C
By implication, the y-intercept value may change, but the
L and C coefficients estimates indicate that, as a norm,
assets change at the rate of 1.1 units for each unit change in
liability and at 0.147 for every unit change in owners’
equity to prove the dominance of the tradeoff theory that
companies have a target debt ratio to which they tend to
adjust to over time. In the end, the paper concludes that the
“accounting equation changes over time from its traditional
form to the new form where it is no longer A=C+L but A =
β0+ β1L + β2C+ε, [12, p. 58].
1.1.1. The Issues
The effort towards an attempt to express the relative rate
of change of the proportions of C and L in the Assets
composition in the long term is commended. Using the DSE
listed companies’ data, the author of the new accounting
equation finds that the proportion of liabilities changes at
the rate of 64%, while the proportion of owners’ equity
changes at the rate of 36%. However, three fundamental
problems are raised in this paper: 1) the likely distortions in
the statement of assets due to the induction of the ‘error
term’ in the standard accounting equation; 2) the
applicability of the new accounting equation in practice;
and 3) the implication of the pegged values of the liabilities
and equity in the capital structure.
1.1.2. Problem One
The first observed problem with the new accounting
equation is the claim attached to the error term. This claim
forgets that the standard accounting equation is an identity
in the first place, and that the proper accounting practices
have to capitalize relevant components of assets where it is
applicable. Internationally accepted reporting standards
such as the IFRS may not reasonably accommodate
behavioural factors in the reporting for assets or the capital
structure.
1.1.3. Problem Two
The second observed problem with the new accounting
equation is in its generalizability and applicability. This
emanates from the structure of the equation. The specified
equation does not amount to a practical equation to be used
for accounting purposes, or as a substitute to the standard
accounting equation as the paper claims. The proposition is
misleading in general, for the inclusion of an error term
distorts the standard equation from its principal identity
function. In its new form, the RHS is not necessarily equal
to the LHS, generating an inequality of the form A ≥ C+L.
By implication, there is a portion of assets which cannot be
certainly accounted for.
1.1.4. Problem Three
The third problem is an issue for proof. There are
empirically supported indications that determinants of
capital structure influence the companies’ level of debt
differently. For instance, profitable firms have been
confirmed to have relatively less debt in relation to their
equity market value [10], [16], [17]. Young firms have been
empirically observed to be more leveraged than old ones
(Wapper et al., 2002 & Joe veer, 2006 cited in [12]).
Corporate performance has a bearing in the determination
of capital structure (Chen, 2004). Firms’ leverage is
significantly influenced by a range of firm specific factors
[1], [4], [6]. And that the tradeoff, pecking order are
conditional theories of capital structure cash flow theories
simply emphasize certain costs and benefits at times and may
not be mutually exclusive [10]. With the undergoing
argument in mind, the deliverables of aggregate data in
regression analysis are highly likely to lead to misleading
conclusions.
1.2. An Alternative to Aggregations: Cross-Case Analysis
Approach
The composite of the three problems above forms the
agenda for the study reported in this paper. A multiple case
study methodological approach is used to test for the
validity of the new accounting equation. Data analysis is
implemented on the DSE listed companies’ data
individually to allow for observations of un-distorted
patterns of capital structure and incremental assets
financing behaviour before generalizations are made on the
basis of the patterns rather than aggregate data. This

Journal of Finance and Accounting 2016; 4(4): 179-187 181
approach facilitates the continuous comparison of data and
underlying theories, specifically the evidences for the
trade-off and the pecking order theories. The advantage of
this approach is that typological patterns are allowed to
emerge from evidence with only moderate manipulations of
data [2], [5], [18]. Observations are made on the patterns of
leverage and financing choices for additional asset
requirements for established companies.
2. Methodology
This study exploits the content of empirical reality with
minimal mathematical manipulations. This approach is
chosen as a way to reduce the effect of evidence distortion
where care is not enough to maintain the reality context.
Interpretive research procedures are implemented by clearly
documenting the data analysis processes and the extracted
observations. In terms of methodology, it should be noted
that interpretive research does not work on predefined
dependent or independent variables [15].
A multiple case study approach is used, where a cross-case
analysis is conducted on the behaviour of debt ratio and the
equity and debt variables changes with respect to changes in
net assets. There are two approaches to cross-case analysis
viz. case oriented and variable oriented analysis [8]. Case
centred analysis seeks to explain the differentiating factors
of cases, while variable centred analysis seeks to discover the
features in which cases look alike. The aggregation of
variables across cases is avoided. There is a problem with
working with aggregates for matters needing to expose the
agency of decision making at the firm-level. While the
decision making behaviour is discretely important,
aggregations do not have capacity to expose the pertinent
factors in collectivity.
In the analysis, we test for the dominantly prevalent debt
levels for the aim of unveiling the presence or absence of the
tendency to appropriate the tax advantage of debt by firms.
This is observed via firm-level debt ratios.
The second test involves unveiling the patterns in the
dominant options for financing additional investments. This
is tested by looking at the change in the net assets and the
respective weightage of additional equity and additional
leverage in the financing of additional assets. The results are
expected to reveal the evidences for the support or refutation
of the dominance of any of the trade-off and pecking order
theories in the choice for capital structure in corporate
finance research.
2.1. Data
The data used were extracted from the DSE listed
companies’ published annual financial reports. Commercial
banks and Insurance companies were not included in the
analysis because their treatment of interest earned and
payable, contributions etc. in financial reporting is
incomparable to non-financial firms. This leaving us with a
total of twelve other companies as indicated in Table 1.
Table 1. Cases included in the analysis.
Company Industry Affiliation
Swissport Tanzania Ltd. (SWISS), Kenya Airways, Precession Air (3) Airports handling of passengers and cargo.
TOL Gases Ltd. (TOL) (1) Production and distribution of industrial gases, welding equipment, medical
gases, etc.
Tanzania Breweries Ltd.(TBL), East Africa Breweries (2) Manufactures, sells and distributes beer
Tatepa Company Ltd. (TATEPA) (1) Growing, processing, blending, marketing and distribution of tea and instant
ACACIA (1) Mineral Exploration and extraction
Tanga Cement, Twiga Cement (2) Production, sale and marketing of cement.
Tanzania Cigarette Co (1) Production, sale and marketing of cigarettes
Nation Media Group (NMG) (1) Media
Total (12) 8
2.2. Data Analysis and Observations
A simplified visual aided approach to data analysis was
applied. Data were tabulated from the most recent to the oldest
in the format and order they appear in the companies’ reports.
The variables for analysis were computed as follows:
Net Assets = Non-current assets + (Current Assets-Current
liabilities)
Equity = Ʃ (Paid-up capital, retained earnings, reserves,
proposed dividends)
∆V = (Vt – Vt-1) that is,
The change in the corresponding variable, being the year’s
value (Vt) less its preceding year’s value (Vt-1)
Debt ratio = Long term debt/ Net assets
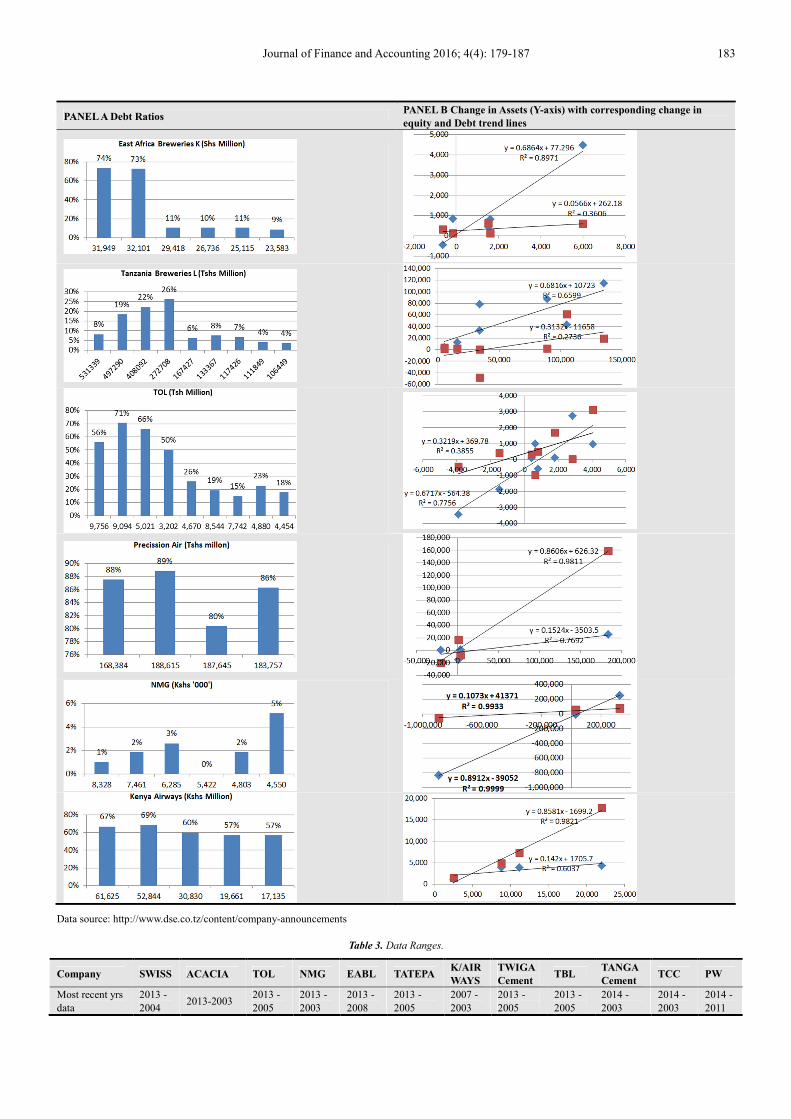
Panel ‘A’ in Table 2 is a display of the debt ratio histograms
labelled in percentages of the corresponding net assets as base.
The net assets are labelled on the x-axis.
Panel ‘B’ is a display of the change in equity (diamond data
points) and change in debt (square data points) trends versus
change in assets on the y-axis.
Table 3 is a supplement to Table 2 Panel A. It shows the data
coverage range in years. For instance, the data available and
used for the firm SWISS is for the years 2013 to 2004 and so
on. The number of years included is as per case published
reports. Each firm is a case.
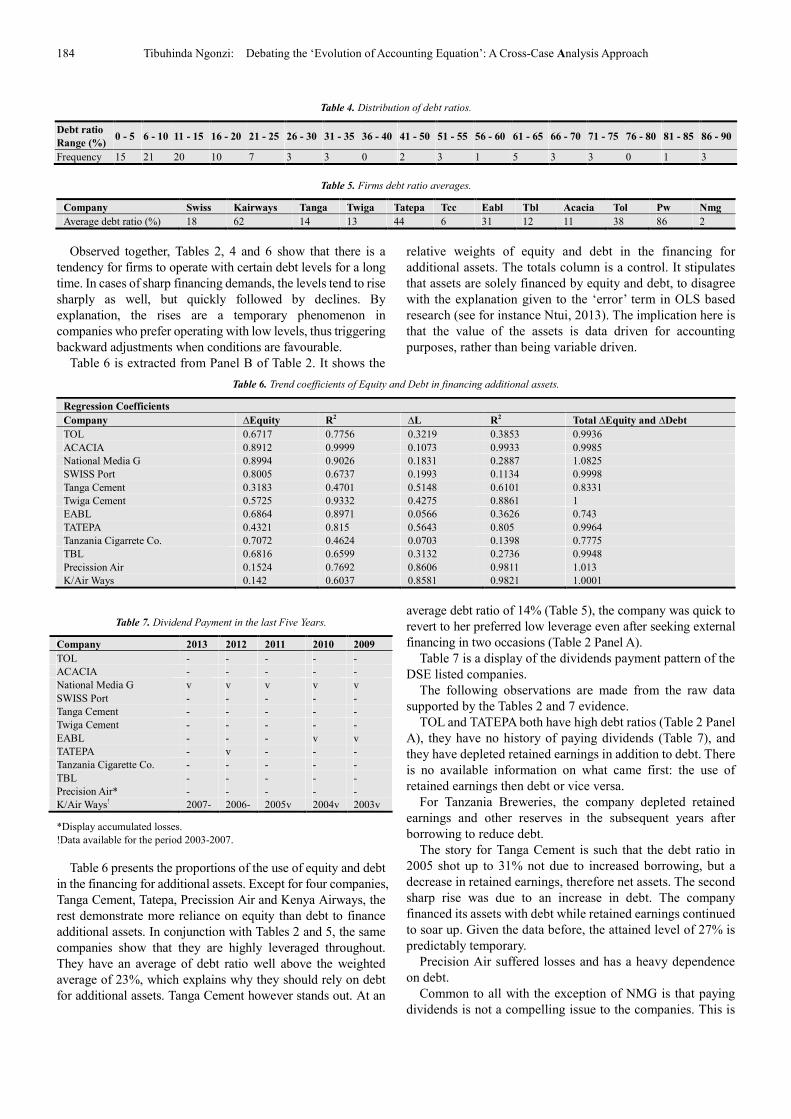
Table 4 is the distribution of debt ratios in ranges of 5%

182 Tibuhinda Ngonzi: Debating the ‘Evolution of Accounting Equation’: A Cross-Case Analysis Approach
interval. This intends to show the persistent proportions of
debt in asset financing. It can be seen in this table that, 66 of
99 observations (67%) are in the 0-20% debt ratio range, while
76 (77%) of all observations have 30% or less debt ratio.
Table 5 presents the firm debt ratio averages, where 7 of the
12 firms (58%) listed on DSE have an average debt ratio
below 20%. Only four (33%) firms have their averages above
35%.
Table. 2. Distribution of Debt Ratios.
PANEL A Debt Ratios PANEL B Change in Assets (Y-axis) with corresponding change in
equity and Debt trend lines
Journal of Finance and Accounting 2016; 4(4): 179-187 183
PANEL A Debt Ratios PANEL B Change in Assets (Y-axis) with corresponding change in
equity and Debt trend lines
Data source: http://www.dse.co.tz/content/company-announcements
Table 3. Data Ranges.
Company SWISS ACACIA TOL NMG EABL TATEPA K/AIR
WAYS
TWIGA
Cement TBL
TANGA
Cement TCC PW
Most recent yrs
data
2013 -
2004 2013-2003
2013 -
2005
2013 -
2003
2013 -
2008
2013 -
2005
2007 -
2003
2013 -
2005
2013 -
2005
2014 -
2003
2014 -
2003
2014 -
2011
184 Tibuhinda Ngonzi: Debating the ‘Evolution of Accounting Equation’: A Cross-Case Analysis Approach
Table 4. Distribution of debt ratios.
Debt ratio
Range (%) 0 - 5 6 - 10 11 - 15 16 - 20 21 - 25 26 - 30 31 - 35 36 - 40 41 - 50 51 - 55 56 - 60 61 - 65 66 - 70 71 - 75 76 - 80 81 - 85 86 - 90
Frequency 15 21 20 10 7 3 3 0 2 3 1 5 3 3 0 1 3
Table 5. Firms debt ratio averages.
Company Swiss Kairways Tanga Twiga Tatepa Tcc Eabl Tbl Acacia Tol Pw Nmg
Average debt ratio (%) 18 62 14 13 44 6 31 12 11 38 86 2
Observed together, Tables 2, 4 and 6 show that there is a
tendency for firms to operate with certain debt levels for a long
time. In cases of sharp financing demands, the levels tend to rise
sharply as well, but quickly followed by declines. By
explanation, the rises are a temporary phenomenon in
companies who prefer operating with low levels, thus triggering
backward adjustments when conditions are favourable.
Table 6 is extracted from Panel B of Table 2. It shows the
relative weights of equity and debt in the financing for
additional assets. The totals column is a control. It stipulates
that assets are solely financed by equity and debt, to disagree
with the explanation given to the ‘error’ term in OLS based
research (see for instance Ntui, 2013). The implication here is
that the value of the assets is data driven for accounting
purposes, rather than being variable driven.
Table 6. Trend coefficients of Equity and Debt in financing additional assets.
Regression Coefficients
Company ∆Equity R2 ∆L R2 Total ∆Equity and ∆Debt
TOL 0.6717 0.7756 0.3219 0.3853 0.9936
ACACIA 0.8912 0.9999 0.1073 0.9933 0.9985
National Media G 0.8994 0.9026 0.1831 0.2887 1.0825
SWISS Port 0.8005 0.6737 0.1993 0.1134 0.9998
Tanga Cement 0.3183 0.4701 0.5148 0.6101 0.8331
Twiga Cement 0.5725 0.9332 0.4275 0.8861 1
EABL 0.6864 0.8971 0.0566 0.3626 0.743
TATEPA 0.4321 0.815 0.5643 0.805 0.9964
Tanzania Cigarrete Co. 0.7072 0.4624 0.0703 0.1398 0.7775
TBL 0.6816 0.6599 0.3132 0.2736 0.9948
Precission Air 0.1524 0.7692 0.8606 0.9811 1.013
K/Air Ways 0.142 0.6037 0.8581 0.9821 1.0001
Table 7. Dividend Payment in the last Five Years.
Company 2013 2012 2011 2010 2009
TOL - - - - -
ACACIA - - - - -
National Media G v v v v v
SWISS Port - - - - -
Tanga Cement - - - - -
Twiga Cement - - - - -
EABL - - - v v
TATEPA - v - - -
Tanzania Cigarette Co. - - - - -
TBL - - - - -
Precision Air* - - - - -
K/Air Ways! 2007- 2006- 2005v 2004v 2003v
*Display accumulated losses.
!Data available for the period 2003-2007.
Table 6 presents the proportions of the use of equity and debt
in the financing for additional assets. Except for four companies,
Tanga Cement, Tatepa, Precission Air and Kenya Airways, the
rest demonstrate more reliance on equity than debt to finance
additional assets. In conjunction with Tables 2 and 5, the same
companies show that they are highly leveraged throughout.
They have an average of debt ratio well above the weighted
average of 23%, which explains why they should rely on debt
for additional assets. Tanga Cement however stands out. At an
average debt ratio of 14% (Table 5), the company was quick to
revert to her preferred low leverage even after seeking external
financing in two occasions (Table 2 Panel A).
Table 7 is a display of the dividends payment pattern of the
DSE listed companies.
The following observations are made from the raw data
supported by the Tables 2 and 7 evidence.
TOL and TATEPA both have high debt ratios (Table 2 Panel
A), they have no history of paying dividends (Table 7), and
they have depleted retained earnings in addition to debt. There
is no available information on what came first: the use of
retained earnings then debt or vice versa.
For Tanzania Breweries, the company depleted retained
earnings and other reserves in the subsequent years after
borrowing to reduce debt.
The story for Tanga Cement is such that the debt ratio in
2005 shot up to 31% not due to increased borrowing, but a
decrease in retained earnings, therefore net assets. The second
sharp rise was due to an increase in debt. The company
financed its assets with debt while retained earnings continued
to soar up. Given the data before, the attained level of 27% is
predictably temporary.
Precision Air suffered losses and has a heavy dependence
on debt.
Common to all with the exception of NMG is that paying
dividends is not a compelling issue to the companies. This is

Journal of Finance and Accounting 2016; 4(4): 179-187 185
not explained from the data.
From the Companies’ statements, TATEPA and East Africa
breweries had acquired non debt means of financing which the
companies reduced before paying off debt.
3. Findings and Discussion
The findings of the study are aligned along the three main
problems identified in Sections 1.1.2 to 1.1.4. The first
problem addressed is the introduction of the error term in the
new equation. The findings from Table 6 show that a valid
model specification should lead to the balancing of the
volume of additional assets in relation to the aggregate
volume of financing sources. This is proved by the control
column where the sum of the proportions of ∆Equity and
∆Debt in the added assets is near 1.
The finding in relation to the second problem follows
immediately after the first finding that, the new accounting
equation has no practical validity, after it has been seen from
Table 6 again that the volume of assets is data driven and not
variable driven. That being the case, the coefficients of C and
L in the standard accounting equation is always 1. That is, A=
C + L prevails.
The findings pertinent to the third problem are in agreement
with empirical literature reports of other places in many
aspects. Firms listed on DSE prefer internal to external
financing. No evidence of convergence to moderate debt ratios
as reported elsewhere in empirical literature such as Myers
[10], but observed was a tendency of inertia. Firms tend to
adjust back to low debt ratios when temporarily moved away
upward. This supports the trade-off theory simplistically
observed in practice as the existence of a target low leverage
level. There is no evidence of striving to take advantage of tax
shield as the logic of the trade-off theory according to
Modigliani [11] would suggest. This keeps open the question
on what determines optimality in the target capital structures
adopted by firms. Neither has this study been able to address
that question until the other work in progress by this same
researcher, where the spirit underlying the decisions is
allowed to surface.
In relation to the pecking order theory, the findings of this
study project an interesting scenario in that, firms fulfilled
their additional assets financing needs from borrowing, then
afterward using retained earnings and other reserves to reduce
the debt to the levels they were comfortable with. The finding
here is such that retained earnings and reserves are used to
adjust for the desired equilibrium state of the debt ratio. That
means, the short term pecking order is different from the
long-term pecking order which emerges out of the adjustment
process. Where the reserves are not enough to expel the whole
lot of undesired debt, the remaining debt factor should be
thought of as the next in the perking order. It is therefore
retained earnings, then borrowing. The issue of new equity
was not observed at all. This is a non-viable option since the
respective firms have no record of paying out dividend.
In the end it is observed that the use of OLS methodology
will not work because the decision to borrow or not is not
driven by time series or growth of assets. It is an instance
dependent on the circumstances prevailing at the time, thus
data driven rather than variable driven. A modification to OLS
is suggested to yield a dynamic predictive model for asset
financing decisions, where lagged variables are considered as
further elaborated below.
3.1. The Proposed Dynamic Modelling Approach
This paper suggests for the distinction between accounting
for capital, and capital structure decision, thus proceeding to
suggest for a rigorous dynamic model that has predictive
capabilities.
To accommodate the dynamics perspectives in the capital
structure of firms, the models that deploy regression analysis
work better with lagged explanatory variables. The variables
allow for the transmission time of current states into decisions
for future capital structure. This is supposed to capture the
dynamism in the firms’ decision on capital structure as also
observed by Qian, Tian and Wirjanto [14].
For accounting purposes assets should equate to the sum of
financing resources. That is, A=C+L is an identity. What does
this tell us? Simply stated, assets will increase (decrease) by
the same measure as the aggregated increase (decrease) in
capital and liabilities. If liabilities and capital increase by $1 in
aggregate, assets will also increase by $1 and so on.
In decision making processes, historical and forecast factors
have to be considered. That then leads to the model
specification that is a proxy for capital composition, in which
case, considering decisions for one period ahead, the financing
decision function would be specified as: (lagged variables are
to be considered)
At = f (Ct-1, L t-1, other factors) (1)
Where: At refers to the level of assets in period t
Ct-1 refers to capital invested in the period precedent to t
L t-1 refers to liabilities in the period precedent to t; and
Other factors imply the factors determined by investment
opportunities such as economic conditions, interest rates etc.
3.2. The Approach
If a company foresees an investment opportunity of the
magnitude θ, let ∆At be the additional asset level required to
exploit that opportunity. Then the company has to decide on
the financing for the additional assets on the basis of available
options and prevailing conditions deriving from antecedent
factors.
Making assumptions on the financing for additional assets,
using retained earnings or reserves will be simply
transforming the form of assets. Thus ∆Ct is here used to
depict the transformed assets and not added capital, where
∆Ct= ƒ(δCt-1). The other option is borrowing, where additional
borrowing is ∆Lt = ƒ (δLt-1). The assumption on ∆Ct and ∆Lt is
that the two variables are dependent on the scenario factors
antecedent to time t expressed as δCt-1 and δLt-1 respectively.
The factors are stated as the proportions of equity and debt in
the assets, or the prevalent capital structure.

186 Tibuhinda Ngonzi: Debating the ‘Evolution of Accounting Equation’: A Cross-Case Analysis Approach
Therefore,
∆At = ƒ(δCt-1| + δLt-1| ), (2)
where δCt-1 and δLt-1 are derivative functions conditional to the debt ratioin period t-1 ie.
Thus the specified function (2) uses lagged variables of C
and L. The conditionals are designed to capture antecedent
factors, assumed to be captured in the inertia debt ratio of
equation (2).
Therefore, regression can be applied on these lagged
variables as follows
∆At = αCt-1 + βLt-1 + Ɛ (3)
Where the error term Ɛ is used to capture financing based on
the issue of stock as the last option in the row.
In essence, the prediction on the proportions of capital and
liabilities in the additional assets is better served by the
conditional coefficients of lagged variables in OLS as opposed
to using panel data magnitudes. It is equally important to take
note that the analysis should be case based, because different
conditions exist for each case. This deifies the use of aggregates.
4. Conclusions
The principal argument of this paper was focussed in three
dimensions: (1) to interrogate the applicability of the new
form of accounting equation; (2) to test the validity of the
estimated parameters for capital and liabilities in the model;
and (3) to test for the evidence of the trade-off and pecking
order theories of corporate finance. Appended to the argument
was a task to suggested and specify a predictive model for
added-assets financing decisions.
The conducted test revealed that the new accounting
equation is not pragmatically viable, and that the regression
analysis based estimates for capital and liabilities suffer
problems of aggregation. A dynamic model based on lagged
variables was specified to operationalize dynamics in the
capital structure decisions. It was demonstrated in the model
that conditional coefficients of lagged variables in OLS should
account for antecedent factors information using the stable
debt ratio as its proxy.
Finally, the trade-off and pecking order theories are not
mutually exclusive, and can be demonstrated to exist in the
long-run analysis of data. The trade-off characteristics were
exhibited between borrowing and equity, where equity was
persistently used to reduce borrowing to certain desired low
levels, but not to capture tax-shield benefits. This leaves a
research gap for investigating why is tax exemption not an
incentive for borrowing in the cases involved. The pecking
order characteristics were exhibited in the long term
adjustments, where retained earnings and reserves were seen
to be preferred in financing for additional assets followed by
debt in cases of deficiency.
The depth of the observations made is limited by the fact that
there is a lack of company intensity by industry on the listing of
DSE, which makes it impossible to obtain industry
characteristics affecting asset financing decisions. On the other
hand, DSE is an emerging market, which provides a very
shallow duration of companies and time series data. This limits
the observations and conclusions for long term characteristics
that are very important for theorizing fundamentals.
In addition to investigating for lack of motive to exploit tax
exemption on borrowing, there is a need to research on
empirical support for the specified dynamic model and
developing others for predictive purposes.
References
[1] Al-taani, K. (2013). The relationship between capital structure and firm performance: evidence from Jordan. Journal of Finance, 1(3), 41–45. doi:10.11648/j.jfa.20130103.11.
[2] Bourgeois, L., & Eisenhardt, K. M. (1988). Strategic decision processes in high velocity environments: Four cases in the microcomputer industry. Management Science, 34, 816–835.
[3] Chen, J. J. (2004). Determinants of capital structure of Chinese-listed companies. Journal of Business Research, 57 (March 2003), 1341–1351. doi:10.1016/S0148-2963(03)00070-5.
[4] de Jong, A., Kabir, R., & Nguyen, T. T. (2008). Capital structure around the world: The roles of firm- and country-specific determinants. Journal of Banking and Finance, 32, 1954–1969. doi:10.1016/j.jbankfin.2007.12.034.
[5] Eisenhardt, K. M. (1989). Building Theories from Case Study Research. Academy of Management Review, 14(4), 532–550.
[6] Gharaibeh, A. M. (2015). The Determinants of Capital Structure: Empirical Evidence from Cuwait. European Journal of Business, Economics and Accountancy, 3(6), 1–25. Retrieved from http://www.idpublications.org/wp-content/uploads/2015/09/THE-DETERMINANTS-OF-CAPITAL-STRUCTURE-EMPIRICAL-EVIDENCE-FROM-KUWAIT.pdf
[7] Hackbarth, D., Hennessy, C. a., & Leland, H. E. (2007). Can the trade-off theory explain debt structure? Review of Financial Studies, 20, 1389–1428. doi:10.1093/revfin/hhl047.
[8] Khan, S., & VanWynsberghe, R. (2008, January 31). Cultivating the Under-Mined: Cross-Case Analysis as Knowledge Mobilization. Forum Qualitative Sozialforschung / Forum: Qualitative Social Research. Retrieved from http://www.qualitative-research.net/index.php/fqs/article/view/334/729
[9] Myers, S. C. (1984). The Capital Structure Puzzle. The Journal of Finance, 39(3), 575–592.
[10] Myers, S. C. (2001). Capital Structure, 15(2), 81–102. doi:10.1257/jep.15.2.81.
[11] Myers, S. C., & Majluf, N. (1984). Corporate financing and investment decisions when firms have information that investors do not have. Journal of Financial Economics, 13, 187–221.
[12] Ntui, P. P. (2013). Evolution of Accounting Equation: evidence of companies quoted on Dar es Salaam stock exchange - Tanzania. Journal of Finance and Accounting, 1(4), 55–63. doi:10.11648/j.jfa.20130104.11.

Journal of Finance and Accounting 2016; 4(4): 179-187 187
[13] Phillips, F., & Heiser, L. (2011). A Field Experiment Examining the Effects of Accounting Equation Emphasis and Transaction Scope on Students Learning to Journalize, 26(4), 681–699. doi:10.2308/iace-50051.
[14] Qian, Y., Tian, Y., & Wirjanto, T. S. (2009). Do Chinese publicly listed companies adjust their capital structure toward a target level? China Economic Review, 20(4), 662–676. doi:10.1016/j.chieco.2009.06.001.
[15] Rowlands, B. (2005). Grounded in Practice: Using Interpretive Research to Build Theory. The Electronic Journal of Business Research Methodology, 3(1), 81–92.
[16] Serrasqueiro, Z., & Nunes, P. (2008). Determinants of Capital Structure: Comparison of Empirical Evidence From the Use of Different Estimators. Journal of Applied Economics, 5(1), 14–29. Retrieved from http://www2.southeastern.edu/orgs/ijae/index_files/IJAE MARCH 2008 NUNES IJAE_ARTICLE_FINAL VERSION 6-1-08.pdf
[17] Titman, S., & Wessels, R. (1988). The Determinants of Capital Structure Choice, XLIII(1).
[18] Yin, R. (1984). Case Study Research. Beverly Hills: Sage Publications.