Three-Dimensional Echocardiography in Evaluating LA ...
11
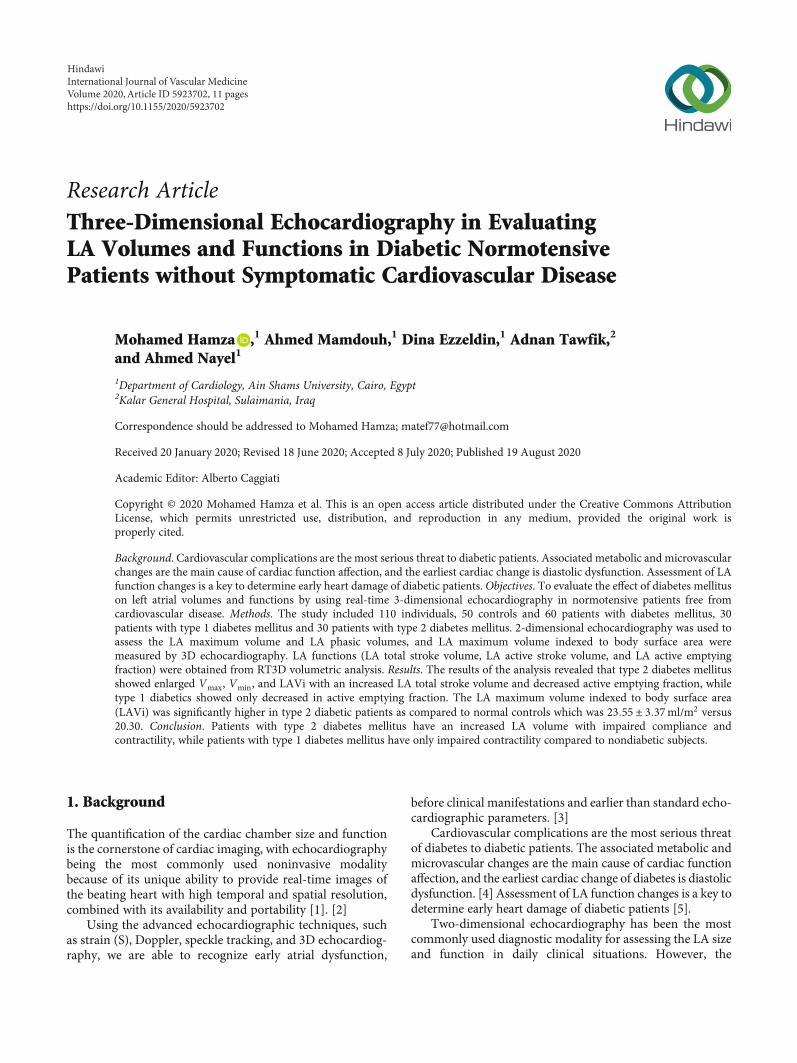
Research Article Three-Dimensional Echocardiography in Evaluating LA Volumes and Functions in Diabetic Normotensive Patients without Symptomatic Cardiovascular Disease Mohamed Hamza , 1 Ahmed Mamdouh, 1 Dina Ezzeldin, 1 Adnan Tawfik, 2 and Ahmed Nayel 1 1 Department of Cardiology, Ain Shams University, Cairo, Egypt 2 Kalar General Hospital, Sulaimania, Iraq Correspondence should be addressed to Mohamed Hamza; [email protected] Received 20 January 2020; Revised 18 June 2020; Accepted 8 July 2020; Published 19 August 2020 Academic Editor: Alberto Caggiati Copyright © 2020 Mohamed Hamza et al. This is an open access article distributed under the Creative Commons Attribution License, which permits unrestricted use, distribution, and reproduction in any medium, provided the original work is properly cited. Background. Cardiovascular complications are the most serious threat to diabetic patients. Associated metabolic and microvascular changes are the main cause of cardiac function affection, and the earliest cardiac change is diastolic dysfunction. Assessment of LA function changes is a key to determine early heart damage of diabetic patients. Objectives. To evaluate the effect of diabetes mellitus on left atrial volumes and functions by using real-time 3-dimensional echocardiography in normotensive patients free from cardiovascular disease. Methods. The study included 110 individuals, 50 controls and 60 patients with diabetes mellitus, 30 patients with type 1 diabetes mellitus and 30 patients with type 2 diabetes mellitus. 2-dimensional echocardiography was used to assess the LA maximum volume and LA phasic volumes, and LA maximum volume indexed to body surface area were measured by 3D echocardiography. LA functions (LA total stroke volume, LA active stroke volume, and LA active emptying fraction) were obtained from RT3D volumetric analysis. Results. The results of the analysis revealed that type 2 diabetes mellitus showed enlarged V max , V min , and LAVi with an increased LA total stroke volume and decreased active emptying fraction, while type 1 diabetics showed only decreased in active emptying fraction. The LA maximum volume indexed to body surface area (LAVi) was significantly higher in type 2 diabetic patients as compared to normal controls which was 23:55 ± 3:37 ml/m 2 versus 20.30. Conclusion. Patients with type 2 diabetes mellitus have an increased LA volume with impaired compliance and contractility, while patients with type 1 diabetes mellitus have only impaired contractility compared to nondiabetic subjects. 1. Background The quantification of the cardiac chamber size and function is the cornerstone of cardiac imaging, with echocardiography being the most commonly used noninvasive modality because of its unique ability to provide real-time images of the beating heart with high temporal and spatial resolution, combined with its availability and portability [1]. [2] Using the advanced echocardiographic techniques, such as strain (S), Doppler, speckle tracking, and 3D echocardiog- raphy, we are able to recognize early atrial dysfunction, before clinical manifestations and earlier than standard echo- cardiographic parameters. [3] Cardiovascular complications are the most serious threat of diabetes to diabetic patients. The associated metabolic and microvascular changes are the main cause of cardiac function affection, and the earliest cardiac change of diabetes is diastolic dysfunction. [4] Assessment of LA function changes is a key to determine early heart damage of diabetic patients [5]. Two-dimensional echocardiography has been the most commonly used diagnostic modality for assessing the LA size and function in daily clinical situations. However, the Hindawi International Journal of Vascular Medicine Volume 2020, Article ID 5923702, 11 pages https://doi.org/10.1155/2020/5923702
Transcript of Three-Dimensional Echocardiography in Evaluating LA ...
Research ArticleThree-Dimensional Echocardiography in EvaluatingLA Volumes and Functions in Diabetic NormotensivePatients without Symptomatic Cardiovascular Disease
Mohamed Hamza ,1 Ahmed Mamdouh,1 Dina Ezzeldin,1 Adnan Tawfik,2
and Ahmed Nayel1
1Department of Cardiology, Ain Shams University, Cairo, Egypt2Kalar General Hospital, Sulaimania, Iraq
Correspondence should be addressed to Mohamed Hamza; [email protected]
Received 20 January 2020; Revised 18 June 2020; Accepted 8 July 2020; Published 19 August 2020
Academic Editor: Alberto Caggiati
Copyright © 2020 Mohamed Hamza et al. This is an open access article distributed under the Creative Commons AttributionLicense, which permits unrestricted use, distribution, and reproduction in any medium, provided the original work isproperly cited.
Background. Cardiovascular complications are the most serious threat to diabetic patients. Associated metabolic and microvascularchanges are the main cause of cardiac function affection, and the earliest cardiac change is diastolic dysfunction. Assessment of LAfunction changes is a key to determine early heart damage of diabetic patients. Objectives. To evaluate the effect of diabetes mellituson left atrial volumes and functions by using real-time 3-dimensional echocardiography in normotensive patients free fromcardiovascular disease. Methods. The study included 110 individuals, 50 controls and 60 patients with diabetes mellitus, 30patients with type 1 diabetes mellitus and 30 patients with type 2 diabetes mellitus. 2-dimensional echocardiography was used toassess the LA maximum volume and LA phasic volumes, and LA maximum volume indexed to body surface area weremeasured by 3D echocardiography. LA functions (LA total stroke volume, LA active stroke volume, and LA active emptyingfraction) were obtained from RT3D volumetric analysis. Results. The results of the analysis revealed that type 2 diabetes mellitusshowed enlarged Vmax, Vmin, and LAVi with an increased LA total stroke volume and decreased active emptying fraction, whiletype 1 diabetics showed only decreased in active emptying fraction. The LA maximum volume indexed to body surface area(LAVi) was significantly higher in type 2 diabetic patients as compared to normal controls which was 23:55 ± 3:37ml/m2 versus20.30. Conclusion. Patients with type 2 diabetes mellitus have an increased LA volume with impaired compliance andcontractility, while patients with type 1 diabetes mellitus have only impaired contractility compared to nondiabetic subjects.
1. Background
The quantification of the cardiac chamber size and functionis the cornerstone of cardiac imaging, with echocardiographybeing the most commonly used noninvasive modalitybecause of its unique ability to provide real-time images ofthe beating heart with high temporal and spatial resolution,combined with its availability and portability [1]. [2]
Using the advanced echocardiographic techniques, suchas strain (S), Doppler, speckle tracking, and 3D echocardiog-raphy, we are able to recognize early atrial dysfunction,
before clinical manifestations and earlier than standard echo-cardiographic parameters. [3]
Cardiovascular complications are the most serious threatof diabetes to diabetic patients. The associated metabolic andmicrovascular changes are the main cause of cardiac functionaffection, and the earliest cardiac change of diabetes is diastolicdysfunction. [4] Assessment of LA function changes is a key todetermine early heart damage of diabetic patients [5].
Two-dimensional echocardiography has been the mostcommonly used diagnostic modality for assessing the LA sizeand function in daily clinical situations. However, the
HindawiInternational Journal of Vascular MedicineVolume 2020, Article ID 5923702, 11 pageshttps://doi.org/10.1155/2020/5923702

measurement of the LA volume is difficult due to its com-plex shape.
Several methods which use various geometric assump-tions about the atrial shape have been developed forassessing the LA volume, such as the biplane area length(AL), the biplane modified Simpson, and the prolateellipse methods [6].
A volumetric system developed at Duke Universityenabled the first real-time acquisitions. Consequently,RT3DE was used in recent studies to evaluate the LA sizeand/or function in various diseases [7].
2. Aim
The study is aimed at evaluating the effect of diabetes mellituson left atrial volumes and functions by using real-time three-dimensional echocardiography in normotensive patients freeof symptomatic cardiovascular disease.
3. Methods
The study was a case control study and included 110 individ-uals, 50 normal healthy subjects regarded as control and 60patients with diabetes mellitus, 30 patients with type 1 diabe-tes mellitus and 30 patients with type 2 diabetes mellitus.
The inclusion criteria were age above 18 years, normalblood pressure, left ventricular ejection fraction ≥ 50% (mod-ified Simpson method), sinus rhythm, and with no history ofprevious cardiac symptoms.
The diabetic patients included were already diagnosed aseither type 1 or type 2 DM, were taking their antidiabeticmedication, and were regularly visiting the diabetes clinicfor follow-up.
Patients with hypertension (previously diagnosed, onantihypertensive medications, or measured BP > 140/90),structural heart disease (valvular and congenital heart dis-ease, LVH, and impaired LV systolic functions), ischemicheart disease (by history of revascularization or documentedevidence of ischemia), and arrhythmias and patients withchronic kidney disease and chronic obstructive lung diseaseswere all excluded from the study.
The control group consisted of 50 healthy individualsmatched for age and sex with the diabetic patients.
After a written informed consent, all study participantshad meticulous clinical assessment (history and physicalexamination) with calculation of the estimated BSA (cm2),ECG, and echo study.
All echocardiographic examinations were performed bythe same echocardiographer, by using IE33, Philips machine,with digital storage software for offline analysis [8].
LV internal dimensions, wall thickness, and LA diam-eter were obtained from the parasternal long-axis view[9], and LV ejection fraction was calculated from apicalfour-chamber and two-chamber views using Simpson’sbiplane method [10] Conventional pulsed Doppler imag-ing of mitral inflow was recorded from apical 4-chamberview to measure the E and A waves and calculate the E/A ratio [11]. LA volumes were measured using Simpson’sbiplane method of discs with the LA appendage and pul-
monary veins excluded from the tracing using four-chamber and two-chamber views [12].
Subsequently, all subjects performed three-dimensionalechocardiographic evaluations.
Individuals were instructed to hold their breath at thetime of image acquisition, and images were coupled withECG recording. (197)
The real-time three-dimensional echocardiography(RT3DE) was used to obtain the left atrial volume.
An IE33 echocardiography device, with an X3 (1-3MHz)matrix transducer by the same echocardiographer was usedto acquire the full volume, real-time pyramidal volumetricdata for four consecutive cardiac cycles. To ensure the inclu-sion of the entire volume of the LA and LV inside the pyrami-dal volume, data were acquired using the wide-angle mode,thus acquiring four wedge-shaped subvolumes for a periodof 5 seconds of apnea [13].
The echocardiographic 3D data were digitally storedand analyzed using the QLAB-Philips software (version6.0; Philips Medical Systems). The three-dimensional echo-cardiographic image analysis was based on the apical win-dow and semiautomatic tracing of the endocardial borders(Figure 1). [14]
The analysis of the left atrium was performed using MPRmode by marking four points on the atrial surface of themitral annulus, septal, lateral, anterior, and inferior, and afifth point in the left atrial roof. Subsequently, the endocar-dial surface was automatically outlined and could be visual-ized from different views [15].
Manual modifications were made to correct the auto-matic tracing when necessary, and then, the softwaregenerates a variation curve of the LAV throughout thecardiac cycle [16]. The LA appendage and the pulmo-nary vein confluence were excluded from the LA trac-ings, and finally, the dynamic LA polyhedron model wasobtained [17].
The LAVmax was considered the peak of the curve, andthe value was indexed by the body surface area (LAVi) [18]..
The following left atrial volumes were measured: LAminimum volume (LAVmin) and LA end-diastolic volumemeasured at the first frame after mitral valve closure(Figure 2) [19], LA maximum volume (LAVmax) and LAend-systolic volume measured one frame before mitral valveopening (Figure 3) [19], and LA volume before contraction(VpreA): the last frame before mitral valve reopening or atthe time of P wave on ECG (Figure 4) [19].
From these volumes, the following indices of LA functionwere calculated: LA total stroke volume (LASV): LAVmax –LAVmin, LA active stroke volume (ASV): VpreA −Vmin, andLA active emptying fraction (AEF): ASV/VpreA × 100 [20].
4. Statistical Analysis
Data were collected, revised, coded, and entered to the Statis-tical Package for Social Science (IBM SPSS) version 20. Qual-itative data were presented as number and percentages whilequantitative data were presented as mean, standard devia-tions, and ranges.
2 International Journal of Vascular Medicine

The comparison between two groups with qualitativedata were done by using the chi-squared test, and/or theFisher exact test was used instead of the chi-squared testwhen the expected count in any cell was found less than 5.
The comparison between two independent groupsregarding quantitative data with parametric distribution
was done by using the independent t-test, while comparisonbetween more than two groups with quantitative data wasdone by using one-way analysis of variance (ANOVA).
Spearman correlation coefficients were used to assess therelation between two quantitative parameters in the samegroup.
Figure 1: Semiautomatic LA border tracing by marking (●) at 4 mitral annular points (lateral, septal, inferior, and anterior) and an atrialsuperior dome point opposite the annulus A. The automatic border tracing is then shown by the software.
Figure 2: Left atrial volume by real-time three-dimensional echocardiography at the end diastole (LAVmin).
3International Journal of Vascular Medicine

The confidence interval was set to 95%, and the margin oferror accepted was set to 5%. So, a P value less than 0.05 wasconsidered significant.
5. Results
This study included 110 individuals, 50 normal healthy sub-jects and 60 patients with diabetes mellitus, 30 patients withtype 1 diabetes mellitus and 30 patients with type 2 diabetesmellitus. Patients were consecutively recruited from the dia-betic clinic of Ain Shams University hospital. Baseline demo-graphic data including age and sex are listed in Table 1.
The duration of diabetes in type 1 diabetic patient groupranged from 4 to 26 years with a mean of 12:60 ± 6:32, andthe duration of diabetes in type 2 diabetic patients rangedfrom 1 to 20 years with a mean of 10:20 ± 6:19. There wasno significant difference in the duration of diabetes in bothsubgroups (P > 0:05).
Regarding LV dimensions, wall thickness, and LV sys-tolic functions, there was no statistically significant differencebetween the 3 groups included in the study (control subjectsand type 1 and type 2 diabetic patients) (Table 2).
5.1. Left Atrial Dimensions and Area by 2D Echocardiography.The LA area was larger in the diabetic group (P < 0:05) whilethe LA length and diameter showed no statically significantdifference between control subjects and diabetic patients(Table 3).
5.2. Left Atrial Volume byTwo-Dimensional Echocardiography.The patient group shows a significantly larger left atrial volumein comparison to control group (P < 0:005) (Table 4).
After dividing the patient group into diabetic subgroups(type 1 and 2), there was no statistically significant differencebetween controls and diabetic type 1 regarding LA volumesbut type 2 diabetic patients showed a statistically significanthigher LA volumes when compared to controls.
There was a statistically significant difference betweenboth study groups regarding mitral E/A ratio and A velocity(P < 0:05).
Regarding the mitral inflow velocity (E/A) ratio, therewas no significant difference between control subjects andtype 1 diabetics, but on the other hand, there was a statisti-cally significant difference between controls and type 2 diabe-tes patients.
Figure 3: Left atrial volume by real-time three-dimensional echocardiography at the end systole (LAVmax).
Figure 4: Left atrial volume by real-time three-dimensional echocardiography at last frame before mitral reopening (VpreA).
4 International Journal of Vascular Medicine

We studied 30 cases with diabetes mellitus type 1 inwhich 16.7% had left ventricular diastolic dysfunction grade1 (E/A < 1) and 30 cases with diabetes mellitus type 2 inwhich 18 cases (60%) had left ventricular diastolic dysfunc-tion grade 1 (E/A < 1).
5.3. Left Atrial Volume by 3D Echocardiography. The LAminimum volume, maximum volume, volume before atrial
contraction, and LA volume indexed to the BSA were signif-icantly higher in patients with type 2 diabetes P value < 0.05while there was no significant difference between controlsubjects and patients with type 1 diabetes regarding Vmin,Vmax, VpreA, and LAVi (P > 0:05).(Table 5).
5.4. Left Atrial Function by 3D Echocardiography. Patientswith type 1 diabetes showed a significantly lower active
Table 1: Baseline demographic data.
Control group D1 group D2 group
Age (year)Mean ± SD 33:63 ± 8:57 25:53 ± 5:88 51:97 ± 9:33Range 18–58 18–38 37–70
SexFemale 17 (34%) 24 (80%) 22 (73.3%)
Male 33 (66%) 6 (20%) 8 (26.7%)
Weight (kg)Mean ± SD 74:65 ± 13:58 61:87 ± 8:80 72:40 ± 8:02Range 50–95 45–80 55–90
BMI (kg/m2)Mean ± SD 25:45 ± 3:26 23:32 ± 2:90 26:26 ± 2:79Range 18.4–29.7 16.5–28.1 20.2–29.4
Weight (kg)Mean ± SD 74:65 ± 13:58 61:87 ± 8:80 72:40 ± 8:02Range 50–95 45–80 55–90
Duration of diabetes (year)Mean ± SD 12:60 ± 6:32 10:20 ± 6:19Range 4–26 1–20
Table 2: Comparison between patient and control groups regarding LV dimensions and function.
Control group Patients group Independent t-testNo: = 50 No: = 60 t P value
LVEDd (mm)Mean ± SD 41:68 ± 4:41 42:29 ± 4:44
0.755 0.451Range 35–51 33–63
LVESd (mm)Mean ± SD 29:06 ± 2:05 28:98 ± 3:41
0.165 0.868Range 25–34 22–38
IVS thickness (mm)Mean ± SD 9:09 ± 0:89 9:68 ± 0:74
3.948 0.001Range 5–10.3 8-10.3
LVEF%Mean ± SD 66:15 ± 4:64 64:83 ± 5:79
1.378 0.171Range 60–74 53-77
Table 3: Comparison between the control group and the patient group regarding LA area and dimensions by 2D.
Control group Patient groupIndependent t-test
t P value
LA area (cm2)Mean ± SD 13:34 ± 2:29 14:05 ± 2:94
3.455 0.001Range 10–19.1 11.43–21.2
LA length (cm)Mean ± SD 4:79 ± 0:63 5:84 ± 5:11
0.695 0.489Range 3.7–6.2 3–6.1
LA diameter (mm)Mean ± SD 32:71 ± 2:68 32:68 ± 2:85
1.281 0.203Range 27–39 28–38
5International Journal of Vascular Medicine

emptying fraction as compared to the control group(P < 0:05) with no differences regarding the LA total strokevolume and LA active stroke volume between both studygroups (P > 0:05) while patients with type 2 diabetes showeda significantly larger LA total stroke volume and lower LAactive emptying fraction (P < 0:05) with no difference
regarding the LA active stroke volume (P > 0:05) when com-pared to control subjects(Table 6).
Patients with type 2 diabetes showed a significantly largerLA total stroke volume as compared to those with type 1 dia-betes (P < 0:05) with no differences in LA active stroke vol-ume and LA active emptying fraction (P > 0:05) (Table 7).
Table 4: Comparison between patient and control groups regarding 2D LA volumes.
Control group Patients group Independent t-testNo: = 50 No: = 60 t P value
4C LA volume (ml)Mean ± SD 29:20 ± 6:51 33:74 ± 6:75
3.57 0.001Range 20–45 12–61
2C LAV (ml)Mean ± SD 31:45 ± 8:15 35:79 ± 6:98
3.009 0.003Range 20–50 12–61
2C LAV (bi plane) (ml)Mean ± SD 31:85 ± 7:15 36:17 ± 6:89
3.219 0.002Range 24–50 14-61
Table 5: Comparison between control group and patient group regarding left atrial volumes by 3D. D1: type 1 diabetes; D2: type 2 diabetes.
Control group D1 group D2 group P1 P2 P3
VminMean ± SD 12:41 ± 2:59 12:78 ± 2:12 17:29 ± 4:11
0.511 0.001 0.009Range 9–17 9–20 12–30
VmaxMean ± SD 32:44 ± 6:81 35:29 ± 7:64 44:09 ± 9:44
0.076 0.001 0.001Range 24–50 15–55 34–83
VpreAMean ± SD 23:68 ± 6:16 23:02 ± 4:34 24:53 ± 2:62
0.600 0.514 0.226Range 14–30 16–36 18–30
LAViMean ± SD 20:30 ± 2:11 21:23 ± 4:29 23:55 ± 3:37
0.166 0.001 0.022Range 13.1–28 12–32.6 19–34.2
Table 6: Comparison between the control group and the patient subgroup regarding left atrial function by 3D.
Control group D1 group D2 group P1 P2 P3
LA total stroke volumeMean ± SD 21:84 ± 4:04 22:91 ± 4:88 25:26 ± 4:14
0.275 0.001 0.049Range 14–29 17.1–44.2 18–33.5
LA active stroke volumeMean ± SD 10:02 ± 3:0 9:73 ± 2:15 9:71 ± 3:71
0.635 0.665 0.976Range 3.6–16 6.2–17 4–19
LA active emptying fractionMean ± SD 42:85 ± 10:05 34:38 ± 11:35 34:40 ± 10:78
0.001 0.001 0.994Range 19.4–61.5 15–58.6 16.6–58.6
Table 7: Correlation between LA volumes and demographic parameters.
Vmin Vmax VpreA LAVir P value r P value r P value r P value
Age 0.374∗∗ 0.001 0.449∗∗ 0.001 0.124 0.178 0.247∗∗ 0.007
Duration of diabetes -0.048 0.713 -0.066 0.617 0.060 0.647 -0.007 0.958
Weight 0.054 0.557 0.198∗ 0.030 0.086 0.348 -0.099 0.281
BMI 0.082 0.372 0.281∗∗ 0.002 0.023 0.800 0.017 0.856
6 International Journal of Vascular Medicine

5.5. Correlation of Patient Characteristics with Left AtrialVolume at Different Phases. Age showed a strong correlationwith the left atrial volume at different phases (Vmin andVmax)and the left atrial volume indexed to body surface area(LAVi) (P < 0:001, 0.001, and 0.007, respectively) but showedno correlation with VpreA volume (P value = 0.178).
The weight and body mass index (BMI) showed a strongcorrelation with Vmax only (P value = 0.030 and 0.002,respectively.
The duration of diabetes mellitus showed no correlationwith the left atrial volume at any phase (Vmin, Vmax, andVpreA) and left atrial volume index (LAVi).
5.6. Correlation of 2D LA Volume, Area, and Dimensions with3D LA Volume. The maximum left atrial volume obtained by2D echocardiography correlated positively with the phasicleft atrial volume obtained by 3D echocardiography (Vmin,Vmax, and VpreA).
The maximum left atrial volume indexed to the bodysurface area (LAVi) showed positive correlation withVmin and Vmax with no correlation with VpreA (Table 7).
The left atrial area (LA area) obtained by 2D echocar-diography from apical four-chamber view showed a sig-nificantly positive correlation with Vmin, Vmax, and LAVi(P value < 0.05).
The left atrial length (LA leng.) obtained by 2D echocar-diography from apical four-chamber view showed a signifi-cantly positive correlation with Vmax and LAVi (P value <0.05).
The left atrial diameter (maximum diameter) obtained by2D echocardiography with M-mode from parasternal long-axis view showed a strong correlation with Vmin and Vmax(P value < 0.05) with no correlation with LAVi and VpreA(P value > 0.05).
The mitral inflow velocity (E/A) ratio showed a signifi-cant correlation with Vmin and Vmax (P value < 0.05)(Table 8).
The regression analysis model demonstrated that thepresence of diabetes mellitus, type of diabetes mellitus, andage were independent predictors of Vmin while only the typeof diabetes mellitus was an independent predictor of Vmax; italso demonstrated that the presence of diabetes and type ofdiabetes were independent predictors of LAVi. Only the typeof diabetes was an independent factor of the LA total strokevolume.
6. Discussion
The first published report of 3D echocardiographic evalua-tion of the LA size was that of King et al. in 1992. The authorsstudied 30 patients who were referred to the echocardiogra-phy laboratories for clinically indicated examinations. Thepatients were chosen randomly and were unselected for thetype of heart disease. Each patient was required to have atechnically satisfactory study to be included. The study con-cluded the potential usefulness of 3D echocardiography incompleting 2D echocardiographic data in a comprehensiveassessment of the LA size [21].
As we evaluated LV dimensions, LV systolic function, LAlength, and LA anteroposterior diameter using 2D echocardi-ography, we did not observe any significant difference whenwe compared type 2 diabetic patients with normal controls;our results were in agreement with Atas et al. in 2014, whoshowed no significant difference regarding LV dimensions,LV systolic function, LA length, and LA anteroposteriordiameter by using 2D echocardiography, when they com-pared the type 2 diabetic group with the normal controlgroup [22].
As we used 2D guidance Doppler wave to interrogatemitral inflow velocities, we observed that atrial filling (A)wave velocity was 75:04 ± 17:82 cm/sec in type 2 diabeticpatients which was significantly increased among type 2 dia-betic patients when compared to normal controls, and we alsoobserved that the E/A velocity ratio was 0:94 ± 0:30 in type 2diabetic patients which was decreased significantly amongtype 2 diabetic patients as compared to normal controls.
Gul and colleagues in (2009) compared diastolic param-eters in 81 type 1 diabetic patients and 50 healthy volunteersusing both pulse wave Doppler and tissue Doppler imagingto evaluate the possible effects of type 1 diabetes on left ven-tricular dysfunction; they demonstrated that the (A) velocitywas 63 ± 0:30 cm/sec and showed to be significantlyincreased in type 1 diabetic patients when compared withnormal controls [23].
These results are similar to ours; in our study, the (A)velocity was 73:83 ± 11:74 cm/sec in type 1 diabetic patientsand was significantly increased when compared to normalcontrols.
AThere are several methods to measure the left atrial vol-ume using 2DE, including Simpson’s biplane method ofdiscs, biplane area length, and the prolate ellipse. The twobiplane methods compare closely and are recommended asthe standard for left atrial volumes in ASE guidelines. Thebiplane method has the most accurate 2D echocardiographicestimation of LA volumes compared with CT, providing theclosest approximation to the true left atrial volume [24].
The LA maximum volume (Vmax) was evaluated by 2Dechocardiography with different methods (4-chamber LAvolume, 2-chamber LA volume, and biplane Simpson’smethod); we observed that the LA maximum volume wasincreased significantly in type 2 diabetic patients as com-pared to type 1 diabetic patients and normal controls by allmethods of examinations used.
In 2014, Atas and colleagues examined 40 type2 diabeticsand 40 normal healthy controls using RT3DE in addition toconventional 2D echocardiography to assess the LA volumeand phasic function and demonstrated that LA volumes,LA maximum volume (Vmax) which was 40:9 ± 11:9ml, LAminimum volume (Vmin) which was 15:6 ± 5:9ml, and LAtotal stroke volume which was 25:8 ± 7:1ml were higher sig-nificantly in diabetic patients, while LA active emptying frac-tion was 38:5 ± 13 and was significantly reduced in type 2diabetic patients, with no significant difference betweengroups regarding LA active stroke volume and LA volumebefore atrial contraction (VpreA) [22].
Our results are in agreement with Atas et al. observations;as LA volumes in type 2 diabetic patients were higher
7International Journal of Vascular Medicine

significantly in type 2 diabetic patients when compared tonormal controls; Vmax was 44:09 ± 9:44ml, Vmin was17:29 ± 4:11ml, and total stroke volume was 25:26 ± 4:14ml; also, LA active emptying fraction was 34:40 ± 10:78which was reduced significantly in type 2 diabetic patients.There was no difference between the groups regarding LAactive stroke and VpreA.
Huang and colleagues in (2010) examined left atrial func-tion in patients with type 2 diabetes mellitus (DM). Fifty-eight type 2 DM patients as the DM group and forty healthypeople as the normal control group were enrolled in theirstudy. EUB-6500 echocardiographic imaging system withLA volume tracking was applied to display and analyze theLA volume curve imaging on LV apical two- and four-chamber views. They concluded that LA maximum volumeindexed to the body surface area (LAVi) was significantlyhigher in the type 2 diabetic patients when compared to nor-mal controls [5].
Our study showed that the LA maximum volumeindexed to the body surface area (LAVi) was significantlylarger 23:55 ± 3:37ml/m2 in type 2 diabetic patients than innormal controls which was 20:30 ± 2:11ml/m2, which is sim-ilar to the results of Huang et al. 2010, in spite of usingRT3DE volume analysis in our study instead of the LA vol-ume tracking method for evaluating LA volume.
Acar and colleagues in 2009 studied LA volume and func-tion; 43 patients with type 1 diabetes mellitus and 42 controlswere enrolled in their study; they concluded that LAVi, Vmax,V min, VpreA, and LA total stroke volume were similarbetween the both groups. However, they observed a signifi-cant increase in LA active emptying fraction in their type 1diabetic patients which was 45:7 ± 8:6 versus 36:3 ± 11:1 innormal controls [25].
In type 1 diabetic patients enrolled in our study, weobserved that the LA maximum volume index, LA maximumvolume, LA minimum volume, LA volume before atrial con-traction, and LA total stroke volume were 21:23 ± 4:29ml/m2, 35:29 ± 7:64ml, 12:78 ± 2:12ml, 23:02 ± 4:34ml, and22:91 ± 4:88ml, respectively, in type 1 diabetic patients versus20:30 ± 2:11ml, 32:44 ± 6:81ml, 12:41 ± 2:59ml, 23:68 ±6:16ml, and 21:81 ± 4:04ml, respectively, in normal controls,
with no significant differences between the two groups whichwas in line with Acar et al. observations.
On the other hand, we found that the left atrial pumpfunction was impaired in our type 1 diabetic patients whichwas opposite to Acar et al. However, our type 1 diabeticpatients displayed lower active emptying fraction and similarpassive emptying fraction (LA volume before atrial contrac-tion) values compared to controls which is not an expectedfinding for impaired left ventricular diastolic compliance inwhich a compensatory increase of LA contractility and pumpfunction is expected. Based on these findings, it may be sug-gested that an independent atrial cardiomyopathy associatedwith diabetes might also be operative on the altered left atrialvolume and functions in our diabetic patients [26].
In a study by Chillo and colleagues in 2013, they per-formed echocardiography for 122 type 2 and 58 type 1 diabeticpatients to determine the prevalence of LA enlargement andits relation to LV diastolic dysfunction among asymptomaticdiabetics and they concluded that enlarged LA volume andLV diastolic dysfunction were more common in type 2 thanin type 1 diabetic patients. Patients with enlarged LAVi wereolder when compared with patients with normal LAVi bothamong type 1 and type 2 diabetic groups [27].
As we compared type 1 diabetics with type 2 diabetics, weobserved that LA volumes were increased in type 2 diabeticpatients, and diastolic dysfunction was more commonamong type 2 diabetic patients; however, both type 1 andtype 2 diabetics showed significantly impaired LA pumpingfunction. This finding may indicate deterioration of activerelaxation and compliance and contractility of LA myocar-dium in diabetic patients. Although the mechanism ofimpairment is not clear, injury to atrial myocardium causedby sustained hyperglycemia and fibrotic alteration of LA havebeen suggested to be contributing factors; age and nature ofdisease may be the cause for the difference between the 2types of diabetes.
When we compared the 2D echocardiographic LA areawith 2D and 3D LA volume, there was a significantly positivecorrelation and insignificant difference; our results wereexplained by an abstract titled “Comparison of left atrial sizeby freehand scanning three-dimensional echocardiography
Table 8: Correlation between 2D data and LA 3D volumes.
Vmin Vmax VpreA LAVir P value r P value r P value r P value
2C LAV 0.337∗∗ 0.001 0.742∗∗ 0.001 0.141 0.126 0.460∗∗ 0.001
2C (BiP) 0.444∗∗ 0.001 0.906∗∗ 0.001 0.143 0.120 0.580∗∗ 0.001
LA volume 0.469∗∗ 0.001 0.764∗∗ 0.001 0.131 0.154 0.515∗∗ 0.001
LA area 0.333∗∗ 0.001 0.615∗∗ 0.001 0.116 0.207 0.386∗∗ 0.001
LA length 0.172 0.060 0.413∗∗ 0.001 0.172 0.061 0.292∗∗ 0.001
LA diameter 0.246∗∗ 0.007 0.465∗∗ 0.001 0.111 0.228 0.230∗ 0.012
E -0.055 0.550 -0.009 0.925 0.011 0.907 0.076 0.411
A 0.181∗ 0.049 0.178 0.053 -0.058 0.528 0.140 0.128
E/A -0.183∗ 0.046 -0.182∗ 0.048 -0.031 0.738 -0.101 0.274
8 International Journal of Vascular Medicine

and two-dimensional echocardiography” reported by Kawaiand colleagues in 2004. The 2D LA area and 2D LA volumeshowed a significant positive correlation with the 3D LA vol-ume [28].
The anteroposterior diameter of LA measured using 2D-guided M-mode from parasternal long-axis view showed nocorrelation with LA volume, and this was explained previouslyby Lester et al. LA dilatation might not be evenly distributedin all planes, and measurement of anteroposterior dimensionis likely to be insensitive to changes in LA size [29].
In our diabetic patients, 80% of type 1 and 40% oftype 2 diabetic patients were classified as having normaldiastolic function (E/A ≥ 1); interestingly, LA enlargementwas present in this group as well. These observations aresimilar to those reported by Jarnert et al. In that study,LAVi was increased even in the subgroup with normaldiastolic function. This suggests that an altered LV dia-stolic function in DM only contributes in part to observedLA changes. Thus, it is likely that an independent atrialcardiomyopathy associated with DM may be a likely con-tributor to LA enlargement [30].
Zhong et al. performed a study using RT3DE in healthysubjects to calculate LAVi, LA volume maximum (Vmax),and LA volume minimum (Vmin) which increased with age.Similarly, we found that LAVi, Vmax , and Vmin were posi-tively correlated with age [31].
Gardts and colleagues in 2002 assessed the left atrialvolume in 941 hypertensive patients with a mean age 66years using 2D echocardiography; they concluded thatthe LA volume was positively correlated with body massindex and age [32].
The present study was designed to assess the effects ofdiabetes mellitus (type 1 and type 2) on left atrial size andfunction and showed that the LA volume was increased andLA mechanical function was impaired in type 2 diabeticpatients, whereas type 1 diabetic patients only showedimpaired LA pump function.
7. Study Limitations
This was a cross-sectional study, and the prognostic impor-tance of our findings is not clear. The sample size was small,and further studies on a larger number of patients are needed.
The LA appendage has an important role for the functionand volume measurements of LA, but it was excluded in thestudy which may have affected the results.
Software Q Lab Philips version 6 was used for the analysisof 3D volumetric data which is a relatively old version of theavailable software and is originally designed for evaluation ofleft ventricular volumes. However, using this software forevaluation of LA volumes also seems to be prudent as it hasbeen used by many other studies in the literature. As to ourknowledge, there is no dedicated LA software available inthe market.
8. Conclusion
(1) Evaluation of asymptomatic diabetic patients byusing RT3DE atrial volume analysis may facilitate
recognition of subtle alterations related with type 1and type 2 diabetes
(2) Patients with type 2 diabetes mellitus have increasedleft atrial volume and impaired left atrial complianceand contractility in relation to normal healthysubjects
(3) Patients with type 1 diabetes mellitus have impairedleft atrial contractility in relation to normal healthysubjects
(4) The presence of diabetes mellitus, type of diabetesmellitus, and age were independent predictors ofVmin while only the type of diabetes mellitus wasthe independent predictor of Vmax
(5) The presence of diabetes mellitus and type of diabetesmellitus were independent predictors of LAVi, andonly the type of diabetes mellitus was the indepen-dent predictor of LA total stroke volume while noneof them were independent predictors of LA activeemptying fraction
(6) Intrinsic alterations in atrial myocardial activity seemto be responsible for left atrial dysfunction in addi-tion to impairment in left ventricular diastolic func-tion which is known to be common in diabeticpatients
Abbreviations
2c LAV: 2-chamber left atrial volume2DE: Two-dimensional echocardiography3D: Three-dimensional echocardiography4c LAV: 4-chamber left atrial volumeAEF: Active emptying fractionAEV: Active emptying volumeASV: Active stroke volumeCCT: Cardiac computed tomographyCHD: Coronary heart diseaseCHF: Congestive heart failureCMR: Cardiac magnetic resonanceCT: Computed tomographyCVD: Cardiovascular diseaseD1 group: Type 1 diabetic groupD2 group: Type 2 diabetic groupDBP: Diastolic blood pressureDCM: Dilated cardiomyopathyDD: Diastolic dysfunctionDM: Diabetes mellitusE/A: Ratio of peak early to peak late mitral inflow
velocityE/E: Ratio of peak early mitral inflow to peak early
diastolic tissue velocity of mitral annulusEDV: End diastolic volumeHbA1C: Gylcated hemoglobinHDL-C: High-density lipoprotein cholesterolHF: Heart failureLA: Left atriumLAA: Left atrial appendage
9International Journal of Vascular Medicine

LAAEV: Left atrial active emptying volumeLAEF: Left atrial ACTIVE emptying fractionLAFV: Left atrial filling volumeLAPEV: Left atrial passive emptying volumeLASV: Left atrial total stroke volumeLAV: Left atrial volumeLAVi: Left atrial volume indexLDL: Low-density lipoproteinLS: Longitudinal strainLV: Left ventricleLVEDd: Left ventricular end diastolic dimensionLVEF: Left ventricular ejection fractionLVESd: Left ventricular end systolic dimensionLVM: Left ventricular massPALS: Peak atrial longitudinal strainROS: Reactive oxygen speciesRT3DE: Real-time three-dimensional echocardiographyS: SecondsSBP: Systolic blood pressureSMI: Asymptomatic myocardial infarctionSR: Strain rateSR-B: Scavengener receptor-BSRI: Strain rate imagingSTE: Speckle-tracking echocardiographyTDI: Tissue Doppler imagingTG: TriglyceridesTOE: Transesophageal echocardiographyTPA: Tissue plasminogen activatorTTE: Transthoracic echocardiographyVmax: Left atrial maximum volumeVmin: Left atrial minimum volumeVpreA: Left atrial volume before atrial contraction.
Data Availability
The data used to support the findings of this study are avail-able from the corresponding author upon request.
Disclosure
I confirm that I have read, understand, and agreed to the sub-mission guidelines, policies, and submission declaration of thejournal. I confirm that all authors of the manuscript have noconflict of interests to declare. I confirm that the manuscriptis the authors’ original work, and the manuscript has notreceived prior publication and is not under consideration forpublication elsewhere. I confirm that all authors listed on thetitle page have contributed significantly to the work, read themanuscript, attested to the validity and legitimacy of the dataand its interpretation, and agreed to its submission. I confirmthat the paper now submitted is not copied or a plagiarized ver-sion of some other published work. I declare that I shall notsubmit the paper for publication in any other Journal or Mag-azine till the decision is made by journal editors. I confirm thatwe did not receive any fund from any source or organization.
Conflicts of Interest
The authors declare that they have no conflicts of interest.
References
[1] R. M. Lang, L. P. Badano, V. Mor-Avi et al., “Recommenda-tions for cardiac chamber quantification by echocardiographyin adults: an update from the American Society of Echocardi-ography and the European Association of CardiovascularImaging,” Journal of the American Society of Echocardiogra-phy, vol. 28, no. 1, pp. 1–39.e14, 2015.
[2] A. C. Y. To, S. D. Flamm, T. H. Marwick, and A. L. Klein,“Clinical utility of multimodality LA imaging: assessment ofsize, function, and structure,” JACC: Cardiovascular Imaging,vol. 4, no. 7, pp. 788–798, 2011.
[3] E. Aune, M. Baekkevar, J. Roislien, O. Rodevand, and J. E.Otterstad, “Normal reference ranges for left and right atrialvolume indexes and ejection fractions obtained with realtimethree-dimensional echocardiography,” European Journal ofEchocardiography, vol. 10, no. 6, pp. 738–744, 2009.
[4] D. Y. Leung, A. Boyd, A. A. Ng, C. Chi, and L. Thomas, “Echo-cardiographic evaluation of left atrial size and function:current understanding, pathophysiologic correlates, and prog-nostic implications,” American Heart Journal, vol. 156, no. 6,pp. 1056–1064, 2008.
[5] G. Huang, L. Zhang, M. Xie, M. Fu, J. Huang, and Q. Lv,“Assessment of left atrial function in diabetes mellitus by leftatrial volume tracking method,” Journal of Huazhong Univer-sity of Science and Technology [Medical Sciences], vol. 30, no. 6,pp. 819–823, 2010.
[6] S. Y. Li, L. Zhang, B. W. Zhao et al., “Two-dimensional tissuetracking: a novel echocardiographic technique to measure leftatrial volume: comparison with biplane area length methodand real time three-dimensional echocardiography,” Echocar-diography, vol. 31, no. 6, pp. 716–726, 2014.
[7] W. Oliveira, O. Campos, F. Cintra et al., “Impact of continuouspositive airway pressure treatment on left atrial volume andfunction in patients with obstructive sleep apnoea assessedby real-time three-dimensional echocardiography,” Heart,vol. 95, no. 22, pp. 1872–1878, 2009.
[8] S.-W. Zhong, Y.-Q. Zhang, L.-J. Chen, S.-S. Wang, andW.-H. Li, “Evaluation of left ventricular volumes and func-tion by real time three-dimensional echocardiography inchildren with functional single left ventricle: a comparisonbetween QLAB and TomTec,” Echocardiography, vol. 32,no. 10, pp. 1554–1563, 2015.
[9] M. Rosca, P. Lancellotti, B. A. Popescu, and L. A. Pierard, “Leftatrial function: pathophysiology, echocardiographic assess-ment, and clinical applications,” Heart, vol. 97, no. 23,pp. 1982–1989, 2011.
[10] B. Khankirawatana, S. Khankirawatana, and T. Porter, “Howshould left atrial size be reported? Comparative assessmentwith use of multiple echocardiographic methods,” AmericanHeart Journal, vol. 147, no. 2, pp. 369–374, 2004.
[11] R. Ancona, S. Comenale Pinto, P. Caso et al., “Left Atrium byEchocardiography in Clinical Practice: From ConventionalMethods to New Echocardiographic Techniques,” The Scien-tific World Journal, vol. 2014, Article ID 451042, 15 pages,2014.
[12] J. L. Dorosz, D. C. Lezotte, D. A. Weitzenkamp, L. A. Allen,and E. E. Salcedo, “Performance of 3-dimensional echocardi-ography in measuring left ventricular volumes and ejectionfraction: a systematic review and meta-analysis,” Journal ofthe American College of Cardiology, vol. 59, no. 20, pp. 1799–1808, 2012.
10 International Journal of Vascular Medicine

[13] A. C. Y. To, S. D. Flamm, T. H. Marwick, and A. L. Klein,“Clinical Utility of Multimodality LA Imaging,” JACC: Cardio-vascular Imaging, vol. 4, no. 7, pp. 788–798, 2011.
[14] A. M. Anwar, O. I. I. Soliman, M. L. Geleijnse, A. Nemes, W. B.Vletter, and F. J. ten Cate, “Assessment of left atrial volumeand function by real-time three-dimensional echocardiogra-phy,” International Journal of Cardiology, vol. 123, no. 2,pp. 155–161, 2008.
[15] F. J. N. Mancuso, V. A. Moisés, D. R. Almeida et al., “Left atrialvolume determinants in patients with non-ischemic dilatedcardiomyopathy,” Arquivos Brasileiros de Cardiologia, vol. 105,no. 1, pp. 65–70, 2015.
[16] Y. Miyasaka, S. Tsujimoto, H. Maeba et al., “Left atrial volumeby real-time three-dimensional echocardiography: validationby 64-slice multidetector computed tomography,” Journal ofthe American Society of Echocardiography, vol. 24, no. 6,pp. 680–686, 2011.
[17] A. Rohner, M. Brinkert, N. Kawel et al., “Functional assess-ment of the left atrium by real-time three-dimensional echo-cardiography using a novel dedicated analysis tool: initialvalidation studies in comparison with computed tomogra-phy,” European Journal of Echocardiography, vol. 12, no. 7,pp. 497–505, 2011.
[18] C. Russo, Z. Jin, R. Liu et al., “LA Volumes and ReservoirFunction Are Associated With Subclinical CerebrovascularDisease,” JACC: Cardiovascular Imaging, vol. 6, no. 3,pp. 313–323, 2013.
[19] R. M. Lang, M. Bierig, R. B. Devereux et al., “Recommenda-tions for chamber quantification: a report from the AmericanSociety of Echocardiography's Guidelines and Standards Com-mittee and the Chamber QuantificationWriting Group, devel-oped in conjunction with the European Association ofEchocardiography, a branch of the European Society of Cardi-ology,” Journal of the American Society of Echocardiography,vol. 18, no. 12, pp. 1440–1463, 2005.
[20] S. Lupu, A. Mitre, and D. Dobreanu, “Left atrium functionassessment by echocardiography, physiological and clinicalimplications,” Medical Ultrasonography, vol. 16, no. 2,pp. 152–159, 2014.
[21] D. L. King, M. R. Harrison, D. L. King Jr., A. S. Gopal, R. P.Martin, and A. N. DeMaria, “Improved reproducibility of leftatrial and left ventricular measurements by guided threedi-mensional echocardiography,” Journal of the American Collegeof Cardiology, vol. 20, no. 5, pp. 1238–1245, 1992.
[22] H. Atas, A. Kepez, D. B. Atas et al., “Effects of diabetes mellituson left atrial volume and functions in normotensive patientswithout symptomatic cardiovascular disease,” Journal of Dia-betes and Its Complications, vol. 28, no. 6, pp. 858–862, 2014.
[23] K. Gul, A. S. Celebi, F. Kacmaz et al., “Tissue Doppler imagingmust be performed to detect early left ventricular dysfunctionin patients with type 1 diabetes mellitus,” European Journal ofEchocardiography, vol. 10, no. 7, pp. 841–846, 2009.
[24] R. R. Buechel, F. P. Stephan, G. Sommer, J. Bremerich, M. J.Zellweger, and B. A. Kaufmann, “Head-to-head comparisonof Two-Dimensional and three-dimensional echocardio-graphic methods for left atrial chamber quantification withmagnetic resonance imaging,” Journal of the American Societyof Echocardiography, vol. 26, no. 4, pp. 428–435, 2013.
[25] G. Acar, A. Akcay, A. Sokmen et al., “Assessment of atrial elec-tromechanical delay, diastolic functions, and left atrialmechanical functions in patients with type 1 diabetes melli-
tus,” Journal of the American Society of Echocardiography,vol. 22, no. 6, pp. 732–738, 2009.
[26] J. Asbun and F. J. Villarreal, “The pathogenesis of myocardialfibrosis in the setting of diabetic cardiomyopathy,” Journal ofthe American College of Cardiology, vol. 47, no. 4, pp. 693–700, 2006.
[27] P. Chillo, Å. E. Rieck, J. Lwakatare, J. Lutale, and E. Gerdts,“Left atrial volume index as a marker of left ventricular dia-stolic dysfunction in asymptomatic Tanzanian diabeticpatients,” Blood Pressure, vol. 22, no. 2, pp. 86–93, 2012.
[28] J. Kawai, K. Tanabe, C. Wang et al., “Comparison of left atrialsize by freehand scanning three-dimensional echocardiogra-phy and two-dimensional echocardiography,” European Jour-nal of Echocardiography, vol. 5, no. 1, pp. 18–24, 2004.
[29] S. J. Lester, E. W. Ryan, N. B. Schiller, and E. Foster, “Bestmethod in clinical practice and in research studies to deter-mine left atrial size,” The American Journal of Cardiology,vol. 84, no. 7, pp. 829–832, 1999.
[30] C. Jarnert, A. Melcher, K. Caidahl, H. Persson, L. Rydén, andM. J. Eriksson, “Left atrial velocity vector imaging for thedetection and quantification of left ventricular diastolic func-tion in type 2 diabetes,” European Journal of Heart Failure,vol. 10, no. 11, pp. 1080–1087, 2008.
[31] L. Zhong, L. K. Tan, C. J. Finn, D. Ghista, R. Liew, and Z. P.Ding, “Effects of age and gender on left atrial ejection forceand volume from real-time three-dimensional echocardiogra-phy,” Annals of the Academy of Medicine, Singapore, vol. 41,pp. 161–169, 2012.
[32] E. Gerdts, L. Oikarinen, V. Palmieri et al., “Correlates of leftatrial size in hypertensive patients with left ventricular hyper-trophy,” Hypertension, vol. 39, no. 3, pp. 739–743, 2002.
[33] C. Aggeli, I. Felekos, S. Kastellanos et al., “Real-time three-dimensional echocardiography: never before clinical efficacylooked so picturesque,” International Journal of Cardiology,vol. 198, pp. 15–21, 2015.
11International Journal of Vascular Medicine