Thornton Creek Water Quality Channel
33
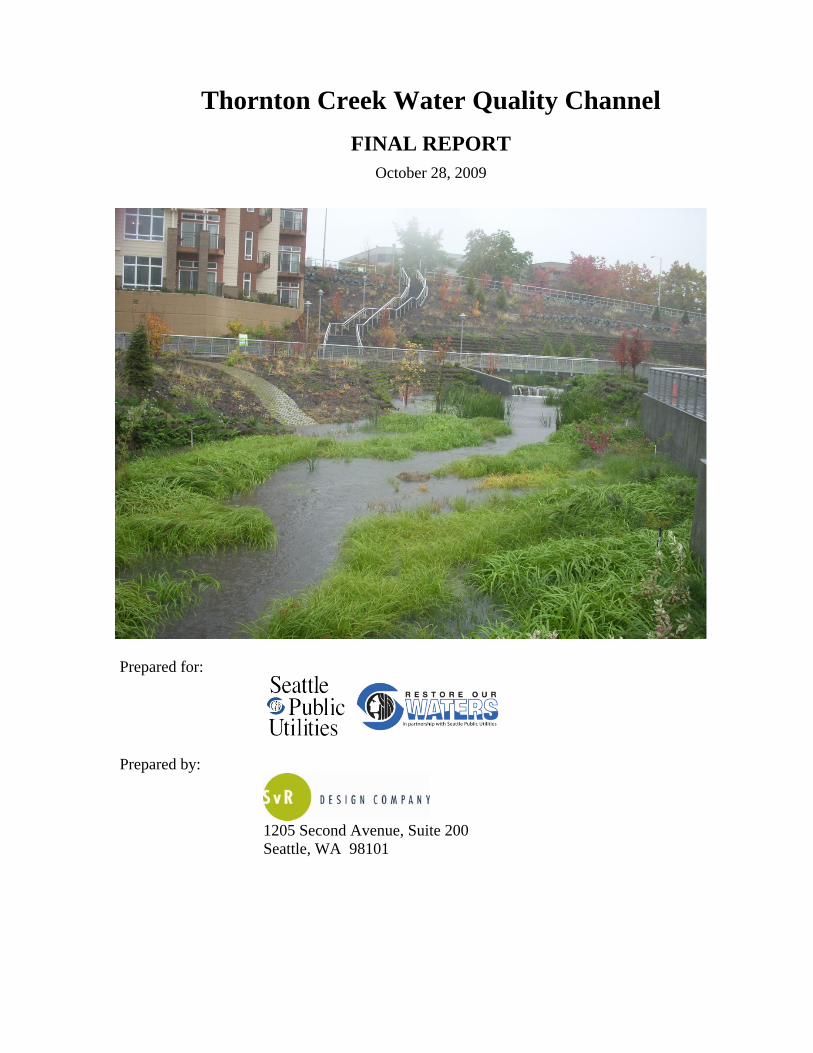
Thornton Creek Water Quality Channel FINAL REPORT October 28, 2009 Prepared for: Prepared by: 1205 Second Avenue, Suite 200 Seattle, WA 98101
Transcript of Thornton Creek Water Quality Channel
Thornton Creek Water Quality Channel FINAL REPORT
October 28, 2009
Prepared for:
Prepared by:
1205 Second Avenue, Suite 200 Seattle, WA 98101

Acknowledgements
The successful design and construction of the Thornton Creek Water Quality Channel is a result of the inspiration and hard work of many people over several years. The contributions of the following organizations and individuals are acknowledged and appreciated: Seattle Public Utilities Nancy Ahern Cynthia Blazina Karen Brooke Carrie Jones Tom Fawthrop Paul Ford Teri Hallauer Susan Harper Patrick Hastings Deb Heiden Darla Inglis Merry Lee Masako Lo Gary Lockwood Charlie Madden Miles Mayhew Miranda Maupin Beth Miller Ingrid Wertz Phil Yamamoto Seattle Department of Transportation Connie Zimmerman Prime Consultant Team SvR Design Company
Associated Earth Sciences Inc. HDR, Inc.
Resource Consultants Gaynor Inc. Herrera Environmental Consultants, Inc. Contractor Walsh Construction Inc.
Cerna Landscape Inc. Gary Merlino Construction Co.
Seattle Department of Planning and Development Lyle Bicknell Andy Higgins John Shaw Mark Troxel Seattle City Attorney’s Office Rodney Eng Seattle Department of Executive Administration Sheila Barker Linneth-Riley Hall Mark Wheeler Seattle Mayor’s Office Michelle Chen Kris Effertz Paul Fischburg Jackie Kirn Tony Vo Washington Department of Ecology Joan Nolan Washington Department of Fish and Wildlife Ginger Holser King County Mike O'Neil
This report is available on the City of Seattle web site (http://www.seattle.gov and search for “Thornton Creek Water Quality Channel”)

Page i
Table of Contents
Overview ........................................................................................................................................ 1
Location ...................................................................................................................................... 1 Background and Project Goals.................................................................................................... 5
Facility Design ............................................................................................................................... 6 Stormwater Treatment Areas ...................................................................................................... 7
Flow Diversion........................................................................................................................ 7 Water Quality Channel – Modified Biofiltration Swale Design............................................. 8 Water Quality Channel - Plant Selection .............................................................................. 10 Water Quality Channel - Sediment Removal........................................................................ 11
Public Areas .............................................................................................................................. 12 Landscape and Public Amenity Components ....................................................................... 12 Wall Slopes ........................................................................................................................... 12 Seasonal and habitat plantings .............................................................................................. 13 Pedestrian Circulation and Public Access............................................................................. 14 Educational Interpretive Signage.......................................................................................... 16 Public Art .............................................................................................................................. 17
Environmental Benefits .............................................................................................................. 17 Water Quality............................................................................................................................ 17 Open Space ............................................................................................................................... 17
Project Outreach Activities........................................................................................................ 19 Post-construction Monitoring .................................................................................................... 20
Open Space/Landscaping.......................................................................................................... 20 Water Quality Channel and Upper Cascade Swale Monitoring ............................................... 20
Flow Monitoring ................................................................................................................... 20 Sediment Monitoring ............................................................................................................ 20 Vegetation Monitoring.......................................................................................................... 21
Project Outcomes ........................................................................................................................ 22 Conclusion ................................................................................................................................... 22 References.................................................................................................................................... 23 Appendices................................................................................................................................... 24
Appendix A – Costs .................................................................................................................. 24 Appendix B – Signage .............................................................................................................. 25

Page 1
Overview The Thornton Creek Water Quality Channel (the Facility) is a step towards improving the balance between urbanization and environmental sustainability. The Facility is located in the Northgate neighborhood, near the headwaters of Thornton Creek’s South Fork. The Facility is designed to remove pollutants from stormwater by slowing urban runoff before these flows enter the creek. The Facility, in conjunction with improvements to surrounding roadways, Northgate Mall, Northgate Library and the Northgate Community Center, is part of a larger strategy to revitalize the Northgate Urban Center. Community involvement was instrumental in making the Facility successful from a number of perspectives. A stakeholder group, made up of a broad balance of community, environmental and business interests, helped drive the Facility’s design, which resulted in a Facility design that integrates environmental and commercial concerns. The Facility’s public open space and pedestrian connectivity to the regional transit hub has assisted in revitalizing economic development in the neighborhood, setting the stage for Northgate Urban Center to become an important urban hub within Seattle. The Facility was constructed by Seattle Public Utilities (SPU) with funding support from Washington State Department of Ecology (Ecology) via a Washington State Water Pollution Control Revolving Fund Loan (Loan # L0600021) (Ecology 2006).
Location The Thornton Creek Watershed is a highly developed watershed located in northeast Seattle that drains to Lake Washington (See Figure 1 – Thornton Creek Watershed). At 11.6 square miles, it is Seattle’s largest watershed. The highly urban nature of this watershed has created water quality and flow control problems in Thornton Creek which has degraded the creek’s function as aquatic habitat.

Page 2
Figure 1 - Thornton Creek Watershed

Page 3
The Facility is located in the Northgate neighborhood between NE 103rd Street and NE 105th Street and 3rd Avenue NE and 5th Avenue NE, near the headwaters of Thornton Creek’s South Fork (See Figure 2 – Facility Location).
Figure 2 - Facility Location
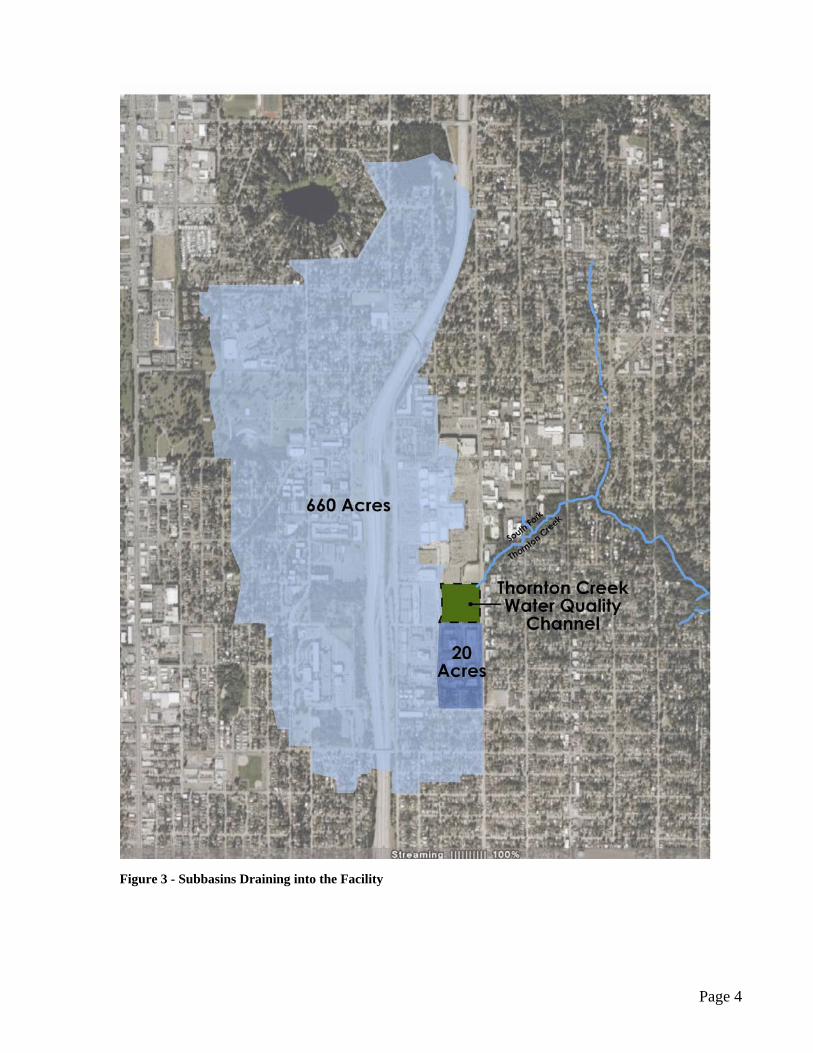
Stormwater runoff and seasonal base flows from approximately 680 acres drain to the Facility and eventually enter Thornton Creek’s South Fork. Flows drain to the Facility from two subbasins: a 660 acre subbasin that stretches west and north of the Facility and a 20 acre subbasin south of the Facility (See Figure 3 – Subbasins Draining into the Facility). Flows from the 660 acre subbasin begin west of I-5, around North Seattle Community College and the Seattle North Precinct Police Station. After passing through a storm surge pond at the college, flows cross under I-5, and merge with a small tributary and stormwater runoff coming from Northgate Mall, I-5 and the surrounding roadways. The second 20 acre subbasin includes 3rd Avenue NE and an office park south of this street. The majority of flows from these two subbasins pass through the Facility, reenter the piped drainage system at the Facility’s outlet, and discharge to Thornton Creek’s South Fork on the other side of the roadway, near the corner of 5th Avenue NE and NE 103rd Street. Prior to the Facility’s construction, flows from both basins discharged to Thornton Creek’s South Fork from the piped drainage system at the same location, near the corner of 5th Avenue NE and NE 103rd Street.
Page 4
Figure 3 - Subbasins Draining into the Facility

Page 5
Background and Project Goals Historically, the site hydraulically connected the wetlands surrounding North Seattle Community College with the headwaters of Thornton Creek’s South Fork. In the 1950’s, the area’s affordable land and proximity to I-5 transformed Northgate into a suburban landscape. The Northgate Mall, one of the first retail destinations accessible solely by auto, opened in 1950. Office parks and low-density commercial uses followed. During this period, the hydraulic connection between the wetlands and the headwaters of Thornton Creek was disrupted when a 60-inch diameter concrete storm pipe was installed and the site was covered with approximately 20 feet of fill and topped with a 5 acre parking lot.
Seattle’s 1994 Comprehensive Plan identified Northgate as an Urban Center - a target area for new jobs, housing and public investment. Yet, for more than a decade thereafter, political controversy and litigation stymied new development. Much of the controversy surrounded the headwaters of Thornton Creek’s South Fork and its piped flows. Creek advocates fought to exhume the 60-inch storm pipe to create a constructed creek bed, while private land owners focused on developing the Facility’s future site as mixed use commercial property. The controversy created a political logjam between developers, neighborhoods, creek advocates, and Seattle City Hall.
In December 2003, a political compromise set the stage for the area’s redevelopment. The City changed outmoded land use regulations, funded a transportation investment plan, and approved many other community amenities for Northgate. The Mayor and the City Council established a Northgate Stakeholder Group whose members represented a broad balance of 22 community, environmental, and business interests. One of the group’s primary missions was to forge consensus on an approach to developing a solution for the South Fork’s headwaters that would meet stormwater treatment, commercial and community goals.
The Stakeholder Group evaluated three alternative designs: 1) daylighting the 60-inch storm pipe to create an artificial creek channel; 2) constructing a natural drainage water treatment system that would treat runoff in a shallow surface channel; and 3) creating a hybrid of those two approaches.
The City’s collaborative design team worked with the Stakeholder Group and other community members to evaluate the design alternatives against the Project’s goals. Some of these goals included:
• Improving the water quality of flows entering Thornton Creek by removing sediments and associated pollutants from 91 percent of the annual runoff from the 680 acre drainage area;
• Providing public open space and native vegetation; and,
• Facilitating economic development within the Northgate area by integrating the Project’s design with adjacent private development.

Page 6
In June 2004, the Stakeholder Group supported the hybrid option. SPU acquired the Facility’s 2.7 acre site in coordination with adjacent property owners via a joint venture agreement. A plat adjustment created three separate parcels, with the Facility’s parcel located in the center to optimize both stormwater treatment and private development opportunities. The private parcel to the northwest provides multi-family housing and commercial space, while the private parcel to the southeast provides retirement community housing (See Figure 4 – Parcel Ownership).
Figure 4 - Parcel Ownership
Facility Design The Facility’s design is intended to improve water quality by slowing stormwater flows to allow sediments and associated pollutants to settle out, while also providing a multilayered landscape of native plants that serves as a safe and aesthetically pleasing public amenity that integrates with surrounding private development. Input from SPU’s operation and maintenance team was integral to the Facility’s design to ensure the Facility was efficient to maintain (SvR Design Co. 2007). The following description of the Facility’s design is separated into the Facility’s stormwater treatment areas and public areas.

Page 7
Stormwater Treatment Areas The majority of the stormwater treatment at the Facility occurs within the Water Quality Channel, although some treatment may occur within the Upper Cascade Swale (See Figure 5 - Schematic of Stormwater Treatment Facility Function and Figure 6 – Water Quality Treatment and Flow Control Elements). The Water Quality Channel is a modified biofiltration swale. Water quality treatment occurs when stormwater flows through the Wet Bioswale Terraces, slowing the water down and allowing sediments and associated pollutants to settle out. The Water Quality Channel receives year round base flow and the majority of storm flows from the two upstream basins (680 acres total). Higher flows bypass the Facility and continue through the existing 60-inch diameter storm pipe.
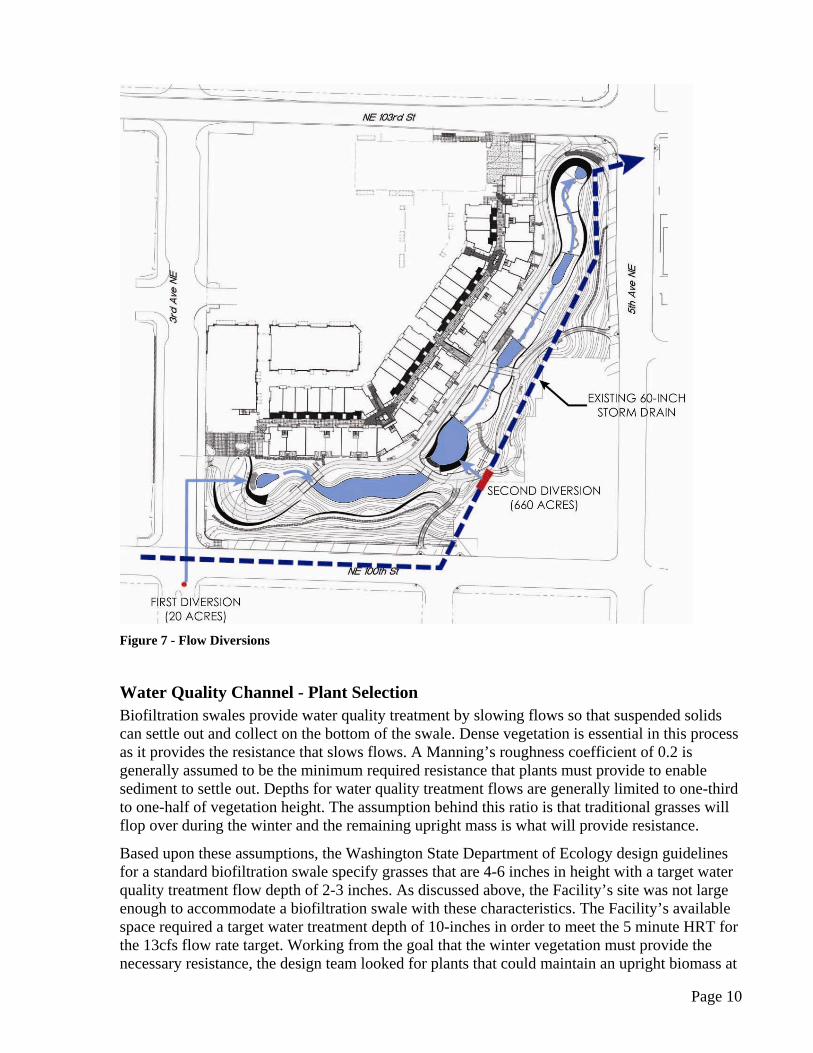
Flow Diversion The Facility’s water course is created by two diversions (See Figure 5 - Schematic of Stormwater Treatment Facility Function and Figure 7 – Flow Diversions). One diversion directs stormwater and base flows from the 20 acre subbasin into the Upper Cascade Swale located at the site’s southwest corner. The Upper Cascade Swale flows into the Water Quality Channel. The second diversion, located in the center of the site, directs the majority of the 660 acre subbasin’s flows from the existing 60-inch storm pipe into the Water Quality Channel. A weir gate within this diversion structure creates a backwater condition that directs all base flows and the majority of storm flows into the Water Quality Channel. Flows from large storm events overtop the weir gate, bypassing the Water Quality Channel to remain in the 60-inch storm pipe. The weir gate level can be manually adjusted. Hydraulic modeling of the Facility indicates that there will be no significant changes to backwater or downstream flows from pre-Facility conditions (Herrera 2007).
Figure 5 - Schematic of Stormwater Treatment Facility Function

Page 8
Figure 6 - Water Quality Treatment and Flow Control Elements
Water Quality Channel – Modified Biofiltration Swale Design The Water Quality Channel is a modified biofiltration swale. A biofiltration swale is an open, gently sloped, vegetated channel designed to treat stormwater. Pollutant removal occurs by filtration as stormwater moves through the vegetation (typically grass). The vegetation slows flows, enhancing sedimentation. Pollutants also get trapped by and adhere to the grass and thatch. Biofiltration swales are designed so that stormwater will flow evenly across the entire width of a densely vegetated channel (Seattle 2009).
The Water Quality Channel consists of the Base Flow Channel, Wet Bioswale Terraces, and Sediment Pools (See Figure 6 – Water Quality Treatment and Flow Control Elements). The Base Flow Channel continuously directs water through the Water Quality Channel and back into the existing 60-inch storm pipe where it continues to Thornton Creek’s South Fork. Storm flows that crest the Base Flow Channel spread across the adjacent vegetated Wet Bioswale Terraces for treatment. In-channel flow spreaders help to spread the water evenly. The Sediment Pools provide areas for larger sediments and associated pollutants to settle out to facilitate maintenance. The Water Quality Channel’s design is intended to allow for natural channel dynamics. A low permeability zone approximately 15 feet wide within the center of the Water Quality Channel allows for the Base Flow Channel to reestablish itself after significant storm events.

Page 9
The Water Quality Channel is designed to provide some level of water quality treatment for all flows at or below 13 cubic feet per second (cfs). This meets the Project’s goal of providing water quality treatment for 91 percent of the 680 acre drainage area’s annual average runoff.
A standard biofiltration swale that would treat all flows at or below 13 cfs would have required far more area than was available at the site and was impractical to retrofit into this urban setting. Although there wasn’t adequate area to accommodate a standard biofiltration swale, the 60-inch storm pipe’s location, 15-20 feet under fill, created the opportunity to design a modified biofiltration swale that could provide some level of treatment. The major assumptions used to modify the biofiltration swale design were:
• A maximum water quality treatment depth of 10 inches combined with taller vegetation (approximately 30 inches) would provide adequate flow resistance (a Manning’s roughness coefficient between 0.1 and 0.2). Standard biofiltration swales have a maximum water quality treatment depth of 2-3 inches and specify grasses that are 4-6 inches tall to achieve this roughness coefficient.
• A hydraulic residence time (HRT) greater than 5 minutes would provide an adequate level of treatment, although the design would still seek to meet a target HRT of 9 minutes. Standard biofiltration swales have a minimum HRT of 9 minutes.
Based on these assumptions, it was determined that a 300-foot long, 30-foot wide channel with a 0.69 percent slope would provide an adequate level of treatment of flows below 13 cfs. Due to the uncertainty regarding vegetation performance in the Water Quality Channel, a sensitivity analysis was performed that assumed roughness coefficients for vegetation between 0.1 and 0.2. Target values were established for performance parameters, including water depth, velocity, HRT, and ponding intervals. Modeling results indicated that performance parameters were within acceptable levels (Herrera 2007).
Page 10
Figure 7 - Flow Diversions
Water Quality Channel - Plant Selection Biofiltration swales provide water quality treatment by slowing flows so that suspended solids can settle out and collect on the bottom of the swale. Dense vegetation is essential in this process as it provides the resistance that slows flows. A Manning’s roughness coefficient of 0.2 is generally assumed to be the minimum required resistance that plants must provide to enable sediment to settle out. Depths for water quality treatment flows are generally limited to one-third to one-half of vegetation height. The assumption behind this ratio is that traditional grasses will flop over during the winter and the remaining upright mass is what will provide resistance.
Based upon these assumptions, the Washington State Department of Ecology design guidelines for a standard biofiltration swale specify grasses that are 4-6 inches in height with a target water quality treatment flow depth of 2-3 inches. As discussed above, the Facility’s site was not large enough to accommodate a biofiltration swale with these characteristics. The Facility’s available space required a target water treatment depth of 10-inches in order to meet the 5 minute HRT for the 13cfs flow rate target. Working from the goal that the winter vegetation must provide the necessary resistance, the design team looked for plants that could maintain an upright biomass at
Page 11
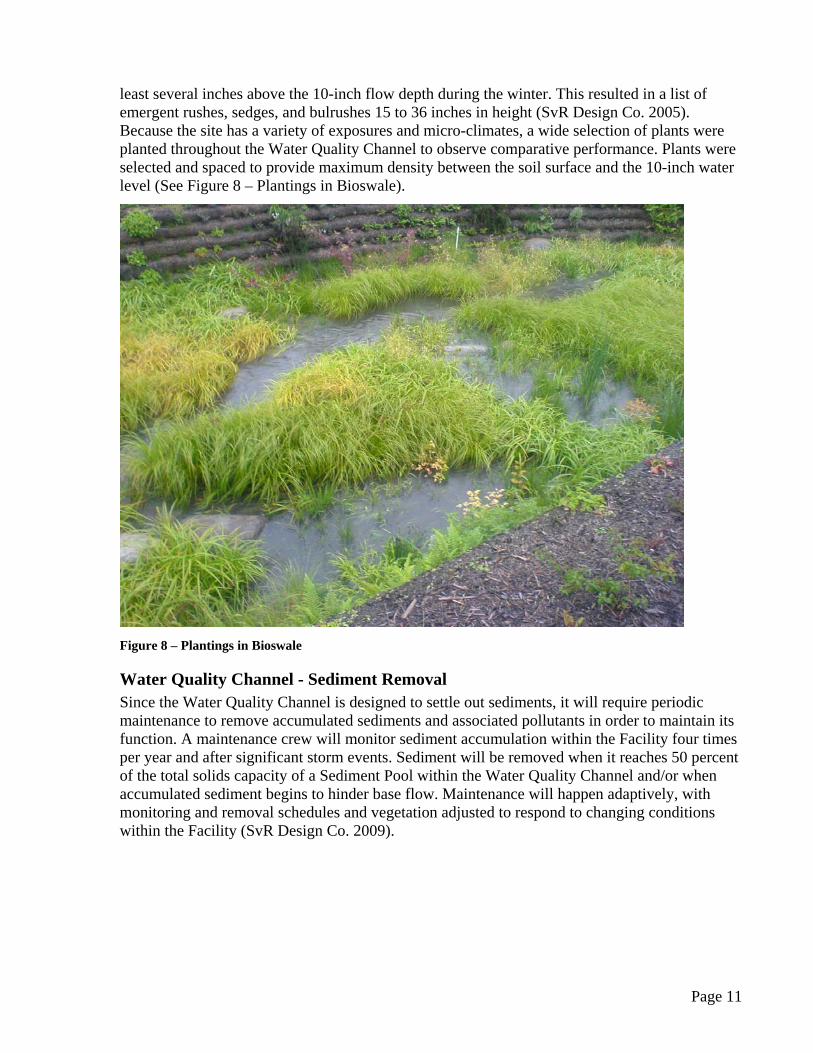
least several inches above the 10-inch flow depth during the winter. This resulted in a list of emergent rushes, sedges, and bulrushes 15 to 36 inches in height (SvR Design Co. 2005). Because the site has a variety of exposures and micro-climates, a wide selection of plants were planted throughout the Water Quality Channel to observe comparative performance. Plants were selected and spaced to provide maximum density between the soil surface and the 10-inch water level (See Figure 8 – Plantings in Bioswale).
Figure 8 – Plantings in Bioswale
Water Quality Channel - Sediment Removal Since the Water Quality Channel is designed to settle out sediments, it will require periodic maintenance to remove accumulated sediments and associated pollutants in order to maintain its function. A maintenance crew will monitor sediment accumulation within the Facility four times per year and after significant storm events. Sediment will be removed when it reaches 50 percent of the total solids capacity of a Sediment Pool within the Water Quality Channel and/or when accumulated sediment begins to hinder base flow. Maintenance will happen adaptively, with monitoring and removal schedules and vegetation adjusted to respond to changing conditions within the Facility (SvR Design Co. 2009).

Page 12
Public Areas
Landscape and Public Amenity Components The Facility’s functional requirements included creating a welcoming public open space that would both integrate well with surrounding private commercial and residential development and help weave this new development into the existing neighborhood fabric. The Project’s goal of blending natural and urban functions became the aesthetic design’s underlying theme. Sinuous curves and drifts of vegetation alternate with linear, hard structures and formal layouts. Water serves as the unifying element, meandering within the Upper Cascade Swale and Water Quality Channel, through the site, under bridges, beside pathways, and past plazas and public art. A series of pools and cascading waterfalls within the Upper Cascade Swale and Water Quality Channel add a natural playfulness to the design (See Figure 9 – Waterfall at inlet to the Water Quality Channel).
Figure 9 – Waterfall at Inlet to the Water Quality Channel
Wall Slopes Most of the Facility is below adjacent grades – in some places as much as 40 feet. Continuing the theme of natural and urban unity, the design uses both planted, slightly sloped mechanically stabilized earth walls (MSE Walls) and vertical concrete retaining walls. The MSE Walls transition into sloping banks on the Facility’s south side. The private parcel on the Facility’s north side contains commercial and retail properties and condominiums. The density of use and narrow site width on this side argued for vertical concrete retaining walls to maximize the space available for the promenade that serves as the Facility’s primary circulation path and maintenance access.

Page 13
Seasonal and habitat plantings The Facility’s planting design is divided into a series of landscape zones (See Figure 10 – Landscape Zones). The Riparian/Native Zone plantings of primarily native species on the east and south slopes provide habitat value and seasonal interest. Along the main pathway, or Urban Character Zone, ornamental and native plants provide additional texture and visual interest. The Upper Cascade Swale plantings offer a wide variety of emergents and facultative species that provide habitat for birds, insects and other wildlife. As noted earlier, plants within the Wet Bioswale Terraces establish a thick carpet of vegetation to slow and treat the incoming stormwater in coordination with a string of planted Sediment Pools. The selection of plant species in all landscape zones is aimed to maximize and enhance wildlife habitat (See Figure 11 – Emergent Plantings Mimic a Streambank).
Figure 10 - Landscape Zones

Page 14
Figure 11 – Emergent Plantings Mimic a Streambank
Pedestrian Circulation and Public Access The Facility provides for public access and pedestrian circulation (See Figure 12 – Pedestrian and Open Space Character Study). The Upper Cascade Swale and Water Quality Channel run down the center of the Facility. They are flanked on both sides by north-south pedestrian paths that connect the Facility to the surrounding neighborhood. The promenade along the Facility’s north bank is the more direct, formal route. The path on this side is wider to accommodate maintenance vehicles and pedestrians travelling between the Transit Center west of the Facility, Northgate Commons Plaza, and the neighborhoods and commercial areas to the north of the Facility. This promenade also serves as the entrance path to the market rate condominiums and townhouses. The stairs and the shorter, more curving path along the south side of the Facility take the pedestrian through the more informal, naturalistic zone adjacent to the Senior Center. This route is the most direct route between the residential neighborhoods to the east and the office complex to the south. Pedestrian bridges across the Upper Cascade Swale and the Water Quality Channel connect the Facility’s main paths. ADA access to the Facility is provided at the southwest entrance through the Thornton Place development. Once within the Facility, all paths and bridges along the Upper Cascade Swale and Water Quality Channel are fully ADA accessible.

Page 15
Figure 12 - Pedestrian and Open Space Character Study In order for SPU’s operation and maintenance team to have easy access to the Facility, staging zones and truck drive-in/back-out areas were required. Because these areas need to be continuously dedicated to maintenance functions, the required open hardscape areas are designed to also serve as pedestrian plazas. Three primary plazas and three smaller nodes are located where the paths intersect. In addition to providing the required space for maintenance vehicles, these plazas, pathways, and nodes draw pedestrians towards the water. They also lead to new retail stores and the Transit Center. The design gives people the chance to view the moving water from a variety of dramatic vantage points, as well as from quieter, more contemplative overlooks (See Figure 13 – Pedestrian Paths and Bridges).

Page 16
Figure 13 – Pedestrian Paths and Bridges
Educational Interpretive Signage SPU designed five interpretive signs that will be placed at nine locations around the Facility. A welcome sign to orient visitors will be installed at five public access locations. In addition, four different signs describing the Facility’s functions, features and context for personal stewardship in our urban watersheds have been developed for locations near the Upper Cascade Swale and Water Quality Channel. The signs are made of durable, vandal-resistant ceramic. Copies of the signs are attached as Appendix B. The welcome sign briefly introduces the Thornton Creek Watershed and how urbanization causes stormwater problems. This sign also describes the community and water quality goals for the Facility. The inlet sign describes the Facility’s catchment area and design goals, and suggests how people can change their behavior to improve watershed health. The sign at the large Sediment Pool describes the effects of impervious surfaces on water quality and explains how the Facility helps clean the stormwater that enters the creek by reducing sediment loads. Another sign is located next to one of the Wet Bioswale Terraces. It describes how plants and soil help slow the stormwater and reduce pollution. This sign also describes the plant palette and makes connections to personal stewardship and habitat restoration. The sign located at the Facility’s outlet describes Thornton Creek’s path to Lake Washington and provides information on how people can further connect with the creek, both as visitors and caretakers of our watersheds.

Page 17
Public Art The Facility also contains commissioned art, including sculptures, bridge accents, lighted glass beads, and blue-lighted walls. The artwork, by local artist Benson Shaw, reflects the design concept “Surge”. Information on the public art installation can be found at: http://www.bensonshaw.com/bensonshaw.com/T_CREEK.html.
Environmental Benefits Water Quality The Facility provides a water quality benefit to Thornton Creek by removing sediments and associated pollutants from stormwater prior to its discharge into the South Fork of Thornton Creek. Pollutants associated with this sediment include heavy metals (e.g. copper, zinc), nutrients (phosphorus), and total petroleum hydrocarbons. The Facility removes pollutants from stormwater as it passes through the Water Quality Channel. Flow is slowed down and sediments and associated pollutants settle out in the Water Quality Channel and associated Sediment Pools. As described earlier in this report, the Water Quality Channel is a modified biofiltration swale designed to provide treatment to 91 percent of the average annual flow from the 680 acre drainage area. Due to the Facility’s unique nature and the modifications to standard biofiltration swale design, the Facility’s water quality treatment performance is difficult to predict. For a standard biofiltration swale, the water quality treatment goal is the removal of 80 percent of total suspended solids (TSS) (and associated pollutants). It is estimated that the Water Quality Channel will provide 40 to 80 percent removal of TSS (and associated pollutants).
Open Space The Facility design that resulted from this private/public partnership demonstrates how even physically constrained sites can provide an opportunity to serve multiple purposes while improving environmental function. The modified biofiltration swale design enables a more efficient use of the available space and provides a unique 2.7 acre public open space amenity in the heart of this dense urban neighborhood. What was once a sterile, paved parking lot is now a unique urban park, complete with trails, bridges, plazas, and art (See Figure 14 – Before and During Construction and Figure 15 – The Completed Facility).

Page 18
Figure 14 – Before and During Construction

Page 19
Figure 15 – The Completed Facility
Project Outreach Activities The project has included extensive public outreach throughout planning, design, and construction. As previously noted, the design chosen by the Northgate Stakeholder Group was the result of collaboration between numerous interests. In addition, through educational signage, tours, the website, and presentations, the Facility is being used to broaden awareness of watershed issues and actions residents can take to improve Seattle’s receiving waters, including preventing pollution, reducing flows, and restoring habitat (see signs in Appendix B). SPU has conducted several tours of the Facility. Tours were available for attendees at the ribbon cutting event on June 6, 2009. This celebration was well received by the community. Watershed groups and City staff engaged children with interactive educational games and stormwater experts from SPU conducted tours of the Facility. Approximately 500 people attended the event. Free guided walking tours were also provided for the general public on June 13 and June 20, 2009. The walks included a discussion of the Facility and the context of Seattle’s urban watersheds. A total of 44 people participated in both walks. The walks attracted activists, professionals, long-time residents with stories of their own and families with children.

Page 20
In addition, the EPA’s July 2009 Community Involvement Training Conference in Seattle offered participants a field trip to the Facility. Participants toured the Facility with SPU staff and attended a panel discussion of the Northgate stakeholder process, featuring the SPU project manager and a cross section of stakeholders. SPU staff will continue to conduct tours on request from interested professional groups and the general public. The Project was also presented at well attended (approximately 150-200 people) sessions at the April 2009 American Planning Association National Conference in Minneapolis, MN and the September 2009 American Society of Landscape Architects National Conference in Chicago, IL. Opportunities will be pursued in 2010 to present the Project at additional regional or national conferences. This report is available on the City of Seattle web site (http://www.seattle.gov and search for “Thornton Creek Water Quality Channel”) and a limited number of hard copies will be available upon request.
Post-construction Monitoring The Facility will be monitored post-construction. Monitoring will consist of Open Space/ Landscape monitoring for vegetation establishment and Water Quality Channel monitoring for performance.
Open Space/Landscaping The Facility’s landscaping will be monitored for vegetation establishment. Plants will be replaced as necessary to meet the Facility’s target plant survival rate of 70 percent six months after installation. It is anticipated that local volunteers will be recruited via the Northgate Stakeholder Group to assist in replanting and maintaining the site.
Water Quality Channel and Upper Cascade Swale Monitoring The Water Quality Channel and Upper Cascade Swale will be monitored for three years starting in Fall 2009. Flow, sediment, and vegetation monitoring will be conducted. This monitoring is summarized below. For additional information, refer to the Thornton Creek Water Quality Channel Performance Monitoring: Quality Assurance Project Plan (QAPP). Monitoring results will be summarized annually and a final report will be produced in 2013 at the end of the study.
Flow Monitoring Continuous flow monitoring will be performed to quantify the volume and flow rates of water discharged to the Water Quality Channel and Upper Cascade Swale. In addition, the volume of water that bypasses the Facility via the 60-inch pipe and water depth within the Water Quality Channel will be monitored continuously.
Sediment Monitoring Sediment removed from the Water Quality Channel and Upper Cascade Swale will be monitored to provide a rough estimate of the pollutant mass removed by the Facility annually. These pollutants are pollutants that would have otherwise been discharged to Thornton Creek’s South Fork. The mass of sediment removed during maintenance activities will be estimated based on measurements of sediment accumulation prior to and after maintenance events at established sediment monitoring locations. The quality of sediment removed during maintenance activities

Page 21
will be determined by laboratory analysis of representative samples for the following parameters: total phosphorus, total copper, total zinc, and total petroleum hydrocarbons. The estimated mass of pollutants removed by the Facility will be calculated based on the estimate of sediment mass removed and the concentrations of pollutants in the sediments.
Vegetation Monitoring Vegetation monitoring will be conducted in the Upper Cascade Swale and the Water Quality Channel to evaluate which plant species are succeeding. This information will be used to adaptively manage vegetation in the Upper Cascade Swale and the Water Quality Channel and to inform future biofiltration swale design (See Figure 16 – Inspecting Plants in the Upper Cascade Swale).
Figure 16 – Inspecting Plants in the Upper Cascade Swale The following four vegetation zones will be monitored in the non-Sediment Pool areas: • Emergent vegetation within the Upper Cascade Swale • Woody vegetation within the Upper Cascade Swale • Emergent vegetation within the Water Quality Channel • Woody vegetation within the Water Quality Channel

Page 22
Randomly selected plots within the vegetation zones will be monitored in the spring and late summer starting in the late summer of 2009. Within each plot, percent cover of each species will be determined and the health of each plant noted. In addition, permanent photo points will be established at vantage points above the Upper Cascade Swale and Water Quality Channel to document the vegetation’s overall condition. Photos will be taken during each site visit for the vegetation monitoring.
Project Outcomes The Facility became fully operational in September 2009. Under the provisions of the Ecology Loan Agreement (Ecology 2006), the project had to meet several specific project outcomes. These outcomes are addressed below: • Purchase parcel – completed in 2004. • Reconfigure parcel lines to be consistent with hydrologic requirements – completed in
2004. • Community participation in design – The stakeholder group met numerous times from
2006 to 2009. • Complete Project design – completed in 2007. • Excavate new channel, construct swales, plant vegetation, and install pedestrian paths –
completed in 2009. • Install diversion structure – completed in 2009. • Develop educational signage – completed in 2009. • Complete Final Report – completed in 2009 (this report). • Conduct Water Quality Channel post-construction monitoring as described in QAPP and
produce Final Monitoring Report – 2009 to 2013. • Complete Post Project Survey – to be completed in 2013.
Conclusion The Thornton Creek Water Quality Channel provides multiple environmental benefits in a highly urbanized environment. The Facility receives and treats runoff from 680 acres, most of which was formerly untreated before entering the South Fork of Thornton Creek and flowing to Lake Washington. In addition, the Facility design effectively uses limited space to achieve multiple community goals by integrating public open space and a highly technical water quality facility. The Facility united a divided community, fulfilling collective goals of providing a diverse housing mix, jobs, retail, recreation, public open space, raising environmental awareness, and improving Thornton Creek water quality. The Facility serves as the front yard for the private commercial and residential development that flanks it. Indeed, the Facility’s development and construction, which cost approximately $14.7 million (See Appendix A – Costs) is believed to have generated over $200 million in adjacent private development. It has catalyzed the Northgate neighborhood’s emergence as a growing urban center for the City of Seattle.

Page 23
References Ecology. 2006. June 30, 2006. Washington State Water Pollution Control Revolving Fund. Loan Agreement Between the State of Washington Department of Ecology and Seattle Public Utilities: Thornton Creek Water Quality Channel. Loan No.: L0600021. Herrera Environmental Consultants, Inc. May 4, 2007. Hydraulic Modeling and Water Quality Evaluation: Thornton Creek Water Quality Channel. Prepared for Seattle Public Utilities. Seattle, 2009. Draft Directors’ Rules for Seattle Municipal Code, Chapters 22.800 – 22.808 Stormwater Code - Volume 3: Stormwater Flow Control and Water Quality Treatment Technical Requirements Manual. Directors’ Rule 26-2000. City of Seattle: Seattle Public Utilities and Department of Planning and Development. March 16, 2009 Draft. SvR Design Company. Dec. 9, 2005. Thornton Creek Water Quality Treatment Design Parameters. Prepared for Seattle Public Utilities. SvR Design Company, June 2007. Thornton Creek Water Quality Channel: Phase 2 Bid Documents and Technical Specifications. Prepared for Seattle Public Utilities. SvR Design Company, June 25, 2009. Thornton Creek Water Quality Channel: Operation and Maintenance Manual. Prepared for Seattle Public Utilities.
Page 24
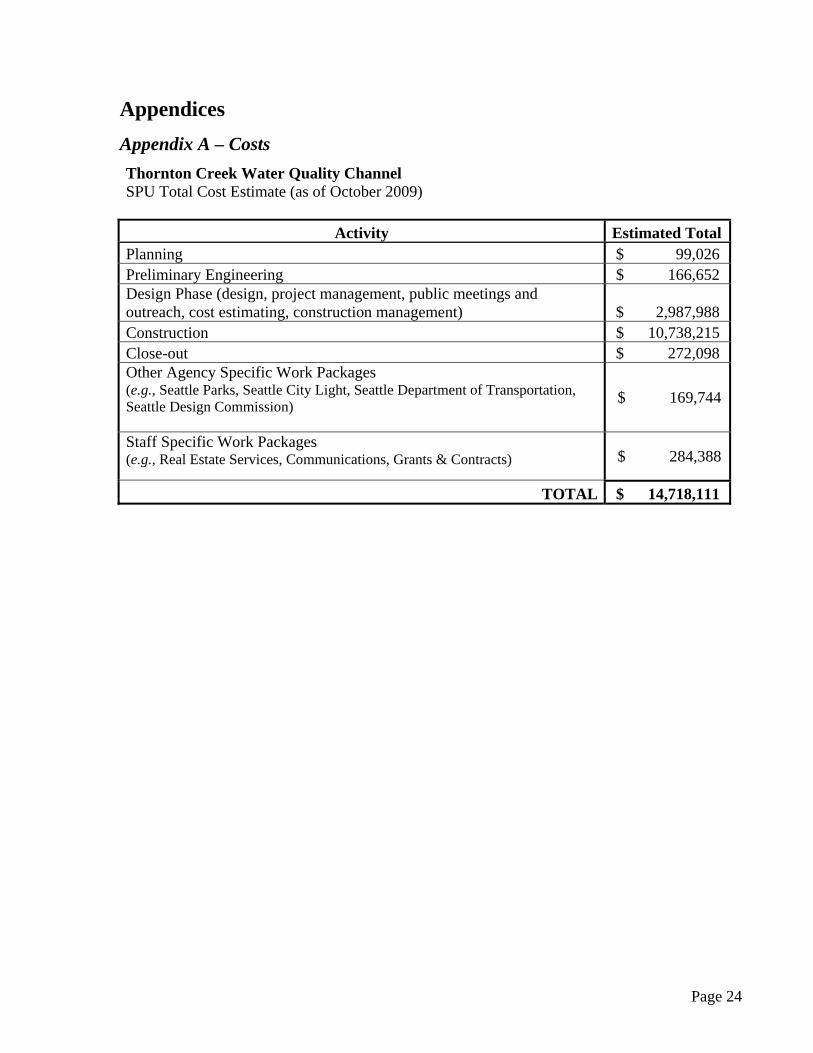
Appendices Appendix A – Costs Thornton Creek Water Quality Channel SPU Total Cost Estimate (as of October 2009)
Activity Estimated TotalPlanning $ 99,026 Preliminary Engineering $ 166,652 Design Phase (design, project management, public meetings and outreach, cost estimating, construction management) $ 2,987,988 Construction $ 10,738,215 Close-out $ 272,098 Other Agency Specific Work Packages (e.g., Seattle Parks, Seattle City Light, Seattle Department of Transportation, Seattle Design Commission)
$ 169,744
Staff Specific Work Packages (e.g., Real Estate Services, Communications, Grants & Contracts)
$ 284,388
TOTAL $ 14,718,111

Page 25
Appendix B – Signage