THIS REPORT CONTAINS ASSESSMENTS OF COMMODITY … GAIN Publications/Biofuels Annual... · Recent...
18
THIS REPORT CONTAINS ASSESSMENTS OF COMMODITY AND TRADE ISSUES MADE BY USDA STAFF AND NOT NECESSARILY STATEMENTS OF OFFICIAL U.S. GOVERNMENT POLICY Required Report - public distribution Date: 8/13/2018 GAIN Report Number: ID1823 Indonesia Biofuels Annual Indonesia Biofuels Annual 2018 Approved By: Garrett McDonald Prepared By: Arif Rahmanulloh Report Highlights: Indonesia biodiesel production is forecast slightly higher in 2018, as the Public Service Obligation (blending mandate) program continues and exports rise. Indonesia does not import biodiesel. Biodiesel consumption was slightly down in 2017, but expected to increase in 2018 assuming the mandate will be extended to the mining industry and diesel trains. Indonesia biodiesel exports dropped to a mere 187 million liters in 2017, the lowest level since 2006. Post expects 2018 biodiesel exports to rise to one billion liters following the removal of EU anti-dumping duties and sales growth to other markets.
Transcript of THIS REPORT CONTAINS ASSESSMENTS OF COMMODITY … GAIN Publications/Biofuels Annual... · Recent...

THIS REPORT CONTAINS ASSESSMENTS OF COMMODITY AND TRADE ISSUES MADE BY
USDA STAFF AND NOT NECESSARILY STATEMENTS OF OFFICIAL U.S. GOVERNMENT
POLICY
Required Report - public distribution
Date: 8/13/2018
GAIN Report Number: ID1823
Indonesia
Biofuels Annual
Indonesia Biofuels Annual 2018
Approved By:
Garrett McDonald
Prepared By:
Arif Rahmanulloh
Report Highlights:
Indonesia biodiesel production is forecast slightly higher in 2018, as the Public Service Obligation
(blending mandate) program continues and exports rise. Indonesia does not import biodiesel. Biodiesel
consumption was slightly down in 2017, but expected to increase in 2018 assuming the mandate will be
extended to the mining industry and diesel trains. Indonesia biodiesel exports dropped to a mere 187
million liters in 2017, the lowest level since 2006. Post expects 2018 biodiesel exports to rise to one
billion liters following the removal of EU anti-dumping duties and sales growth to other markets.

Post:
Jakarta
Section I. Executive Summary
While the biodiesel industry has grown dramatically since 2006, ineffective support programs and
insufficient supply chain infrastructure have caused biodiesel use to fall far short of aggressive mandates
(use goals) and the nascent fuel ethanol market completely disappeared after 2009.
In 2015, Indonesia established a new, more effective financial support mechanism for biodiesel
blending, and reaffirmed blending mandates for the Public Service and Non-Public Service
transportation sector as well as for industry and power generation. Of these, the only two where some
progress toward meeting the mandate has occurred are most importantly the 1) the Public Service
Obligation (PSO) for Transportation which accounts for about 90% of the country’s diesel use, and
secondly 2) electrical power. Support is provided to biodiesel producers by covering the price gap
between biodiesel and fossil diesel utilizing revenue collected from a palm oil export levy.
The Ministry of Energy and Mineral Resource (MEMR) reports Indonesia’s 2017 biodiesel production
at 3.416 billion liters, a slight decrease from the 2016 level. Post expects 2018 biodiesel production will
partially recover to 3.9 billion liters as domestic use rises and exports increase following the EU’s
settlement of a WTO anti-dumping case in March 2018 and sales increases to other markets. Significant
challenges remain for biodiesel exports. Recent U.S. anti-dumping and countervailing duties have shut
Indonesia out of the U.S. market for the next five years, and the EU’s emerging Renewable Energy
Directive (RED) II (covering 2020-2030 biofuels policy) is expected to set a cap on the use of crop-
based biofuels and may eliminate palm oil use in biofuels from the program by 2030. The EU followed
by the United States are the world’s largest biodiesel markets. Barred from a larger presence in these
markets (as well as most other mid-size markets where there is little to no trade opportunity), there is
little chance Indonesia will return to its record annual export sales near or above 1.5 billion liters (2011-
14) in the near future unless unexpected developments open the markets of China and India.
Biodiesel consumption is expected to increase to 3.3 billion liters in 2018 as the diesel pool grows and
the blending mandate is progressively extended to the mining and rail transport sectors. Of further note,
in July 2018, the Minister of Industry, Airlangga Hartarto, noted that President Joko Widodo “Jokowi”
had requested the blending mandate be increased to 30 percent to help overcome protectionist policies in
overseas markets. Though his comments were not specific, he was likely referring specifically to the
PSO sector.
Indonesia’s molasses based bioethanol industry continues to face challenges. Currently, there is no fuel-
grade ethanol production in Indonesia, although there are ethanol plants producing non-fuel ethanol for
the medical industry, cosmetics, other industrial uses and export. Despite ethanol-blending mandates of
E5 and E10 by 2020 and E20 by 2025, there is no implementation due to lack of financial incentives
covering price disparity as well as feedstock constraints.
Section II. Policy and Program

Indonesia’s biofuels program is a key component of the National Energy Policy (KEN), as formalized in
Government regulation 79/2014. KEN targets 23 percent renewable energy use nationally by 2025 and
31 percent in 2050. These amounts roughly translate to 13.9 billion liters and 52.3 billion liters of
biofuels production, respectively.
Indonesia began adopting biofuels policy at national level in 2006 by issuing Regulation 1 governing the
procurement and usage of biofuels. In support of Regulation 1, Presidential decree 20/2006 established a
National Biofuels Development Team, responsible for supervising the implementation of biofuel
programs and creating a blueprint for biofuels development. According to the blueprint, biofuels
development aims to (1) alleviate poverty and unemployment, (2) drive economic activities through
biofuel procurement and (3) reduce domestic fossil fuel consumption. This regulation was followed by
Indonesia’s House of Representative (DPR), which passed Energy Law (UU 30/2007) to strengthen
regulations prioritizing the use of renewable energy. Read earlier report here.
Renewable Energy and GHG Emissions
Indonesia is committed to reduce greenhouse gas emissions (GHG) that include the energy and
transportation sectors. Through the Intended Nationally Determined Contribution (INDC) submitted to
the UNFCC in 2016 documents, Indonesia commits to reduce 29 percent of total national GHG
emissions by 2030 through domestic ventures or 41 percent with international assistance.
Within the energy sector, the BAU (Business as usual) emission scenario below shows emissions
without consideration of climate change mitigation policy. The CM1 (Counter Measure 1) emission
scenario with mitigation, considers sector targets without international support. The CM 2 emission
scenario considers sector targets with international support. Emission reductions for the energy sector
assume biodiesel use, specifically B30, within transportation sector is 90 percent under CM1 and 100
percent under CM2.
Table 1 Indonesia GHG emission reduction within Energy Sector
GHG emission level 2010
(MTonne CO2e)
GHG emission level 2030
(MTone CO2e) GHG emission reduction
BAU CM1 CM2 MTone CO2e Percent of BAU
CM1 CM2 CM1 CM2
453.2 1,669 1,355 1,271 314 398 11 14
Source: Ministry of Environment and Forestry (MEF)
Mandates and Pricing Formula for Biodiesel
A biofuel blending mandate was created in 2008 through MEMR Regulation 32. The blending mandate
was most recently revised through MEMR Regulation 12, released in March 2015.
MEMR regulation 12/2015 established biofuel-blending targets for transportation, industry and power
generation sectors. Read earlier report here.
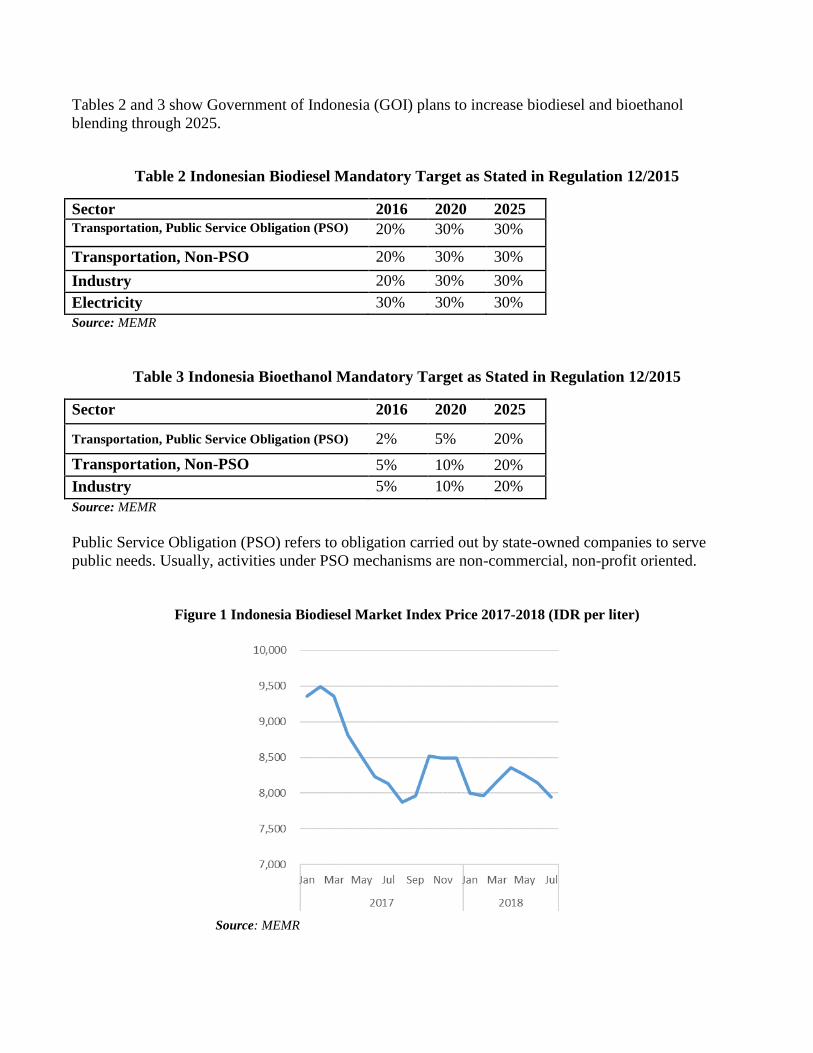
Tables 2 and 3 show Government of Indonesia (GOI) plans to increase biodiesel and bioethanol
blending through 2025.
Table 2 Indonesian Biodiesel Mandatory Target as Stated in Regulation 12/2015
Sector 2016 2020 2025
Transportation, Public Service Obligation (PSO) 20% 30% 30%
Transportation, Non-PSO 20% 30% 30%
Industry 20% 30% 30%
Electricity 30% 30% 30%
Source: MEMR
Table 3 Indonesia Bioethanol Mandatory Target as Stated in Regulation 12/2015
Sector 2016 2020 2025
Transportation, Public Service Obligation (PSO) 2% 5% 20%
Transportation, Non-PSO 5% 10% 20%
Industry 5% 10% 20%
Source: MEMR
Public Service Obligation (PSO) refers to obligation carried out by state-owned companies to serve
public needs. Usually, activities under PSO mechanisms are non-commercial, non-profit oriented.
Figure 1 Indonesia Biodiesel Market Index Price 2017-2018 (IDR per liter)
Source: MEMR

In 2016, through MEMR Regulation 6034, GOI revised the market index price formula to strengthen the
incentive for bioethanol production. The new formula switched from an Argus price-based formula to
domestic molasses price formula published by state-owned agricultural trade company Kharisma
Pemasaran Bersama (KPB).
MEMR further revised the formula for the biodiesel market index price in May 2017. The new formula
lowers the biodiesel conversion factor from 125 USD/MT to 100 USD/MT, implying a decrease in the
amount paid per unit through biodiesel fund to the producers. As stated in the MEMR regulation 2026,
the revision aims to increase both “production efficiency” as well as biofuel consumption.
Financial Supports
In 2015, a financial support mechanism was created to support domestic biodiesel consumption.
Managed by the Oil Palm Plantation Fund Management Agency (BPDPKS), funds are collected from a
palm oil export levy to offset price gap between biodiesel and fossil diesel. The agency also uses the
fund for research and development, replanting and palm promotion activities. From 2015-2017 the fund
collected USD 2.3 billion (IDR 32.9 trillion), and has disbursed for biodiesel incentive USD 1.7 billion
(IDR 24.71 trillion) from 2015 to April 2018.
Figure 2 Funds Collected from Palm Oil Export Levy and Distributed for Biodiesel Program
(IDR trillion)
Source: media reports, BPDPKS
Every six months, MEMR announces biodiesel allocation quantities for biodiesel business entities
(producers) who are eligible to supply state-owned Pertamina and AKR (a private company that receives
distribution assignment from GOI for PSO diesel). Eligible producers are awarded volume based on
their capacity. MEMR is responsible for verifying the delivery of biodiesel from producer to
Pertamina/AKR. BPDPKS uses the verification result to disburse funds to the producers (see Figure 2).

Figure 3 Indonesia Biodiesel Support Fund Mechanism
Source: BPDPKS
Duty Rates, Export Taxes and Export Levy
Ministry of Finance (MOF) Regulation 6/2017 states the latest import duties for both undenatured
ethanol (HS code 2207.10) and denatured ethanol (HS code 2207.20).
Table 4 Import Duties on Biofuels
HS
Code
Description Duty Rate
(percent)
2207.10 Undenatured ethanol 30
2207.20 Denatured ethanol 30
3826.001 Biodiesel, with Coconut methyl ester (CME) content more than 70
percent
5
3826.002 Biodiesel, with ester alkyl content more than 96.5 percent 5
2710.20 Petroleum oils containing up to 30 percent biodiesel 0 Source: MOF
Indonesia is bound by several trade agreements, providing a lower duty on ethanol imports from
ASEAN member states, Japan and South Korea.
Table 5 Trade Agreements Providing Lower Ethanol Imports Duties to Indonesia
Trade Agreement Tariff Regulation Ethanol Import Duty (HS Code 2207)
ATIGA ASEAN MOF Regulation 25/2017 0 percent
AKFTA ASEAN-Korea MOF Regulation 24/2017 5 pct (2017 onward)

IJEPA Indonesia – Japan MOF Regulation 30/2017 11.25 pct (2017)
9.38 pct (2018)
7.5 pct (2019)
5.63 pct (2020)
3.75 pct (2021)
1.88 pct (2022)
0 pct (2023 onward)
AJCEP ASEAN - Japan MOF Regulation 18/2018 13.82pct (2018)
12.35pct (2019)
10.88pct (2020)
9.41pct (2021)
7.94 pct (2022)
6.47 pct (2023)
5 pct (2024)
5 pct (2025 onward) Source: MOF
In addition to import duties, Indonesia also imposes exports taxes and an export levy on biodiesel and its
main feedstock, Crude Palm Oil (CPO). Under MOF regulation 136/2015, the export tax is based on
CPO reference price. There is zero export tax on CPO for prices below $750 per ton and for biodiesel
prices below $1000 per ton. Once reference prices exceed these levels, the tax is imposed on a sliding
scale.
The Export Levy on CPO and biodiesel, based on MOF regulation 133/2015, is a fixed flat rate.
Table 6 Export duties on CPO and Biodiesel
HS Code Description
Export Tax
(USD per
ton)
Levy
(USD per
ton)
1511.1000 Crude palm oil (CPO) 0 - 200 50
3826.0090 Biodiesel contains Palm methyl ester (PME) more than
96.5 percent
0 - 64 20
Note: See table on export duties in the last section “Notes on Statistical Data.”
Environment Sustainability and Certification
Indonesia has no specific regulation on biofuel sustainability criteria for domestically consumed
biodiesel. However, there are several sustainability certification schemes available for palm oil
production, such as RSPO and ISPO. Programs cover a range of common sustainability criteria
including greenhouse gas (GHG) emissions, land use, biodiversity and labor. They apply only to palm
oil and palm oil biodiesel exported to countries that have sustainability requirements for these products.
The EU focus on biofuel sustainability criteria, translated into policy outlined in the Renewable Energy
Directive (RED) and emerging RED II, weighs heavily on the Indonesian biofuels sector, and is a
constant source of complaints among high-level GOI officials to their EU counterparts. The RED II will
reportedly (text is not yet available) set out the criteria for certification of two categories of crop-based
biofuels in relation to the indirect land-use change (ILUC) risk:

1. High ILUC risk: Biofuels produced from crops in areas where there has been significant recent
expansion of the production area into land with high carbon stock (wetlands, peat lands and
forests).
2. Low ILUC risk: low indirect land-use change risk
The GOI continues to oppose EU attempts to regulate biofuels and has engaged other palm producing
countries to counter the measures, recently winning support from Malaysia’s new Prime Minister.
Section III. Gasoline and Diesel Pools
Total Indonesian fuel sales are slightly lower in the last few years compared to record highs set in 2012-
14 with declines in diesel used in transport and stationary power for industry more than offsetting
upward trends in gasoline and jet fuel pools. Conversion to coal-fired power plants by PLN has lowered
diesel consumption for stationary power.
Figure 4 Gasoline and Diesel Consumption 2011-2016 (billion liter)
Source: MEMR, PLN Statistic
Indonesian gasoline subsidies were removed in 2015 with the collapse in oil prices. As a result, the price
gap between various qualities of light duty fuels fell and fuel consumption shifted slightly to higher-
octane fuels. As crude oil price increased up during 2016-2017, Pertamina began to adjust the price of
higher-octane fuels such as Pertalite (Ron 90) and Pertamax (Ron 92). However, no price adjustments
have been made for PSO fuels such Premium and diesel.
Table 7 Gasoline retail price (IDR per liter) and sale share
Type of
Gasoline
Brand Sale share
2016
Price as of January,
2017
Price as of July,
2018

Gasoline RON
88
Premium 66.5 percent 6550 6550
Gasoline RON
90
Pertalite 17.8 percent 7350 7800
Gasoline RON
92
Pertamax 14.6 percent 8050 9500
Gasoline RON
95
Pertamax
Plus
0.9 percent 8750 N.A
Gasoline RON
98
Pertama
Turbo
0.2 percent 9100 10700
Note: Pertamina began to switch from Pertamax plus to pertamax turbo in 2017. Price for Java and Bali area. Source:
MEMR, BPH Migas
Gas retailers offer different fuel prices in each region or province. In general, Java and Bali receive the
lowest pricing, while eastern Indonesia sees the highest due to logistical costs. Fuel prices in remote
areas such in Papua may reach two or three times prices on Java. The GOI program on single fuel price
(BBM Satu Harga) aims to provide fair price for fuel in remote areas, mainly for PSO fuel. There are 73
points of sale established under this program in 2018 and will increase to about 170 points in 2019.
Table 8 Diesel retail price (IDR per liter) and sale share
Type of Diesel Brand Sale share
2016
Price as of January,
2017
Price as of July,
2018
Diesel CN 48 (ADO,
HSD)
Solar,
Biosolar
95 percent 5150 5150
Diesel CN 51 Dexlite 0.4 percent 7200 9000
Diesel CN 53 Pertamina
Dex
0.3 percent 8500 10500
Note: Price for Java and Bali area. Source: MEMR, BPH Migas
In response to recent crude oil price increases, GOI announced a plan to increase the fuel subsidy for
diesel from IDR 500 per liter to IDR 1000 per liter. GOI has not re-established a subsidy for gasoline;
however, a price review is conducted quarterly to determine if adjustments may be necessary to
Premium grade prices based on international prices.
Table 9 Indonesia, Fuel Use History
Fuel Use History (Million Liters)
Calendar Year 2009
2010
2011
2012
2013
2014
2015
2016
2017e
2018e
Gasoline Total 22,132
23,863
26,447
29,276
30,511
30,925
31,528
32,706
33,034
33,365
Diesel Total 33,62
5
36,45
0
37,49
7
37,74
3
36,12
4
34,65
1
30,91
2
28,97
4
29,26
4
29,55
7
All Surface transports
24,21
6
27,12
5
26,03
0
29,52
8
28,64
9
27,22
0
25,43
3
24,30
7
25,66
6
26,14
6
Industry 9,409 9,325 11,46
7
8,215 7,474 7,431 5,479 4,667 3,598 3,411
Jet Fuel Total 2,762 3,530 3,270 3,901 4,162 4,231 4,340 4,668 4,715 4,762

Total Fuel
Markets
58,51
9
63,84
2
67,21
4
70,92
0
70,79
7
69,80
7
66,77
9
66,34
9
67,01
3
67,68
4
Source: MEMR, e = Post estimation
Section IV. Ethanol
Consumption
Indonesia’s FGE consumption has remained virtually zero since 2010 due to lack of financial support to
run the blending program and a mandate that was never enforced. From 2006-2009, Pertamina was able
to sell E2 gasoline on a limited basis due to state subsidies covering the price difference bioethanol and
gasoline. However, due to increasing costs of production for FGE and limited state-budget for
subsidies, Pertamina received limited supplies from ethanol producers.
In February 2018, MEMR announced a plan to implement bioethanol blending of E2 in several big
cities, most likely in East Java due to proximity with ethanol producer plants. Unlike the broad-based E2
program in the past, which was supported by the state-budget fund, this pilot program may target only
high-octane gasoline where the price difference with ethanol is narrower. Industry sources indicate the
plan is still under discussion between Pertamina and local ethanol producers.
Non-FGE demand originates from various industries including perfumes, cosmetics, pharmaceutical and
chemical solvents. Post expects consumption of this industrial grade ethanol (IGE) to reach 138 million
liters in 2018 as it continues to trend upwards.
Production
FGE production become unfeasible following the end of GOI’s limited blending support. As a result,
ethanol distillers switched their entire production to meet industrial grade demands. Post expects
industrial ethanol production to increase from 195 million liters in 2017 to 200 million liters in 2018.
Indonesia’s 2018 ethanol refinery capacity, both active and idle, remains unchanged at 408 million
liters. Only 3 out of 14 plants remain capable to produce FGE, with total FGE capacity at 100 million
liters.
Molasses is the feedstock for Indonesia ethanol production. More than 60 sugarcane mills are currently
active and produce molasses. Indonesia sugarcane industry is expected to produce 2.2 million tons
sugar in 2018/19 from 29.5 million tons of sugarcane (Sugar: World Market and Trade), resulting 1.475
million tons of molasses available. To produce 200 million liters of ethanol, industry requires roughly
815,000 tons of molasses. However, Indonesia’s ethanol industry is not the only consumer of molasses.
Lucrative overseas markets and demands from the monosodium glutamate industry complete with
ethanol industry.
Indonesia’s import restrictions on cheaper, more widely available feedstock such as corn continue to
hinder the growth and viability of local ethanol producers.
MEMR formulates Bioethanol Market Index price (Figure 5) based on molasses price. The Bioethanol
price fell from IDR 11,049 per liter in January 2017 to IDR 10,210 in June 2018.

Figure 5 Bioethanol and high-octane gasoline price (IDR per liter)
Source: MEMR, BPH Migas
Trade
Indonesian ethanol exports decreased 10 percent in 2017, from 71 million liters in 2016 to 64 million
liters. Industry sources cite increasing prices for molasses in 2017 as well as leading cause of the
decline. Most ethanol exports were shipped to the Philippines or Japan. Trade data shows, during Jan-
April 2018 period ethanol exports reached 21 million liters, 12 percent higher than the corresponding
period in 2017. Post expects ethanol exports to reach 65 million liters in 2018.
Indonesia currently does not import any fuel-grade ethanol and only very limited volumes for other
industrial uses. The 30 percent duty on ethanol not only benefits local ethanol distillers, but also the
domestic sugar industry, which provides the molasses feedstock. Import opportunities are further
limited by a general lack of competition, Pertamina’s dominance in the energy sector, and GOI’s greater
focus on biodiesel supported by the world’s largest palm industry. As with many commodities, GOI
agricultural policy of “self-sufficiency” remains an over-arching barrier to trade. Even at competitive
prices, it seems unlikely Indonesia would embrace ethanol imports, as has been the case with both rice
and corn for feed use. Recent declines in the rupiah and concerns over U.S. trade actions have only
increased Indonesia’s tendency towards protectionist policies and shifted economic focus further
towards import substitution.
Production, Supply and Demand Statistics

Calendar Year 2009 2010 2011 2012 2013 2014 2015 2016 2017 2018f
Beginning Stocks 31 42 36 42 52 39 14 16 15 14
Fuel Begin Stocks 0 0 0 0 0 0 0 0 0 0
Production 172 175 220 205 207 202 205 205 195 200
Fuel Production 2 0 0 0 0 0 0 0 0 0
Imports 0 0 1 0 0 2 0 2 5 5
Fuel Imports 0 0 0 0 0 0 0 0 0 0
Exports 33 49 81 59 86 94 67 71 64 65
Fuel Exports 0 0 0 0 0 0 0 0 0 0
Consumption 128 132 134 135 135 135 136 137 137 138
Fuel Consumption 1 0 0 0 0 0 0 0 0 0
Ending Stocks 42 36 42 52 39 14 16 15 14 16
Fuel Ending Stocks 0 0 0 0 0 0 0 0 0 0
Total BalanceCheck 0 0 0 0 0 0 0 0 0 0
Fuel BalanceCheck 0 0 0 0 0 0 0 0 0 0
Number of Refineries 12 14 14 15 15 13 14 14 14 14
Nameplate Capacity 288 342 392 378 408 408 408 408 408 408
Capacity Use (%) 60% 51% 56% 54% 51% 50% 50% 50% 48% 49%
Molasses 7 0 0 0 0 0 0 0 0 0
Fuel Ethanol 1 0 0 0 0 0 0 0 0 0
Gasoline 22,132 23,863 26,447 29,276 30,511 30,925 31,528 32,706 33,034 33,365
Blend Rate (%) 0% 0% 0% 0% 0% 0% 0% 0% 0% 0%
Ethanol Used as Fuel and Other Industrial Chemicals (Million Liters)
Production Capacity (Million Liters)
Feedstock Use for Fuel (1,000 MT)
Market Penetration (Million Liters)
Section V. Biodiesel
Consumption
Indonesian biodiesel consumption is driven by the blending mandate program, and supported by funds
from CPO exports levy. Consumption is primarily used for the on-road transportation sector, with a
small fraction used for electricity generation.
The PSO transportation sector (on-road transport) accounts for nearly 90 percent of biodiesel consumed
in Indonesia. Whereas the Non-PSO transport sector has a zero percent blend rate and has yet to
implement B20, the PSO transport is meeting its 20 percent mandatory blend target.
State-run electric utility PLN is already using B30; however, the effective blending rate is between 8 and
12 percent depending on whether a comparison is made with diesel use in all power generation or only
diesel used in high-speed diesel (HSD). PLN usage is primarily in diesel power plants located in remote
areas.

In 2017, biodiesel consumption fell 14 percent to 2.572 billion liters due to a technical issue on military
vehicles found during the third allocation period. GOI then lowered biodiesel allocation to 1.37 billion
liters for May to October 2017 delivery.
Table 10 Biodiesel Allocation 2015-2018
Allocation Period No Supplier Total Allocation (billion liters)
1st Nov 2015 - April 2016 12 1.87
2nd May - Oct 2016 16 1.53
3rd Nov 2016 - April 2017 17 1.53
4th May - Oct 2017 20 1.37
5th Nov 2017 - April 2018 21 1.41
6th May - Oct 2018 19 1.46
Source: MEMR
GOI is preparing to implement B15 for mining (industry sector mandate) and B5 for train transport
(Non-PSO sector mandate) this year.
Post expects 2018 consumption to reach 3.3 billion liters, assuming normal conditions, relatively stable
domestic demand for transport diesel, and the continued implementation of the CPO fund. Some
additional factors that may affect 2018 consumption include:
GOI plans to implement B25 for PSO transport sector in 2019. This plan aligns with Regulation
12/2015, which indicates that the B30 mandate is scheduled for 2020.
GOI plans to expand the biodiesel mandate to include mining industry and train sector. A rail test
is being conducted by state-owned train company (KAI) on long-haul, heavy train locomotives to
see the impact of B20 use on engine performance. GOI expects the trial to complete in July
2018.
In the meantime, funds from the export levy continue to accumulate. Although there is a mandate for 20
percent biodiesel in the PSO transport, non-PSO transport, industry and electricity sector, the
disbursement of funds from the BPDPKS fund is only authorized for PSO transport and electricity. The
disbursement of funds requires a higher-level government decree beyond the mandated regulation. As a
result, until now the mandate for non-PSO transport and industry has not been enforced. This appears
likely to change as the government looks to tap the fund to extend subsidized biodiesel production to
other sectors and further utilize excess biodiesel production capacity.
Production
Based on MEMR data, Indonesia biodiesel production decreased from 3.656 billion liters in 2016 to
3.416 billion liters in 2017. The declining production in 2017 was closely linked with the reduction in
domestic consumption since almost 95 percent of production was consumed domestically.
Production during January to May 2018 reached 2.3 billion liters, 59 percent higher than corresponding
period in 2017. Post expects 2018 production to reach 3.9 billion liters due to increased overseas

demand (mostly from Europe to meet RED goals, but some of which may come from discretionary
blending with higher crude oil prices) and the expectation of higher domestic use.
Figure 6 Indonesia Biodiesel Production (KL)
Source: Aprobi
Recently MEMR released new biodiesel allocations for May to October 2018 delivery period with total
quantity of 1.46 billion liters. A total of 19 producers received contracts for this period with volume
allocations varying from 38 to 220 million liters.
Indonesian biodiesel production capacity has grown from about 4.9 billion liters in 2012 to about 11.5
billion liters in 2017. While capacity has grown significantly since 2012, actual production growth has
been much slower resulting in a notable decline in capacity use now estimated around 30 percent.
Low production capacity use demonstrates that producers rely heavily on subsidy scheme to run
profitable operations. The overall market viability depends heavily on the global price of crude oil but
also CPO prices. Indonesian biodiesel prices decreased 13 percent from early 2017 to June 2018,
following the movement of CPO price. Decreasing biodiesel price creates opportunity to narrow the
amount of incentive covered by BPDPKS, especially as oil prices fall, which has recently been the case.
Trade
Indonesia does not import biodiesel other than small amounts from Malaysia on occasion. However,
Indonesia is one of the largest world exporters, and competed with Argentina as the top exporter from
2011 thru 2014. The EU, United States and on occasion China have been its largest overseas markets.
Last year, exports suffered a severe decline and the worst showing in many years with arbitrage to the
EU open only part of the year and no sales to the United States.
Indonesian biodiesel exports in 2017 fell to the lowest level since 2006, reaching only 187 million liters.
Exports will recover to some extent this year. Trade data indicates shipments during January to April
2018 have already reached more than 200 million liters. Industry sources reported shipments to EU
resumed in May, following the EU’s settlement of a WTO anti-dumping case in March 2018. In
addition to Spain and Italy, biodiesel exports destinations in early 2018 include Peru and Malaysia. Post

expects 2018 exports to reach one billion liters supported largely by large gains to Europe and other
markets.
Indonesian exports of biodiesel to the U.S. ended in November 2016, following a lapse in the $1/gallon
blender tax credit. Subsequently, the U.S. Department of Commerce and U.S. International Trade
Commission launched antidumping (AD) and countervailing duty (CVD) investigations, and imposed
high preliminary duties, which have now been finalized. Biodiesel exports from Indonesia are now
subject to AD duties of up to 277 percent and CVD duties of up to 65 percent. With duties this high, the
arbitrage window for Indonesian biodiesel exports to the United States will be closed until 2022 if the
duties remain in place.
In February 2018, GOI responded to the AD/CVD determinations by bringing the case to the World
Trade Organization (WTO). The Ministry of Trade (MOT) contends the methodologies for calculating
dumping and assigning dumping margins are inconsistent with WTO rules. Other government officials
have cited the AD/CVD case in reference to draft regulations that would restrict the import of U.S.
soybeans, the number one U.S. agricultural export to Indonesia.
Figure 7. Indonesia biodiesel monthly shipments 2014-2016 (million liter)
Source: GTA
Stocks
Indonesia biodiesel stocks are up sharply since 2014, following sharply lower export sales and the start
of the new mandate program in late 2015. However, allocations under new mandate program have been
running below expectations, especially on non-subsidy diesel, which has in turn kept stocks high and
rising. Much higher exports in 2018 should lower stocks somewhat.
Production, Supply and Demand Statistics

Calendar Year 2009 2010 2011 2012 2013 2014 2015 2016 2017 2018f
Beginning Stocks 15 22 16 29 27 11 559 1,009 1,181 1,839
Production 330 780 1,812 2,270 2,950 3,962 1,653 3,656 3,416 3,900
Imports 0 0 0 5 24 0 0 0 0 0
Exports 204 563 1,440 1,608 1,942 1,569 343 476 187 1,000
Consumption 119 223 359 669 1,048 1,845 860 3,008 2,572 3,300
Ending Stocks 22 16 29 27 11 559 1,009 1,181 1,839 1,439
BalanceCheck 0 0 0 0 0 0 0 0 0 0
Number of Biorefineries 20 22 22 22 26 26 27 30 32 31
Nameplate Capacity 3,128 3,921 3,921 4,881 5,670 5,670 6,887 10,898 11,547 11,357
Capacity Use (%) 10.5% 19.9% 46.2% 46.5% 52.0% 69.9% 24.0% 33.5% 29.6% 34.3%
Crude Palm Oil (CPO) 304 718 1,667 2,088 2,714 3,645 1,521 3,363 3,143 3,588
Biodiesel, on-road use 95 178 287 535 838 1,476 665 2,621 2,272 2,950
Diesel, all surface transport 24,216 27,125 26,030 29,528 28,649 27,220 25,433 24,307 25,666 26,146
Blend Rate (%) 0.4% 0.7% 1.1% 1.8% 2.9% 5.4% 2.6% 10.8% 8.9% 11.3%
Diesel, total use 33,625 36,450 37,497 37,743 36,124 34,651 30,912 28,974 29,264 29,557
Biodiesel (Million Liters)
Production Capacity (Million Liters)
Feedstock Use for Fuel (1,000 MT)
Market Penetration (Million Liters)
Source and note: MEMR, GTA (trade data), Post estimation
Section VI. Advanced Biofuels
The development of 2nd
generation biofuels is led by Indonesia Institute of Science (LIPI). Research is
mainly focused on producing lignin cellulose ethanol from palm solid wastes, and harnessing waste
products from palm oil plantations. The institute currently operates a small plant capable of producing
fuel-grade ethanol from empty palm fruit bunches.
Section VII. Notes on Statistical Data
Fuel Use History
Gasoline, diesel and jet fuel use history figures in Table 9 are based on MEMR Handbook of Energy &
Economic Statistics of Indonesia 2017, specifically for 2009-2016. Year 2017 and 2018 are Post
estimates based on Indonesia economic growth (2017) and World Bank (2018) forecasts.
Bioethanol
Bioethanol market index prices in Figure 5 based on MEMR publications. MEMR calculate Bioethanol
market index price uses molasses reference price. “Premium” refers to an Indonesian gasoline blend
with RON 88 quality.

2017 2018 2017 2018 2017 2018
Jan 1,864 1,625 11,049 10,090 6,550 6,550
Feb 1,864 1,625 11,036 10,059 6,550 6,550
Mar 1,864 1,625 11,026 10,083 6,550 6,550
Apr 1,864 1,625 11,028 10,140 6,550 6,550
May 1,864 1,625 11,028 10,147 6,550 6,550
Jun 1,864 1,625 11,020 10,210 6,550 6,550
Jul 1,830 1,533 10,874 9,900 6,550 6,550
Aug 1,830 10,885 6,550
Sep 1,731 10,475 6,550
Oct 1,660 10,168 6,550
Nov 1,625 10,074 6,550
Dec 1,625 10,088 6,550
Month
Molasses Price
(IDR/kg)
Gasoline 88
(Premium) Price
(IDR/liter)
Bioethanol Market
Index Price (IDR/liter)
Source: MEMR
Biodiesel
Production and consumption figures are based on MEMR statistics. Trade figures are based on Global
Trade Atlas (GTA), under HS code 3826.00 and 2710.20. This report assumes that all product moving
under these codes are B100 and B5, respectively.
Biodiesel market index prices in Figure 1 collected from MEMR publications. The following table
compiles CPO reference prices used to calculate biodiesel market index price that published monthly by
MEMR. Diesel price, called “Solar” price refers to PSO diesel fuel.
2017 2018 2017 2018 2017 2018
Jan 9,082 7,841 9,362 8,000 5,150 5,150
Feb 9,238 7,810 9,493 7,962 5,150 5,150
March 9,089 8,029 9,358 8,161 5,150 5,150
Apri 8,463 8,230 8,815 8,356 5,150 5,150
May 8,129 8,118 8,520 8,261 5,150 5,150
Jun 8,210 7,954 8,230 8,140 5,150 5,150
July 8,016 7,740 8,131 7,949 5,150 5,150
Aug 7,712 7,871 5,150
Sept 7,822 7,965 5,150
Oct 8,462 8,518 5,150
Nov 8,411 8,490 5,150
Dec 8,406 8,491 5,150
Month
CPO Reference Price
(IDR/kg)
Biodiesel market
index price (IDR /liter)
Diesel price (Solar),
PSO (IDR/liter)
Source: MEMR

The following table shows CPO reference price that used by MOT to determine both CPO export duty
and Palm Methyl Ester (PME) / biodiesel export duty.
2017 2018 2017 2018 2017 2018
Jan 788 697 3 0 0 0
Feb 816 694 18 0 0 0
March 826 709 18 0 0 0
Apri 763 712 3 0 0 0
May 732 703 0 0 0 0
Jun 723 687 0 0 0 0
July 726 678 0 0 0 0
Aug 698 0 0
Sept 697 0 0
Oct 740 0 0
Nov 738 0 0
Dec 743 0 0
PME Export Duty
(USD/MT)Month
CPO Reference Price
(USD/MT)
CPO Exports Duty
(USD/MT)
Source: Ministry of Trade (MOT) and MOF