
This presentation may contain forward-looking statements ...
39
1
Transcript of This presentation may contain forward-looking statements ...

1

2
This presentation may contain forward-looking statements that are subject to risks and uncertainties, including those pertaining to theanticipated benefits to be realized from the proposals described herein. Forward-looking statements may include, in particular,statements about future events, future financial performance, plans, strategies, expectations, prospects, competitive environment,regulation, supply and demand. Esprinet has based these forward-looking statements on its view and assumptions with respect to futureevents and financial performance. Actual financial performance could differ materially from that projected in the forward-lookingstatements due to the inherent uncertainty of estimates, forecasts and projections, and financial performance may be better or worsethan anticipated. Given these uncertainties, readers should not put undue reliance on any forward-looking statements. The informationcontained in this presentation is subject to change without notice and Esprinet does not undertake any duty to update the forward-looking statements, and the estimates and the assumptions associated with them, except to the extent required by applicable laws andregulations.

3

4
+20 years in business,3 geographies:
Italy, Spain & Portugal
Strong SMB and mid-market focus
31k customers
Working to provide the best customer
satisfaction
A real enabler of the use of technology for a
sustainable digital society
The most complete Tech product range
with 650 brands
MTA listedEsprinet S.p.a. listed on the
Italian Stock Exchange in 2001
2020 Sales 4.5 B€Esprinet S.p.a. undisputed market
leader with a strong track record as a consolidator
Consistent GrowthHistorical stable flow of profitability: 472 M€ of cumulated Net Profit and
135 M€ of cumulated dividends since 2001
1,600 people65% sales & marketing
35% back office54% female46% male
Strong Capabilities130,000 SKUs availableHighly efficient logistics processes and systems
With +155,000 sqm of warehouses

5
COMPANYSALES 2020
(M/€)SHARE
Pro-forma Esprinet & GTI (*) 4,658 26.6% • • •
Tech Data 3,036 17.3% • • •
Ingram Micro 2,346 13.4% • • •
Computer Gross 1,559 8.9% •
Arrow ECS 942 5.4% • •
Attiva 520 3.0% •
MCR 520 3.0% •
Datamatic 430 2.5% •
CPCDI 320 1.8% •
Depau 214 1.2% •
Brevi 205 1.2% •
Inforpor 185 1.1% •
JP Sa Couto 170 1.0% •
Globomatik 163 0.9% •
DMI Computer 162 0.9% •
Exclusive Networks 150 0.9% •
Ticnova 119 0.7% •
Brightstar 2020 116 0.7% •
Others 1,693 9.7% • • •
Total (°) 17,508 100%
(*) Esprinet: 4,491.6 M€ from January to December 2020; GTI: 166.3 M€ from January to September 2020.(°) Based on Company estimates on Context data: conversion from Context panel sales to total distri sales assuming Context Panel represents around 90% of total consolidated distri sales. Adjustment applied to Context panel gross sales of 6.5% (from gross revenue to net revenue).

6
(*) Italy-Spain-Portugal 2020 end-user market data at estimated distributor price – Internal comments by Esprinet S.p.A. on Data owned exclusively by GfK.(°) Change in the methodological setting with respect to the previous representations with estimates of coverage of total distribution sales by the Context panel differentiated by product category.
Total Market (A+B)(*) 8.4 5.5 15.9 29.8 10.8 40.6
A) Direct Channel & 1st Tier 0.2 1.9 11.0 13.1 10.0 23.1
B) 2nd Tier Distris (a+b+c) 8.2 3.6 4.9 16.7 0.8 17.5
2020 Weight Of DistrisOn Market(°)
98% 65% 31% 56% 8% 43%
2019 Weight Of Distris On Market 95% 67% 25% 50% 5% 37%
a) Professional Resellers 3.4 2.5 0.5 6.4 0.2 6.6
Weight On 2nd Tier 42% 70% 10% 38% 25% 38%
b) Specialized 1.9 0.7 1.1 3.7 0.2 3.9
Weight On 2nd Tier 23% 19% 22% 22% 25% 22%
c) Retailers & E-tailers 2.9 0.4 3.3 6.6 0.4 7.0
Weight On 2nd Tier 35% 11% 68% 40% 50% 40%

7
EITO figures for IT Clients - Advanced Solutions & Smartphones - Euromonitor for other Consumer electronicsEnd-user consumption converted to distri price assuming average 15% margin for resellers/retailers
Conversion from Context panel sales to Total distri sales assuming Context Panel represents around 90% of total consolidated distri sales with differences for product categories
Adjustment applied to Context panel gross sales of 6.5% (from gross revenue to net revenue)2021 end user market estimates by EITO & Euromonitor as of November 2020
2021 distri sales estimated using a flat growth of 5%
45,0%47,9%
49,8%
56,0%
60,1%
0,0%
10,0%
20,0%
30,0%
40,0%
50,0%
60,0%
70,0%
0,0
2,0
4,0
6,0
8,0
10,0
12,0
14,0
16,0
18,0
20,0
2017A 2018A 2019A 2020A 2021E
Direct sales of ICT products (ex-white goods) ICT distributor sales
Share in ICT products (ex-white goods)

8
• A similar trend towards a “Distributor Friendly” environment is now under development White Goods
• «As a Service» models will require further more the capability of integrating in a single easy-to-use interface for resellers the Consumption models of multiple vendors
ICT Distribution share on total ICT addressable sales grew from 40.0% (2016) to 56.0% (2020) and is forecasted to grow furthermore (60.1% expected in 2021).
• “Fulfilment deals” with Vendors on top selling items• Category management for accessories• Home delivery capabilities for White Goods and Large TVs• E-Tailers use Distributors as a one-stop-shopping for the “Long Tail” of products
• Reduction of distribution fixed cost• Buffering stock• Credit lines & Credit collection capabilities• Marketing capability• Need of an aggregator of their products into complex multi-vendor solutions
• Outsourcing of warehousing and shipping on their behalf• One-stop-information gathering point• One-stop-shopping opportunity• Easiness of doing business against dealing directly with vendors• No minimum quantity needed to be a valued partner

9
Vendors routinely operate with commercial programs that envisage significant amounts of price adjustments for multiple reasons such as:
• End-period accruals for target achievements;• Stock protection;• Pass through.
Customers as well are entitled to price adjustments such as:• End-period accruals for target achievements;• Pass through;• Co-marketing funds.
At any given quarter-end accruals are made to account for the credit notes pending reception from Vendors and credit notes pending issuing to customers.
According to the Group accounting policies periodically, typically at year end, a revision of the old accruals is done and the adjustments booked to the Gross Profit of the period.
Historically, given the accounting policies in place, this effect is positive and contributes to a spike in Gross Profit margins at year end.
Large and medium sized distributors routinely apply contracts with top-rated Credit Insurance Companies shielding the risk of default of debtors with deductibles typically between 10% to 15% of the insured value.
Trade receivables might be sold “without-recourse” to factoring entities or conduits of a trade receivables securitization program, typically major commercial banks but sometimes Vendor financing companies as well. When factoring/securitization happens, being a true-sale, no deductibles are involved and the credit risk is entirely transferred to the factoring company.
Sometimes distributors might takes some credit risk on their books by issuing a Credit Limit that exceeds the value of the Credit Insurance coverage.
Provided by the vast majority of Vendors in which they assume the risk of inventory devaluation arising from purchase list price reductions planned by the Vendor itself.
Vendors might allow the Distributor to purchase products based on a sales forecast agreed upon between the Vendor and the Retailer/Corporate Reseller. Vendors might guarantee the Distributor, either contractually or customarily, that those products will be sold with a predefined margin, essentially shielding the Distributor from the inventory risks that might arise from the need of reducing the sales price or disposing of unsold products.
On specific product categories, i.e. software or pre-packaged services, the Distributor is periodically allowed to ship back obsolete stock in exchange of new products of similar value.

10
Gross Profit Margin
Working Capital
Cost to Serve
Mid-High
Mid
Mid
Mid-High
Mid
Mid
High
Low
High
Low
Low
Low
Mid-High
Mid
Mid
Mid-High
Mid
Mid
Mid
Mid
Mid
Low
Low
Low
Mid
Mid
Mid
IFRS15 and other adjustment (75) M€

11
INVESTMENT CASE

12
CORE BUSINESS
• Customer Satisfaction
• PCs & Smartphones: volumes without additional fixed costs
• Organic & inorganic growth on Advanced Solutions and on Consumer Electronics high margin niches
IN PROGRESS
• Consumption Model: Cloud, DaaS and Managed Print Service to grow profitability
• Outsourcing of logistics & marketing to profit from high-added value lying in Tech without down or upstream integration
• Cash Conversion Cycle optimization
✓ Achieve industry standard levels in Inventory Days moving from > 40 days to low 30s
✓ Keep DSOs stable
✓ Keep DPOs stable leveraging on faster credit notes collection times and on opportunistic extra-payment terms
• Keep on growing businesses which imply low Working Capital absorption
✓ Consumption Models
✓ Outsourcing
✓ PCs & Smartphones
13
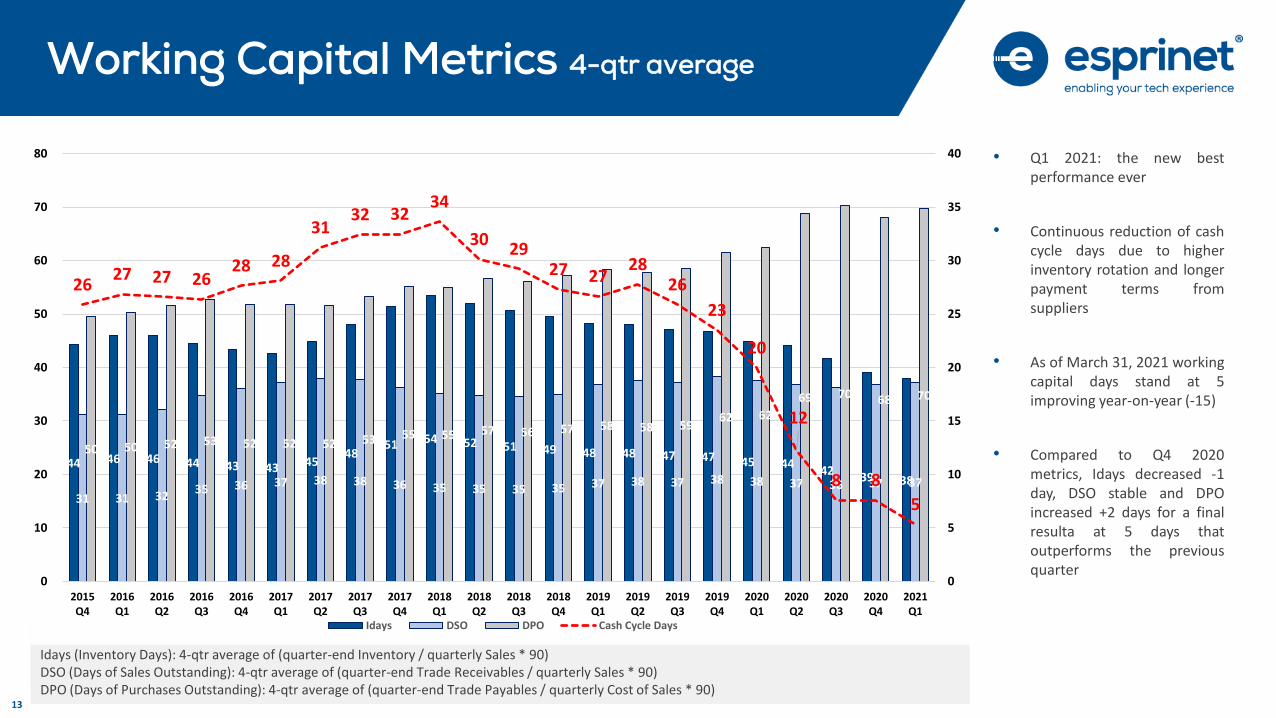
Idays (Inventory Days): 4-qtr average of (quarter-end Inventory / quarterly Sales * 90)DSO (Days of Sales Outstanding): 4-qtr average of (quarter-end Trade Receivables / quarterly Sales * 90)DPO (Days of Purchases Outstanding): 4-qtr average of (quarter-end Trade Payables / quarterly Cost of Sales * 90)
Working Capital Metrics 4-qtr average
• Q1 2021: the new bestperformance ever
• Continuous reduction of cashcycle days due to higherinventory rotation and longerpayment terms fromsuppliers
• As of March 31, 2021 workingcapital days stand at 5improving year-on-year (-15)
• Compared to Q4 2020metrics, Idays decreased -1day, DSO stable and DPOincreased +2 days for a finalresulta at 5 days thatoutperforms the previousquarter
Idays (Inventory Days): 4-qtr average of (quarter-end Inventory / quarterly Sales * 90)DSO (Days of Sales Outstanding): 4-qtr average of (quarter-end Trade Receivables / quarterly Sales * 90)DPO (Days of Purchases Outstanding): 4-qtr average of (quarter-end Trade Payables / quarterly Cost of Sales * 90)
44 46 46 44 43 43 45 48
51 54 52 51 49 48 48 47 47 45 44 42 39 38
31 31 32 35 36 37 38 38 36 35 35 35 35 37 38 37 38 38 37 36 37 37
50 50 52 53 52 52 52 53 55 55 57 56 57 58 58 59 62 62
69 70 68 70
2627 27 26
28 28
3132 32
34
3029
27 2728
26
23
20
12
8 8
5
0
5
10
15
20
25
30
35
40
0
10
20
30
40
50
60
70
80
2015Q4
2016Q1
2016Q2
2016Q3
2016Q4
2017Q1
2017Q2
2017Q3
2017Q4
2018Q1
2018Q2
2018Q3
2018Q4
2019Q1
2019Q2
2019Q3
2019Q4
2020Q1
2020Q2
2020Q3
2020Q4
2021Q1
Idays DSO DPO Cash Cycle Days

14
Idays (Inventory Days): quarter-end Inventory / quarterly Sales * 90DSO (Days of Sales Outstanding): quarter-end Trade Receivables / quarterly Sales * 90DPO (Days of Purchases Outstanding): quarter-end Trade Payables / quarterly Cost of Sales * 90
Working Capital Metrics quarter-end
• As of March 31, 2021 working capitaldays stand at 15.
• Inventory days amounted to 40 days,DSOs amounted to 41 days mainlyhaving reduced the recourse tofactoring, the DPO stood at 66 days.
45 48
54
31
51 48 47
26
49
57 60
40
57
51 54
35
52 50 51
34
45 48
40
24
40 36 34
29 25
36 37 40
31
41 40 39
26
36 39 38
27
43 41 37
32
40 39 34 34
41
49 50 44
56 52 55
48 52 52 54 55
60
52
61
52
65
56 58 55
77
59
85
60
68 66
32 32
40
0
36
31
39
6
37
43 44
6
42
29
40
-2
39
33 33
-11
25
2
14
-10
15
-20
-10
0
10
20
30
40
50
0
10
20
30
40
50
60
70
80
90
2015Q1
2015Q2
2015Q3
2015Q4
2016Q1
2016Q2
2016Q3
2016Q4
2017Q1
2017Q2
2017Q3
2017Q4
2018Q1
2018Q2
2018Q3
2018Q4
2019Q1
2019Q2
2019Q3
2019Q4
2020Q1
2020Q2
2020Q3
2020Q4
2021Q1
Idays DSO DPO Cash Cycle Days

15
11,3%10,0%
8,7%
10,9%
8,5%7,7% 7,2% 7,6%
6,7%7,0% 7,1%
9,4%
8,1%
8,4%8,2%
9,8%8,6%
11,3%
14,9%
25,1%
19,7%
7,9%
8,0% 7,6%
8,3%7,1%
8,6%
10,9%
15,8%
14,0%
0,0%
5,0%
10,0%
15,0%
20,0%
25,0%
30,0%
2016 Q1 2016 Q2 2016 Q3 2016 Q4 2017 Q1 2017 Q2 2017 Q3 2017 Q4 2018 Q1 2018 Q2 2018 Q3 2018 Q4 2019 Q1 2019 Q2 2019 Q3 2019 Q4 2020 Q1 2020 Q2 2020 Q3 2020 Q4 2021 Q1
pre-IFRS 16 post-IFRS 16
ROCE Evolution Up To Q1 2021
Average Capital Employed last 5 quartes: equal to the average of “Loans” at the closing date of the period and at the four previous quarterly closing datesNOPAT Adj last 4 quarters: equal to the sum of the EBIT of the last four quarters less adjusted taxes.ROCE: NOPAT Adj last 4 quarters / Average Capital Employed last 5 quartes

16
• Q1 2021 all the economic and financial indicators in strong growth:
I. Sales up +28% yoy to 1,166 M€
II. EBITDA Adjusted up +70% to 20.3 M€
• ESPRINET outperformed the market in all three countries:Italy +23%, Spain +36%, Portugal +50%
• ESPRINET breaks new market share record
• Gross profit: improving on all business lines, stood at 4.81% (compared to 4.63% in Q1 20), despite the growing weight of PC and smartphone sales
• Cash Cycle closes at 5 days, with an improvement of -3 days compared to Q4 20 and of -15 days compared to Q1 20
• Net Financial Position as of March 31, 2021 negative for 71.6 M€, an improvement compared to March 31, 2020 (negative for 127.1 M€) and down compared to December 31, 2020 (positive for 302.8 M€)
• ROCE at 19.7% thanks to the efficient management of the cash conversion cycle and the increase in operating profitability
• On May 11, 2021 paid dividend of 0.54 euros per share, a pay-out ratio up to 50%, recovering the dividend suspended in 2020 at the moment of maximum uncertainty linked to the pandemic, for a total of 26.8 M€
• From April 20, 2021 until May 12, 2021 purchased 1,464,369 ordinary shares, corresponding to 2.88% of the share capital which were added to the shares already owned bringing the total to 1,528,024 shares corresponding to 3% of the share capital. Average purchase price of 13.56 € for a total of 19.9 M€. 1,011,318 shares will serve the Long Term Incentive Plan, the others will be cancelled

17
• Net Invested Capital as of March 31, 2021 stands at 470.7 M€ and is covered by:
- Shareholders’ equity, including non-controlling interests, for 399.1 M€ (361.8 M€ as of March 31, 2020)
- Cash negative for 71.6 M€ (negative for 127.1 M€ as ofMarch 31, 2020)
• Cash positive (Pre-IFRS 16) for 46.0 M€ (negative for 20.4 M€ as of March 31, 2020)
(M/€) 31/03/2021 31/03/2020 Var. %
Sales from contracts with customers1,166.0 913.8 28%
Gross Profit 56.1 42.3 33%Gross Profit % 4.81% 4.63%
EBITDA adj. 20.3 11.9 70%EBITDA adj. % 1.74% 1.31%
EBIT adj. 16.5 8.3 98%EBIT adj. % 1.42% 0.91%
EBIT 16.5 8.3 98%EBIT % 1.42% 0.91%
Net Income 10.2 3.9 159%Net Income % 0.88% 0.43%
(M/€) 31/03/2021 31/03/2020 31/12/2020
Fixed Assets 137.9 118.8 137.0
Operating Net Working Capital 235.1 285.5 (121.0)
Other current asset (liabilities) 4.2 (2.8) (9.9)
Other non-current asset (liabilities) (20.8) (17.4) (19.9)
Net Invested Capital [ante IFRS16] 356.3 384.1 (13.7)
RoU Assets [IFRS16 ] 114.4 104.8 99.9
Net Invested Capital 470.7 489.0 86.2
Cash (219.7) (116.6) (558.9)
Short-term debt 62.3 80.7 18.2
Medium/log-term debt(1)
138.0 74.2 145.4
Financial assets (26.6) (17.9) (10.3)
Net financial debt [ante IFRS16] (46.0) 20.4 (405.6)
Net Equity [ante IFRS16] 402.4 363.7 391.9
Funding sources [ante IFRS16] 356.3 384.1 (13.7)
Lease liabilities [IFRS16] 117.7 106.7 102.9
Net financial debt 71.6 127.1 (302.8)
Net Equity 399.1 361.8 389.0
Funding sources 470.7 489.0 86.2
(1) Including the amount due within 1 year
(2) Net financial debt ante IFRS 16

18
• closes at 5 days• an improvement of -3 days compared to Q4 20 • thanks to better Inventory Days (-1) and DPOs (2), substantial stability of the DSOs
• negative for 71.6 M€, net of IFRS 16 effects (positive for 46.0 M€ pre IFRS 16)• an improvement compared to March 31, 2020 (negative for 127.1 M€) and down compared to December 31,
2020 (positive for 302.8 M€)
• stood at 19.7%, compared to 8.6% in Q1 20• thanks to the efficient management of the cash conversion cycle and the increase in operating profitability
(*) Average Capital Employed last 5 quartes: equal to the average of “Loans” at the closing date of the period and at the four previous quarterly closing dates (excluding the equity effects of IFRS 16).NOPAT Adj last 4 quarters: equal to the sum of the EBIT- excluding the effects of the IFRS16 accounting principle - of the last four quarters less adjusted taxes.ROCE: NOPAT Adj last 4 quarters / Average Capital Employed last 5 quartes.

19
733 M€ Italy
405 M€ Spain
17 M€ Portugal
23%
36%
50%
21%
20%
11 M€ Other (+40%)
13%
Esprinet Market(*)
656 M€ IT Clients
343 M€
207 M€
Esprinet
-40 M€ IFRS15 and other adjustments
Consumer Electronics
Advanced Solutions
36%
22%
-4%
35%
23%
48%
481 M€ 25%
39%
23%
18%
Esprinet
725 M€ IT Resellers
-40 M€ IFRS15 and other adjustments
Retailers &E-tailers
(*) Source: Context
Market(*) Market(*)

20
• Significant boost to profitability coming from increased volumes of high gross profit margin Advanced Solutions business lines.
• Sales of Advanced Solutions grew by 48% compared to Q1 2020, in a market(*) that decreased by 4%, entailing a significant market share growth.In detail:
- Hardware (networking, storage, servers and others) +32%- Software, Services, Cloud +82%
• The integration process of GTI Group in Spain and of Dacom and idMAINT in Italy is progressing steadily and the contribution to sales and EBITDA Adj. of the combined entities in Q1 was respectively of 42.8 M€ of sales and 2.1 M€ of EBITDA Adj., resulting in a for a total 4.91% EBITDA Margin for the three acquired companies alone.
• ROCE of these acquisitions is well above WACC.
• XaaS ("Everything as a Service") in Q1 2021 up to 30.5 M€ (6.3 M€ in Q1 2020): a 384% growth. Without the contribution of the GTI Group acquisition the organic growth would have been of 68% for a total of 10.6 M€ against 6.3 M€ of Q1 2020.
• The Customer Satisfaction Program of Esprinet (“Together is Better”), started almost two years ago, is steadily progressing not only through massive re-training of the entire workforce and the change of compensation schemes but also by means of the progressive redesign of internal procedures based on the ongoing active listening process of customers suggestions.
• The results of this ongoing multi-year effort led to an increase in sales in the IT reseller segment by 39%, in a market(*) that grew by 18%, again providing a significant market share growth in this higher margin customer segment.
(*) Source: Context

21
The hybrid platform, fully integrated in the Group's B2B site, combines best-in-class hardware, software and cloud services.
Group's B2B site used by more than 26,000 resellers, for a total of 62 million pages viewed each year. All customers can access the entire portfolio
of solutions directly from their user profile, easily combining best of breed software, hardware and cloud services in a single order.
The platform enables users to choose and combine the products and services of the Top global Vendors in order to build personalised cloud
architectures based on the different needs of end customers.
The new Cloud Marketplace provides customers with a vast range of Public, Private and Hybrid Cloud solutions able to guarantee rapid
implementation times, simplicity of system configuration, frequent and automatic updates included in the service, all guaranteeing maximum
security and regulatory compliance.
It offers an extensive area dedicated to technological solutions and areas, where information material can be found, as well as
webinars, business ideas and new ideas for ensuring the loyalty of customers. It also includes advanced monitoring, reporting and
analysis tools, as well as licence and invoice management and control tools.

22
EspriRENT: a proprietary platform that makes it possible to create personalised offers and solutions in “As a Service” mode with the range of 650 suppliers distributed, using a unique and simple interface, available to our almost 18,500 business customers in Italy.
It is a service delivery platform that converts part of our sales into recurring revenues, thereby gaining an additional share of added value.
Through this user-friendly platform, seamlessly integrated into ESPRINET's marketplace, resellers can now easily buy and sell in 'As a Service' mode, in their turn earning recurring revenues and increasing their profitability by providing additional services, improving their cash flows as well.
ESPRINET has designed the first rental contract stipulated directly with the customer without the support of intermediaries, making the service more flexible with the objective of facilitating and speeding up the “As a Service” sale by its professional resellers to theirend-users (the entire contract flow will be managed and archived on-line in full cloud mode).

23
• Growing margins on all business lines thanks to the constant commitment to improve customer satisfaction index.
• Customer satisfaction also results in further consolidated market shares in all product and customer segments in all three geographies.
• The growing revenues of PCs and Smartphones and the almost absence of additional fixed costs, have contributed to bottom linegrowth exploiting the operating leverage.
• The incidence of operating costs on revenues decreased to 3.37% compared to 3.69% in Q1 2020.The amount of operating costs, equal to 39.3 M€, instead shows an increase of 5.6 M€ compared to Q1 2020 mainly following theacquisition of the GTI Group in Spain, Dacom S.p.A. and idMAINT Group in Italy.
• The balance between financial income and expenses, negative by 2.5 M€, is in line with Q1 2020 but representing a different mix between medium / long-term loans and short-term bank credit facilities. The balance includes 0.8 M€ of IFRS 16 related lease costs as well as 1.1 M€ of losses on exchange rates.
• The tax rate is reduced due to the combined effect of the higher incidence of the results in Spain, subject to a lower tax rate compared to Italy, and due to an estimated higher incidence of permanent differences in Q1 2020 which were not replicated in Q1 2021 which is more in line with the nominal tax rates of the countries were the group is active.

24
❑ We expect the first half of 2021 should confirm a favorable comparison against the previous year whilst the second half opens up to multiple scenarios relating to the uncertainty linked to the pandemic.
• The conservative scenario still implies a certain level of growth in the coming quarters even if expecting a slowdown in demand for mobile products which might be partially replaced by the purchase of goods and services such as apparel, travel and outdoor eating that so far have been constrained by the restrictions that we expect should be gradually removed as an effect of the end of the pandemic. The conservative scenario also implies a prolonged level of shortage of products as experienced so far.
• The optimistic scenario, on the other hand, presumes a more robust growth assuming an improvement of the shortage of products experienced so far, a still sustained demand for consumer products and an acceleration of IT infrastructure spendingby companies.
❑ The demand for products linked to the strengthening of digital infrastructures could also accelerate if the national investment plans within the Next Generation EU program will be implemented quickly.
❑ In order to assist customers and suppliers in the digital transformation, the Group's strategic guidelines will be developed further in terms of the Consumption model (Cloud, DaaS and MPS) and Outsourcing of logistics and digital services.
❑ Based on these premises, certain of the growing centrality of the IT distribution industry in the current global context, and with the expectation of greater visibility of the trend in consumer demand in the final part of the year, the guidance for the year 2021 forecasts sales exceeding Euro 5.0 billion and an Adjusted EBITDA of more than Euro 80 million.

25

26

27
11,3%10,0%
8,7%
10,9%
8,5%7,7% 7,2% 7,6%
6,7% 7,0% 7,1%
9,4%8,1% 8,4% 8,2%
9,8%8,6%
11,3%
14,9%
25,1%
19,7%
0,0%
5,0%
10,0%
15,0%
20,0%
25,0%
30,0%
0
50.000
100.000
150.000
200.000
250.000
300.000
350.000
400.000
450.000
2016 Q1 2016 Q2 2016 Q3 2016 Q4 2017 Q1 2017 Q2 2017 Q3 2017 Q4 2018 Q1 2018 Q2 2018 Q3 2018 Q4 2019 Q1 2019 Q2 2019 Q3 2019 Q4 2020 Q1 2020 Q2 2020 Q3 2020 Q4 2021 Q1
Average Capital Employed last 5 quarters NOPAT Adj last 4 quarters ROCE
ROCE Evolution Up To Q1 2021
Average Capital Employed last 5 quartes: equal to the average of “Loans” at the closing date of the period and at the four previous quarterly closing dates (excluding the equity effects of IFRS 16).NOPAT Adj last 4 quarters: equal to the sum of the EBIT- excluding the effects of the IFRS16 accounting principle - of the last four quarters less adjusted taxes.ROCE: NOPAT Adj last 4 quarters / Average Capital Employed last 5 quartes

28
11,3%10,0%
8,7%
10,9%
8,5%7,7% 7,2% 7,6%
6,7% 7,0% 7,1%
9,4%7,9% 8,0% 7,6% 8,3%
7,1%8,6%
10,9%
15,8%
14,0%
0,0%
5,0%
10,0%
15,0%
20,0%
25,0%
30,0%
0
50.000
100.000
150.000
200.000
250.000
300.000
350.000
400.000
450.000
2016 Q1 2016 Q2 2016 Q3 2016 Q4 2017 Q1 2017 Q2 2017 Q3 2017 Q4 2018 Q1 2018 Q2 2018 Q3 2018 Q4 2019 Q1 2019 Q2 2019 Q3 2019 Q4 2020 Q1 2020 Q2 2020 Q3 2020 Q4 2021 Q1
Average Capital Employed last 5 quarters NOPAT Adj last 4 quarters ROCE
New Accounting
PrincipleIFRS 16
First Time Impact
ROCE IFRS16 Evolution Up To Q1 2021
Average Capital Employed last 5 quartes: equal to the average of “Loans” at the closing date of the period and at the four previous quarterly closing dates.NOPAT Adj last 4 quarters: equal to the sum of the EBIT Adj of the last four quarters less adjusted taxes.ROCE: NOPAT Adj last 4 quarters / Average Capital Employed last 5 quartes

29
GOVERNANCE

30

31

32

33
Maurizio Rota, was born in Milan on 22 December 1957. After early professional experience as Sales Supervisor for companies operating in the Information Technology field, he founded Micromax in 1986, serving as the Company Chairman. He developed and consolidated the company up to 1999, focusing in particular on relations with major manufacturers, and making a decisive contribution to the implementation of the company's business strategies. Following the formation of Esprinet in the year 2000, as a result of the merger of the companies Celo, Micromax and Comprel, he served as Managing Director and later as Vice Chairman and Chief Executive Officer. Mr. Rota is theChairman of the Esprinet Group.
Alessandro Cattani, was born in Milan on 15 August 1963. After completing his degree in electronic engineering at Politecnico in Milan, he earned a MBA ("CEGA" at the Bocconi University in Milan). He began his professional career in the holding company of an Italian industrial groupwhere, until 1990, he served as Executive Director of the company which had the task of managing the group's information technology. From 1990 to 2000 Mr. Cattani worked in a consulting company. Since November 2000 he has been serving Esprinetas Chief Executive Officer of the Group.

34
NAME POSITION EXECUTIVE INDEPENDENTCONTROL AND RISK
COMM.
REMUNERATION AND NOMINATION
COMM.
COMPETITIVENESS AND SUSTAINABILITY
COMM. (*)
INDIPENDENT RELATED PARTY TRANSACTIONS
COMM.
Maurizio Rota Chairman
Marco Monti Deputy Chairman
Alessandro Cattani CEO • •
Angelo Miglietta Director • • • •
Renata Maria Ricotti Director • • • •
Emanuela Prandelli Director • •
Angela Sanarico Director • • •
Chiara Mauri Director • •
Lorenza Morandini Director • •
(* ) Giovanni Testa, Chief Operating Officer of Esprinet, is the fourth member of the committee
4 Men
5 Women

35
The Code of Ethics applies to all activities carried out by or in the name and on the behalf of EsprinetS.p.A. and its subsidiaries.
The Code of Ethics:
• establishes the guidelines of conduct and regulates the set of rights, duties and responsibilities that the Group expressly assumes with its stakeholders;
• defines the ethical criteria adopted for a correct balance between expectations and stakeholder interests;
• contains principles and guidelines for conduct in areas of potential ethical risk.
This document, entitled “Organisation and Management Model pursuant to “Legislative Decree 231/2001” (hereinafter called “the Model”), has been drawn up to implement the terms of ss. 6.1.a and 6.1.b, 6.2, 7.2 and 7.3 of Legislative Decree no. 231 of 08.06.2001 (hereinafter called "the Decree").
The Model is the management reference document which institutes a corporate prevention and control system designed to prevent the offences specified in the Decree from being committed.The Ethical Code enclosed summarizes the values, correctness and loyalty by which the Esprinet Group is inspired and constitutes the base of our Organizational, Administrative and Control Models. The Code has been adopted by the company in order to prevent any occupational hazards or risks in view of the D. Lgs. 231/2001 law.
On April 15th, 2020 the companies Board of Directors accepted a new and updated version of the Organizational, Administrative and Control Models which substitutes the previous version approved on September 11th, 2018.
The Esprinet Group wishes to establish trade relations with its vendors and business partners based on transparency, correctness and business ethics. The development of transparent and lasting relationships with vendors, attention to quality, safety and respect for the environment and compliance with existing regulations are objectives to be pursued with a view to consolidating the value created in favour of stakeholders.
Therefore, in connection with the Code of Ethics adopted by EsprinetS.p.A. and its subsidiaries, the Group has defined a Code of Conduct designed to guide relations throughout its supply chain.

36
Esprinet Spa listed in the STAR Segment* voluntarily adhere to and
comply with strict requirements
• Interim financial statements available to the public within 45 days from the end of first, third and fourth quarter
• Make the half-yearly report available to the public within 75 days of the end of the first half of the financial year
• Favourable auditor’s report on their latest individual and consolidated annual financial statements
• Consolidated annual financial statements not challenged by Consob
• Bi-lingual publication on the websites
• Mandatory presence of a qualified investor relator and a “specialist”
• Adoption of the models provided for in art. 6 of Leg Decree 231/2001
• Application of Corporate Governance Code
• Additional requirements in the article 2.2.3 of Borsa Italiana guidelines
Major requirements for shares to qualify as STAR status
Esprinet is fully compliant(1) with the Code of self-discipline (Corporate Governance Code).
(1) With minor exceptions which are explained as permitted by the Code in the “Corporate
Governance” section of the society
*The market segment of Borsa Italiana’s equity market (MTA-Mercato Telematico Azionario). Dedicated to mid-size companies with a capitalization less than 1.0 euro/bln
• High transparency, disclosure requirements and liquidity (free float of minimum 35%)
• Corporate Governance in line with international standards

37
Italian Stock Exchange (PRT:IM)
Number of shares: 50.93 million
YTD Average volume of 420,523 shares per day (**)
DECLARANT & DIRECT SHAREHOLDER % ON ORDINARY CAPITAL % ON VOTING CAPITAL
Francesco Monti 16.16% 16.16%
Giuseppe Calì 11.26% 11.26%
Axopa S.r.l. (Maurizio Rota and Alessandro Cattani) 9.79% 9.79%
Paolo Stefanelli (*) 5.22% 5.22%
JP Morgan 5.01% 5.01%
Own shares 3.00% 3.00%
Free float 49.56% 49.56%
ANALYST COVERAGE
(*) Paolo Stefanelli’s heirs.(**) Periodo: 1st January - 13th May, 2021.

38
CORPORATE OVERVIEW
ENVIRONMENTALPERFORMANCE
SOCIALPERFORMANCE
INITIATIVES IN THELOCAL REGION
4.5 bneuros of revenues
(+14% vs 2019)
Certified inventory of CO2 emissions
1,598employees
Ambulancedonation
N°1First distributor in
Italy, Spain & Portugal
Commitment to reduce the use of
plastic
Certified
Great Place to Work
Project For-Te reconversion
A newCorporate
Identity
Integrated management systemQuality, Environment,
Health and Safety
New Corporate Welfare
Creation of the solidarity chain with
PC4U.tec
TIB ProgramTogether is Better
Presence of theCompetitiveness
and SustainabilityCommittee
Support of localcommunities
LEED PlatinumCertification of the Vimercate offices

39


