This document is a European Commission staff working ... · Quarterly hourly labour cost (% change...
73
EN EN EUROPEAN COMMISSION Brussels, 26.2.2016 SWD(2016) 71 final COMMISSION STAFF WORKING DOCUMENT Country Report Belgium 2016 Including an In-Depth Review on the prevention and correction of macroeconomic imbalances This document is a European Commission staff working document. It does not constitute the official position of the Commission, nor does it prejudge any such position.
Transcript of This document is a European Commission staff working ... · Quarterly hourly labour cost (% change...

EN EN
EUROPEAN COMMISSION
Brussels, 26.2.2016
SWD(2016) 71 final
COMMISSION STAFF WORKING DOCUMENT
Country Report Belgium 2016
Including an In-Depth Review on the prevention
and correction of macroeconomic imbalances
This document is a European Commission staff working document. It does not
constitute the official position of the Commission, nor does it prejudge any such position.

Executive summary 1
1. Scene setter: Economic situation and outlook 4
2. Imbalances, risks, and adjustment issues 13
2.1 Competitiveness, trends and performance 13
2.2. Labour costs 20
2.3. Innovation and business environment 26
2.4. Indebtedness 33
2.5. MIP assessment matrix 39
3. Additional structural issues 41
3.1 Labour markets, social policies, skills and education 41
3.2. Taxation 50
3.3. Transport, energy and environment 55
A. Overview Table 58
B. MIP scoreboard 64
C. Standard Tables 65
LIST OF TABLES
1.1. Key economic, financial and social indicators — Belgium 12
2.5.1. MIP Assessment matrix (*) — Belgium 39
3.1.1. Employment rate for Belgium and EU for different labour force population groups 41
B.1. The MIP scoreboard for Belgium 64
C.1. Financial market indicators 65
C.2. Labour market and social indicators 66
C.3. Labour market and social indicators (continued) 67
C.4. Structural policy and business environment indicators 68
C.5. Green growth 69
LIST OF GRAPHS
1.1. Breakdown of real GDP growth 4
1.2. Contribution to value added growth (pps.) 4
1.3. Real GDP per head 5
CONTENTS

1.4. Breakdown of potential growth 5
1.5. Core inflation (year-on-year %change) 6
1.6. Employment growth (net year-on-year %change, employees only) 6
1.7. Composition of net changes in employment 7
1.8. Current account: composition over time 7
1.9. Goods balance: breakdown of growth 8
2.1.1. Export market shares (XMS) for goods 13
2.1.2. Market dynamism and competitiveness of goods exports for top-10 countries (2000-14) 13
2.1.3. Market dynamism and competitiveness of goods exports for top-12 sectors (2000-14) 14
2.1.4. Integration in international production chains (2011) 14
2.1.5. Composition of domestic value added content in gross exports (2011) 15
2.1.6. Product quality estimate (exported goods) 16
2.1.7. Quarterly hourly labour cost (% change year-on-year; business sector) 16
2.1.8. Difference in unit labour cost level: BE vs. Germany, France and the Netherlands 17
2.1.9. Real effective exchange rate 17
2.1.10. Trends in unit labour cost components (2001-2014) 18
2.2.1. Expected trend in the actual rate of employers’ social security contributions as a
percentage of gross wages (2015-2019) 22
2.2.2. Inflation: HICP (% change year-on-year) 23
2.2.3. Inflation: services (% change year-on-year) 24
2.2.4. Mark-ups in the retail sector 25
2.3.1. Innovation performance in Belgium relative to the EU (EU = 100) 27
2.3.2. Churn rates in business services — BE and EU averages (2008-2012) 29
2.3.3. Labour productivity developments in business services — BE and EU (2005-2014) 29
2.3.4. Allocative efficiency index for business services 29
2.3.5. Share of business services in the manufacturing value chain 30
2.4.1. Breakdown of debt by sector (non-consolidated) 33
2.4.2. Breakdown of debt by sector (consolidated) 33
2.4.3. Credit flows 34
2.4.4. Leverage of non-financial corporations 34
2.4.5. Interest burden 34
2.4.6. Net asset breakdown 35
2.4.7. Alternative projections of gross public debt — 2026 (% GDP) 37
3.1.1. Employment rates in function of skills levels and age (2014) 41
3.1.2. (Long-term) unemployment rate (LHS) and long-term unemployment incidence (RHS) 42
3.2.1. Total receipts from taxes and compulsory social contributions, 2014 (% of GDP) 50
3.2.2. Tax revenues in Belgium by main taxes, compared with the EU, 2014 (% of GDP) 50
LIST OF BOXES
1.1. Investment challenges 9

1.2. Contribution of the EU budget to structural change 11
2.1.1. Electricity costs for industrial users 19
2.2.1. The Central Economic Council: role within the wage-setting process 21
3.2.1. Tax treatment of company cars: fiscal and environmental costs 54
3.3.1. Security of supply 57

1
This country report assesses Belgium’s economy
in the light of the European Commission’s Annual
Growth Survey published on 26 November 2015.
The survey recommends three priorities for the
EU’s economic and social policy in 2016: re-
launching investment, pursuing structural reforms
to modernise Member States’ economies, and
responsible fiscal policies. At the same time, the
Commission published the Alert Mechanism
Report that initiated the fifth annual round of the
macroeconomic imbalance procedure. The Alert
Mechanism Report identified Belgium as
warranting a further in-depth review.
The Belgian economy has been recovering at a
slow pace. After having settled at around 1.3 % in
2014 and 2015, real growth is forecast to rise to
1.7 % in 2017 as companies start reaping the
benefits of improved competitiveness and
employment growth provides broader support to
household spending. At the same time, a less
supportive external environment risks delaying the
transmission of improving competitiveness into
export, investment and job growth. Lower growth
compared with pre-crisis performance is in line
with lower estimates for potential growth as a
result of weakened productivity growth. A fall in
potential growth entails long-term risks,
particularly in view of the challenges Belgium
faces as regards the long-term sustainability of its
public finances.
Belgian companies are deeply integrated in the
global economy, trading actively in
intermediate goods. Intermediates account for
two thirds of domestically produced value added,
among the highest in the EU, while the share of
final products is among the lowest. Given the very
open nature of the economy, losses in export
market shares experienced since the turn of the
century are particularly relevant. This trend was
mainly driven by goods exports. Weakened
external competitiveness was aggravated by
exports being oriented mainly towards less
dynamic markets. In addition, exported goods are
concentrated in the lower half of the quality
spectrum, with Belgium lagging behind its
neighbours in terms of top quality products. The
negative trend in market shares has been halted in
recent years, though accumulated losses remain
substantial. This stabilisation signals that efforts to
improve competitiveness are starting to pay off.
Specialisation in market segments with a higher
exposure to price competition is difficult to
reconcile with the country’s high labour costs.
The latter reflect the economy’s high productivity
but also the fact that high overall taxes weigh
especially heavily on labour. Labour costs, which
have an important signal function for international
companies, are relatively high in Belgium.
Moreover, labour costs have risen rapidly in the
past owing to certain features of the wage-setting
system. Excessively high margins for real wage
increases and the transmission of high inflation
through the general practice of automatic cost-of-
living adjustments drove these increases. The fact
that underlying inflation is structurally higher than
in neighbouring countries mainly reflects rises in
service and retail prices. To halt the decline in
competitiveness and its negative impact on export
performance and employment, the Belgian
authorities have intervened in the wage-setting
process in recent years. Wage moderation
measures have been imposed, including suspension
of wage indexation schemes.
The Belgian labour market is characterised by
a stagnating and comparatively low overall
employment rate, with large differentials
between regions and population categories.
While the unemployment rate is expected to fall
from 8.3 % in 2015 to 7.4 % in 2017, job creation
has fallen short of past growth rates. At 67.3 %,
the overall employment rate remains below the EU
and euro area averages. As a result of rapid
deindustrialisation, the share of manufacturing jobs
has decreased, while the share of employment in
non-market services has risen steadily over the
past 15 years. This change in the composition of
employment partly accounts for the observed fall
in productivity growth.
The transition towards a more knowledge-
intensive and innovation-driven economy is
advancing slowly. The strengths of Belgium's
research and innovation system do not translate
into general economic performance as effectively
as they might. Business R&D is concentrated in a
limited number of high-tech industries. Despite the
low barriers to setting up a company, Belgium has
a notably low start-up rate and performs poorly in
terms of company dynamics. Certain service
markets show unwarranted restrictions and
rigidities, which helps explain for example the
upward price pressures in the retail sector.
EXECUTIVE SUMMARY

Executive summary
2
Public finances did not come out of the crisis
unscathed. A prolonged debt reduction effort was
aborted by the support provided to the financial
sector and the accumulation of high deficits. The
deficit reached a peak of more than 5 % of GDP in
2009 and the subsequent reduction of the deficit
has been slow, with a deficit hovering around 3 %
in recent years. Public debt is set to remain at
around 107 % of GDP in 2016. In 2017, a lower
deficit and higher nominal growth are projected to
reduce the public debt.
Overall, Belgium has made some progress in
addressing the 2015 country-specific recom-
mendations. Over the past year, it has reformed its
pension and old-age social security system to raise
the effective retirement age. However, there has
been limited progress towards an enforceable
distribution of fiscal targets among the various
levels of government. Some progress has been
made in reforming the tax system, notably by
shifting taxes from labour to other tax bases. Some
progress has also been made on the overall
functioning of the labour market. Incentives to
work have been strengthened by measures to
reduce the tax wedge — the difference between
total labour costs and take-home pay — and
changes in the unemployment benefit system.
Nevertheless, specific population groups still face
barriers to entering or re-entering the labour
market. Finally, progress in making wage
formation more responsive to the business cycle
and changes in productivity has been limited.
Regarding the progress in reaching the national
targets under the Europe 2020 Strategy, Belgium is
performing well in R&D investment and reducing
early school leaving, while more effort is needed
as regards employment, greenhouse gas emissions,
renewable energy, energy efficiency, tertiary
education attainment and poverty.
The main findings of the in-depth review
contained in this report, and the related policy
challenges, are as follows:
Government measures to correct for the loss
in competitiveness have been bearing fruit.
External cost competitiveness has been impro-
ving for several years, especially in the manu-
facturing sector, thanks to wage moderation
efforts. The ongoing correction is reflected in
favourable labour cost developments relative to
peer countries, with wages advancing broadly
in line with low productivity. This positive
trend is expected to continue due to further cuts
in employer social security contributions in the
context of the tax shift. As a result, related
macroeconomic risks should recede further.
Despite this positive trend, a number of
deeply-rooted issues concerning wage
formation and the build-up of inflationary
pressure remain unaddressed. These issues
risk cancelling out the recent improvements in
cost competitiveness. Ensuring a more formal
link between wages and productivity would
help to lock in recent gains and prevent
recurrence of past problems. Moreover, the
comparatively high inflation risks triggering
inflation-wage cycles, undermining the
sustainability of automatic wage indexation.
The inflation gap with the neighbouring
countries is projected to widen again in 2016.
Low productivity growth is associated with a
mediocre performance on a number of
aspects that constrain the economy’s long-
term growth potential. Despite its high-
quality public research system, for example,
Belgium has relatively few fast-growing firms
in innovative sectors. Furthermore, the business
climate is hampered by administrative and
regulatory burdens which inhibit company
expansion, while restrictions hold back market
dynamics for business services. Moreover,
there are shortcomings in the efficiency of the
justice system, with a low penetration of
information and communications technology.
Together, these factors constitute significant
barriers to private investment.
Substandard infrastructure and lasting
bottlenecks undermine productivity growth
and investment. These factors also make the
country less attractive to foreign investors and
aggravate the congestion problem. Transport
infrastructure and energy represent the
country’s most acute investment gaps. The
absence of a long-term vision for the energy
sector, may have created a climate
unsupportive to investments in non-subsidised
generation capacity.

Executive summary
3
Both non-financial corporations and the
government have relatively high debts.
However, associated macroeconomic risks are
found to be generally contained in the short
term. First, risks are tempered by the private
sector, with the economy’s total financial assets
exceeding total debt. Second, the indebtedness
of non-financial corporations is explained by
the presence of financial subsidiaries of
international groups. Large financial flows
within these groups distort the debt figures of
non-financial corporations. Third, the
resumption of primary surpluses, the relatively
long average maturity of the debt stock, and
low financing costs mitigate short-term
sustainability risks.
Long-term debt reduction hinges on a
further consolidation of public finances. The
existing budgetary coordination mechanisms
do not appear sufficiently effective, given the
decentralised government structure, the
absence of hierarchy between different levels
of government, and the fact that there is no
commitment to predefined targets. Belgium has
made progress in reforming its pension system.
Still, safeguarding long-term sustainability
depends on further adjustments and structural
reforms in other areas to lift economic growth.
Other key economic issues analysed in this report
which point to particular challenges for Belgium’s
economy are:
High labour costs hamper job creation while
various entry and re-entry barriers for low-
skilled young people, older people and
people from migrant backgrounds result in
underutilised labour potential. Financial
incentives, employment support and activation
policies are not always fine-tuned to raise the
employment rate of these people. The wage
moderation policies enacted and the recent tax
shift are likely to push up employment growth,
provided they are not neutralised by nominal
wage increases. Spikes in marginal tax rates
upon entering or re-entering the labour market
create inactivity and low wage traps for second
income earners and specific household types
such as singles and single parents, although
measures to reduce the tax wedge are being
phased in. Extending careers to further reduce
early labour market exit also remains a
particular challenge. This highlights the
importance of policies to promote active ageing
and to support demand for older workers.
While the risk of poverty has decreased for
older people during the crisis, it has
increased for specific groups. These include
low-skilled people and very low-work-intensity
households. People from migrant backgrounds
are particularly exposed to poverty.
Educational inequality linked to socio-
economic background is amongst the highest
in the EU. The disparity in learning outcomes
already starts during early childhood education.
The reforms currently being introduced are
designed to tackle this, reduce early school
leaving, and improve the quality and relevance
of the vocational system. Completing these
reforms could facilitate a smoother transition
towards a knowledge-intensive and
increasingly service-oriented economy and
alleviate skills mismatches and persistent
labour shortages in certain occupations.
The recently adopted tax shift will gradually
reduce the tax wedge on labour. Reductions
in personal income taxation and employers’
social security contributions will help narrow
the gap. Nevertheless, the tax system remains
complex, with tax bases eroded by specific
exemptions, deductions and reduced rates.
These imply revenue losses, economic
distortions, and a heavy administrative burden.
The tax shift also does not seem to be neutral
from the budgetary point of view. There is still
scope for improving the design of the tax
system by further broadening tax bases,
allowing both for lower statutory rates and
fewer distortions. There is considerable
potential for a green tax shift which stems,
among others, from the favourable tax
treatment of company cars and fuel cards,
which contribute to pollution and congestion.
Belgium faces rising peak-hour traffic
congestion around the main economic hubs.
Congestion has economic costs linked to delays
and lost productivity, fuel consumption, and air
pollution. Barring a change in policies,
Belgium is expected to fall short of its
greenhouse gas emission reduction target.
4
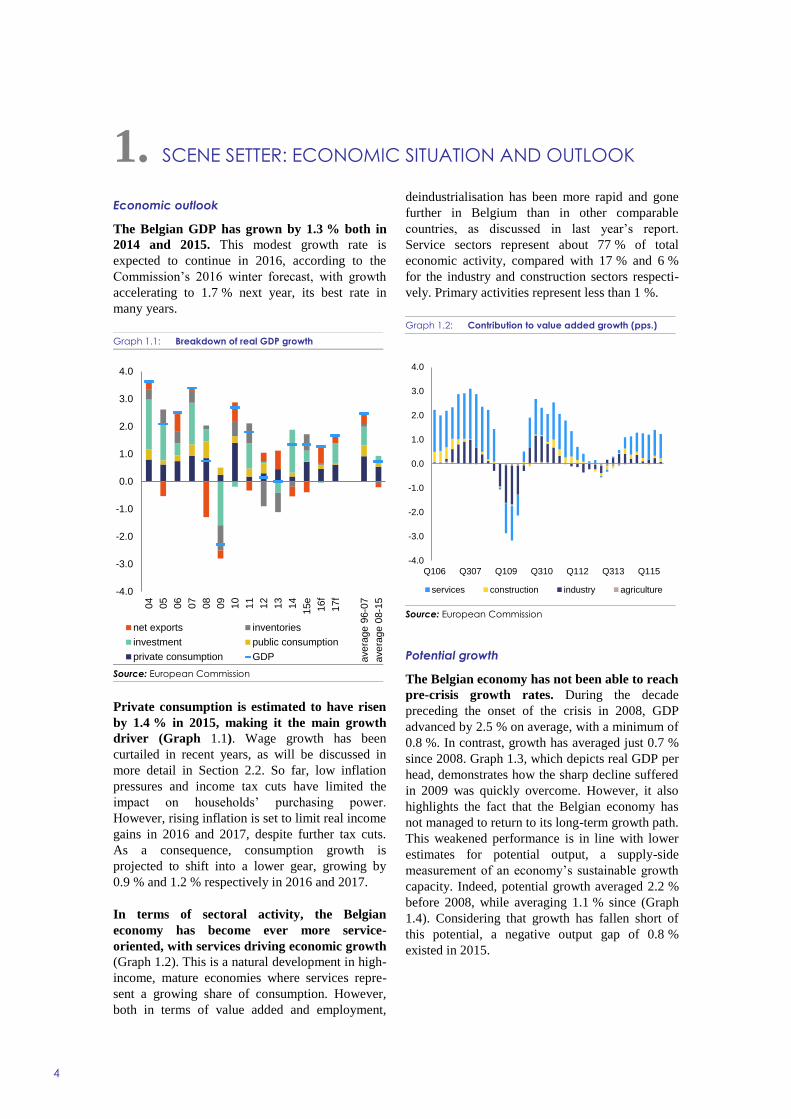
Economic outlook
The Belgian GDP has grown by 1.3 % both in
2014 and 2015. This modest growth rate is
expected to continue in 2016, according to the
Commission’s 2016 winter forecast, with growth
accelerating to 1.7 % next year, its best rate in
many years.
Graph 1.1: Breakdown of real GDP growth
Source: European Commission
Private consumption is estimated to have risen
by 1.4 % in 2015, making it the main growth
driver (Graph 1.1). Wage growth has been
curtailed in recent years, as will be discussed in
more detail in Section 2.2. So far, low inflation
pressures and income tax cuts have limited the
impact on households’ purchasing power.
However, rising inflation is set to limit real income
gains in 2016 and 2017, despite further tax cuts.
As a consequence, consumption growth is
projected to shift into a lower gear, growing by
0.9 % and 1.2 % respectively in 2016 and 2017.
In terms of sectoral activity, the Belgian
economy has become ever more service-
oriented, with services driving economic growth
(Graph 1.2). This is a natural development in high-
income, mature economies where services repre-
sent a growing share of consumption. However,
both in terms of value added and employment,
deindustrialisation has been more rapid and gone
further in Belgium than in other comparable
countries, as discussed in last year’s report.
Service sectors represent about 77 % of total
economic activity, compared with 17 % and 6 %
for the industry and construction sectors respecti-
vely. Primary activities represent less than 1 %.
Graph 1.2: Contribution to value added growth (pps.)
Source: European Commission
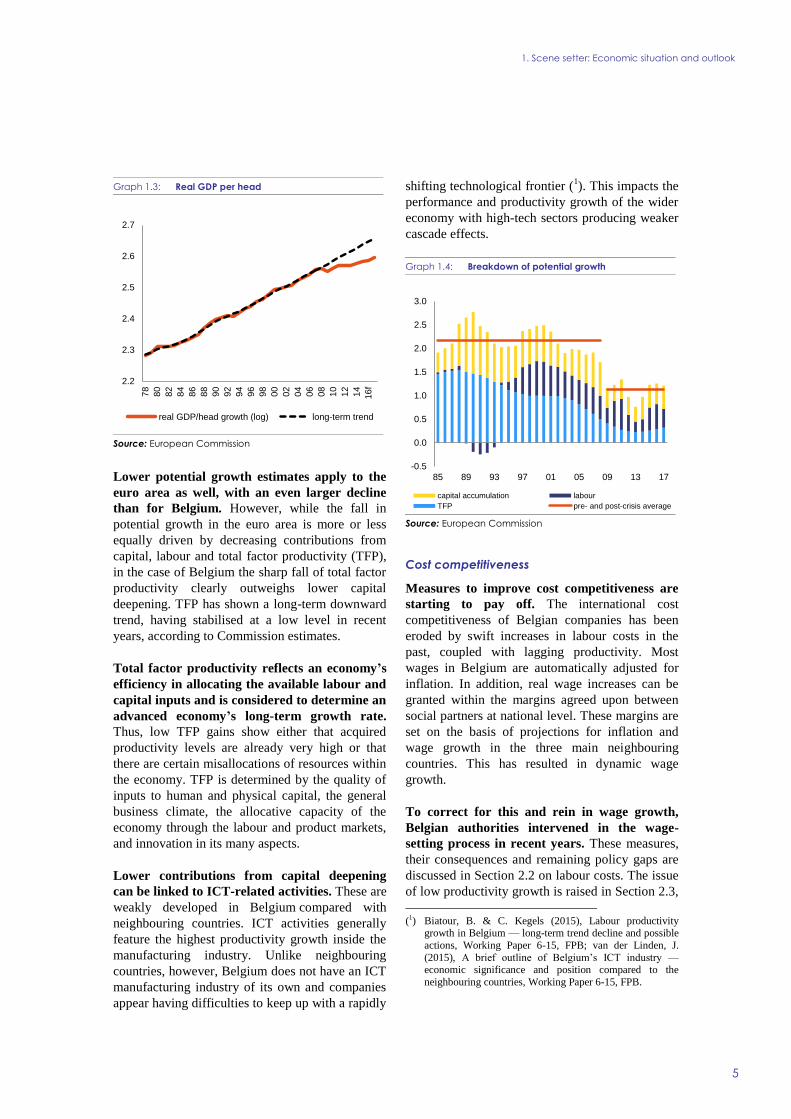
Potential growth
The Belgian economy has not been able to reach
pre-crisis growth rates. During the decade
preceding the onset of the crisis in 2008, GDP
advanced by 2.5 % on average, with a minimum of
0.8 %. In contrast, growth has averaged just 0.7 %
since 2008. Graph 1.3, which depicts real GDP per
head, demonstrates how the sharp decline suffered
in 2009 was quickly overcome. However, it also
highlights the fact that the Belgian economy has
not managed to return to its long-term growth path.
This weakened performance is in line with lower
estimates for potential output, a supply-side
measurement of an economy’s sustainable growth
capacity. Indeed, potential growth averaged 2.2 %
before 2008, while averaging 1.1 % since (Graph
1.4). Considering that growth has fallen short of
this potential, a negative output gap of 0.8 %
existed in 2015.
-4.0
-3.0
-2.0
-1.0
0.0
1.0
2.0
3.0
4.0
04
05
06
07
08
09
10
11
12
13
14
15e
16f
17f
ave
rage 9
6-0
7
ave
rage 0
8-1
5
net exports inventories
investment public consumption
private consumption GDP
-4.0
-3.0
-2.0
-1.0
0.0
1.0
2.0
3.0
4.0
Q106 Q307 Q109 Q310 Q112 Q313 Q115
services construction industry agriculture
1. SCENE SETTER: ECONOMIC SITUATION AND OUTLOOK
1. Scene setter: Economic situation and outlook
5
Graph 1.3: Real GDP per head
Source: European Commission
Lower potential growth estimates apply to the
euro area as well, with an even larger decline
than for Belgium. However, while the fall in
potential growth in the euro area is more or less
equally driven by decreasing contributions from
capital, labour and total factor productivity (TFP),
in the case of Belgium the sharp fall of total factor
productivity clearly outweighs lower capital
deepening. TFP has shown a long-term downward
trend, having stabilised at a low level in recent
years, according to Commission estimates.
Total factor productivity reflects an economy’s
efficiency in allocating the available labour and
capital inputs and is considered to determine an
advanced economy’s long-term growth rate.
Thus, low TFP gains show either that acquired
productivity levels are already very high or that
there are certain misallocations of resources within
the economy. TFP is determined by the quality of
inputs to human and physical capital, the general
business climate, the allocative capacity of the
economy through the labour and product markets,
and innovation in its many aspects.
Lower contributions from capital deepening
can be linked to ICT-related activities. These are
weakly developed in Belgium compared with
neighbouring countries. ICT activities generally
feature the highest productivity growth inside the
manufacturing industry. Unlike neighbouring
countries, however, Belgium does not have an ICT
manufacturing industry of its own and companies
appear having difficulties to keep up with a rapidly
shifting technological frontier (1). This impacts the
performance and productivity growth of the wider
economy with high-tech sectors producing weaker
cascade effects.
Graph 1.4: Breakdown of potential growth
Source: European Commission
Cost competitiveness
Measures to improve cost competitiveness are
starting to pay off. The international cost
competitiveness of Belgian companies has been
eroded by swift increases in labour costs in the
past, coupled with lagging productivity. Most
wages in Belgium are automatically adjusted for
inflation. In addition, real wage increases can be
granted within the margins agreed upon between
social partners at national level. These margins are
set on the basis of projections for inflation and
wage growth in the three main neighbouring
countries. This has resulted in dynamic wage
growth.
To correct for this and rein in wage growth,
Belgian authorities intervened in the wage-
setting process in recent years. These measures,
their consequences and remaining policy gaps are
discussed in Section 2.2 on labour costs. The issue
of low productivity growth is raised in Section 2.3,
(1) Biatour, B. & C. Kegels (2015), Labour productivity
growth in Belgium — long-term trend decline and possible
actions, Working Paper 6-15, FPB; van der Linden, J.
(2015), A brief outline of Belgium’s ICT industry — economic significance and position compared to the
neighbouring countries, Working Paper 6-15, FPB.
2.2
2.3
2.4
2.5
2.6
2.7
78
80
82
84
86
88
90
92
94
96
98
00
02
04
06
08
10
12
14
16f
real GDP/head growth (log) long-term trend
-0.5
0.0
0.5
1.0
1.5
2.0
2.5
3.0
85 89 93 97 01 05 09 13 17
capital accumulation labour
TFP pre- and post-crisis average

1. Scene setter: Economic situation and outlook
6
which looks at innovation and the business
environment.
High labour costs reflect overall high
productivity but also the fact that the high
overall tax level leans especially heavily on
labour. To lower non-wage-related labour costs,
the federal government has initiated a tax shift
towards alternative tax bases. The scope and
composition of this tax shift will be discussed in
Section 3.2, which also deals with the overall
design of the Belgian tax system.
Graph 1.5: Core inflation (year-on-year %change)
Source: European Commission
Inflation
Inflation reached a low point of -0.6 % in
January 2015 and has been rising since. The
average level of 0.6 % in 2015 is projected to
climb to 1.4 % this year. At 1.6 % in 2015, core
inflation — excluding prices for energy and
unprocessed food items — has remained relatively
high compared with other euro area countries
(0.8 %; Graph 1.5).
Inflation has been a key driver of fast wage
growth in the past. This had led to government
efforts to keep price pressures under control
through improved competition for energy and
telecom products and by ensuring that surveyed
inflation matches actual price developments. The
decision to lower VAT on electricity in 2014
should also be seen in this context. However, the
budgetary impact of this decision forced the
authorities to backtrack in 2015, and this has
directly increased inflation. Other government
decisions have had similar effects. This is, for
example, the case with increases in excise duties or
the Flemish regional government's decision to pass
on to final consumers the sizeable debt overhang
from support to renewable energy.
Graph 1.6: Employment growth (net year-on-year
%change, employees only)
Source: European Commission
Labour market
Although it recovered quite smoothly after the
first leg of the crisis, the labour market has
made a more muted recovery after the second
leg. Net employment growth has fallen short of
past growth rates (Graph 1.6). The unemployment
rate nevertheless started to fall in the second half
of 2015. It is projected to fall further, from 8.3 %
in 2015 to 8.0 % in 2016 and 7.4 % in 2017.
The structural shift towards a service-based
economy is reflected in the composition of job
growth. As shown in Graph 1.7, Belgian industrial
jobs have declined steadily, and the crisis has only
reinforced this trend. Job creation in the service
sectors has more than compensated for these job
losses. The change in the composition of
employment helps explain the fall in productivity
growth, which is generally lower for services.
While this is an inherent feature of many services,
also a lower exposure to competition plays a role.
A significant percentage of new service jobs are
in non-market activities, such as the public
sector, education and healthcare. Their share in
total employment rose from 31 % in 2000 to 35 %
in 2014, with these sectors representing almost
0.0
0.5
1.0
1.5
2.0
2.5
3.0
3.5
EA BE
-1.5%
-1.0%
-0.5%
0.0%
0.5%
1.0%
1.5%
2.0%
2.5%
3.0%
20
00
Q1
20
00
Q4
20
01
Q3
20
02
Q2
20
03
Q1
20
03
Q4
20
04
Q3
20
05
Q2
20
06
Q1
20
06
Q4
20
07
Q3
20
08
Q2
20
09
Q1
20
09
Q4
20
10
Q3
20
11
Q2
20
12
Q1
20
12
Q4
20
13
Q3
20
14
Q2
20
15
Q1

1. Scene setter: Economic situation and outlook
7
60 % of total job growth since 2000. Part of this
strong employment growth is explained by
population ageing and related healthcare needs
(Graph 1.7). Furthermore, the subsidised service
voucher system represents over a quarter of new
jobs in market services, but seems to be
approaching saturation point. As a consequence,
the National Bank of Belgium estimates that as
many as eight out of ten jobs created between 2000
and 2013 are at least partly funded by the
government (2). This underscores the private
sector’s low job creation potential.
The Belgian labour market is characterised by
a low overall employment rate and large
employment differentials between regions and
population categories. Labour market issues and
links with the performance of the educational
systems are analysed in Section 3.1. This section
also discusses other socioeconomic developments,
focusing in particular on those groups that are most
underrepresented on the labour market.
The number of refugees rose sharply in the
second half of 2015. The number of applications
for asylum more than doubled compared with
2014. A peak was reached in September. The
number of arrivals has decreased since but remains
considerably above past levels. Most people
seeking asylum in 2015 came from Iraq, Syria and
Afghanistan.
(2) NBB (2015), Annual Report 2014.
Graph 1.8: Current account: composition over time
- BPM5 methodology until 2007, BPM6 thereafter
- 2015 based on first nine months
Source: NBB
External position
In 2015 the goods balance shifted into surplus
for the first time since 2007. The current account
has recorded a modest average deficit of 0.3 % of
GDP since 2008. This compares with an average
surplus of 3 % between 2000 and 2007. As shown
in Graph 1.8, goods and capital income are the
most dynamic current account components (3).
(3) Volatility for net investment income is caused by a
different composition of external liabilities and assets, which caused diverging returns. The timing of dividend
payments by a number of large companies also had a major
negative impact in H1-2015.
-6.0
-4.0
-2.0
0.0
2.0
4.0
6.0
8.0
95 97 99 01 03 05 07 09 11 13 15e
goods services labour income
secondary income investment income current account
Graph 1.7: Composition of net changes in employment
*non-market services
Source: NBB
60%
62%
64%
66%
68%
70%
-40
-20
0
20
40
60
80
100
(1000 p
ers
on
s)
primary sector industryconstruction market servicesgovernment and education* healthcare*other services* net job creationshare of market activities in total employment (right)

1. Scene setter: Economic situation and outlook
8
Despite the Belgian economy’s strong service
orientation, goods still represent almost three
quarters of gross exports. Services achieve a
broadly stable surplus of almost 2 % of GDP (4).
Considering that Belgium is a large net commodity
importer, prices for energy and other commodities
greatly influence the trade balance. However,
steady terms of trade losses explain only half of
the deterioration in the goods balance between
2003 and 2008. Strong import volume growth
relative to exports was also a factor (Graph 1.9).
Conversely, the improvement of the goods balance
in recent years is due in equal measure to price and
volume effects. In 2015, the decline in energy
prices caused a particularly strong improvement in
the terms of trade. The latest Commission forecast
expects the goods balance to fall again in coming
years, as import grows stronger on the back of
higher domestic demand.
Graph 1.9: Goods balance: breakdown of growth
Source: European Commission
Belgium has a strong net creditor position. The
country is a net lender to the rest of the world,
meaning that external financial assets exceed
liabilities. The balance between these two is the
net international investment position. It has
remained fairly stable at about 50-60 % of GDP,
among the highest in the euro area. Belgium's
robust external position means that continuing
modest current account deficits would not
jeopardise overall external sustainability.
However, the internal distribution of assets and
(4) Two important patents caused a temporary rise in imports
in 2014 and 2015. The impact in 2015 on the service and
current account balances was more than 1 % of GDP.
liabilities across economic sectors reveals a key
structural feature of the Belgian economy: a
private sector with a strong creditor status versus
the entrenched debtor position of the public sector.
Public finances
Belgium’s public finances did not come out of
the crisis unscathed. The headline balance turned
red, reaching a deficit of more than 5 % in 2009.
Belgian authorities have struggled to overcome
this setback against the background of
unimpressive growth and bouts of political
impasse. The budgetary deficit is set to narrow
slowly in the coming years, from 2.9 % of GDP in
2015 to 2.4 % in 2017. In structural terms —
adjusting for the impact of the business cycle and
one-off budgetary measures — progress is more
limited though: from a structural deficit of 2.7 %
of GDP in 2015 to 2.2 % in 2017.
Support to the financial sector and the
accumulation of substantial deficits have been
driving up public debt since 2008, aborting a
lengthy debt reduction cycle. Debt dynamics
have nevertheless been curtailed by the long-term
trend of falling interest rates. These induce a
reverse snowball effect which has absorbed part of
the budgetary deficits. The rise in the debt ratio has
levelled off further as the deficit has narrowed.
Debt is expected to peak at 106.6 % in 2016 and
fall to 105.6 % in 2017. Belgium’s high public
indebtedness, a persistent feature, is discussed in
Section 2.4 on the macroeconomic implications of
the public debt. The focus will be in particular on
the interplay between public and private
indebtedness, how the interlinkages with the
financial sector have developed and how the long-
term sustainability of public finances has improved
following the recent pension reforms.
-8.0
-6.0
-4.0
-2.0
0.0
2.0
4.0
6.0
01 03 05 07 09 11 13 15e
terms of trade volume change in goods balance

1. Scene setter: Economic situation and outlook
9
(Continued on the next page)
Box 1.1: Investment challenges
Macroeconomic perspective
Investment did not experience the steep decline observed in other countries in the wake of the
financial crisis. Between 2000 and 2008, investment represented an average of 22.1 % of GDP, compared
with 22.5 % since. Both private and public investment spending has proved resilient in recent years, as
shown in Graph 1a, with modest improvements projected in 2016 and 2017.
Public investment has been structurally low for several decades, as a result of policy choices within a
context of prolonged fiscal consolidation (1). It reached 2.4 % of GDP between 2008 and 2015, slightly up
from a pre-crisis average of 2.1 % of GDP. Sustained cutbacks in investment budgets are reflected in net
public investment (i.e. the capital stock corrected for use and wear), which has averaged zero since the
1990s (Graph 2a), eroding the quality of public infrastructure. For example, the World Economic Forum
ranks Belgium 30th as regards ‘quality of roads’, a long way behind neighbouring countries.
Investment in construction has proven resilient compared with the EU (Graph 1b). Total construction
spending rose from 9.8 % of GDP in 2000-2008 to 11.0 % of GDP between 2009 and 2015 (it fell from
11.4 % of GDP to 10.2 % of GDP in the EU). The disparity with the EU before the crisis was caused by the
lower rate of non-housing construction in Belgium. Again, this highlights the country’s infrastructure
shortcomings. Despite sharp real price increases in the decade before 2008, Belgium did not experience a
construction boom. Housing investment remained fairly stable relative to both GDP and disposable income.
House price increases were driven essentially by taxation, interest rate developments and demographics, as
discussed in last year’s report. In real terms, Belgian house prices have hardly changed at all since 2010. The
current low interest rate environment provides substantial support to prices.
Graph 1: Investment trends
Source: European Commission, 2016 winter forecast
The component that has been least dynamic since the crisis is investment in equipment. It fell from an
average of 9.2 % between 2000 and 2008 to 7.6 % between 2009 and 2015. This reflects the sluggish
recovery in the euro area economy, which takes the greater part of Belgian exports. Investment in equipment
has increased since 2014, however, and prospects for company investment have been brightening further.
Favourable commodity prices and measures to reduce labour costs have been improving profit margins.
Accommodating lending conditions further support the outlook for investment in equipment.
(1) Infrastructure spending has often been implemented through public-private partnerships or through capital grants to
nominally non-public entities.
0
2
4
6
8
10
0
5
10
15
20
25
00 01 02 03 04 05 06 07 08 09 10 11 12 13 14 15e 16f 17f
a) Public and private investment (%GDP)
BE private investmentEU28 private investmentBE public investment (right-hand scale)EU28 public investment (right-hand scale)
0
2
4
6
8
10
12
14
0
2
4
6
8
10
12
14
00 01 02 03 04 05 06 07 08 09 10 11 12 13 14 15e 16f 17f
b) Investment components (%GDP)
BE construction EU28 construction
BE equipment EU28 equipment
BE other investment EU28 other investment

1. Scene setter: Economic situation and outlook
10
Box (continued)
Graph 2: Net fixed capital formation and power supply
*transmission grid data (i.e. excluding energy units
connected to the distribution grid, e.g. solar panels)
Source: European Commission; Elia
Assessment of barriers to investment and ongoing reforms
There are several major barriers to private investment in Belgium (2). For example, the country still has
a labour cost disadvantage compared with its peers, despite considerable headway in recent years (see
Section 2.1). For energy-intensive industries, energy costs may be more significant (see Box 2.1.1), while
research activities depend on the availability of people with the right skills (see Section 3.1). Other factors
affecting the general investment climate include regulatory requirements concerning property registration,
labour legislation and construction permits for large projects (see Section 2.3), including in infrastructure
and retail. The areas in which most investment is needed are transport infrastructure and energy production.
The transport network represents the most pressing investment gap. Belgium’s geographical location,
coupled with the presence of international organisations, has enabled the country to attract many distribution
centres, logistic bases, and the international headquarters of various companies. However, there is a growing
problem of peak hour congestion which undermines the country’s attractiveness and entails important
economic costs (see Section 3.3). Given the high concentration of economic activity around the capital and
the ports, the most urgent challenges are upgrading basic rail and road transport infrastructure and
eliminating missing links between the main economic hubs.
Another challenge relates to the adequacy of domestic power generation and the security of supply in
general. Hampered by repeated interruptions, Belgium’s ageing nuclear installations have become
undependable sources, while the repeatedly revised timetable for phasing out the nuclear park has created a
climate unsupportive to long-term investment decisions. This is reflected in higher imports (Graph 2b) and
an increasingly impaired security of supply. Though short-term supply risks have abated (see Box 3.3.1),
longer-term investment needs are still considerable. In addition to substantial new domestic production
capacity and a further increase in interconnections (3), smart grids are needed to develop demand-side
management. Bearing in mind the considerable lead time for large projects in the energy sector and the high
need for replacement capacity during the next decade, swift action will be required.
(2) See ‘Member States Investment Challenges’, SWD(2015) 400 final/2. (3) Though interconnections represented 17 % of the installed production capacity in 2014 (i.e. above the EU target of
10 %), diversifying connections might help alleviate supply risks (see Box 3.3.1). See ‘Achieving the 10 % electricity
interconnection target — Making Europe’s electricity grid fit for 2020’, COM(2015) 082 final.
0
2000
4000
6000
8000
10000
12000
0
2000
4000
6000
8000
10000
12000
Jan-2012 Jan-2015
b) Power generation* and imports
(MW, average)
Imported Nuclear
Gas Wind
Coal Hydro
Other Total domestic capacity
-1.0%
-0.5%
0.0%
0.5%
1.0%
1.5%
2.0%
2.5%
3.0%
3.5%
4.0%
15120906030097949188858279767370
a) Net fixed capital formation
(general government, %GDP)
1. Scene setter: Economic situation and outlook
11
Financial sector
Belgium did not have a lending boom before the
financial crisis, nor did it experience a credit
crunch similar to other euro area countries.
Average credit growth to non-financial companies
has nevertheless been low in recent years, though
lower credit demand in a weak economy was seen
as the main driving force behind this. Indeed, as
credit demand started to rise in 2015, credit growth
has followed. Lending is supported by a large
deposit base, representing 80 % of GDP (euro-area
average: 62 %). Recently, new inlays have levelled
off somewhat, supposedly reflecting very low
interest rates and a falling savings rate as
households smoothen their consumption pattern.
The 2008 financial crisis and its aftershocks had
a severe impact on the Belgian financial system.
However, the crisis was not of domestic origin,
there being no real estate bubble or
unsustainable credit growth. Rather, it emerged
that Belgian banks were heavily exposed to the
toxic products permeating the global financial
system and relied too much on volatile short-term
funding. The authorities had to nationalise and
subsequently recapitalise several major
institutions, and provide loans and guarantee
provisions. Part of this support has since been
redeemed. In particular, the drawn-out resolution
of the main problem bank, Dexia, continues to
confront the Belgian state coffers with sizeable,
though falling, contingent liabilities.
The solvency of the Belgian financial system has
remained stable in recent years. The capital
adequacy ratio reached 19.2 % in Q2-2015,
compared with 16.1 % in the euro area. The debt to
equity ratio has been pushed back by strengthening
capital through equity rounds and profit retention.
Banks have also refocused on less-risky core
business activities. Total liabilities fell from a peak
Box 1.2: Contribution of the EU Budget to structural change
Belgium is a beneficiary of the European Structural and Investment Funds (ESIF) and can receive up to
EUR 2.7 billion for the period 2014-2020. This is equivalent to 3.8% of the expected national public
investment in areas supported by the ESI funds.
A number of reforms were implemented to satisfy ex-ante conditionalities and ensure successful
investments and effective delivery of the Europe 2020 objectives and targets. The Brussels Capital region
has still to fulfil action plans in order to meet the ex-ante conditionalities for investments in the domain of
research, development and innovation. Where ex-ante conditionalities are not fulfilled by end 2016, the
Commission may suspend interim payment to the priorities of the programme concerned.
In connection with Europe 2020 objectives, the ESI Funds in Belgium have a strong focus on promoting
an innovation-friendly business environment, actions in the area of low carbon economy and actions in
the field of employment, social inclusion and education. For instance programmes focus on making
SMEs more competitive, improving innovation and research performance through developing synergies
between businesses, R&D centres and higher education and stimulating the growth of the e-economy.
Actions in the field of employment, social inclusion and education, will contribute to Belgium' EUROPE
2020 targets (reduction of poverty, reduction of early school leaving and reaching an employment rate of
73.2 % by 2020). Specific attention will be devoted to young people, in particular with the
implementation of the Youth Employment Initiative in Wallonia and in Brussels.
Financing under the new European Fund for Strategic Investments (EFSI), Horizon 2020, the Connecting
Europe Facility and other directly managed EU funds would be additional to the ESI Funds. Following
the first rounds of calls for projects under the Connecting Europe Facility, Belgium has signed
agreements for EUR 419 million for transport projects. For more information on the use of ESIF in
Belgium, see: https://cohesiondata.ec.europa.eu/countries/BE.

1. Scene setter: Economic situation and outlook
12
of almost 400 % of GDP in 2008 to around 270 %
in October 2015 compared with around 300 % of
GDP in the euro area (from a peak of 350 %).
Table 1.1: Key economic, financial and social indicators — Belgium
(1) Sum of portfolio debt instruments, other investment and reserve assets
(2; 3) domestic banking groups and stand-alone banks.
(4) Domestic banking groups and stand-alone banks, foreign (EU and non-EU) controlled subsidiaries and foreign (EU and
non-EU) controlled branches.
(*) Indicates BPM5 and/or ESA95
Source: European Commission, winter forecast 2016; ECB
2003-2007 2008 2009 2010 2011 2012 2013 2014 2015 2016 2017
Real GDP (y-o-y) 2.5 0.7 -2.3 2.7 1.8 0.2 0.0 1.3 1.3 1.3 1.7
Private consumption (y-o-y) 1.4 1.7 0.5 2.7 0.3 0.6 0.9 0.4 1.4 0.9 1.2
Public consumption (y-o-y) 1.3 2.8 1.1 1.0 1.3 1.5 -0.1 0.6 0.1 0.6 0.3
Gross fixed capital formation (y-o-y) 4.7 1.9 -6.6 -0.8 4.2 0.2 -1.7 7.0 1.7 -0.2 3.1
Exports of goods and services (y-o-y) 4.8 1.7 -9.4 10.3 6.7 1.8 1.6 5.4 2.8 4.3 5.3
Imports of goods and services (y-o-y) 4.9 3.6 -9.1 9.6 7.3 1.4 0.8 5.9 3.3 3.6 5.1
Output gap 0.9 1.8 -1.6 -0.2 0.2 -0.6 -1.3 -0.9 -0.8 -0.8 -0.4
Potential growth (y-o-y) 1.9 1.7 1.2 1.2 1.3 1.0 0.8 1.0 1.2 1.3 1.2
Contribution to GDP growth:
Domestic demand (y-o-y) 2.0 1.9 -1.1 1.5 1.4 0.7 0.0 1.9 1.1 0.6 1.4
Inventories (y-o-y) 0.4 0.1 -0.9 0.5 0.7 -0.9 -0.7 -0.2 0.6 0.1 0.0
Net exports (y-o-y) 0.1 -1.3 -0.3 0.7 -0.3 0.3 0.7 -0.4 -0.4 0.6 0.3
Contribution to potential GDP growth:
Total Labour (hours) (y-o-y) 0.5 0.5 0.3 0.5 0.7 0.4 0.2 0.3 0.5 0.5 0.4
Capital accumulation (y-o-y) 0.6 0.7 0.4 0.3 0.4 0.4 0.3 0.5 0.5 0.4 0.5
Total factor productivity (y-o-y) 0.8 0.5 0.4 0.3 0.3 0.2 0.2 0.2 0.3 0.3 0.3
Current account balance (% of GDP), balance of payments 2.6 -1.0 -1.1 1.8 -1.1 -0.1 -0.2 -0.2 . . .
Trade balance (% of GDP), balance of payments 2.7 -1.3 1.1 1.3 -0.7 -0.8 0.0 0.3 . . .
Terms of trade of goods and services (y-o-y) -0.5 -2.6 3.1 -1.6 -1.2 -0.3 0.0 0.0 1.6 0.2 -0.1
Capital account balance (% of GDP) -0.2 -0.5 -0.2 -0.2 -0.1 0.6 -0.1 -0.3 . . .
Net international investment position (% of GDP) 35.5 51.8 57.5 65.2 60.9 51.8 51.9 59.3 . . .
Net marketable external debt (% of GDP) (1) 16.1* 23.7 36.5 43.7 43.5 37.7 33.5 25.9 . . .
Gross marketable external debt (% of GDP) (1) 240.4* 265.0 238.7 216.6 212.7 197.5 169.5 185.2 . . .
Export performance vs. advanced countries (% change over 5 years) 0.4 -0.9 -1.3 -4.2 0.8 -5.4 -4.1 -4.6 . . .
Export market share, goods and services (y-o-y) -1.3 -1.8 1.1 -6.8 -2.2 -6.3 2.2 2.2 . . .
Net FDI flows (% of GDP) -1.3 6.0 -12.4 -10.7 -6.1 5.5 0.9 2.6 . . .
Savings rate of households (net saving as percentage of net disposable income) 9.3 10.0 11.4 8.2 6.6 6.4 5.0 5.1 . . .
Private credit flow (consolidated, % of GDP) 9.5 17.1 6.2 3.2 21.2 14.2 8.9 -4.1 . . .
Private sector debt, consolidated (% of GDP) 123.2 162.3 164.8 161.7 174.2 186.8 161.8 157.3 . . .
of which household debt, consolidated (% of GDP) 42.2 48.7 51.0 51.9 53.6 54.6 55.6 57.6 . . .
of which non-financial corporate debt, consolidated (% of GDP) 81.1 113.6 113.8 109.8 120.6 132.2 106.2 99.7 . . .
Corporations, net lending (+) or net borrowing (-) (% of GDP) 2.1 -0.8 1.5 4.8 2.0 4.2 2.7 2.8 3.6 4.0 4.1
Corporations, gross operating surplus (% of GDP) 24.3 24.3 23.7 25.5 25.5 24.5 24.4 24.8 25.6 25.9 26.1
Households, net lending (+) or net borrowing (-) (% of GDP) 2.9 3.0 4.8 2.7 2.1 2.0 1.2 0.9 0.8 0.8 0.7
Deflated house price index (y-o-y) 6.5 1.2 -0.1 1.4 1.0 0.2 0.1 -1.1 . . .
Residential investment (% of GDP) 5.7 6.5 6.1 6.1 5.8 5.9 5.7 5.9 . . .
GDP deflator (y-o-y) 2.1 2.0 0.8 1.9 2.0 2.0 1.3 0.7 1.2 1.5 1.6
Harmonised index of consumer prices (HICP, y-o-y) 2.0 4.5 0.0 2.3 3.4 2.6 1.2 0.5 0.6 1.4 1.7
Nominal compensation per employee (y-o-y) 2.5 3.7 1.1 1.4 3.1 3.2 2.6 0.9 0.5 0.4 1.8
Labour productivity (real, person employed, y-o-y) 1.4 -1.0 -2.1 2.0 0.4 -0.2 0.4 1.0 . . .
Unit labour costs (ULC, whole economy, y-o-y) 1.1 4.7 3.3 -0.7 2.7 3.4 2.2 -0.1 0.0 0.0 1.3
Real unit labour costs (y-o-y) -1.0 2.7 2.4 -2.5 0.7 1.4 0.8 -0.7 -1.2 -1.4 -0.3
Real effective exchange rate (ULC, y-o-y) 1.0 3.2 0.2 -2.8 2.2 -0.7 3.4 -0.7 -4.0 -0.9 .
Real effective exchange rate (HICP, y-o-y) 1.1 2.7 0.5 -2.6 0.6 -2.3 1.5 0.3 -3.0 1.7 -0.4
Tax wedge on labour for a single person earning the average wage (%) 42.0 42.5 42.0 42.1 42.2 42.7 42.6 42.3 . . .
Taxe wedge on labour for a single person earning 50% of average wage (%) 26.0* 26.9 25.8 26.1 26.4 27.5 26.7 25.9 . . .
Total Financial Sector Liabilities, non-consolidated (y-o-y) 12.6 -4.2 -0.5 1.4 5.8 -5.3 2.0 4.0 . . .
Tier 1 ratio (%) (2) . 10.8 12.6 14.1 13.3 14.8 16.9 15.5 . . .
Return on equity (%) (3) . -62.3 -8.0 10.8 -3.2 2.6 6.9 8.3 . . .
Gross non-performing debt (% of total debt instruments and total loans and
advances) (4). 3.9 4.1 3.9 4.2 5.1 5.3 3.3 . . .
Unemployment rate 8.2 7.0 7.9 8.3 7.2 7.6 8.4 8.5 8.3 8.0 7.4
Long-term unemployment rate (% of active population) 4.0 3.3 3.5 4.1 3.5 3.4 3.9 4.3 . . .
Youth unemployment rate (% of active population in the same age group) 20.8 18.0 21.9 22.4 18.7 19.8 23.7 23.2 21.2 . .
Activity rate (15-64 year-olds) 66.0 67.1 66.9 67.7 66.7 66.9 67.5 67.7 . . .
People at-risk poverty or social exclusion (% total population) 22.2 20.8 20.2 20.8 21.0 21.6 20.8 21.2 . . .
Persons living in households with very low work intensity (% of total population
aged below 60)14.7 11.7 12.3 12.7 13.8 13.9 14.0 14.6 . . .
General government balance (% of GDP) -0.8 -1.1 -5.4 -4.0 -4.1 -4.1 -2.9 -3.1 -2.9 -2.8 -2.4
Tax-to-GDP ratio (%) 45.3 45.5 44.8 45.2 45.8 47.0 47.9 47.6 46.9 46.7 46.6
Structural budget balance (% of GDP) . . . -3.9 -4.0 -3.4 -2.8 -2.9 -2.7 -2.4 -2.2
General government gross debt (% of GDP) 94.0 92.4 99.5 99.6 102.2 104.1 105.1 106.7 106.1 106.6 105.6
forecast

13
External trade performance
Belgium’s share of global export markets has
declined for most of the past 15 years, as Graph
2.1.1 shows. Almost a third of market shares were
lost between 2000 and 2012, as export growth fell
short of world import growth. However, matters
have improved since 2013, with increased market
shares for both goods and services. While the
downward trend has been halted, the accumulated
loss remains substantial: 27 % of international
market shares were lost between 2000 and 2014.
Over the same period, the market shares of France,
the Netherlands and Germany fell by 29 %, 11 %
and 5 % respectively.
Graph 2.1.1: Export market shares (XMS) for goods
Source: European Commission
The trend of falling market shares was driven
by goods exports, with the export performance
(5) According to Article 5 of Regulation no. 1176/2011.
of services remaining broadly stable. As services
account for only a small share of total exports,
their performance did not offset losses in the goods
balance. The relatively weak growth in goods
exports reflects both volume and price
developments. While the volume shows that
Belgian exports are outpaced by global demand,
price developments suggest that the average price
received for these exported products has risen less
than average international prices.
Graph 2.1.2: Market dynamism and competitiveness of
goods exports for top-10 countries (2000-14)
The bubble size reflects the country's relative importance to
Belgium.
Source: European Commission
Export market share dynamics can be broken
down on the basis of two approaches: a
geographical and sectoral/product approach.
The geographical breakdown for 2000-2014
(Graph 2.1.2) shows how Belgian companies
export mainly towards countries whose import
growth is less dynamic than global imports. The
50
60
70
80
90
100
110
120
-10
-8
-6
-4
-2
0
2
4
01 02 03 04 05 06 07 08 09 10 11 12 13 14
rate
of
change y
ear-
on-y
ear
(%)
Contribution to EMS: goodsContribution to EMS: servicesExport market share growth year-on-yearEMS (2000 = 100)
DE
FR
NL UKUS
ITES
IN
CN
PL
-15
-10
-5
0
5
10
15
20
25
30
-15.0 -10.0 -5.0 0.0 5.0 10.0
Mark
et
Dyn
am
ism
(p
ps
.)
Competitiveness (pps.)
2. IMBALANCES, RISKS, AND ADJUSTMENT ISSUES
This section provides the in-depth review foreseen under the macroeconomic imbalance procedure
(MIP) (5). It focuses on the risks and vulnerabilities flagged in the Alert Mechanism Report 2016. The
section analyses the reasons behind the decline in competitiveness of the Belgian economy, government
measures to moderate labour cost growth, and performance as regards innovation and business
environment, key factors in raising productivity growth, the ultimate driver of sustainable wage and job
growth. Macroeconomic risks stemming from high levels of both private and public debt are analysed as
well, paying attention to issues with a bearing on the sustainability of public debt such as fiscal
consolidation, pension reforms, and the fiscal framework. The section concludes with the MIP
assessment matrix, which summarises the main findings.
2.1 COMPETITIVENESS, TRENDS AND PERFORMANCE

2.1. Competitiveness: trends and performance
14
impact of this orientation, which can be considered
largely exogenous, was reinforced by additional
losses suffered on average on these markets, in
particular Germany, France and the Netherlands,
Belgium’s main trading partners. This more
endogenous development points to the existence of
a problem of competitiveness. Graph 2.1.3
presents the sectoral breakdown. On the one hand,
Belgium has products for which world demand has
grown at an above-average rate. On the other hand,
this favourable initial product specialisation could
not prevent heavy market share losses, as Belgian
products were generally outcompeted, suggesting
quality problems. Important sectors such as the
chemical and refined petroleum sectors performed
better than most other sectors, but mostly in the
years before the onset of the crisis in 2008.
Graph 2.1.3: Market dynamism and competitiveness of
goods exports for top-12 sectors (2000-14)
- 1 chemicals; 2 machinery & electrical; 3 mineral products;
4 vehicles, aircraft & vessels; 5 metals; 6 plastics & rubber; 7
precious stones; 8 foodstuffs; 9 textiles; 10 instruments
- The bubble size reflects the country's relative importance
to Belgium.
Source: European Commission
Global value chains
Direct import and export flows recorded in
gross trade data do not tell the full story of
competitiveness. Production processes have
become increasingly fragmented as they are split
up and scattered across countries. This has led to
high export growth which overestimates the related
income gains, as they comprise the value generated
at all production stages. This is particularly so for
countries that rely heavily on trade in imported
intermediates, often small open economies such as
Belgium. Domestic value added gives a better idea
of the actual income generated by gross trade.
Belgium is deeply integrated in global value
chains. The participation index shown in Graph
2.1.4 sums foreign suppliers (backward
integration) and buyers (forward integration) of a
country’s intermediate products. The backward
indicator shows the foreign value added share of
each country’s gross exports. These are imported
inputs that feed into domestic production. The
forward indicator shows the share of a country’s
exports that is further transformed in the global
value chain and thus embedded in gross exports of
third countries. Combined, both indicators provide
an idea of the degree to which a national economy
is integrated in global value chains.
Graph 2.1.4: Integration in international production chains
(2011)
Source: European Commission (based on WIOD)
The extent to which countries can take
advantage of integration in international
production chains varies across countries. Small
and open countries source more intermediate
goods from abroad so that the foreign value added
of exports is generally higher than in larger or
more resource-rich countries. This is also the case
for Belgium. Food products, textile products, paper
products and chemical products have the highest
domestic value added among goods, over two-
thirds of gross exports.
1
2
3
45
6
7
8
9
1011 12
-10
-5
0
5
10
15
20
25
-40.0 -20.0 0.0 20.0
Mark
et
Dyn
am
ism
(p
ps.)
Competitiveness (pps.)0
10
20
30
40
50
60
70
80
90
100
IN CA
CN
BR
US
JP
EL
CY ID TU
AU
MX
RoW LV IT
RO
PT
DE
FR
UK
ES
LT
BG
SE
DK
EE
MT
PL IE AT
RU SI
KR FI
NL
HU
BE
SK
CZ
TW LU
backward integration forward integration

2.1. Competitiveness: trends and performance
15
A look at the composition of domestic value
added clearly shows Belgium’s orientation
towards intermediates (Graph 2.1.5).
Intermediates account for two thirds of
domestically produced value added, a share which
is among the EU’s highest. This means that
Belgium has one of the EU’s lowest shares of final
products. From this it can be concluded that,
compared with other EU countries, Belgium
mainly produces inputs for other countries and
generates relatively few final products itself. These
findings tie in with earlier country reports which
highlighted Belgium’s comparatively low volume
of capital goods exports and showed that their
share of total exports had been declining.
Graph 2.1.5: Composition of domestic value added
content in gross exports (2011)
For countries with a large (small) tourism sector the share of
final products is generally higher (lower). The share of
intermediates remains broadly the same for BE when only
manufactured exports are taken into account.
Source: OECD
Value chain analysis puts into perspective the
low share of services in gross exports. Aside
from their direct contribution to trade, services also
contribute indirectly, as they represent a
substantial share of inputs into the production of
goods. This is especially true for Belgium, where
services accounted for almost 45 % of the value of
manufactured exports in 2011, second only to
France. Business services and wholesale, retail and
hotels are the main service types embedded in
manufactured exports, with smaller contributions
by transport and telecoms, and finance and
insurance. The sectors with the highest services
content of exports are food products, textiles and
apparel, basic metals, and motor vehicles (6).
Services thus represent a significant part of
Belgium’s integration within value chains. This
highlights how service activities, even when they
do not engage directly in international trade,
nevertheless matter for overall external
competitiveness, as they have cascade effects.
Quality of export goods
Product quality is arguably the prime non-price
component of competitiveness, as it largely
determines, together with cost parameters,
consumer demand for a product. As shown in
Graph 2.1.6, the average quality of the Belgian
product range is skewed to the left. This means
that Belgium exports mainly lower quality goods.
This specialisation has been stable in recent years,
according to estimates. Average quality in the
neighbouring countries is higher: Germany and the
Netherlands are situated in the medium range,
while French exports are concentrated more at the
upper end of the quality spectrum (7).
Belgium lags behind its neighbours in terms of
export of top quality products, ranking 25th in
the EU. The opposite holds for products at the
bottom of the quality scale, which account for a
larger share of Belgian goods exports, according to
these estimates.
This orientation towards below-average quality,
lower value-added market segments makes
Belgian export performance more dependent on
cost factors, as these segments are subject to
tough price competition. Developing the most
specialised production stages along value chains
helps to ease such pressure. Doing so depends on a
broad range of conditions, linked to innovation and
technology content, company creation and growth,
product and process development, trade
participation, and factors conducive to a supportive
business environment. These are discussed in
Section 2.3.
(6) OECD-WTO, Trade in value added, 2015.
(7) When the distribution is done in terms of export value,
Belgium, France and the Netherlands are situated in the broad medium range; Germany in the upper medium. The
findings for top quality products are the same in value as in
number of products, with Belgium ranked 22nd in the EU.
0%
10%
20%
30%
40%
50%
60%
70%
80%
90%
100%
HR
CY
EL
PT
ES
MT IT
BG
FR
HU LT
PL
CZ
AT
ES
RO SI
SK
DE IE NL
LU
DK
UK
SE
LV FI
BE
final products intermediate products

2.1. Competitiveness: trends and performance
16
Graph 2.1.6: Product quality estimate (exported goods)
The quality of a good is subjective (quality as perceived by
consumers in a particular market, the EU market in this
case) as reflected in prices, not the intrinsic quality of a
product. See di Comité, Thisse and Vandenbussche (2014)
& Vandenbussche (2014) for a description of the approach
taken to the quality indicators discussed.
Source: European Commission
Cost parameters
Between 2004 and 2013, Belgian companies had
to cope with fast wage increases, starting from a
high level. Hourly labour costs are among the
highest in the EU, and they are the highest in the
euro area. Graph 2.1.7 highlights how wage
growth in Belgium almost always outstripped
wage growth in the neighbouring countries
between 2004 and 2013, with especially large
differences in 2009-2010. During this decade, the
average annual increase in labour costs reached
2.8 % in Belgium, compared with 2.4 % in the
euro area and 2.1 % in the neighbouring countries,
mainly as a result of slower growth in Germany.
Since the start of 2014, a trend reversal has
emerged, with labour costs growing by 0.5 % on
average, compared with 1.4 % in the euro area and
1.7 % in the neighbouring countries. The drivers
behind the relatively fast wage growth in the past
and the slowdown observed in recent years are
discussed in Section 2.2, which takes a close look
at wage-setting and the policy measures enacted.
Graph 2.1.7: Quarterly hourly labour cost (% change year-
on-year; business sector)
Source: European Commission
For purposes of competitiveness, wage levels
and growth rates need to be assessed against
domestic productivity levels and growth
rates (8). Both are confronted within the concept
of unit labour costs (ULC), which provide a prime
indicator of cost competitiveness for activities in
which labour is the predominant cost factor. It has
been found that together with non-cost elements
such as quality, unit labour costs affect the export
performance of Belgian companies — particularly
as regards labour-intensive activities — and the
propensity to start or stop exporting (9). Unit
labour costs and tax levels also affect a country’s
capacity to trigger new, productive investments.
(8) However, within the Belgian framework of cost
competitiveness monitoring, it is wage growth relative to
Germany, France and the Netherlands since 1996 that is scrutinised (see Section 2.2).
(9) Decramer et al. (2015), How do exporters react to changes
in cost competitiveness?, NBB Working Paper 276.
0.0
0.2
0.4
0.6
0.8
1.0
1.2
1.4
1.6
0.0 0.2 0.4 0.6 0.8 1.0
Density
Quality Rank Exported Products (1 = highest)
Quality rank: # of products exported (2014)
BE DE FR NL
0.00
0.05
0.10
0.15
0.20
0.25
0.30
0.35
bottom low middle high top quality
Quality share: # of products exported (2014)
BE DE FR NL
-3.0
-2.0
-1.0
0.0
1.0
2.0
3.0
4.0
5.0
6.0
01 02 03 04 05 06 07 08 09 10 11 12 13 14 15
difference BE vs. DE/FR/NL
DE/FR/NL (weighted average growth rate)
2.1. Competitiveness: trends and performance
17
Graph 2.1.8: Difference in unit labour cost level: BE vs.
Germany, France and the Netherlands
Source: European Commission
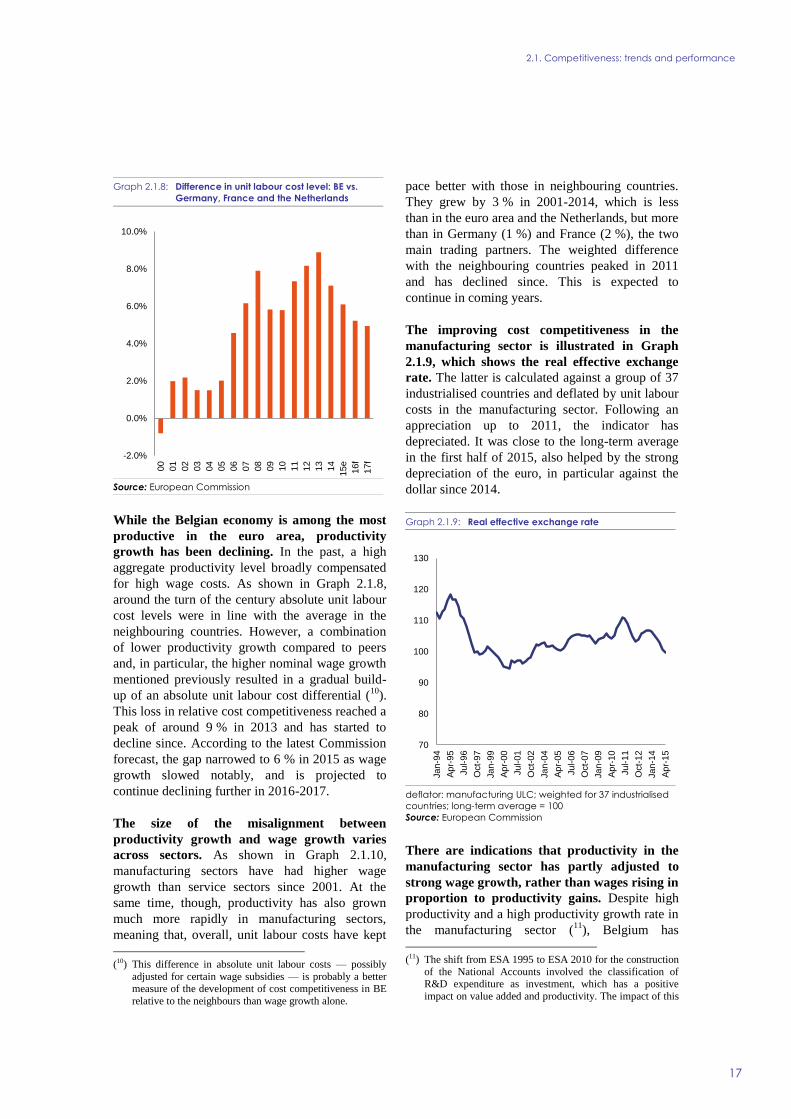
While the Belgian economy is among the most
productive in the euro area, productivity
growth has been declining. In the past, a high
aggregate productivity level broadly compensated
for high wage costs. As shown in Graph 2.1.8,
around the turn of the century absolute unit labour
cost levels were in line with the average in the
neighbouring countries. However, a combination
of lower productivity growth compared to peers
and, in particular, the higher nominal wage growth
mentioned previously resulted in a gradual build-
up of an absolute unit labour cost differential (10
).
This loss in relative cost competitiveness reached a
peak of around 9 % in 2013 and has started to
decline since. According to the latest Commission
forecast, the gap narrowed to 6 % in 2015 as wage
growth slowed notably, and is projected to
continue declining further in 2016-2017.
The size of the misalignment between
productivity growth and wage growth varies
across sectors. As shown in Graph 2.1.10,
manufacturing sectors have had higher wage
growth than service sectors since 2001. At the
same time, though, productivity has also grown
much more rapidly in manufacturing sectors,
meaning that, overall, unit labour costs have kept
(10) This difference in absolute unit labour costs — possibly
adjusted for certain wage subsidies — is probably a better measure of the development of cost competitiveness in BE
relative to the neighbours than wage growth alone.
pace better with those in neighbouring countries.
They grew by 3 % in 2001-2014, which is less
than in the euro area and the Netherlands, but more
than in Germany (1 %) and France (2 %), the two
main trading partners. The weighted difference
with the neighbouring countries peaked in 2011
and has declined since. This is expected to
continue in coming years.
The improving cost competitiveness in the
manufacturing sector is illustrated in Graph
2.1.9, which shows the real effective exchange
rate. The latter is calculated against a group of 37
industrialised countries and deflated by unit labour
costs in the manufacturing sector. Following an
appreciation up to 2011, the indicator has
depreciated. It was close to the long-term average
in the first half of 2015, also helped by the strong
depreciation of the euro, in particular against the
dollar since 2014.
Graph 2.1.9: Real effective exchange rate
deflator: manufacturing ULC; weighted for 37 industrialised
countries; long-term average = 100
Source: European Commission
There are indications that productivity in the
manufacturing sector has partly adjusted to
strong wage growth, rather than wages rising in
proportion to productivity gains. Despite high
productivity and a high productivity growth rate in
the manufacturing sector (11
), Belgium has
(11) The shift from ESA 1995 to ESA 2010 for the construction
of the National Accounts involved the classification of R&D expenditure as investment, which has a positive
impact on value added and productivity. The impact of this
-2.0%
0.0%
2.0%
4.0%
6.0%
8.0%
10.0%
00
01
02
03
04
05
06
07
08
09
10
11
12
13
14
15e
16f
17f
70
80
90
100
110
120
130
Jan
-94
Ap
r-95
Jul-9
6
Oct-
97
Jan
-99
Ap
r-00
Jul-0
1
Oct-
02
Jan
-04
Ap
r-05
Jul-0
6
Oct-
07
Jan
-09
Ap
r-10
Jul-1
1
Oct-
12
Jan
-14
Ap
r-15

2.1. Competitiveness: trends and performance
18
experienced more deindustrialisation than
comparable countries. This applies both to
employment and to the share in total value
added, as discussed in last year’s report. Faced
with high labour costs, Belgian industrial
companies thus appear to have increased their
capital-intensity by automating production. This
helps to preserve a cost-productivity balance, but
entails shedding jobs as labour is replaced by
capital to reach a new equilibrium. This would
help explain the ongoing job losses in Belgian
industry mentioned in Section 1, with ever fewer,
ever more productive companies remaining.
Clearly, if such a mechanism is indeed at play, this
raises concerns from an employment point of view
as competitiveness is preserved at the cost of lower
employment. The kind of labour most affected by
intensive automation are low-skilled tasks. As
discussed in Section 3.1, low-skilled people have a
particularly low employment rate in Belgium.
Unit labour costs for Belgian service sectors
developed unfavourably in the past decade.
Most countries show a sizeably higher unit labour
cost growth in service sectors than in
manufacturing sectors (Graph 2.1.10). This
sectoral dimension is explained by the nature of
many services, which makes productivity gains
harder to achieve. However, for Belgium this gap
is higher as a consequence of low productivity
growth in the service sectors since 2001. In the
past ten years, productivity growth has even
stagnated. This suggests that competition in the
new approach on productivity was, on average, higher for
Belgium than for neighbouring countries.
services sectors is on average lower in Belgium,
though the creation of many low-productive jobs
through the service voucher system might also
help explain stagnating productivity growth.
Considering the high intermediary consumption of
services by exporters highlighted above, this risks
saddling manufacturing sectors with a cost
disadvantage.
Graph 2.1.10: Trends in unit labour cost components (2001-2014)
Source: European Commission
100
105
110
115
100 105 110 115 120 125 130 135 140 145
Pro
du
cti
vit
y
Labour compensation per hour
A: total economy (2001=100)
average DE/FR/NL EA19 BE
100
110
120
130
140
150
100 105 110 115 120 125 130 135 140 145 150
Pro
du
cti
vit
y
Labour compensation per hour
B: manufacturing (2001 = 100)
average DE/FR/NL EA19 BE
100
105
110
115
100 105 110 115 120 125 130 135 140
Pro
du
cti
vit
y
Labour compensation per hour
C: market services (2001 = 100)
average DE/FR/NL EA19 BE
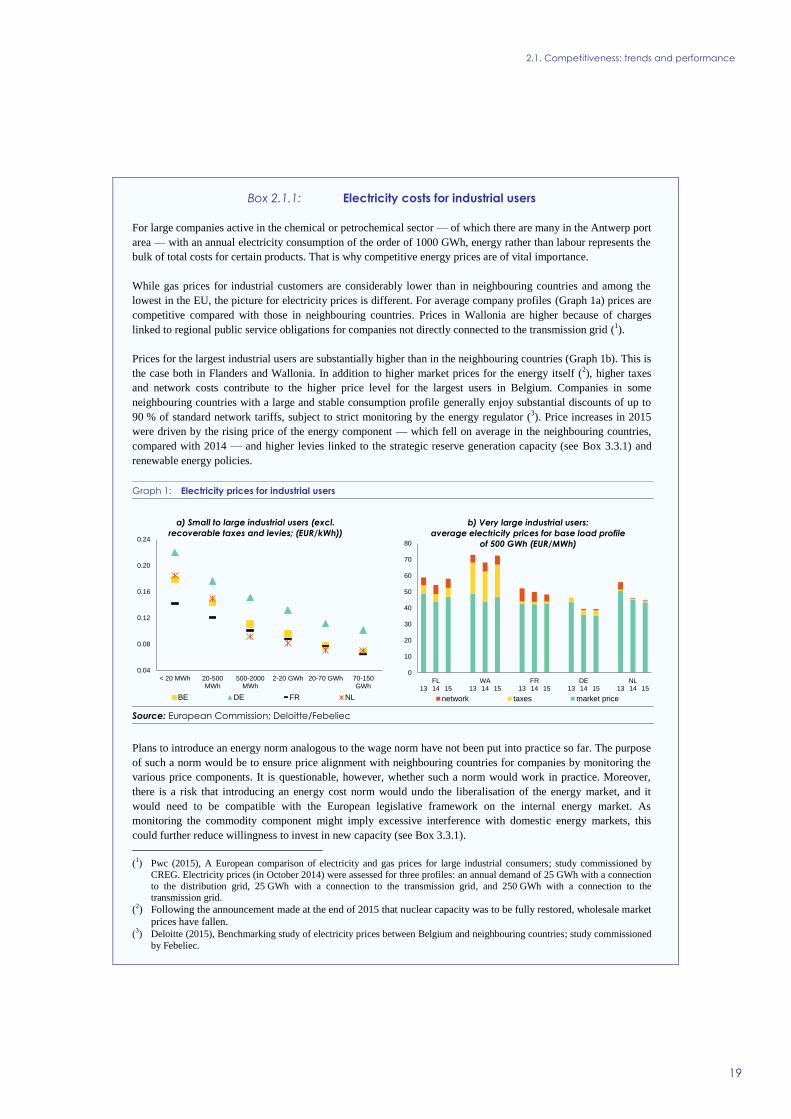
2.1. Competitiveness: trends and performance
19
Box 2.1.1: Electricity costs for industrial users
For large companies active in the chemical or petrochemical sector — of which there are many in the Antwerp port
area — with an annual electricity consumption of the order of 1000 GWh, energy rather than labour represents the
bulk of total costs for certain products. That is why competitive energy prices are of vital importance.
While gas prices for industrial customers are considerably lower than in neighbouring countries and among the
lowest in the EU, the picture for electricity prices is different. For average company profiles (Graph 1a) prices are
competitive compared with those in neighbouring countries. Prices in Wallonia are higher because of charges
linked to regional public service obligations for companies not directly connected to the transmission grid (1).
Prices for the largest industrial users are substantially higher than in the neighbouring countries (Graph 1b). This is
the case both in Flanders and Wallonia. In addition to higher market prices for the energy itself (2), higher taxes
and network costs contribute to the higher price level for the largest users in Belgium. Companies in some
neighbouring countries with a large and stable consumption profile generally enjoy substantial discounts of up to
90 % of standard network tariffs, subject to strict monitoring by the energy regulator (3). Price increases in 2015
were driven by the rising price of the energy component — which fell on average in the neighbouring countries,
compared with 2014 — and higher levies linked to the strategic reserve generation capacity (see Box 3.3.1) and
renewable energy policies.
Graph 1: Electricity prices for industrial users
Source: European Commission; Deloitte/Febeliec
Plans to introduce an energy norm analogous to the wage norm have not been put into practice so far. The purpose
of such a norm would be to ensure price alignment with neighbouring countries for companies by monitoring the
various price components. It is questionable, however, whether such a norm would work in practice. Moreover,
there is a risk that introducing an energy cost norm would undo the liberalisation of the energy market, and it
would need to be compatible with the European legislative framework on the internal energy market. As
monitoring the commodity component might imply excessive interference with domestic energy markets, this
could further reduce willingness to invest in new capacity (see Box 3.3.1).
(1) Pwc (2015), A European comparison of electricity and gas prices for large industrial consumers; study commissioned by
CREG. Electricity prices (in October 2014) were assessed for three profiles: an annual demand of 25 GWh with a connection
to the distribution grid, 25 GWh with a connection to the transmission grid, and 250 GWh with a connection to the
transmission grid. (2) Following the announcement made at the end of 2015 that nuclear capacity was to be fully restored, wholesale market
prices have fallen. (3) Deloitte (2015), Benchmarking study of electricity prices between Belgium and neighbouring countries; study commissioned
by Febeliec.
0.04
0.08
0.12
0.16
0.20
0.24
< 20 MWh 20-500MWh
500-2000MWh
2-20 GWh 20-70 GWh 70-150GWh
a) Small to large industrial users (excl.
recoverable taxes and levies; (EUR/kWh))
BE DE FR NL
0
10
20
30
40
50
60
70
80
13FL14 15 13
WA14 15 13
FR14 15 13
DE14 15 13
NL14 15
b) Very large industrial users:
average electricity prices for base load profile
of 500 GWh (EUR/MWh)
network taxes market price

20
Wage formation
The centre of gravity for wage-setting in
Belgium is situated at sectoral level, with
national standards providing for a high level of
coordination among sectors. At national level,
the Loi relative à la promotion de l’emploi et à la
sauvegarde préventive de la compétitivité (‘Law of
1996’) specifies the basis on which social partners
set the ‘wage norm’ every two years. This norm
determines the maximum real wage increase
allowed at sectoral level. It is set on the basis of
wage developments in the main trading partners
(see Box 2.2.1). Nominal wage adjustments for
inflation and pay scale increases (due to seniority
or promotion) are not affected by the wage norm.
The precise arrangements for the latter type of
wage adjustments are usually laid down in sectoral
collective bargaining agreements. Aside from the
wage norm covering the entire private sector (12
),
the national ‘guaranteed minimum monthly
income’ (13
) also limits wage-setting at
intersectoral, sectoral and company levels.
As the wage-setting process has resulted in
faster wage growth than in the countries of
reference, the wage norm has failed its purpose.
This was partly because predicted real wage
growth in these countries was overestimated
(particularly for Germany), and no adjustment was
made afterwards. Moreover, inflation has
repeatedly exceeded expectations and outpaced
price pressures in neighbouring countries, where
automatic cost-of-living adjustments are less
widespread than in Belgium. This explains the
entrenched wage growth differential until 2014
that was highlighted in Section 2.1.
In addition, the existing framework limits the
scope for wage restraint and adjustment
through real wages. Wage indexation and the
wage norm put a floor and a ceiling respectively
on total wage growth. Wage negotiations are
effectively limited to this bandwidth for all
companies. As a consequence, during an economic
(12) Wage-setting in public companies performing an economic
role has also been covered by the wage norm since 2015. (13) While not fully equal to a minimum wage as usually
defined and established by law, in practice it is close to it
and has the same legal value. The guaranteed minimum monthly income applies unless the relevant sectoral
collective bargaining agreement has set a higher threshold,
which is often the case.
downturn, when wage restraint could be warranted
to limit job losses, wage growth proves hard to
control.
A third problem with the Belgian macroecono-
mic wage coordination is the poor alignment
between wage and productivity trends. While
this might not have been a problem in earlier times
when productivity grew rapidly, the dwindling of
productivity gains has changed the analysis. This is
reflected in unit labour cost trends (see Section
2.1). To halt the deteriorating cost competitiveness
reflected in this and other indicators, the Belgian
authorities have sought to curb wage growth.
Corrective measures
The degree of national coordination has further
increased in recent years as the authorities
intervened in the wage-setting process to slow
down wage growth. Already in 2011-2012
(0.3 %) and 2013-2014 (0.0 %) the wage norm was
set by the federal government, as social partners
failed to reach an agreement. For 2015-2016 a
draft agreement supported by all but one of the
social partners was written into legislation by the
government. It allows for modest wage increases
in 2016 (0.8 %). At the same time, the government
enacted a temporary suspension of wage
indexation.
Sectoral wage indexation schemes have been
effectively suspended as of April 2015 and will
only be reactivated once the health index has
risen by 2 % (14
). The health index is a
measurement of core inflation and is the
mandatory benchmark for all indexation schemes.
While the timing of the loss varies from sector to
sector, the measure will eventually result in a real
wage loss of 2 % for almost all employees.
(14) In fact, the government is freezing the health index with
indexation continuing but on the basis of this skimmed
index.
2.2. LABOUR COSTS

2.2. Labour costs
21
Taken together, government measures have
resulted in a marked slowdown of wage growth
in recent years. Fading price pressures in 2013-
2014 also helped in this respect. Measures to
correct disproportionate past wage growth through
wage moderation are thus bearing fruit, improving
the country’s economic performance and its
attractiveness to foreign investors. Moreover,
Belgian authorities have pursued a tax shift away
from labour, to lower non-wage labour costs. The
precise design and composition of this tax shift is
discussed in Section 3.2.
Between 2016 and 2019, private sector
employers will benefit from general social
security reductions amounting to about
EUR 2 billion and specific ones of about
EUR 1 billion. The most prominent measure is the
planned reduction of the maximum facial rate of
employers’ social security contributions from
32.4 % to 25 %. However, it is worth noting that
actual rates are already some way below this
theoretical maximum. This reflects a series of
existing structural reductions and wage subsidies
that put the actual rate between 17.3 % and
27.9 %. These reductions and wage subsidies will
help bring the facial rate down to 25 % for the
highest wages. Graph 2.2.1 depicts the resulting
effective rates in 2015, 2016, 2018 and 2019.
As of 2018, effective rates will be 25 % or less
for all employees, with additional reductions for
Box 2.2.1: The Central Economic Council: role within the wage-setting process
The Belgian Central Economic Council (CEC) has the task of supporting social dialogue by providing social
partners with analysis and advice on socioeconomic matters. One of the fields it covers is the monitoring of
competitiveness developments, with a particular focus on wage costs. Its role is enshrined in the Law of
1996 framing macroeconomic wage policies in the country.
The Belgian CEC is managed by the social partners. It comprises a political council and a technical
secretariat providing input to the council. Of the 54 council members, 48 represent social partner
organisations. These interest representatives are nominated by their respective organisations and appointed
by the federal government for a renewable term of four years. The six other co-opted members have an
academic background and are directly appointed by the government. The council’s composition reflects the
Belgian consensual consultation model.
The Law of 1996 stipulates that the CEC is to publish a twice-yearly report on developments regarding
employment and labour costs in Belgium and the reference countries, Germany, France and the Netherlands.
Structural aspects of the country’s external competitiveness are also to be included in the analysis, as are
possible suggestions for improvement.
Aside from this general monitoring of economic developments, the CEC plays an important role in
determining the biennial wage norm. Every two years, the CEC presents a Technical Report in which it
proposes the available margins for nominal labour cost growth over the next two years and makes separate
projections for inflation. The CEC compares the growth in Belgian labour costs with that in neighbouring
countries, which gives the existing wage gap (1). The base year for this exercise is 1996, the year when the
wage norm was introduced by the said Law on macroeconomic wage policies. Absolute labour cost levels
are thus not considered, nor are any wage cost differentials that existed before 1996. In addition, an estimate
is made of labour cost growth in the neighbouring countries over the next two years. The wage gap and these
projections together determine the available margin presented in the Technical Report.
The CEC’s calculations provide the starting point for subsequent negotiations between social partners to set
the wage norm — within the broader context of an Interprofessional Agreement within two months of
publication of the Technical Report. The norm sets an upper ceiling for wage increases over the next two
years. Collective agreements negotiated at lower levels must comply with this. Since wage increases
resulting from indexation schemes and wage scales laid down in collective bargaining agreements are
always guaranteed, the wage norm corresponds to the maximum increase in real wages.
(1) 1.5 % in 2015, according to the Technical Report published in December 2015.

2.2. Labour costs
22
low to medium wages in 2019. For higher wages,
the contribution rate will thus be reduced by up to
3 percentage points (pps.). by comparison with the
2015 level, whereas the rate on the lowest wages
will fall by almost 7 pps., mostly as early as 2016.
Aside from lowering effective rates, the
government plans also have the merit of
simplifying the system and aligning the facial rate
with a reduced real rate. Deductions and wage
subsidies have resulted in a complex system. The
planned changes will therefore also make the
system easier for foreign investors to understand.
The highest potential for job creation lies in the
reduction of the employers’ contribution for
low-paid jobs — which are generally performed
by the lower skilled. Indeed, Belgium’s high
labour costs are particularly detrimental to jobs
with low productivity, given the mismatch
between both. This keeps down the employment
rate of low-skilled people in Belgium (see Section
3.1). With this in mind, the government’s decision
to pursue the largest reduction in contributions on
wages at the lower end of the wage scale is likely
to maximise the employment effect.
Labour cost growth in 2016 will be further
constrained by these measures, even if wage
indexation schemes are reactivated once the
2 % real wage cut is a reality. Total labour costs
per private sector employee would rise by 0.4 % in
2016. This compares with 0.5 % in 2015, which
was already the lowest in over two decades. As
discussed in Section 2.1, the slowdown of wage
growth results in flat unit labour cost growth in
2014-2016. This implies an improvement in cost
competitiveness, since unit labour cost growth is
more dynamic in other countries.
Policy gaps
Preventing recurrence of past problems hinges
on a reform of the wage-setting framework. As
mentioned above, two main factors drove fast
wage growth in the past: relatively high inflation
and lower-than-assumed real wage increases in the
neighbouring countries. Yet cost-of-living
adjustments through wage indexation and real
wage growth under the margin set by the wage
norm have not been fundamentally reformed.
Although the government intends to revise the
Law of 1996, little progress has been made so
far. Plans include setting future wage norms by
taking account of both projections for the next two
years and developments in the previous two years.
In addition, individual companies’ compliance
would be monitored more closely, and automatic
correction mechanisms — for which the Law
provides, but which have never been applied —
would be introduced to deal with overshoots
caused by failure to comply with the wage norm or
Graph 2.2.1: Expected trend in the actual rate of employers’ social security contributions as a percentage of gross wages
(2015-2019)
additional reductions apply to (continuous) shift work, new hires by SMEs or the construction sector (only as of 2020)
Source: FEB
10%
15%
20%
25%
30%
2015 2016 2018 2019
me
dia
n w
ag
e

2.2. Labour costs
23
because the latter was set at a too high level, as has
been the case in the past. All these elements would
strengthen the wage-setting process. A number of
additional elements could be considered as well.
Monitoring of labour cost competitiveness could
be expanded to take account of productivity
trends as well. The main purpose of the revised
law should be to prevent wage growth from
outpacing productivity. This is not guaranteed in
the current set-up of the wage-setting process, as
the wage norm focuses on nominal wage trends,
linking them to wage trends in neighbouring
countries. Expanding the monitoring of labour cost
competitiveness to include unit labour costs as
well would ensure that macroeconomic wage
policies factor in all relevant determinants of cost
competitiveness. There would also be less need for
ex post corrections if wage growth were based
entirely on past wage trends in neighbouring
countries.
Built-in safeguards would help to avoid non-
wage labour cost reductions from being
cancelled out in subsequent wage-setting
rounds. The Law of 1996 benchmarks the change
in total labour costs rather than gross wages. As a
consequence, efforts to lower non-wage labour
costs in the form of social security contributions
risk creating an apparent scope for wage increases
under the Law of 1996. To some extent, this is
what may have happened on some occasions in the
past as authorities repeatedly lowered employers’
social security contributions to facilitate
negotiations between social partners. This built-in
upward pressure would need to be kept in mind
when revising the 1996 Law.
The use of all-in agreements at sectoral level
could be promoted to mitigate the adverse
effects of spiking inflation. Such agreements cap
nominal wage growth, whereas the wage norm
currently caps real wage growth. All-in agreements
were actively used in some sectors in 2007-2008.
They neutralise the effect of unexpected rises in
inflation.
Inflation
Over the past decade, inflation has been an
average of 0.2 percentage points higher than in
the euro area and 0.4 percentage points than
the neighbouring countries. Energy prices were
the main culprit until 2011, but increased
competition and dynamism on the domestic energy
market — and international price developments —
have brought prices more into line. After
narrowing in recent years, the gap started to widen
again in 2H-2015 (Graph 2.2.2). This re-emerging
divergence in inflation raises concerns. While
inflation averaged between 0.1 % and 0.2 % in the
neighbouring countries in 2015 (0.0 % in the euro
area), prices rose by 0.6 % in Belgium. This gap is
projected to widen further in 2016.
Graph 2.2.2: Inflation: HICP (% change year-on-year)
Source: European Commission
The structural difference in underlying
inflation undermines the sustainability of
widespread wage indexation. If automatic cost-
of-living adjustments are to be maintained in some
form, the drivers behind this difference need to be
forcefully addressed. If not, past problems risk re-
emerging, and the corrective measures taken in
recent years (real wage freezes and suspension of
indexation agreements) might be necessary again
in the future.
Authorities have sought to lower inflationary
pressures in recent years. As discussed in
previous country reports, these efforts included
competition-enhancing measures in the energy and
telecommunications sectors and a reduction in
VAT on electricity. In a similar vein, a number of
parametric changes were applied to the health
index calculation formula to reflect actual
-1.5
-1.0
-0.5
0.0
0.5
1.0
1.5
2.0
2.5
3.0
-3.0
-2.0
-1.0
0.0
1.0
2.0
3.0
4.0
5.0
6.0
Jan-06 Jan-08 Jan-10 Jan-12 Jan-14 Jan-16
Δ core inflation (BE vs. DE/FR/NL; right-hand scale)
BE
DE/FR/NL (weighted average)

2.2. Labour costs
24
consumption patterns and product prices more
accurately. These attempts to bring down the
inflation differential with neighbouring countries
were successful to some extent. The Belgian
inflation rate converged towards the levels
observed in the main trading partners between
2012 and 2014 (Graph 2.2.2).
Since the beginning of 2015, however, the
inflation differential with neighbouring
countries and the euro area has started to
increase again. Part of this increase is linked to
government measures in the area of energy prices,
such as the reversal of the reduction in VAT on
electricity or the increase in excise duties, but
these cannot account for the entire difference.
Graph 2.2.3: Inflation: services (% change year-on-year)
Source: European Commission
Core inflation, which excludes energy and
unprocessed food items, also differs
substantially and persistently from that in the
neighbouring countries (Graph 2.2.2). The main
reason for this is higher growth in prices for
services. The sticky service inflation illustrated in
Graph 2.2.3 can be related to two specific factors
with second round effects, reflected in higher core
inflation. First, automatic wage indexation feeds
through into service prices, as wages represent a
high share of factor costs for services. Second, the
practice of formal and informal price indexation is
widespread in the service sector. According to the
National Bank’s 2012 study on indexation, for
about 25 % of all services, prices are directly
indexed by means of inflation, generally the health
index.
Direct price indexation exists for rental prices,
insurance fees, and rail transport, for example.
Furthermore, many other companies apply a rule
of thumb when setting prices, including adjusting
prices in line with recent consumer price increases.
This is more common in sectors less exposed to
competition, i.e. services. The second-round
effects these practices produce come to the fore in
the relation between the health index and service
prices. The correlation in 2006-2014 between the
health index in the current month ‘m’ and inflation
for services in month ‘m+7’ amounted to 0.8. The
link weakens when the health index slows down,
highlighting the downward rigidity of service
prices.
The sub-optimal functioning of certain product
markets, particularly in the retail trade, also
contributes to the inflation differential. Price
levels for both food and non-food products have
been found to be substantially higher in Belgium
than in neighbouring countries (15
). Moreover, this
gap has widened over the years, with prices rising
faster in Belgium. The Federal Planning Bureau
has identified the size of the Belgian market,
purchasing conditions, labour costs and VAT rates
as factors that could explain the absolute price
difference (16
). In addition, Belgian distributors’
business strategies may stand in the way of price
decreases, while consumers’ higher quality
standards could justify price differences (17
). Yet at
the same time, high population density and labour
productivity are seen as having a mitigating impact
on prices, as does the relatively higher presence of
soft and hard discounters in Belgium. Taken in
conjunction, these factors might indeed justify a
somewhat higher price level in Belgium by
comparison with neighbouring markets. However,
they do not account for the higher price growth
observed, especially in recent years, with standard
(15) In 2012 prices for food and non-food items were 11.7 %,
8.6 % & 6.5 % higher than in the Netherlands, Germany and France. Source: Price Observatory (2014), INR/ICN
Annual Report 2013. Data for shops > 400 m², excluding
hard discounters. (16) van der Linden, J. (2012), Consumptieprijzen in België en
de buurlanden, Working Paper 13-12, FPB.
(17) Price Observatory (2015), INR/ICN, Annual Report 2014.
0.0
0.5
1.0
1.5
2.0
2.5
3.0
3.5
4.0
Jan-06 Jan-08 Jan-10 Jan-12 Jan-14 Jan-16
BE DE/FR/NL (weighted average)

2.2. Labour costs
25
VAT rates in neighbouring countries having
converged towards the Belgian level and
favourable labour cost developments.
Graph 2.2.4: Mark-ups in the retail sector
Source: European Commission (Thum-Thysen & Canton,
2015)
High price-cost margins might also help explain
price and inflation differences in the Belgian
retail sector. Calculations by the Price
Observatory (2015) for Belgium and the
neighbouring countries found that, depending on
the approach, the Belgian retail sector had the
highest or second highest average operating
margin in 2008-2012. The Belgian retail trade
sector appears to have one of the highest price-cost
margins in the EU (Graph 2.2.4). Such mark-ups
are important indicators of frictions in goods
markets and for capturing the degree of
competition in product markets (18
). In general,
registration and licensing regulations seem to
affect mark-ups in the retail sector the most (19
).
Regulation and competition in the retail sector are
discussed in Section 2.3.
(18) Griffith, R. & Harrison, R. (2004): The link between
product market reform and macro-economic performance,
European Commission, Economic Papers 209. (19) Thum-Thysen, A. & Canton, E. (2015), Estimation of
service sector mark-ups determined by structural reform
indicators, European Commission, Economic Papers 547.
0.00
0.05
0.10
0.15
0.20
LU
BE IT ES FI
DE
FR
AT
EL
PL
SK
HU
PT
RO
UK
CY
CZ
DK
EE IE LT
MT
NL SI
BG LV
SE
2013 2000

26
R&D and innovation
Investments in intangible assets such as R&D
go to make up what is known as knowledge-
based capital (20
). Unlike physical capital
investments, intangible investments benefit from
positive knowledge spill-overs and economies of
scale. Investments in knowledge-based capital
drive innovation and facilitate production of
sophisticated products and services which are hard
to copy and which guarantee participation in
global value chains. Moreover, investments in
knowledge-based capital play an important role in
spreading ideas from global frontier firms to
domestic firms by encouraging take-up of new
technologies.
There is a consensus in Belgium about the
critical importance of fostering the innovation-
based competitiveness of Belgian businesses.
This has been reflected by all political entities in
the development of sophisticated and
comprehensive policy mixes at national and
regional levels and in significant budgetary
efforts. At federal level, tax incentives for R&D
are a major tool, which accounted in 2013 for two
thirds of total public support to business R&D.
However, public support policies remain
fragmented, and lack of coordination between
public authorities prevents trans-regional synergies
from being fully exploited (21
).
Belgium appears to be broadly on track to meet
the Europe 2020 R&D intensity target of 3 %.
R&D expenditure as a percentage of GDP has been
increasing continuously since 2005. It came to
(20) Three main categories of intangible assets are usually
measured by: Computerised information (which includes software and databases), innovative property (covering
R&D, design, mineral exploration, financial innovation and
artistic originals) and economic competencies (including advertising, marketing research, own-account
organisational capital and training). Corrado, C., Haskel J.
and Jona-Lasino, C. (2014), Knowledge Spill-overs, ICT and Productivity Growth, IZA Discussion Paper n° 8274.
(21) The main responsibility in Belgium for R&I policy and
funding is with the regions and communities. The regions are the main source of innovation and business R&D
support, while the communities are the main sources of
scientific research support. The federal level does not function as an umbrella body above regional and
community levels, but is an additional layer alongside the
regions and communities. Taken together, there are five active levels of public governance for R&I policy (the
Flemish government responsible for both community and
regional policy).
2.5 % of GDP in 2014, which is above the EU
average. Most R&D spending stems from the
business sector (1.8 % of GDP in 2014) and is
concentrated in a limited number of industries,
particularly high-tech ones (mainly
pharmaceuticals and electronics). This suggests
that Belgian industries that are already R&D-
intensive have more incentive to accumulate
knowledge-based capital than other industries (22
).
However, indicators for innovation output give
a mixed picture. While Belgium’s public research
system is performing well (4th position in the EU
for the percentage of highly cited publications and
6th for the number of international scientific co-
publications in relation to the size of the
population), it appears not to translate sufficiently
into innovation output and economic performance
(Graph 2.3.1). Belgium's shortcomings, both in
terms of its performance within the EU and in
terms of innovative development, lie in its limited
capacity to generate intellectual property rights and
in the indicators capturing the ‘economic effects’
of innovation activity. Of these, only ‘employment
in knowledge-intensive activities’ is above the EU
average (23
).
A critical issue is the lack of fast-growing firms
in innovative sectors. High-growth firms make a
significant contribution to job creation. With a
share of employment in high-growth enterprises of
only 5.9 %, Belgium is well under the EU average
of 9.1 % (Belgium ranks 23rd in the EU for this
indicator). In addition, many fast-growing Belgian
firms do not operate in innovative sectors, but in
sectors such as construction and transport. On the
sub-indicator of the innovation output indicator (24
)
(22) Biatour, B. & Kegels, C. (2015), Labour productivity
growth in Belgium Long-term trend decline and possible actions, Federal Planning Bureau Working Paper 06-15;
Dumont, M. (2015), Evaluation of federal tax incentives
for private R&D in Belgium: an update, Federal Planning Bureau Working Paper 05-15.
(23) It must be noted that in this dimension, the below EU
average performance in the share of medium to high technology exports and the share of knowledge-intensive
services in services exports can be explained by the large
volume of exports in some logistics, transport and trade-related services, which are linked to its geographical
intermediation role and which are classified as non-
knowledge-intensive. (24) The innovation output indicator measures the extent to
which ideas stemming from innovative sectors are capable
of reaching the market, providing better jobs and making Europe more competitive. The indicator is a composite of
2.3. INNOVATION AND BUSINESS ENVIRONMENT

2.3. Innovation and business environment
27
measuring the extent to which fast-growing
enterprises operate in innovative sectors, Belgium
therefore scores below the EU average (16.9 vs.
18.8).
As human capital is the main engine of
knowledge-based capital, a specific issue to be
watched is the percentage of new science and
engineering graduates, which is particularly
significant in innovative, knowledge-based
economies. In Belgium, the rate of tertiary
education graduates in science, technology,
engineering and mathematics per thousand
population aged 25-34 lies far below the EU
average — and the figures for France and
Germany — even though it has risen slightly since
2008. This result is particularly worrying because,
with the increasing use of intangible assets in the
four sub-indicators and focusing on four policy axes: growth via technology (patents); jobs (knowledge intensive
employment); long-term global competitiveness (trade in
mid/high-tech commodities); and future business opportunities (jobs in innovative fast-growing firms).
economy and with demographic ageing, new
graduates will play a critical role in maintaining
the available stock of highly skilled workers.
At community and regional levels, various
measures have been taken to tackle the low
share of new science and engineering graduates.
In Flanders joint efforts involving the policy
domains of science and innovation on the one
hand, and education and training on the other, have
been launched to increase the number of students
in science, technology, engineering and
mathematics (STEM subjects) and encourage them
to opt for a career in exact sciences or technology
(the STEM 2012-2020 Action Plan, see Section
3.1). The latest progress update shows some
positive trends, notably with regard to the inflow
and throughput rates in scientific and/or
technology-oriented higher education. Progress is
slow however among secondary school pupils and
women (25
). Wallonia’s Beware Fellowships
(25) STEM Monitor 2015.
Graph 2.3.1: Innovation performance in Belgium relative to the EU (EU = 100)
Source: European Commission (Innovation Union Scoreboard 2015)
89
116
103
380
122
86
96
144
122
88
130
222
188
96
88
89
91
138
101
87
111
87
87
91
97
50 100 150 200 250 300 350 400
New doctorate graduates
Population completed tertiary education
Youth with upper secondary level education
International scientific co-publications
Scientific publications among top 10% most cited
Non-EU doctorate students
Public R&D expenditure
Venture capital
Business R&D expenditure
Non-R&D innovation expenditure
SMEs innovating in-house
Innovative SMEs collaborating with others
Public-private co-publications
PCT patent applications
PCT patent applications in societal challenges
Community trademarks
Community designs
SMEs introducing product or process innovations
SMEs introducing marketing/organisational innovations
Fast-growing firms in innovative industries
Employment in knowledge-intensive activities
Contribution of MHT product exports to trade balance
Knowledge-intensive services exports
Sales of new to market and new to firm innovations
Licence and patent revenues from abroad
Hu
man
reso
urc
es
Op
en
,e
xce
llen
t an
da
ttra
ctive
rese
arc
hsyste
ms
Fin
ance
an
dsu
pp
ort
Firm
inve
stm
en
ts
Lin
ka
ge
s &
en
tre
pre
ne
urs
hip
Inte
llectu
al A
sse
tsIn
nova
tors
Eco
nom
ic e
ffe
cts

2.3. Innovation and business environment
28
support researcher mobility and promote
awareness of science and technology among young
people. The Marshall Plan 4.0 aims to align the
supply of graduates in Wallonia better to business
needs. One way it does this is to set up an
inventory of ‘professions of the future’. Policy
attention has also increasingly turned towards
attracting foreign researchers, in Flanders
(Odysseus, Pegasus 2), Wallonia (Ulysse) and the
Brussels Capital Region (Attract).
Business environment and entrepreneurship
Although Belgium provides a generally
welcoming environment for SMEs and it is
relatively easy to start a company (26
) the
country has a comparatively low start-up rate
and performs poorly in terms of
entrepreneurship and company dynamics. This
hampers the necessary renewal of its economic
fabric and the transition towards a more
knowledge-intensive and innovation-driven
economy given the key role of entrants in the
formation of new ideas. This can be related to a
higher ‘fear to fail’ rate in Belgium (49.4 %) than
in the EU as a whole (40.7 %) and is not restricted
to certain segments characterised by higher entry
conditions, but applicable to the entire Belgian
economy. Moreover, some tax aspects deter
company dynamics.
Late payments by other companies and by
public bodies hinder the ability to expand
activities. The average payment term allowed by
Belgian companies to other companies is 31 days,
while it takes an average of 44 days for actual
payment to take place. Delays are still worse when
dealing with the public sector.
New initiatives and measures have been
introduced to improve the low level of
entrepreneurship readiness, addressing key areas
(26) The World Bank’s Doing Business 2016 report ranks
Belgium 7th among the EU for the ease of starting up a company in 2015. It takes 5 days to register and formally
operate a private company compared with 10 on average in
the EU and fewer procedures are also involved. Although online procedures have been simplified through electronic
applications such as 'e-Depot' there is still some potential
for simplification. In addition, paid-in minimum capital requirement for a small- to medium-sized limited liability
company are relatively demanding compared to the EU in
general.
such as education, mentoring, coaching, business
plans, support to female and immigrant
entrepreneurs and business transfers. In 2015 the
federal government announced a ‘Start-up plan’
designed to help young innovative companies. It
aims to make access to finance easier for starters
via a tax shelter for start-ups, fiscal incentives for
crowdfunding and lower labour and digital
investment costs for starting companies. Such tax
relief is an upfront incentive and could be a good
way of attracting new investors, as the benefit is
granted at the time of the investment decision,
irrespective of investment performance. While the
package is comprehensive and well targeted, the
measures will need monitoring, particularly as the
tax advantages should not amount to mere windfall
gains or open loopholes. However, the package
represents additional tax expenditure in a country
where this is already an issue (see Section 3.2). In
Flanders, thanks to the updated Action Plan
‘Entrepreneurial education for 2015-2019’,
Flemish students with entrepreneurial ambitions
will be able to obtain, from 2016, a ‘certificate of
management knowledge’ while studying at a
university or college. This is a formal requirement
to start a business for people without a bachelor's
degree, or who have not yet finished their
undergraduate studies. The Entrepreneurship 3.15
plan of the Walloon region, published in December
2013, aims to develop entrepreneurial skills at an
early stage by creating links with schools or higher
education institutions, supporting teachers and
encouraging the development of entrepreneurial
schools.
To incentivise SMEs and independents to hire,
the government has abolished employer
contributions for the first (newly-hired)
employee for an indefinite period. The existing
reduction for the first five employees will apply for
the 2nd to 6th new hire. The deduction for
investments by SMEs, reintroduced in 2014 and
2015, becomes permanent as of 2016, and the rate
goes up from 4 % to 8 % for new investments.
These measures are expected to provide impetus to
small companies: the National Bank estimates that
this package will create 3 000 jobs over the next
five years.
A single market for services
High regulatory barriers impede efficiency in
several service sectors in Belgium. Overall

2.3. Innovation and business environment
29
regulation of professional services is among the
most restrictive in the EU. Problems stem from
restrictive authorisation requirements —
companies are sometimes unable to provide a
range of services due to multidisciplinary
restrictions — insurance obligations and
requirements as regards the legal form and
shareholding. Occupations subject to such access
and conduct barriers are architecture, accountancy
and the real estate agents. Progress in lifting the
most restrictive barriers, which is the prerogative
of the regions, has been limited.
Graph 2.3.2: Churn rates in business services — BE and EU
averages (2008-2012)
Source: European Commission
As a result, Belgium experiences subdued
market dynamics and low competition in
business services. Market entry rates and churn
rates stand significantly below EU averages
(Graph 2.3.2). Productivity in business services
has deteriorated in recent years, endangering the
competitiveness of these services (Graph 2.3.3).
Finally, there are barriers to efficient allocation of
resources in important business service sectors.
This is confirmed by a significant negative level of
allocative efficiency in these sectors (Graph
2.3.4) (27
). Removing such barriers would enable
(27) A positive (negative) number for allocative efficiency
means that resources (employment) are allocated in a more (less) efficient way across the different categories of firm
size relative to the baseline. Negative numbers show that
there are forces in the economy that prevent competition
productive companies to grow and capture higher
market shares, and also create new opportunities
for service providers to enter the market.
Graph 2.3.3: Labour productivity developments in business
services — BE and EU (2005-2014)
Source: European Commission
Graph 2.3.4: Allocative efficiency index for business
services
Source: European Commission
Improved efficiency and competition are key,
given that business services are becoming
from working properly, such as excessive regulation, rent-
seeking, ineffective procurement and clientelism.
0
5
10
15
20
252008
2009
20102011
2012
EU BE
93
94
95
96
97
98
99
100
101
102
2005 2006 2007 2008 2009 2010 2011 2012 2013 2014
EU BE
-0.25
-0.20
-0.15
-0.10
-0.05
0.00
0.05
UK
LU
FR
DK
NL
SE
DE SI
FI
HR
RO
ES
BE
AT
EL
CZ
PT
CY IT SK
HU
EU

2.3. Innovation and business environment
30
increasingly important as an input into Belgian
industry. Almost 18 % of the value created by
Belgian manufacturing comes from business
service inputs (Graph 2.3.5). This is one of the
highest shares among Member States. Improving
the performance of business services will therefore
have positive effects on other sectors as well. In
the context of a mutual evaluation exercise,
Belgian authorities have made an assessment of
the restrictions on access to and exercise of
regulated professions. The report concludes that no
reform is at present needed but several analyses are
underway to further assess the need to revise the
regulation in place.
Graph 2.3.5: Share of business services in the
manufacturing value chain
Source: WIOD; wiiw calculations; ECSIP, Study on the
relation between industry and services in terms of
productivity and value creation, 2014.
There is also scope to improve competition in
the retail sector. Regulation of retail distribution
in Belgium is considered ‘less competition-
friendly’ by the OECD’s Product Market
Regulation. The recent regionalisation of
competences does not seem to have brought a
simplification so far. Points on which Belgium
records more regulation and operational
restrictions than peer countries are: regulation of
large outlets, protection of existing firms, shop
opening hours, and promotions and discounts. This
suggests how fostering competition in the retail
sector might induce positive price and productivity
effects. In addition, the forthcoming Market
Monitoring Survey finds that Belgian consumers
are significantly less satisfied than the EU average
with the number of retailers or products they can
choose from. This is specifically the case for fast-
moving retail markets, which provides further
signs of a lack of competition in the sector (28
).
Access to finance
In general, Belgium performs well on access to
finance for SMEs. One reason for this is that
there are public support schemes to increase
credit availability through loan guarantees.
Rejections of loan applications and unacceptable
offers are among the lowest in the EU. Obtaining
finance is less of a problem for Belgian SMEs than
for their EU peers, thanks to cost premiums for
small loans over large ones that are much lower
than average and the lowest interest rates for many
years. In fact, finding skilled or experienced staff
is generally considered a more pressing problem
than access to finance (29
). The federal government
has been promoting initiatives to improve the
transparency and predictability of the credit
process for SMEs through a binding code of
conduct. SMEs with financial disputes can call on
the Ombudsman to mediate with their bank and
come to a solution.
However, micro-enterprises and start-ups
continue to have difficulty in accessing bank
credit to start their activities. The main reasons
for this are the lack of collateral and own funds,
and their limited capacity for repaying loans (30
).
While access to start-up phase funding seems
adequate compared to other European
countries, the financing of later growth phases
is less successful. Overall, risk capital, including
start-up capital, is still weakly developed in
comparison with international leaders and relative
to the available investment opportunities. This is
especially striking in view of the vast financial
assets of the Belgian private sector, which are
predominantly channelled through the banking
sector to a small set of mostly risk-averse saving
tools. Mobilising some of these savings could help
(28) Market Monitoring Survey 2015, to be published in
Consumer Markets Scoreboard 2016 (forthcoming). (29) ECB, Survey on the access to finance of enterprises in the
euro area (SAFE), different editions.
(30) SPF Economie (2014), P.M.E., Classes moyennes et Energie - Etude sur le financement des PME.
0
2
4
6
8
10
12
14
16
18
20
1995 2011
EU BE

2.3. Innovation and business environment
31
develop a deeper market for the financing of
higher risk projects. It could, for instance, enable
more use to be made within Belgium of basic
research at Belgian research centres and
universities.
Policy measures have been taken at both federal
and regional level to give SMEs easier access to
credit and foster private investment. These
include microcredit, spin-off funding, access to
equity, venture capital and business angels, and
specific investments in creative industries. Efforts
have also been made to fill the gaps in the legal
framework for crowdfunding. Simplified legal
requirements on prospectuses and an increase in
the accepted amount for private investors seek to
foster this form of finance and make it more
appealing to casual investors. In Flanders,
measures have been taken to support the business
angels network, and Wallonia has introduced a
new equity platform.
Responsive administration
Once companies are operating, a number of
factors seem to discourage growth in Belgium.
According to the World Bank's Doing Business
indicators, the time and cost involved in
transferring and registering property remains the
biggest challenge in this area. The costs of
transferring property are almost three times the EU
average. Moreover, the transfer process is over a
month longer. Big projects, in particular, often
incur long administrative delays, given long
procedural lead times for examination and
evaluation.
Companies still consider the complexity of
recurrent administrative procedures as a
substantial problem for doing business in
Belgium. The World Economic Forum’s Global
Competitiveness Index 2015 ranks Belgium 119th
out of 140 countries for burden of government
regulation. Compliance with permits, regulations
and reporting is considered very burdensome.
Eight EU countries perform worse; Belgium ranks
behind France, while the Netherlands and
Germany score much better. The Commission’s
Industrial Performance Scoreboard came to a
comparable conclusion. An excessive
administrative burden is a significant impediment
for smaller businesses, which often have to
outsource to specialised service providers as they
do not have the resources or expertise to comply
with regulation.
Several measures have been presented at the
different levels to simplify administrative
procedures and reduce the reporting burden on
businesses, particularly small ones. A regulatory
impact assessment, including an ‘SME test’, has
been made mandatory for all federal draft
regulation. Planned simplifications relate to the
introduction of digital procedures and e-services,
such as e-invoicing, e-salary slips, digital meal
vouchers and electronic certificates for public
procurement. According to the Digital Scoreboard
(2015), digital public services are the only
dimension assessed in which Belgium does not
perform notably better than the EU average. To
lighten the heavy administrative burden, the
regions could also introduce and systematically
apply regulatory impact assessments and the ‘SME
test’.
A recent study evaluated the ‘quality’ of
Belgian legislation by criteria such as
consistency, stability, clarity, effectiveness and
the amount of paperwork that laws involve (31
).
It concludes that, tangible progress has been made
over the past decade, although it has been limited
over the last five years. A survey conducted at the
same time among Belgian companies by the
federal employers’ organisation, FEB, reported no
net improvement in the administrative burden.
Progress with regard to e-procedures was
outweighed by the increased complexity of labour
legislation, social security and tax administration,
and by a general lack of consistency across
legislation.
Effective justice
There is substantial scope for improving the
effectiveness of the justice system. In terms of
efficiency, the rate of resolution of litigious civil
and commercial cases is unsatisfactory. For
administrative cases it is among the lowest of all
Member States that provided data to the 2016 EU
Justice Scoreboard. As courts resolve fewer cases
(31) Idea Consult (2015), De kwaliteit van de regelgeving in
België: knelpunt of hefboom voor competitiviteit?, study ordered by Fédération des entreprises de Belgique.
Belgium is compared with Germany, France, the UK, the
Netherlands, Denmark, Switzerland and Canada.

2.3. Innovation and business environment
32
than they receive, this could lead to growing case
backlogs. The time needed to resolve
administrative cases at first instance is 625 days,
which puts Belgium fifth from the bottom out of
all reporting Member States. Since this is the first
time that Belgium has reported efficiency data on
the operation of its justice system, they cannot be
analysed on the basis of a comparison with
previous data.
The potential offered by ICT is not being
exploited in the judiciary (32
). The limited
possibilities for online submission of claims, and
the narrow scope of monitoring and evaluation of
court activities, and of training of judges, are the
main shortcomings in the justice system (33
). This
is all the more problematic given that Belgium has
more incoming civil and commercial litigious
cases per 100 inhabitants than any other EU
country.
In March 2015 the government presented a
comprehensive reform of the justice system to
parliament. Its various components, which are
scheduled for adoption by 2019, include initiatives
to improve the use of ICT. As a first step, a reform
of the civil procedural law entered into force in
October 2015 which enables courts, lawyers,
bailiffs and notaries to communicate electronically
with each other in a legally valid manner.
(32) Council of Europe, Challenges for judicial independence
and impartiality in the member states of the Council of Europe, January 2016.
(33) 2016 EU Justice Scoreboard (forthcoming).

33
Recent trends and macroeconomic risks
The Belgian economy has high levels of both
private and public debt. Public debt, which rose
between 2008 and 2014, is estimated to have fallen
in 2015 to around 106 % of GDP (compared to an
average of 93 % in the euro area), thanks to the
reimbursement of a loan by the financial institution
KBC (0.8 % of GDP). However, it is expected to
rise again in 2016, contrary to the trend in the euro
area. Strategies to put the public debt on a
downward path have failed so far. Firstly,
budgetary targets have often been missed, with
only a limited improvement in the headline
balance in recent years. The reasons for this are
adverse economic circumstances and a lack of
structural improvement, despite a strong decline in
interest expenditure as explained below. Secondly,
both low inflation and subdued economic growth
have made it more difficult to reduce the debt-to-
GDP ratio (denominator effect). Thirdly, the
statistical reclassification of some investment
vehicles within the general government sector has
increased public debt levels, especially at regional
level.
Graph 2.4.1: Breakdown of debt by sector (non-
consolidated)
Source: European Commission
Private debt is also relatively high, with
(consolidated) debt at 157 % of GDP in 2014
compared to 138 % of GDP in the euro area.
This stems mainly from the high indebtedness of
non-financial corporations, which exceeds the euro
area average, both in non-consolidated (Graph
2.4.1) and in consolidated terms (Graph 2.4.2)
(respectively 148 % of GDP and 100 % of GDP in
Belgium, compared to 96 % of GDP and 79 % in
the euro area). After strong positive credit flows
between 2011 and 2013, net credit flows to non-
financial corporations turned negative in 2014 (see
Graph 2.4.3), contributing to a drop in the debt-to-
GDP ratio of non-financial corporations.
Graph 2.4.2: Breakdown of debt by sector (consolidated)
Source: European Commission
Previous country reports have showed that this
high level is explained by substantial intra-
group lending, which is encouraged by the
allowance for corporate equity ('notional
interest deduction') in the corporate income
taxation. This intra-group lending is not fully
neutralised in the consolidated figures as some of it
consists of cross-border operations. Moreover,
since the changeover to the ESA2010 methodology
for national accounting, some financial
subsidiaries are no longer classified as non-
financial corporations but as financial
corporations, so their lending to non-financial
subsidiaries of the same group is also included in
the consolidated debt figure. Such intra-group
loans do not bear macroeconomic risks for the
Belgian economy, but are purely accounting
operations inside big corporations.
0
50
100
150
200
250
300
350
400
01 02 03 04 05 06 07 08 09 10 11 12 13 14 15*
% o
f G
DP
Financial corporations Government
Household Non-financial corporations
Private sector Private sector EA
0
50
100
150
200
250
300
350
01 02 03 04 05 06 07 08 09 10 11 12 13 14
% o
f G
DP
Financial corporationsGovernmentHouseholdNon-financial corporations
2.4. INDEBTEDNESS

2.4. Indebtedness
34
Graph 2.4.3: Credit flows
Source: European Commission
The increase in debt of non-financial corpora-
tions went hand-in-hand with an accumulation
of financial assets. The debt-to-equity and debt-
to-financial assets ratios therefore show a broadly
flat trend over the last decade (Graph 2.4.4), in
contrast to the trend in the debt-to-GDP ratio.
Graph 2.4.4: Leverage of non-financial corporations
Source: European Commission
Household debt continued to increase,
supported by positive credit flows, from around
40 % of GDP before the crisis to 58 % now.
While it remains below the euro area average of
60 % of GDP, the difference has been narrowing
since 2010, when deleveraging in the euro area
started. The increase in Belgium is entirely due to
an increase in mortgage loans.
Graph 2.4.5: Interest burden
Source: European Commission
Both households and corporations have
benefited from the low market rates to reduce
their interest burden in recent years, despite the
rise in debt levels (Graph 2.4.5). Over 60 % of
outstanding mortgage-related household debt,
which constitutes the bulk of household debt, is
contracted at a fixed rate. This means that a sudden
rise in market rates would only gradually affect the
interest burden of households, so risks are
contained.
Macroeconomic risks related to the high debt
levels are also tempered by the overall net
financial asset position of the economy (50 % of
GDP compared to a net debt position of 10 % of
GDP on average in the euro area) (Graph 2.4.6).
The net financial debt of the non-financial
corporations and government is more than offset
by the high net financial wealth of Belgian
households, which has increased steadily since
2012.
-10
-5
0
5
10
15
20
25
30
01 02 03 04 05 06 07 08 09 10 11 12 13 14
% o
f G
DP
Financial corporations Household
Non-financial corporations Government
Private sector EA18 MIP threshold
Private sector
0
20
40
60
80
100
120
140
160
01 03 05 07 09 11 13 15*
Ratios o
f debt to
equity, G
DP
and t
ota
l financia
l assets
(%
)
Debt / GDPDebt / equityDebt / financial assetsDebt / financial assets, consolidated
0
1
2
3
4
5
6
7
8
9
10
01 02 03 04 05 06 07 08 09 10 11 12 13 14 15*
% o
f valu
e a
dded a
nd G
DI
Interest payments / gross disposable income, Households
Interest payments / gross disposable income, Households, EA18
Interest payments / value added, Non-financial Corporations
Interest payments / value added, Non-financial Corporations, EA18

2.4. Indebtedness
35
Graph 2.4.6: Net asset breakdown
Source: European Commission
Interlinkages between the public and financial
sector
Interlinkages between the public and the
financial sector exist in both directions. The
Belgian government sector still carries sizeable
contingent liabilities due to guarantees granted to
the financial sector, although they have been
substantially reduced since 2012. The only
outstanding guarantee is now the scheme for
Dexia, which is partly owned by the Belgian state.
The amount of guaranteed liabilities peaked in
February 2015 at EUR 42 billion (10.3% of GDP)
and has gradually fallen since then, to EUR 32
billion (7.5% of GDP) at the beginning of
February 2016.
Belfius, one of the four large banks on the
Belgian market, is owned by the federal state
while the insurance company Ethias is owned
by federal and regional authorities. New capital
needs of these corporations might adversely affect
government gross debt levels. As part of its
financial recovery plan (34
), the insurer Ethias
increased its subordinated debt by converting EUR
(34) In the context of the EU-wide Stress Tests conducted in
2014 by the European Insurance and Occupational Pensions Authority, the National Bank of Belgium (NBB)
had found that Ethias will have a particularly low solvency
ratio under the Solvency 2 prudential requirements that enter into force in 2016. In that context, the NBB had
requested from Ethias to draft a financial recovery plan.
250 million of perpetual bonds in June 2015 and
raising an additional EUR 150 million of
subordinated bonds in October 2015. At the end of
2015, KBC reimbursed the last instalment of state
aid it received in 2009 (EUR 2 billion of capital
and EUR 1 billion of compensation).
Conversely, Belgian banks and insurance
companies are sensitive to a possible widening
of spreads on Belgian government debt. The
concentration of Belgian banks and insurers' assets
on domestic bonds increased strongly between
2010 and 2012, when they sharply reduced their
exposure to public sector bonds from peripheral
euro area countries. Even though the concentration
decreased somewhat afterwards, it remains
relatively high. At the end of 2014, Belgian banks
held around EUR 120 billion of Belgian public
debt instruments, representing 52 % of their total
public debt holdings and 12 % of total bank assets.
Moreover, the assets of Belgian insurance
companies show a home bias, with Belgian
government bonds amounting to EUR 57 billion or
55 % of total public sector bonds considered as
covering assets.
As provided for by the Capital Requirements
Directive IV and the Belgian Banking Law, the
National Bank of Belgium has decided to apply
capital surcharges to the eight Belgian banks
designated as other systemically important
institutions (35
). According to the Belgian banking
association, this new capital surcharges should not
necessitate any new capital raise for its members in
the short term. Apart from Dexia and Axa Bank
Europe, Belgium's eight systemically important
institutions were profitable in 2014. Their capital
adequacy ratios are relatively comfortable, ranging
from 14.7 % to 24.8 %, while their Fitch ratings
range from BBB+ (Belfius) to AA+ (Euroclear).
Asset quality is improving as their non-performing
loans ratios are low and decreasing, ranging from
2.30 % (Belfius) to 9.54 % (KBC Group).
The high legal interest rates on supplementary
pensions (so-called 'second pillar' pensions)
could negatively impact life insurers' solvency.
In October 2015, social partners agreed to lower
(35) 0.5 % for BNP Paribas Fortis, KBC Group, ING Belgium,
and Belfius Bank; 0.75 % for Axa Bank Europe, Argenta, Euroclear and The Bank of New York Mellon (BNYM).
-250
-200
-150
-100
-50
0
50
100
150
200
250
300
01 02 03 04 05 06 07 08 09 10 11 12 13 14 15*
% o
f G
DP
GovernmentFinancial corporationsHouseholdsNon-financial corporationsPrivate sector EA18Private sector

2.4. Indebtedness
36
the interest rate to be guaranteed by employers
from 3.25% (and even 3.75% for contributions by
employees) to minimum 1.75 %. In January 2016,
the government from its side lowered the
maximum interest rate for long term life insurance
contracts to 2%, which is above the rate of 1.5%
recommended by the National Bank of Belgium.
However, if the current very low interest rate
environment is to endure, employers and insurers
might still face challenges to realize the guaranteed
return over the lifespan of the contract.
Focus on the public debt
As mentioned above, Belgium's gross public
debt level substantially exceeds the threshold of
60 % of GDP of the macroeconomic imbalance
procedure and Stability and Growth Pact.
Subdued economic growth and a lack of structural
improvement have led to budgetary targets being
systematically postponed in recent years and to
further increases in public debt. Moreover, the
particularly low inflation environment in recent
years — through its impact on the development of
the denominator in the debt-to-GDP ratio — has
contributed to a negative debt snowball effect.
Lower interest rates, on the other hand, have
translated only gradually into lower implicit
interest rates on the outstanding debt stock (see
below).
Around 83 % of Belgium's public debt is at
central level, and it is almost entirely
denominated in euro. The average maturity of
central government's debt portfolio increased
markedly in recent years, from around 6 years at
the beginning of 2010 to almost 8 years at the end
of 2015, which tempers interest rate risks. The
implicit interest rate declined gradually over the
same period, from around 4 % to 2.8 %. Around
16 % of the central government debt needs to be
refinanced in 2016 and is thus subject to interest
rate risks. Refinancing risks will rise slightly in
2017 as a relatively large number of bonds mature
in that year.
While the macroeconomic risks of the high
public debt are tempered by the healthy state of
the private sector, the high government debt
level remains a vulnerability for the economy,
as it reduces the government's leeway for
stabilizing economic policies. Moreover, the high
debt service could drive out more productive
government expenditure. Lastly, with its high
public debt, Belgium finds itself in a more
challenging starting position to cope with the
expected budgetary impact of an ageing
population. While most of the public debt is at
federal level, this level also bears the bulk of age-
related expenditure such as pensions and
healthcare. Responsibilities for long-term care
have recently been devolved to the communities.
Unexpected events or an adverse interest
snowball due to low growth or an increase in
interest rates could affect public debt
developments. In the short term (within one year),
Belgium does not appear to face any significant
risk of fiscal stress arising from its fiscal or its
macro-financial situation (36
). Nevertheless, some
variables point to possible short-term challenges,
such as the level of gross financing needs and the
relatively high share of public debt held by non-
residents (around 60 % in October 2015).
In the medium term (10 years), sustainability
risks appear to be high because debt is expected
to remain around 100 % of GDP at unchanged
policy and because of the sensitivity to possible
shocks in nominal growth and interest rates
(Graph 2.4.7). Jointly simulated macro-financial
and fiscal shocks point to nearly 40% probability
that the debt ratio in 2020 will exceed the 2015
level, entailing high risks given the high starting
level. High medium-term risks also emerge from
the analysis of the sustainability gap indicator
S1 (37
), due to the current debt level, and, to a
lesser extent, due to the projected age-related
public spending. A cumulated fiscal adjustment of
3.8 pps. of GDP, relative to the baseline scenario
(at unchanged policy), would be required between
2017 and 2022 to reach the reference value of a
60 % debt-to-GDP ratio by 2030.
(36) European Commission (2016), Fiscal Sustainability Report
2015, European Economy Institutional Paper, no. 18.
(37) The S1 indicator measures the required fiscal adjustment
needed between 2017 and 2022 to drive the public debt
ratio down to 60 % of GDP by 2030.
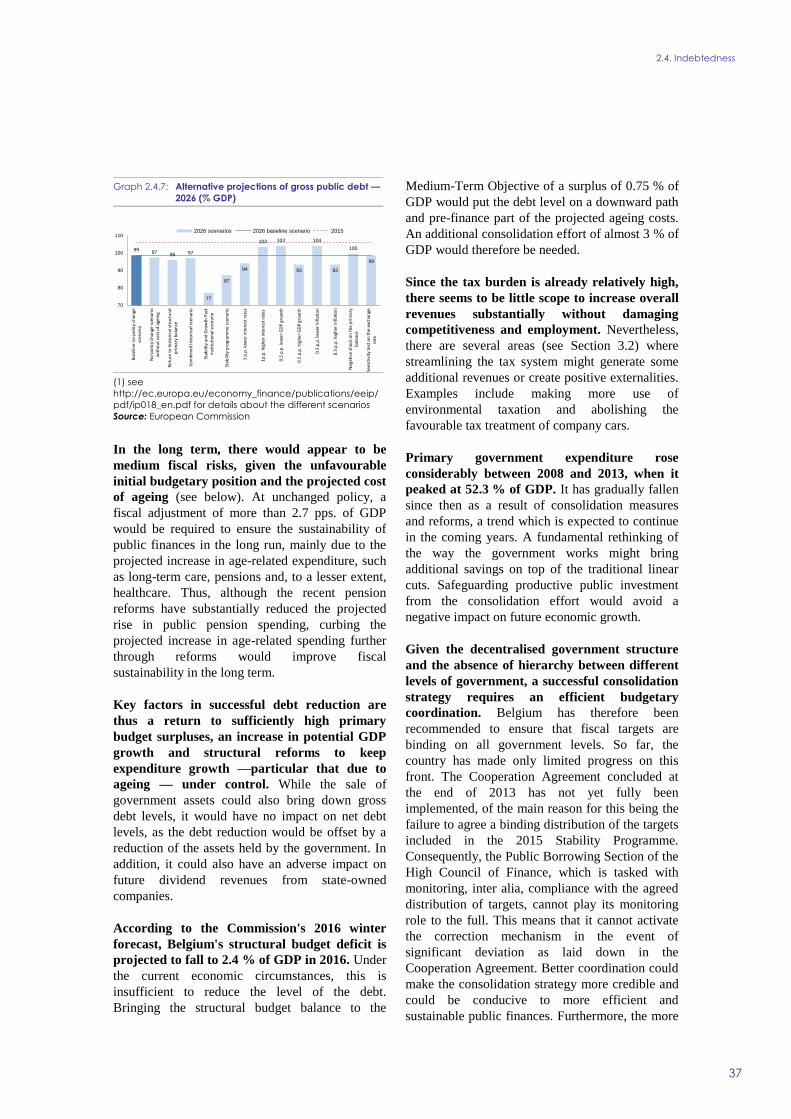
2.4. Indebtedness
37
Graph 2.4.7: Alternative projections of gross public debt —
2026 (% GDP)
(1) see
http://ec.europa.eu/economy_finance/publications/eeip/
pdf/ip018_en.pdf for details about the different scenarios
Source: European Commission
In the long term, there would appear to be
medium fiscal risks, given the unfavourable
initial budgetary position and the projected cost
of ageing (see below). At unchanged policy, a
fiscal adjustment of more than 2.7 pps. of GDP
would be required to ensure the sustainability of
public finances in the long run, mainly due to the
projected increase in age-related expenditure, such
as long-term care, pensions and, to a lesser extent,
healthcare. Thus, although the recent pension
reforms have substantially reduced the projected
rise in public pension spending, curbing the
projected increase in age-related spending further
through reforms would improve fiscal
sustainability in the long term.
Key factors in successful debt reduction are
thus a return to sufficiently high primary
budget surpluses, an increase in potential GDP
growth and structural reforms to keep
expenditure growth —particular that due to
ageing — under control. While the sale of
government assets could also bring down gross
debt levels, it would have no impact on net debt
levels, as the debt reduction would be offset by a
reduction of the assets held by the government. In
addition, it could also have an adverse impact on
future dividend revenues from state-owned
companies.
According to the Commission's 2016 winter
forecast, Belgium's structural budget deficit is
projected to fall to 2.4 % of GDP in 2016. Under
the current economic circumstances, this is
insufficient to reduce the level of the debt.
Bringing the structural budget balance to the
Medium-Term Objective of a surplus of 0.75 % of
GDP would put the debt level on a downward path
and pre-finance part of the projected ageing costs.
An additional consolidation effort of almost 3 % of
GDP would therefore be needed.
Since the tax burden is already relatively high,
there seems to be little scope to increase overall
revenues substantially without damaging
competitiveness and employment. Nevertheless,
there are several areas (see Section 3.2) where
streamlining the tax system might generate some
additional revenues or create positive externalities.
Examples include making more use of
environmental taxation and abolishing the
favourable tax treatment of company cars.
Primary government expenditure rose
considerably between 2008 and 2013, when it
peaked at 52.3 % of GDP. It has gradually fallen
since then as a result of consolidation measures
and reforms, a trend which is expected to continue
in the coming years. A fundamental rethinking of
the way the government works might bring
additional savings on top of the traditional linear
cuts. Safeguarding productive public investment
from the consolidation effort would avoid a
negative impact on future economic growth.
Given the decentralised government structure
and the absence of hierarchy between different
levels of government, a successful consolidation
strategy requires an efficient budgetary
coordination. Belgium has therefore been
recommended to ensure that fiscal targets are
binding on all government levels. So far, the
country has made only limited progress on this
front. The Cooperation Agreement concluded at
the end of 2013 has not yet fully been
implemented, of the main reason for this being the
failure to agree a binding distribution of the targets
included in the 2015 Stability Programme.
Consequently, the Public Borrowing Section of the
High Council of Finance, which is tasked with
monitoring, inter alia, compliance with the agreed
distribution of targets, cannot play its monitoring
role to the full. This means that it cannot activate
the correction mechanism in the event of
significant deviation as laid down in the
Cooperation Agreement. Better coordination could
make the consolidation strategy more credible and
could be conducive to more efficient and
sustainable public finances. Furthermore, the more
9997
96 97
77
87
94
103 104
93
104
93
100
99
70
80
90
100
110
Bas
elin
e n
o-p
olic
y ch
ange
scen
ario
No
-po
licy
chan
ge s
cen
ario
wit
ho
ut
cost
of
agei
ng
Ret
urn
to
his
tori
cal s
tru
ctu
ral
pri
mar
y b
alan
ce
Co
mb
ine
d h
isto
rica
l sce
nar
io
Stab
ility
an
d G
row
th P
act
inst
itu
tio
nal
sce
nar
io
Stab
ility
pro
gram
me
sce
nar
io
1 p
.p. l
ow
er in
tere
st r
ates
1p
.p. h
igh
er
inte
rest
rat
es
0.5
p.p
. lo
we
r G
DP
gro
wth
0.5
p.p
. hig
her
GD
P g
row
th
0.5
p.p
. lo
we
r in
flat
ion
0.5
p.p
. hig
her
infl
atio
n
Neg
ativ
e sh
ock
on
th
e p
rim
ary
bal
ance
Sen
siti
vity
tes
t o
n t
he
exch
ange
rate
2026 scenarios 2026 baseline scenario 2015

2.4. Indebtedness
38
extensive responsibilities conferred on the High
Council of Finance (Public Borrowing Section) by
the Cooperation Agreement also require concrete
arrangements to ensure the High Council's
autonomy vis-à-vis the various governments and
the Ministry of Finance.
In recent years, Belgium has made important
progress in reforming its pension system.
However, pensions still require attention,
especially given the high level of public debt. The
law of August 2015 on the rise in pensionable age,
the conditions for early pensions and the minimum
age for survivors' pensions establishes a new
minimum age and career lengths criteria for
ordinary pensions. The government has also
announced its intention to introduce a credit-based
pension system allowing for automatic adjustment
mechanisms in response to demographic and/or
economic developments.
According to the projections of the Ageing
Working Group, pension expenditure is
projected to rise by 1.3 percentage points (pps.)
of GDP between 2013 and 2060, compared to
3.3 pps before the 2015 reforms. The difference
is mostly due to the pension reform itself (-1.6 pps.
of GDP), while other measures, namely the index
jump and lower public employment (-0.4 pps. of
GDP) will also curb growth in expenditure. This
improvement in ageing projections might also lead
to a lower minimum medium-term objective in the
context of the Stability and Growth Pact.
Moreover, more sustainable public finances could
create budgetary space for public investment.
To sum up, the debts of both non-financial
corporations and the government are relatively
high in Belgium. On the other hand, household
debt is fairly limited, and the economy is overall in
a healthy net asset position, which limits the
macroeconomic risks. Moreover, the relatively
high debt of non-financial corporations is
explained by the presence of financial subsidiaries
of large groups in Belgium. Large financial flows
inside these groups distort the debt figures of
Belgium's non-financial corporations. Belgium's
high public debt is currently not considered as an
imbalance from a macroeconomic point of view,
but remains a budgetary challenge. To safeguard
sustainability, further consolidation efforts are
needed to bring down the deficit and put the debt
on a firm downward path. Given the decentralised
government structure and absence of hierarchy
between different levels of government, a
successful consolidation strategy requires efficient
budgetary coordination.

39
This MIP Assessment Matrix summarises the main findings of the in-depth review in the country report.
It focuses on imbalances and adjustment issues relevant for the macroeconomic imbalance procedure.
Table 2.5.1: MIP Assessment matrix (*) — Belgium
(Continued on the next page)
Gravity of the challenge Evolution and prospects Policy response
Imbalances (unsustainable trends, vulnerabilities and associated risks)
Competitiveness External performance has deteriorated
since 2000, as illustrated by global
market shares losses. Analysis points
to problems of competitiveness and
quality (pp. 13-14).
Unit labour costs (ULC) have risen fast
as a result of low productivity growth
and, in particular, fast wage growth.
Fast wage growth can be attributed to
the wage-setting system. Margins for
real wage growth were repeatedly set
too high. Inflation also repeatedly
exceeded expectations and inflation in
neighbouring countries. This was
transmitted through the general
practice of automatic wage indexation.
Together these factors eroded the
effectiveness of the highly coordinated
wage-setting system (p. 20).
The structural difference in core
inflation with neighbouring countries
undermines the sustainability of wage
indexation. It is mainly caused by
higher price growth for services (p. 24)
and a suboptimal functioning of the
retail market (p. 24; 30).
The downward trend has been
halted in 2013. Accumulated losses
remain substantial, though: 27 %
of market shares were lost between
2000 and 2014 (p. 13).
The absolute ULC gap reached a
peak of 9 % in 2013 and narrowed
to 6 % in 2015 (p. 17).
Since Q2-2014 a trend reversal has
emerged with a marked slowdown
in hourly labour cost growth. In the
first nine months of 2015 they rose
by just 0.1 %, compared with
2.0 % in the neighbouring
countries (p. 16). Labour cost
growth is set to remain muted in
2016 with modest wage growth
offset by reductions of non-wage
labour costs.
Following a fading of price
pressures in 2013-2014, which
helped to contain wage growth,
inflation has risen gradually. It is
forecast to increase from 0.6 % in
2015 (0.0 % in the euro area) to
1.4 % in 2016 (0.5).
The slowdown in labour cost
growth follows measures to
temper wage growth: (i) real
wage increases have been
curtailed since 2011; (ii) a
suspension of wage indexation
schemes since April 2015,
entailing a real wage correction
by 2 %; (iii) a tax shift to lower
non-wage labour costs, inclu-
ding sizeable social security
reductions for employers in
2016-2019 (pp. 20-22).
Locking in the gains made and
preventing past problems from
reoccurring hinges on a reform
of the wage-setting framework.
Remaining policy gaps relate to
(i) enacting the envisaged
reform of the Law of 1996; (ii) a
better reflection of productivity
in wage-setting; (iii) addressing
the drivers behind the inflation
differential to prevent price-
wage cycles (pp. 22-24).
Low productivity growth has important
consequences given the absence of a
direct link with wage growth. It can be
related to a mediocre performance on a
number of aspects that constrain the
economy’s long-term growth potential:
- a low share of fast-growing firms in
innovative sectors in spite of a high-
quality research system (p. 26);
- a shortage of skilled professionals,
notably in sciences and engineering
(p. 27);
- a business climate hampered by low
levels of entrepreneurship readiness
(p. 28), a heavy administrative
burden that inhibits company
expansion (p. 31), regulatory barriers
in the services sectors (p. 28) and the
quality of judicial processes (p. 32);
- a deteriorating quality of public
infrastructure as a result of
structurally low public investment in
combination with the failure to
timely address bottlenecks (pp. 9-
10). These elements play a role in the
swelling congestion problem (p. 57).
Belgium is broadly on track to
meet the R&D intensity target of
3 % (p. 26). Public support
remains fragmented (p. 26).
The percentage of graduates in
science, technology, engineering
and mathematics (STEM) is far
below the EU average (p. 27).
The administrative burden does not
appear to have been reduced.
Progress with regard to e-
procedures was outweighed by the
increased complexity of labour
legislation, social security and tax
administration, as well as a general
lack of consistency across
legislation (pp. 31-32).
Public investment reached 2.4 %
of GDP in 2008-2015, slightly up
from a pre-crisis average of 2.1 %
of GDP. Net public investment has
on average been zero since the
1990s, eroding the quality of
public infrastructure (pp. 9-10).
Comprehensive innovation
policies have been put in place
and a budgetary effort has been
made in favour of R&D (p. 26).
Measures were taken to promote
STEM curricula (p. 27).
Efforts were made to simplify
administrative procedures and
reduce the reporting burden on
(small) companies. Intended
simplifications relate to the
introduction of digital proce-
dures and e-services (p. 31).
The government has presented a
comprehensive reform of the
justice system, scheduled for
adoption by 2019 (p. 31).
A timely and resolute approach
to address infrastructure
bottlenecks would help to lift
productivity growth. The same
holds for further product market
reforms, in particular in the
services sector (pp. 29-30).
2.5. MIP ASSESSMENT MATRIX

2.5. MIP assessment matrix
40
Table (continued)
(*) The first column summarises 'gravity' issues which aim at providing an order of magnitude of the level of imbalances. The
second column reports findings concerning the 'evolution and prospects' of imbalances. The third column reports recent
and planned relevant measures. Findings are reported for each source of imbalance and adjustment issue. The final three
paragraphs of the matrix summarise the overall challenges, in terms of their gravity, developments and prospects, and
policy response.
Source: European Commission
Public debt A steady decline of the public debt
ratio ended in 2007, at 87 % of GDP,
as the authorities were forced to
support failing financial institutions
and the economic crisis pushed public
finances deep into the red. Subdued
economic growth and low inflation
have also hampered efforts to stabilise
public debt since (p. 33).
A high public indebtedness could
create macroeconomic vulnerabilities
considering that it reduces the
government’s fiscal space and requires
high taxation to service the debt burden
(p. 36).
Negative feedback channels exist
through sizeable contingent liabilities
related to financial sector guarantees
(8 % of GDP at the end of 2015) and a
concentration of Belgian banks and
insurers on domestic bonds (pp. 35-
36).
Public debt has exceeded 100 % of
GDP again since 2011. In recent
years debt has stabilised at around
107 % of GDP (p. 33). Planned
fiscal consolidation and higher
nominal growth should allow a
reduction of the debt ratio as of
next year. However, in the longer
term the reduction of the debt ratio
is hampered by the impact of an
ageing population (p. 37)
Contingent liabilities linked to the
financial sector are set to decrease
further, thereby gradually lowering
related risks.
Medium-term sustainability risks
appear manageable given low
financing costs, the resumption of
primary surpluses and the
relatively long average maturity of
the debt stock. Macroeconomic
risks are further tempered by the
net creditor position of the private
sector (pp. 35-36).
Strict implementation of
budgetary plans and pension
reform plans is a prerequisite for
putting the debt on a firm
downward path and ensuring
sustainable public finances in
the long run.
The pursuit of a sufficiently
ambitious structural reform
agenda would support this
process as it would lift growth
in the long run.
Conclusions from IDR analysis
Belgium’s external performance has been hampered by a prolonged deterioration of competitiveness. On the one hand,
productivity growth has dwindled, reflecting bottlenecks in innovation, business environment and public infrastructure. On the
other hand, wages moved fast because of the wage-setting system. The crisis interrupted the long cycle of public debt reduction
and saddled public finances with sizeable contingent liabilities.
While the loss of external competitiveness continues to pose macroeconomic risks, the magnitude of these risks has been
declining in recent years. Public debt has stabilised at a high level. Debt reduction implies a more demanding fiscal effort amid
a context of subdued nominal growth. Several factors significantly temper associated macroeconomic risks in the short term.
Corrective measures have narrowed the relative labour cost gap. Continued wage restraint and the reduction of social security
contributions are set to result in further competitiveness gains in the coming years. However, preventing new gaps from
emerging hinges on reforms of the wage-setting framework. Regarding public indebtedness, continued fiscal consolidation will
be needed to put the debt on a firm downward path and ensure long-term sustainability.

41
Labour market
The Belgian labour market has shown a mixed
performance in recent years. While the
unemployment rate has consistently remained
below the EU average, the employment rate has
stagnated at around 67 %. This compares with
Belgium’s employment target of 73.2 % by 2020
and the euro area average of 69.3 % in Q3-2015.
After several quarters of decline, employment
started growing again from Q1-2014, albeit at a
slower pace than elsewhere in the EU.
Graph 3.1.1: Employment rates in function of skills levels
and age (2014)
Source: European Commission
The Belgian labour market also stands out for
its sizeable employment differentials between
various groups. The employment rates of prime
age middle and highly qualified workers are
generally above average (Graph 3.1.1), while low
skilled workers, older workers, second generation
migrants and young people clearly underperform
in this respect (Table 3.1.1). Bringing the
respective employment rate of these specific
groups in line with the EU averages would yield
substantial increases in the overall employment
rate of Belgium.
Table 3.1.1: Employment rate for Belgium and EU for
different labour force population groups
note: groups are not mutually exclusive
Source: European Commission
Belgium's unemployment rate has remained
broadly stable in recent years and below the
euro-area average. The long-term unemployment
rate — the share of long-term unemployment in
the total labour force — hovered around 4 %,
whereas the euro area rose from 4.3 % to 5.3 %
between 2010 and Q3-2015. However, long-term
unemployment incidence — the share of long-term
unemployment in total unemployment — rose to
52 % of total unemployment in Q3-2015 (Graph
3.1.2).
Belgium continues to face low labour utilisation,
sizeable and persistent labour shortages and
skill mismatches. Job vacancy rates remained
high throughout the crisis and were the highest in
the EU in Q3-2015. The dispersal of employment
and unemployment rates across broad skills groups
is among the highest in the EU, indicating the
presence of skills mismatches. The latest European
Company Survey found that about 60 % of Belgian
firms claimed to have difficulties in finding staff
with the necessary skills (38
). Belgian employers
(38) This is the 5th highest level in EU. Cedefop (2015), Skill
shortages and gaps in European enterprises: striking a
0
10
20
30
40
50
60
70
80
90
100
15 - 24 25 - 29 30 - 34 35 - 39 40 - 44 45 - 49 50 - 54 55 - 59 60 - 64
BE low BE medium BE high
EU low EU medium EU high
Belgium EU
Low skilled 1609 46.6 51.8
Young people 694 39.6 48.4
Young - low skilled 109 33.7 42.6
Young medium skilled 406 37.4 47.9
Older workers 1405 42.7 51.8
2nd
generation migrants 680 59.5 67.9
Labour force population 6639 67.3 69.2
group
Employment rate
(in %)Population in Belgium
(in thousands)
3. ADDITIONAL STRUCTURAL ISSUES
In addition to the macroeconomic imbalances and adjustment issues addressed in section 2, this section
provides an analysis of other structural economic and social challenges for Belgium. Focusing on the
policy areas covered in the 2015 country-specific recommendations, this section analyses issues related
to the labour market, the taxation system, and transport, energy, and environment.
3.1 LABOUR MARKETS, SOCIAL POLICIES, SKILLS AND
EDUCATION

3.1. Labour market, social policies, skills and education
42
are among those who most frequently reporting
skills shortages as the greatest challenge in filling
vacancies. Moreover, for the last ten years, the list
of the hardest jobs to fill has hardly changed.
Skilled trade workers top the list of workers most
sought after in the three regions.
Graph 3.1.2: (Long-term) unemployment rate (LHS) and
long-term unemployment incidence (RHS)
Source: European Commission
The policy response at federal level has focused
on reducing overall labour costs, strengthening
financial incentives to work and activating
older workers. With regard to the latter, the
authorities have taken further steps since the
beginning of 2015 to gradually phase out early exit
through the old-age social security system by
tightening eligibility requirements and making re-
entry into the labour market a more attractive
option. It has also enacted a rise in the pensionable
age from 65 to 67, to take effect by 2030. To boost
overall employment growth, the government has
pursued and accelerated the wage moderation
policies initiated under the previous legislature and
started gradually reducing the employer's social
security contributions (see Section 2.2.). To reduce
disincentives to work, the 2012 reform of the
unemployment benefit system stipulated that
benefits would fall more steeply over time.
Subsequent steps focused on low wage earners
balance between vocational education and training and the
labour market.
(work bonus (39
)), older workers and the part-time
unemployed. In addition, other measures, such as
raising the ceiling for professional costs, or some
of the tax shift provisions, also help reduce the tax
wedge on labour by lowering personal income
taxes (40
).
These measures should help reduce the
unemployment, inactivity and low wage traps
which, according to the latest available data,
remain high. They are particularly sizeable for
single parents and people living alone, especially
at lower wage levels. In 2013, the inactivity trap
for second income earners (i.e. the rise in effective
tax rates for those moving from inactivity to
employment) was, at 49.2 %, the second highest in
the EU. Belgium has the highest low-wage trap for
second income earners (when the second earner's
income rises from 33 % to 67% of the average
wage or when a part-time worker increases his/her
hours) in the EU, at 58.8 %. Both traps are
measured for a second income earner in a family
with two children where the principal earner earns
the average wage (41
). Both traps reflect the joint
income taxation for cohabiting or married couples
through the so-called ‘marital quotient' (42
). This
tax advantage for couples can discourage second
income earners from engaging in the labour market
or increasing the number of hours worked. It
mainly affects women, whose part-time
employment rate as a percentage of total female
(39) The ‘social work bonus’ is a reduction of the low-waged
employee’s social security contributions. This means net income can be increased without affecting the total labour
cost. The ‘fiscal work bonus’ is a fiscal mechanism to
prevent this extra income from being taxed away. Both instruments have been reinforced several times in recent
years. The two latest reinforcements entered into force in
August 2015 and January 2016. Further increases have been agreed for 2019.
(40) Such as the twofold increase of the ceiling for tax
deductible professional expenses (as of 01/2015 and as of 01/2016), and the stepwise scrapping of the 30 % income
tax bracket (as of 01/2016 and to be completed by 2019).
(41) They are defined as the rate at which the additional gross income of a transition from inactivity to paid employment
or of working additional hours is taxed.
(42) In principle, spouses are taxed separately. The marital quotient allows cohabiting or married partners to pool their
earnings and to assign part of the taxable income earned by
the partner with the highest income to the partner who has no income or only a limited income of their own. As a
consequence, it is taxed at a lower rate, given the
progressive nature of personal income taxation. However, the couple can no longer benefit from the marital quotient
if the partner with the lower earned income earns more
than 30 % of the couple's total earned income.
0
10
20
30
40
50
60
0
2
4
6
8
10
12
14
2005
2006
2007
2008
2009
2010
2011
2012
2013
2014
2015
UR EA UR BE
LT UR EA LT UR BE
LTU incidence EA LTU incidence BE

3.1. Labour market, social policies, skills and education
43
employment is far above the EU average (41.4 %
vs. 32.8 % in 2014).
The three regions and the German speaking
Community are simplifying, streamlining and
reforming the employment policy instruments.
As a result of the 6th
State Reform (43
), various
additional employment policy levers have been
transferred to the regional and community levels as
of July 2014, including monitoring of job search
requirements, apprenticeship support schemes as
well as employment incentives for specific target
groups. As aggregate labour market figures for
Belgium hide stark regional differences, the
devolution of power has triggered reflections on
how to optimize the fit between the existing target
group policies and the regional labour market
realities. In Flanders, the government has proposed
a Draft Decree beginning of 2016 which retains
reduced employer social security contributions for
low- and middle schooled workers below the age
of 25 (subject to a wage ceiling), for workers
above the age of 55 and for people with a
disability. The regional social partners, meanwhile,
have concluded an agreement which aims for a
thorough streamlining of the various qualitative
support measures for those most removed from the
labour, including through in-company learning
("werkplekleren"), job coaching ("tijdelijke
werkervarings-programma's"), as well as
subsidized work experience and apprenticeship
programmes ("individuele beroepsopleidingen").
Whether or not some type of employment
incentive for long-term unemployed between the
age of 25 and 55 is to be maintained is currently
still being discussed between the government
authorities and the social partners. In Wallonia,
government and social partners have reached
agreement on an encompassing reform which
refocuses the transferred employment incentive
schemes on the activation of benefits of young and
long-term unemployed and reduced social security
contributions for older workers. Job seekers below
the age of 25 will benefit from a wage subsidy
(43) The devolved employment incentives include the
reductions of employer’s social security contributions and the activation of benefits of the unemployed. Taken
together, these two types of schemes represent a total
budget of over EUR 1.2 billion. Structural reductions of employers' social security contributions and targeted
exemptions of the withholding tax for night and team work
remained federal.
upon recruitment for a period of maximum 3 years.
The benefit is granted to all young unemployed
without a secondary education degree as well as to
those who have such a degree but remain jobless
for at least 6 months. After 18 months of
unemployment, young job seekers qualify for a
higher level of support as well as individualised
coaching upon re-entry in the labour market. A
similar support scheme, albeit limited to two years,
will apply to the long-term unemployed (> 12
months), independent of their age. Employment
demand for older workers will be supported by
means of reduced social security contributions, the
importance of which increases with age. Finally,
the agreement also provides for wage subsidies for
SMEs in specific sectors. These regionalised
employment incentive schemes are to become
applicable at the latest by 2017. Thus, following
the greater emphasis being placed on activation
and personalised support, and the transfer of
control tasks, all public employment services will
have to cope with increased workloads. This will
test their capacities and organisations.
Young people
Youth unemployment, though falling, is still
well above its pre-crisis level and above the EU
average. Young people with a low educational
attainment are particularly affected, with an
unemployment rate of 42.9 % against a euro-area
average of 33.0 % in Q3-2015. Long-term youth
unemployment is increasing and remains a
challenge in particular for the low-skilled (with a
rate of 22.1 % vs. 17.1 % in the EU).
Education inequalities and poor educational
outcomes partly explain the observed
underperformance in terms of youth
unemployment. This is particularly true in a
context of rapid technological change and de-
industrialisation, with a shift of labour demand
towards high-skilled occupations (44
). Early
school-leaving rates have been falling but are still
amongst the highest in the EU in Wallonia and
Brussels (see below). The same holds true for the
rate of young people neither in employment nor in
education and training (NEETs), with high levels
(44) Ilaria Maselli, ‘The Evolving Supply and Demand of Skills
in the Labour Market’, Intereconomics: review of European economic policy, Vol. 47, 2012, 1, pp. 22-30.

3.1. Labour market, social policies, skills and education
44
recorded in Wallonia (14.7 %) and Brussels
(15.8 %), compared to an EU average of 12.5 %.
Moreover the Belgian NEETs population includes
a higher share of inactive young people compared
with the EU average (45
).
High labour costs also create barriers to entry
into the labour market for young people
starting their careers. When making hiring
decisions, employers typically assess the total
labour cost against the expected productivity of the
potential new recruit. Therefore, in practice, low-
skilled young people may be priced out of the
labour market, although this is to some extent
compensated for by targeted reductions of
employer social security contributions (46
). In this
respect, the decision by the federal government to
further decrease non-wage-related labour costs at
the lower end of the pay scale in the framework of
the initiated tax shift might help improve the
employment prospects of young people.
To strengthen the financial incentives to take up
employment and to limit abuse, the federal
government has reformed the insertion
allowance for young job seekers (47
). Its duration
was limited to 36 months and eligibility was made
conditional on obtaining a secondary school
diploma or equivalent. As a result, the number of
young people receiving this allowance fell by
about 9 000 between June 2014 and June 2015.
However, over the same period, the number of
people drawing the living allowance rose by about
3 000, suggesting that part of this target group has
turned to social welfare centres for support.
To raise the youth employment rate, both
preventive and corrective policies are needed.
The flow of low-skilled young people onto the
(45) EUROFOUND, The diversity of NEETs (forthcoming),
preliminary results presented at the September 2015 Peer Review on ‘Targeting NEETs — key ingredients for
successful partnerships in improving labour market
participation’, Oslo, 24-25 September 2015.
(46) OECD (2015), Focus on Minimum Wages after the crisis:
making them pay. Together with France, Hungary and the
Netherlands, three other countries with relatively high social levies or payroll taxes, the ratio of minimum-to-
median labour costs in Belgium is pressed down by
concessions for low-wage employees. (47) The insertion allowance is given (subject to some
conditions) to young people who have not contributed
enough to the unemployment insurance scheme to benefit from it.
labour market needs to be stemmed. At the same
time, demand for low-skilled workers needs to
increase, and the transition from education to work
should be made smoother. It remains to be seen
what impact the recent reform of legislation to
protect employment will have, in particular as
regards the transition from education to work, as
the abolition of a trial period in regular contracts
was accompanied by a shorter notice period.
Older workers
Older workers represent the single biggest
labour reserve, reflecting the very low activity
and employment rates of 55-64-year-olds,
despite recent increases. Although their
employment rate has increased in recent years
(44.7 % in Q3-2015), it remains one of the lowest
in the euro area, 9 percentage points below
average. The duration of working life remains
among the shortest in the EU, at 32.6 years vs.
35.1 years for the euro area on average in 2014.
While the unemployment rate of people under 50
years of age has started to fall, it is still rising for
the over-50s; moreover, the share of long-term
unemployment among this group was 73 % in Q3-
2015, well above the euro-area average of 65 %.
Drivers of underperformance include
mismatches between pay scales and
productivity. In Belgium, collective bargaining
agreements covering white-collar workers
frequently include progressive wage scales, in
which seniority is used as a proxy for individual
productivity developments. Belgian firm-level
data, however, suggest that higher shares of older
workers adversely affect productivity (48
). This
may reflect a lack of investment in updating
skills — participation in lifelong learning is indeed
low — but possibly also a lack of investment in the
workplace to maintain employability and
productivity. Against this background, industry-
wide pay scales with a strong reliance on seniority
tend to make individual firms less likely to hire
older workers.
Generous early exit schemes have also provided
the wrong incentives to both employers and
employees. However, consecutive reforms of the
(48) Vandenberghe et al. (2013), Ageing and employability.
Evidence from Belgian firm-level data. 40: 111-136.

3.1. Labour market, social policies, skills and education
45
early retirement and old-age unemployment
systems have tightened minimum age and career
conditions and strengthened availability to work
requirements. The authorities have enacted a rise
in the pensionable age to 67 by 2030. In 2015, the
government also increased the minimum age and
contribution period entitling workers to take early
retirement. In addition, the early retirement service
credit was phased out from 2015 in the public
sector, and the minimum entry age for company
allowance schemes increased from 60 to 62 years.
As a result, the share of people exiting early
from the labour market through pensions,
disability or unemployment schemes has
declined by around 10 percentage points since
2000 for the 50-64 age bracket. The most
significant decreases are observed in the area of
pensions and unemployment schemes exempt from
job search requirements, whereas the take-up of
disability schemes has increased (49
). In addition,
the number of persons on unemployment benefits
with company top-ups has declined from nearly
118 000 in 2010 to 95 000 in Q3-2015.
At the same time, employment opportunities for
the older workers remain scarce, as shown by
the large increase in unemployment rates since
activation requirements for this group were
strengthened and by the very low transition-to-
work rates of the older unemployed.
In such a context, measures supporting labour
market demand for older workers, and their
integration in the workplace, become crucial.
The need to support demand is recognised by the
regional authorities who intend to pursue and
strengthen the employment incentive schemes for
older workers devolved from the federal level.
People with a migrant background
The labour market integration of people
originating from non-EU countries is very poor.
Contrary to what happens in neighbouring
countries, the second generation does not succeed
in closing the gap (50
). Of the Members States,
(49) OECD Economic survey Belgium 2015.
(50) Corluy et al. (2015), The labour market position of second generation immigrants in Belgium, NBB Working paper
285.
Belgium has, after Greece, the highest employment
rate gap between second-generation non-EU
migrants and people without a migrant
background (51
). These population groups record
high unemployment as well as low activity rates,
particularly among women. When in employment,
people with a migrant background are over-
represented in precarious jobs and receive lower
wages. This can be explained by a number of
factors such as low educational attainment and
qualification levels, gender roles, discrimination
and segmentation of the labour market (52
).
A large share of the population with a migrant
background remains inactive. The inactivity rate
of people originating from outside the EU is at
least double that of people of Belgian origin, with
proportions around 40 % for people with a north
African or sub-Saharan background, far above the
15 % recorded for people without a migrant
background. Immigration into Belgium for non-
labour motives such as family reunification or
asylum is an important explanatory factor. In
addition, the financial incentives for second
income earners (particularly low-skilled women
with children) may not be sufficient in the case of
low-wage jobs, and add to the difficulties on the
labour market, particularly for low-skilled young
people.
People with a migrant background, especially
the low-skilled, face discrimination on the
labour market. Perception of discrimination is
amongst the highest in Belgium, and
discrimination is at least partly determined by the
expected negative reactions of future co-workers
and customers. Discrimination at recruitment plays
a bigger role for lower-skilled jobs, while skills
shortages lead to less discrimination for higher-
skilled jobs (53
).
The current inflow of refugees adds to the
previous migration waves and increases the
integration challenges. Since May 2015, the
(51) Eurostat, LFS 2014 ad hoc module Migration and labour
markets. (52) Socioeconomic monitoring report 2015.
(53) Baert et al. (2013), Do employers discriminate more if
vacancies are difficult to fill? Evidence from a field experiment, IZA DP 6562; Baert, S. & A.S. De Pauw
(2014), Is ethnic discrimination due to Distaste of
Statistics?, IZA DP 8319.
3.1. Labour market, social policies, skills and education
46
number of applications for asylum has risen
sharply with most applicants coming from Iraq,
Syria and Afghanistan. The number of applications
doubled in 2015 with more than 35 500
applications compared with 17 000 applications in
2014 (54
). This highlights the importance of rapidly
tackling specific issues such as recognition of
qualifications or skills, or language training
provision. The federal government and the social
partners have agreed to reduce the period before
refugees can access the labour market after arrival
and registration in Belgium from six to four
months (55
).
Long-term unemployed
The incidence of long-term unemployment is
high, with risk factors relating to age, skills
levels and the duration of the period of
unemployment. The long-term unemployed form
an important labour reserve of over 200 000
people, although it is a very heterogeneous group,
and there are big differences between regions as
well. Long-term unemployment is growing fastest
among older workers, also reflecting tightened
labour market availability requirements. For the
young long-term unemployed, the probability of
finding a job depends mainly on skill levels,
whereas skill levels have less impact on older
workers. Given the challenges they face, people
with a migrant background are more likely to be
long-term unemployed.
In a context of rising long-term unemployment,
it is essential to combine activation and support
for access to the labour market. Across the
country, social welfare centres offer a wide range
of services to the long-term unemployed. Their
social activation strategy has become well-
established practice and reaches participants from
less-advantaged groups. Collaboration between
employment and social services is generally
strong, although not uniformly developed across
municipalities and target groups.
(54) Commissariat Général aux Réfugiés et aux Apatrides,
statistiques d’asile. (55) Provided a set of requirements are met regarding proof of
registration, work permit and a registration form from the
municipality. The Council of State has been requested its opinion.
Social inclusion
The overall social situation in Belgium has
remained relatively stable in the last few years
but this hides a growing divide between groups.
No progress has been made towards the Europe
2020 target of reducing the number of people at
risk of poverty and social exclusion. While the risk
of poverty has fallen among older people during
the crisis, it has increased for specific groups in the
active population, such as low-skilled people and
those living in very low-work intensity
households, the share of which is above the euro
area average (14.6 % vs. 11.9 %). People with a
migrant background are particularly exposed to
poverty with Belgium having the highest at-risk-
of-poverty gap in 2014 between native-born people
and non-EU immigrants (33.6 percentage points
compared with an average gap of 17.7 percentage
points in the euro area).
The reform of unemployment benefits is
affecting the social assistance budget. The
number of people receiving the jobseeker's
allowance has fallen by nearly 40 %, with about
35 000 fewer people receiving it in June 2015 as
compared to June 2014. However, over the same
period, the number of people drawing a living
allowance rose by about 13 000. This increases
pressure on social welfare centres and local social
budgets.
The level of child poverty remained broadly
stable and below the EU average during and
after the crisis, but persistent poverty has
increased from 6.8 % in 2007 to 12.4 % in 2014.
The number of children living in low-work-
intensity households is above the EU average (56
),
as a result of the low employment rate, and a
significant social gradient for children under two
attending childcare services (see below).
Structural barriers, such as unequal access to
social services, prevent further reduction of
poverty or social exclusion. They range from
participation in quality early childhood education
and care to education and healthcare, in addition to
participation in the labour market.
(56) This is up to 49 % of the children in low-work-intensity
households with low-skilled parents against a euro-area average of 26.8 %.

3.1. Labour market, social policies, skills and education
47
Although Belgium has higher use of formal
childcare for age group 0-3 (46 %) by
comparison with the EU average (27 %) and the
Barcelona target (33 %) some issues of
childcare availability remain. Almost all existing
childcare facilities have waiting lists. Moreover,
due to a growing population particularly in the
larger cities, overcrowding is increasing, lowering
the quality of early childhood education and care.
Furthermore, the number of income-related places
in out-of-school care services remains very small,
and there are concerns about the quality of these
services (57
). Shortages of affordable and quality
childcare and out-of-school care could induce
second income earners (often women) to take
parental leave or work part-time, with a negative
impact on household income. Although the regions
are developing plans to fight poverty and social
exclusion, success also depends on the
coordination between policies, in particular
employment, education, social inclusion, migration
and housing.
Education and lifelong learning
Belgium is facing wide performance gaps
between schools and high levels of educational
inequality in basic skills performance linked to
socioeconomic and migrant background. The
challenges are early school-leavers' poor basic
skills and the mediocre academic performance of
pupils in initial vocational education and training.
There are marked differences in basic skills
performance (58
) and in early school-leaving rates
between the communities and regions. Moreover,
according to Pisa results, even after taking the
socioeconomic background into account, Belgium
has one of the largest performance gaps between
students with a migrant background and those
without. The difference between the languages
spoken at home and at school largely explains the
performance gap.
(57) The out-of-school care sector has high staff turnover and
relies heavily on voluntary workers. These factors hamper the sector in improving its professionalism and the quality
of its services.
(58) According to Pisa 2012, the proportion of low achievers is far below the OECD average in the Flemish Community,
close to the average in the German-speaking Community,
and above the average in the French-speaking Community.
Inequality already starts in early childhood
education and care. Despite a high overall
participation rate in early childhood education for
children from 3 years onwards, lower participation
rates and less regular attendance are observed in
specific target groups. Early childhood education
and care vary in quality. Disadvantaged pupils are
more at risk of being channelled into special needs
education and vocational pathways and of leaving
school with at most a certificate of lower
secondary education, resulting in skills levels not
relevant to labour market needs (59
).
Too many young people leave education with
low qualifications. Although the nationwide early-
school-leaving rate has been falling (9.8 %
compared to 11.1 % for the EU), regional
discrepancies persist, and levels observed in
Wallonia (12.9 %) and in Brussels (14.4 %) are
still amongst the highest in the EU (compared to
7 % in Flanders). Boys and students taking initial
vocational education and training are
overrepresented amongst early school leavers.
There is a strong correlation between early school
leaving rates and the area where the pupil lives, the
language spoken at home and the mother’s level of
education.
The most disadvantaged schools lack
experienced teachers and head teachers, in the
context of an increasingly diverse and
multicultural population. Research findings
confirm that for nursery and primary schools,
school segregation tends to go hand-in-hand with
unequal access to human, material and social
resources (60
). In addition, survey results (61
) show
that collaborative teaching is not well developed
and that a limited proportion of teachers seem to
assign work to students on the basis of their
individual needs. Pupils with a migrant
background make up a higher proportion of the
pupils' population (15.1 %) than the OECD
(59) Regards économiques (2013), ‘Le chômage des jeunes en
Belgique, Diagnostic et remèdes clés’, UCL, IRES, no. 108; Hoj, J. (2013), Enhancing the inclusiveness of the
labour market in Belgium, eco/wkp(2013)1 no. 1009.
(60) Poesen-Vandeputte, M. & I. Nicaise (2015), Rich schools, poor schools. Hidden resource inequalities between
primary schools, Educational Research, 57:1, 91-109.
(61) For the Flemish Community only: TALIS 2013 the OECD Teaching and Learning International Survey. For the
French-speaking Community: Pacte pour un enseignement
d’Excellence (2015).

3.1. Labour market, social policies, skills and education
48
average (12 %). Reports confirm their unequal
distribution between schools.
Evidence raises questions about the structure of
initial vocational education and training
provision, and its relevance to labour market
needs (62
). An important challenge is to
substantially increase the share of work-based
learning, by making this form of learning more
attractive and improving the rules governing it.
According to the latest available data, the share of
work-based students in upper secondary initial
vocational education and training in Belgium is
just 4.3 %, compared with an EU average of
26.5 %.
Major education reforms to improve basic skills
and develop inclusive quality education, to
lower grade repetition and to improve initial
vocational education and training are at an
early stage. The French-speaking Community has
launched an ambitious reform (2015-2025) of early
childhood education and across all levels of its
compulsory education system. The German-
speaking Community is pursuing reforms of its
secondary education system. In the Flemish
Community, the 2013 reform of secondary
education is progressing, although some important
decisions are still to be taken. Moreover, the
Flemish STEM action plan for 2012-2020 is
designed to increase the number of secondary and
higher education students in science, technology,
engineering and mathematics, and to encourage
more students to opt for a career in the exact
sciences or technology. The ongoing education
reforms in the other two communities also aim to
address those challenges. Finally, with
considerable differences in approach and scope, all
three communities have launched a strategy or
measures to fight early school leaving. They are
also revising their priority education policies.
Participation in lifelong learning is low in
Belgium. In 2014, participation in training or
education in the four weeks preceding the survey
averaged 7.1 % for people aged between 25 and 64
(62) The upper secondary stages in the French-speaking
community offer 217 basic group options. Nearly half of pupils are found in only 10 of the 178 options in the last
years, and the 108 less popular ones account for only 7 %
of pupils; in the Flemish Community there are 256 fields of study.
in 2014, compared with an EU average of 10.7 %.
Moreover, participation by low-skilled people is
particularly low, at 3 % in 2014. This could be an
issue, as the share of the adult population with less
than upper secondary education remains high
(26.2 % compared to 24 % in the EU). As in all
other Member States, participation in lifelong
learning is higher among younger than among
older workers. According to the Adult Education
Survey, only 46 % of employed persons participate
in formal and non-formal education and training,
which is a long way below Germany (56.7 %),
France (57.5 %) and the Netherlands (69.7 %), and
below the EU average (48.6 %) and the euro-area
average (53.3 %).
Insufficient development of lifelong learning
seems to be combined with significant means.
The Adult Education Surveys conducted in 2007
and 2011 suggest that there is not enough interest
in lifelong learning: relatively few of those
interviewed had searched for information on
education and training or were aware of methods
for documenting skills and qualifications for
employment purposes. Time conflicts between
training and work were rarely considered to be an
obstacle. However, the actual amounts invested in
lifelong learning vary considerably, depending on
the statistical source used; they range from 1 % of
labour costs according to the 2010 social balance
sheets, to over 2 % according to the expert group
on competitiveness and employment, and even
2.4 %, which would be well above the EU average.
Moreover, the share of employees participating in
in-service vocational training courses is above the
EU average, as is the share of enterprises that
encourage training. In addition, a number of other
provisions such as time credit (federal), training
vouchers (Flanders), or language vouchers
(Brussels) have been introduced to encourage the
provision and uptake of training.
Although measures have been taken and plans
are being developed, success in improving the
performance of the labour market and social
indicators will depend on coordination between
policies, in particular employment, education,
social inclusion and migration and integration.
This also implies better coordination and
cooperation among all levels of Belgian
government. Remaining inactivity and low wage
traps could be addressed by tackling the remaining
inefficiencies in the benefits system and by
3.1. Labour market, social policies, skills and education
49
removing spikes in the effective marginal tax rates
for specific household types. In parallel, well-
targeted employment support and activation
policies continue to be needed to improve the
employment rate of older workers, low-skilled
young people, and people with a migrant
background. Policies to promote active ageing and
to support demand for older workers would help to
further reduce early exit from the labour market.
Education and training policies are essential in
addressing skills mismatches and early school
leaving. Pursuing or speeding up the ongoing
education reforms designed to reduce the early
school leaving rate, tackle educational inequalities
and improve the quality and relevance of the
vocational system could help ease the shift towards
a knowledge-intensive and increasingly service-
oriented economy.
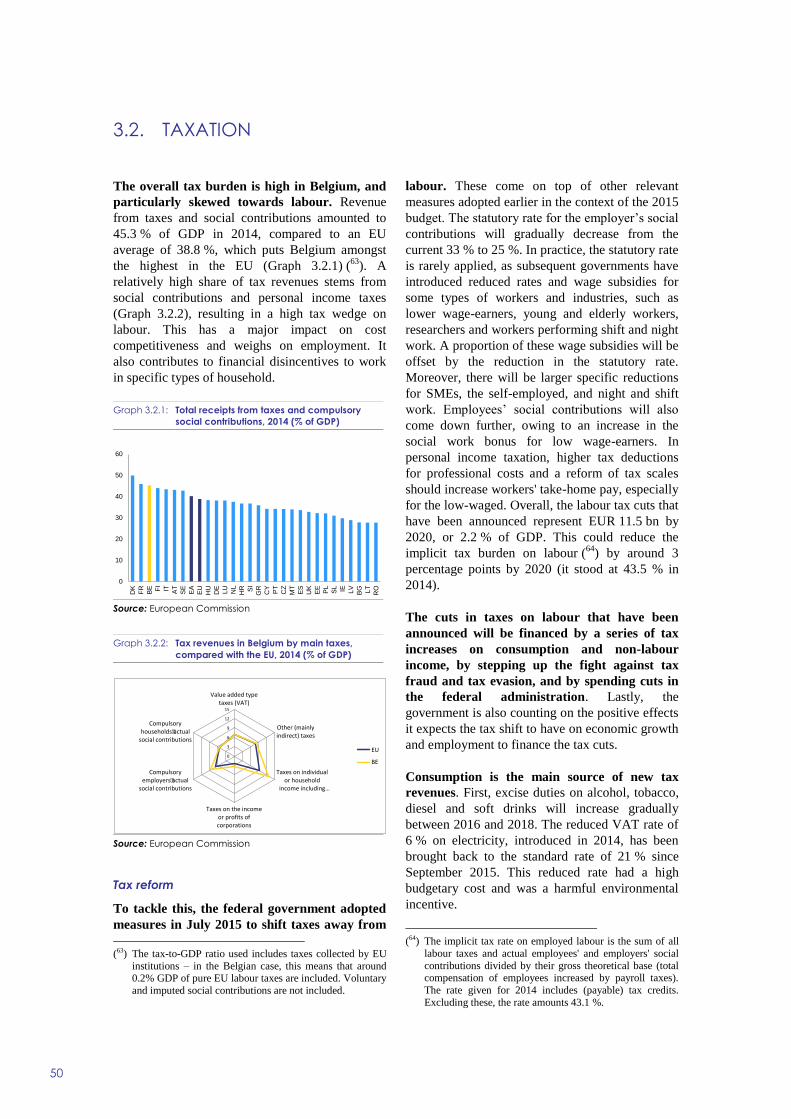
50
The overall tax burden is high in Belgium, and
particularly skewed towards labour. Revenue
from taxes and social contributions amounted to
45.3 % of GDP in 2014, compared to an EU
average of 38.8 %, which puts Belgium amongst
the highest in the EU (Graph 3.2.1) (63
). A
relatively high share of tax revenues stems from
social contributions and personal income taxes
(Graph 3.2.2), resulting in a high tax wedge on
labour. This has a major impact on cost
competitiveness and weighs on employment. It
also contributes to financial disincentives to work
in specific types of household.
Graph 3.2.1: Total receipts from taxes and compulsory
social contributions, 2014 (% of GDP)
Source: European Commission
Graph 3.2.2: Tax revenues in Belgium by main taxes,
compared with the EU, 2014 (% of GDP)
Source: European Commission
Tax reform
To tackle this, the federal government adopted
measures in July 2015 to shift taxes away from
(63) The tax-to-GDP ratio used includes taxes collected by EU
institutions – in the Belgian case, this means that around 0.2% GDP of pure EU labour taxes are included. Voluntary
and imputed social contributions are not included.
labour. These come on top of other relevant
measures adopted earlier in the context of the 2015
budget. The statutory rate for the employer’s social
contributions will gradually decrease from the
current 33 % to 25 %. In practice, the statutory rate
is rarely applied, as subsequent governments have
introduced reduced rates and wage subsidies for
some types of workers and industries, such as
lower wage-earners, young and elderly workers,
researchers and workers performing shift and night
work. A proportion of these wage subsidies will be
offset by the reduction in the statutory rate.
Moreover, there will be larger specific reductions
for SMEs, the self-employed, and night and shift
work. Employees’ social contributions will also
come down further, owing to an increase in the
social work bonus for low wage-earners. In
personal income taxation, higher tax deductions
for professional costs and a reform of tax scales
should increase workers' take-home pay, especially
for the low-waged. Overall, the labour tax cuts that
have been announced represent EUR 11.5 bn by
2020, or 2.2 % of GDP. This could reduce the
implicit tax burden on labour (64
) by around 3
percentage points by 2020 (it stood at 43.5 % in
2014).
The cuts in taxes on labour that have been
announced will be financed by a series of tax
increases on consumption and non-labour
income, by stepping up the fight against tax
fraud and tax evasion, and by spending cuts in
the federal administration. Lastly, the
government is also counting on the positive effects
it expects the tax shift to have on economic growth
and employment to finance the tax cuts.
Consumption is the main source of new tax
revenues. First, excise duties on alcohol, tobacco,
diesel and soft drinks will increase gradually
between 2016 and 2018. The reduced VAT rate of
6 % on electricity, introduced in 2014, has been
brought back to the standard rate of 21 % since
September 2015. This reduced rate had a high
budgetary cost and was a harmful environmental
incentive.
(64) The implicit tax rate on employed labour is the sum of all
labour taxes and actual employees' and employers' social
contributions divided by their gross theoretical base (total compensation of employees increased by payroll taxes).
The rate given for 2014 includes (payable) tax credits.
Excluding these, the rate amounts 43.1 %.
0
10
20
30
40
50
60
DK
FR
BE FI
IT AT
SE
EA
EU
HU
DE
LU
NL
HR SI
GR
CY
PT
CZ
MT
ES
UK
EE
PL
SL IE LV
BG LT
RO
0
3
6
9
12
15
Value added typetaxes (VAT)
Other (mainlyindirect) taxes
Taxes on individualor household
income including…
Taxes on the incomeor profits ofcorporations
Compulsoryemployers’ actual
social contributions
Compulsoryhouseholds’ actual
social contributions
EU
BE
3.2. TAXATION

3.2. Taxation
51
Alternative revenues are also expected from
higher taxation on income from capital. The tax
changes include a rise in the withholding tax rate
on dividends, interest income and royalties from
25 % to 27 %, a reform of the taxation of real
estate funds, and the introduction of a new tax on
short-term realised capital gains. Although capital
losses would not be deductible from this new tax,
the limited scope (shares in listed companies,
warrants and options; realisation within six months
after acquisition) might result in tax avoidance and
seems to limit the revenue potential.
Lastly, efforts to combat tax fraud and tax
evasion are also expected to increase revenue.
However, while some measures are designed to
prevent fraud (‘fraud-proof cash registers’ in
restaurants and bars), others are implemented
further downstream and appear to be stop-gaps.
This applies, for example, to the carat tax, a special
set of tax arrangements to benefit the diamond
industry, and to the permanent tax regularisation
scheme, with increasing penalties over time, which
is expected to be introduced in 2016. Furthermore,
as of 2015 the transparency tax is expected to
allow the taxation of foreign legal structures with
separate legal personality (trusts for instance)
established abroad, not subject to taxation and with
no real economic activity.
The regional governments have, to varying
degrees, also introduced changes to the tax
system. The three regions have made changes to
transaction taxes for property taxes, and made
housing tax incentives in personal income taxation
(mortgage deductions) less generous. The latest
reform of the state allows the regions to decide on
social security reductions for specific target
groups. Both the Flemish Region and the Walloon
Region have outlined their plans for reform but
measures still need to be adopted (see Section
3.1.). The Brussels Capital Region has outlined
measures to shift taxes from labour to immovable
property, to be implemented in 2016 and 2017.
The main features are a reduction in personal
income taxation and gift taxes on immovable
property, while other immovable property taxation
is generally shifted towards more recurrent
taxation. Lastly, the kilometre charge for trucks
will be implemented as of 1 April 2016 by all three
regions (see Section 3.3).
The various measures outlined above shift taxes
away from labour, as recommended by the
Council in its country-specific recommenda-
tions to Belgium over the past few years. The
lower tax burden on labour is expected to improve
competitiveness and the functioning of the labour
market, and will therefore support growth and
employment. Moreover, the abolition of the
reduced VAT rate on electricity and the planned
equalisation of excise duties on diesel and petrol
remove some environmentally harmful features.
However, the tax shift only partially exploits
opportunities to shift taxes to more growth-
friendly tax bases, including an environmental
tax reform and the abolition of environmentally
harmful subsidies. A striking example is the
favourable tax treatment of company cars and fuel
cards (see Box 3.2.1), which has substantial
negative externalities in terms of congestion and
pollution. Despite the high overall tax burden,
revenues from environmentally related taxes are
currently among the lowest in the EU (2.1 % of
GDP in 2014, compared with an EU average of
2.5 %), especially from energy taxes (1.2 % of
GDP against an EU average of 1.9 %). As a
consequence, environmental taxes constitute only
4.5 % of total tax revenues, against 6.3 % in the
EU. There thus seems to be considerable potential
for additional revenue from environmental taxes in
Belgium.
So far, the tax 'shift' outlined by the federal
authorities does not appear to be budgetary
neutral. According to the National Bank of
Belgium and the Federal Planning Bureau, the total
cost of the tax decreases is expected to amount to
2.2 % of GDP by 2020 (65
). Ex ante, only 0.9 % of
GDP is financed by new revenue measures. Part of
the gap is expected to be financed through the
positive impact on growth and employment. This
being said, the simulations of the National Bank
and the Federal Planning Bureau show a remaining
gap of respectively 0.4 % of GDP and 1.0 % of
GDP by 2020. Further deficit-reducing measures,
on top of those required to meet the medium-term
objective, may thus be needed. This includes
(65) National Bank of Belgium (2015), Incidence
macroéconomique sur l’économie belge du scénario de tax shift élaboré par le Gouvernement; Federal Planning
Bureau (2015), Effets macro-économiques et budgétaires
des mesures de tax shift du gouvernement fédéral.

3.2. Taxation
52
regional level, which is directly affected by federal
cuts in personal income taxation. Moreover, it
remains to be seen what certain new financing
measures, such as the fight against fraud or tax
evasion, will yield.
Tax design
While the tax shift measures constitute
considerable progress towards lowering the tax
burden on labour, Belgium’s tax system
remains complex. While statutory tax rates are
generally high, the effective tax rates are often
much lower, due to a plethora of tax
expenditures (66
). Tax reductions, exemptions and
deductions add to the complexity of the tax system
and thus compliance costs. Tax expenditures also
entail costs in terms of revenue foregone and may
create efficiency losses and economic distortions.
Moreover, they tend to be particularly difficult to
repeal and are even likely to grow over time. The
latest available data (income year 2012) show that
the revenue foregone at federal level amounted to
around one quarter of federal tax revenues (7 % of
GDP), mainly from reduced VAT rates and tax
deductions in personal income taxation (e.g. for
pension savings and for a single owner-occupied
dwelling) (67
). As of 2015, the some tax
expenditure ceilings have been frozen, and the
deduction for the own dwelling has been made less
generous (see above). Although in some cases
there may be good reasons for implementing tax
expenditures, e.g. they might operate as tax
incentives that correct for market failures or
provide incentives to internalise positive external
effects, some types of tax expenditures can lead to
welfare losses by distorting investment and
consumption choices. It is therefore important to
assess tax expenditures regularly. Some of the
(66) Tax expenditures can take a number of forms (e.g.
allowances, exemptions, rate relief, deferrals, and tax credits). As instruments for promoting specific social or
economic policies, they are functionally closely related to
direct spending programmes. Tax expenditures are
generally categorised by tax base (e.g. VAT, personal
income tax, or corporate income tax) and often grouped
according to i) the type of relief (e.g. allowances, rate relief, exemptions), ii) purpose (support to low income
earners, housing, etc.) or iii) sector (households,
businesses, or agriculture). (67) Estimate for the income year 2012, for which the revenue
foregone reached EUR 26 bn at federal level, See
‘Inventaire des exonérations, abattements et réductions qui influencent les recettes de l’Etat’, September 2015 update.
goals might be achieved more efficiently through
targeted spending programmes.
In personal income taxation, spikes in the
effective marginal tax rates could give rise to
labour market traps. For example, the ceiling to
benefit from the so-called ‘marital quotient’ can
discourage second earners from engaging in the
labour market or increasing the number of hours
worked (68
). Consequently, this feature adds to
inactivity and low wage traps for second earners,
which are among the highest in the EU, and affect
in particular women (see Section 3.1).
The varying taxation of investment instruments
encourages biases towards regulated saving
accounts at the expense of more long-term or
riskier investment. The liquidity preference in
investment (partially reflecting the build-up of
precautionary savings as well as the low interest
rate sensitivity of household investment) is
exacerbated by the tax exemption on regulated
savings accounts. This tax exemption favours the
banking system over other sources of finance on
capital markets, especially equity, which may hold
back funding for innovative high-value projects
Moreover, an overgrown banking sector relying
excessively on short-term funding may lead to
financial stability risks.
As in many Member States, the different tax
treatment of debt and equity financing distorts
financing choices in favour of debt. The
allowance for corporate equity partly addresses the
debt-equity bias in corporate income taxation by
combining the deductibility of interest costs on
debt with a deduction of a notional return to
equity, making corporate income taxation slightly
more neutral with respect to financing choices.
However, the allowance for corporate equity has
been declining over the last years and will continue
to do so in 2015 and 2016 given the continuous fall
of the reference rate (the 10-year Belgian
government bond rate). Besides, there are no
(68) This feature of the personal income tax calculation for
couples assigns part of taxable income from the partner with the highest income to the partner without an income
of their own, or with a limited own income. As a
consequence, it is taxed at a lower rate given the progressive nature of personal income taxation. However,
the couple can no longer benefit from the marital quotient
when the partner earns more than 30 % of the couple's total earned income.

3.2. Taxation
53
adequate anti-abuse clauses to prevent the
framework's being abused for aggressive tax
planning, so that it does not fully address all
distortions with respect to choices such as profit
shifting and cross-border structures (69
).
Finally, several other features of Belgium’s tax
system can also be used in aggressive tax
planning structures (70
). In particular, the absence
of anti-abuse rules (71
) is noted. Tax features such
as the excess profit rulings scheme and the patent
box can prompt or facilitate aggressive tax
planning in the absence of sufficient safeguards. In
this context, the Commission has found the excess
profit tax scheme for multinational companies to
be illegal under state aid rules, which means that
any corporation tax unpaid under the scheme must
be recovered (72
).
All in all, the tax measures implemented or
announced by the Belgian authorities constitute
a sizeable shift away from labour. However,
scope remains for a more comprehensive tax
reform to broaden the tax base and remove
inefficient tax expenditures. If the design of the tax
system were improved to close loopholes, this
could also make taxation more fair and improve
the overall situation of public finance.
(69) See, for instance, Zangari, E. (2014), Addressing the Debt
Bias: A Comparison between the Belgian and the Italian ACE Systems, Working Paper N. 44; Ramboll
Management Consulting and Corit Advisory (2016), Study
on Structures of Aggressive Tax Planning and Indicators. Final report, Taxation paper No 61.
(70) For an overview of the most common structures of
aggressive tax planning and the provisions (or lack thereof) necessary for these structures to work, see Ramboll
Management Consulting and Corit Advisory (2016), Study
on Structures of Aggressive Tax Planning and Indicators, European Commission Taxation Paper No 61. The country-
specific information provided in the study gives the state of
play by May/June 2015. (71) An example is the lack of Controlled Foreign Companies
rules. Furthermore, while the tax authority is generally
fighting hybrid loans and the qualification of the income (interest or dividend), no linking rule exists, and there is a
lack of rules to counter mismatches in tax qualification of
domestic companies or partnerships and those of a foreign state.
(72) See: http://europa.eu/rapid/press-release_IP-16-42_en.htm.

3.2. Taxation
54
Box 3.2.1: Tax treatment of company cars: fiscal and environmental costs
While both social security contributions and
personal income taxes are relatively high in
Belgium, the taxation of the benefit-in-kind
associated with the personal use of a company
car is particularly favourable, both for
employers and employees. As a consequence,
employees are often provided with company cars
(often accompanied with a fuel card) as a way of
reducing the marginal tax rate. For the employee,
the main tax advantage lies in the low value
(around 9 % of the listed price on average) used to
compute the taxable benefit of personal use of a
company car. Hence, employees are taxed on an
estimated benefit-in-kind that is considerably less
than the real value of using a company car. This
favourable tax treatment represents a generous
subsidy for the private use of company cars, with a
25 % gap between the cost to the company and the
taxable benefit as compared to the car price
(Graph 1) (1). Moreover, the benefit-in-kind is not
subject to employee social security contributions.
Employers, on the other hand pay a solidarity
charge, which, however, is substantially lower than
the social security contribution rate that would be
payable on other types of remuneration, as there is
no link between the solidarity charge and the value
of the fringe benefit or the overall wage level.
Advantageous tax treatment for company cars
has a high budgetary cost in terms of revenue
foregone, estimated at approximately 0.9 % of
GDP annually (2). Moreover, the Belgian company
(1) This indicator measures the income tax subsidy to the
employee as the difference between the cost to the
employer of providing a car (including taxes,
insurance and maintenance costs, and fuel costs) and the benefit-in-kind on which the employee is taxed
under the personal income tax system. It does not
reflect the way the benefit is treated for social security purposes. See Wöhlbier et al. (2016).
(2) Harding (2014) estimates the income tax revenue
foregone at EUR 2 bn (0.5 % of GDP), while the special social security scheme for company cars leads
to a loss in social security revenues estimated at
around EUR 1.75 bn (0.4 % of GDP) (Courbe, 2011).
car scheme has considerable welfare costs. These
affect both the individual, by reducing expenditure
choices, and society in general, by aggravating
congestion and pollution. The current tax treatment
favours road travel and risks diluting the incentives
to reduce fuel consumption provided by energy and
vehicle taxation. It also imposes welfare costs on
society, in terms of congestion, air pollution, and
greenhouse gas emissions. This is of particular
concern as Belgium has a serious and growing
problem with peak hour congestion and is expected
to miss its 2020 greenhouse gas emission target by
6 pps. (see Section 3.3).
Graph 1: Subsidy for private use of company cars
(2014)
Source: European Commission
Phasing out favourable tax treatment for
company cars and fuel cards, by better
reflecting the full value of the benefit and the
negative external costs, could thus have multiple
benefits. To avoid increasing labour costs or
lowering wages, the additional tax revenues could
be used to reduce the overall tax burden on labour.
Alternatively, a mobility budget available to
employees to use as they wished could remove
some of the perverse incentives of the existing
framework for company car taxation.
0%
5%
10%
15%
20%
25%
30%
35%
40%
BG LV HU PT LT MT BE IT SK EL FR DE CZ EE UK SI AT LU ES RO IE SE DK NL FI PL

55
Road and rail transport
Located centrally, Belgium has a dense road
and rail network which is well integrated into
major European transport infrastructures. This
location, supported in particular by its port
infrastructure, makes Belgium a very good
location for logistics clusters and distribution
centres. This is confirmed by the 2014 global
Logistics Performance Index from the World
Bank, on which Belgium ranked third.
However, this position is threatened by
increasing road congestion, the lack of adequate
road maintenance, missing links, and road
safety issues (73
). Opportunities lie in the increased
availability of alternative fuel infrastructure and
intelligent transport systems. As regards rail
transport of passengers and freight, the key issues
are market access, infrastructure bottlenecks,
punctuality of trains and the construction of the
Brussels Regional Express Network.
Belgium is Europe’s most congested country in
terms of hours wasted (74
) or delay (the negative
effect of uncertain or longer delivery times, missed
meetings, business relocations and other
congestion-related effects). The problem is most
pronounced during peak hours and around Brussels
and Antwerp, although interurban congestion is
also an issue in Belgium. Other economic costs
caused by traffic congestion include fuel costs, lost
productivity, lost workdays, air pollution, clinic
visits and medication costs. In addition, the large
share of diesel passenger cars (amounting to 67 %
in Belgium, compared to an EU average of 41 % in
2013 (75
)) contributes significantly to high
concentrations of particulate matter and NO2,
causing premature deaths.
There is a pressing need for a more
comprehensive approach to congestion
problems in Belgium. The intention to tackle
congestion announced in the federal and regional
government agreements still needs to be turned
(73) Belgium has a much higher road fatality rate than the
neighbouring countries, with 62 reported deaths per million inhabitants (compared to an EU average fatality rate of 51
and a rate of 28 for the Netherlands). Of these fatalities,
18 % are caused on motorways. (74) http://www.inrix.com/scorecard/key-findings-us/.
(75) http://www.acea.be/statistics/tag/category/passenger-car-
fleet-per-capita.
into tangible measures, although some ad hoc
measures have been taken to improve matters. A
smart road pricing system for trucks is to be
operational as of April 2016. However, the
introduction of a system for heavy duty trucks
alone will not have a significant impact on
congestion, because cars are the main users of road
infrastructure (76
) and the potential for time-
differentiated congestion charging for passenger
cars remains unaddressed (77
). Phasing out
favourable tax treatment for company cars would
considerably improve the environmental and
economic effects in terms of congestion costs and
pollution (Box 3.2.1).
Belgium invests less in road infrastructure and
road maintenance than the EU average. As a
percentage of GDP, investment is now lower than
in the 1990s. In contrast to most other countries,
motorways' share of total road length has fallen in
Belgium. This, together with the comparatively
low amount of investment in Belgian road
maintenance, could explain the deteriorating
World Economic Forum satisfaction ranking (78
).
There are currently two main road
infrastructure projects planned in Belgium: the
termination of the Antwerp ring road and the
upgrading of the Brussels ring road. The aim in
completing the Antwerp ring road, the Oosterweel
trajectory, is to alleviate congestion, improve
traffic conditions and make Antwerp and its port
more agreeable places to live and work. The start
of the project has been continually delayed by
procedural issues, but is currently scheduled for
2017. Upgrading the northern section of the
Brussels ring road would involve creating special
lanes for local and transit traffic. There are
concerns that an initial reduction in congestion
could attract new traffic, ultimately leaving
(76) Federal Planning Bureau (2014), Analyse de l’impact de
différents schémas théoriques d’une taxe routière en Belgique, Working Paper 14-09.
(77) Flanders still intends to assess the possibility of a kilometre
charging system for passenger cars without Wallonia's support.
(78) World Economic Forum, Global Competitiveness Index
Data Platform.
3.3. TRANSPORT, ENERGY AND ENVIRONMENT

3.3. Transport, energy and environment
56
congestion unchanged and actually increasing
pollution (79
).
Belgium has activities planned and ongoing
with regard to the clean power for transport
Directive and the intelligent transport systems
Directive (80
). A Benelux declaration on
alternative fuels was signed in October 2015,
promoting collaboration in the roll-out of
infrastructure for alternative fuels between the
three countries. Intelligent transport systems are
planned in the context of optimum road use, traffic
and travel data (e.g. multimodal route planners,
real-time traffic information services, carpooling
and car-sharing) as well as road safety and security
applications.
The transport sector was responsible for 21 %
of total greenhouse gas emissions in 2012. If it
does not change its policies and use flexible
mechanisms, Belgium is expected to miss its
greenhouse gas emission reduction target by 6 pps.
in 2020 (as compared to 2005). Although some
measures have been announced earlier or have
been implemented since 2015 (81
), more resolute
action has been hindered by the lack of an internal
climate agreement between the federal and
regional authorities. Such an agreement was finally
reached in December 2015. It covers both the
distribution of efforts to reduce emissions and
increase renewable energy levels, and revenues
from auctioning emission allowances under the EU
emissions trading system. It is now vital to
implement the agreement and update existing
policies where necessary.
(79) OECD Economic survey Belgium (2013), Better use of
infrastructure to reduce environmental and congestion costs.
(80) Road transport, road infrastructure, road safety and public
transport (except railway) lie mostly within the regions' remit. Federal responsibilities include the railway network,
a limited number of road safety aspects and vehicle
regulation. (81) In 2015, a climate responsibility mechanism involving all
the regions was introduced. It sets out a multiannual
reference trajectory for reducing greenhouse gas emissions in all regions up to 2030, in the residential and tertiary
building sector (excluding industrial buildings). In
addition, the federal government plans to establish an ‘energy pact’, underpinned by a common energy vision
with the regions, on the basis of consultation with
stakeholders. The pact's overarching goal would be to guarantee the supply of clean and affordable energy for the
next 20-25 years.
Energy
Belgium’s economy is energy-intensive, and
import dependency for all fuels, in particular
gas and petroleum products, stands above the
EU average. Measures to encourage investment in
energy efficiency remain important, as they would
improve its economic efficiency, reduce its import
dependency, strengthen the balance of payments
position, reduce the economy’s vulnerability to
external price shocks and cut greenhouse gas
emissions. To meet its indicative primary and final
energy consumption target by 2020, Belgium will
have to take stronger measures.
Though Belgium has made good progress in
renewables development, it is unclear whether
its policies and tools are sufficient and effective
in meeting their renewable energy objectives.
The renewables share in final energy consumption
reached 8 % in 2014, enabling Belgium to exceed
its 2013/2014 interim targets. However, further
progress is still needed if Belgium is to reach its
2020 target of 13 % of final energy consumption.
Resource efficiency
The 2016 Annual Growth Survey underlined
that Member States should improve efficiency
in resource use and bring forward a more
circular economy. Although there is no
comprehensive national programme for a circular
economy in Belgium, both Flanders and Wallonia
are making headway on this broad challenge.
Belgium performed slightly better on resource
productivity than the EU average in 2013. It is
among the EU's top performers as regards waste
management, with a recycling rate for municipal
waste of 55 % in 2013 (the EU average in 2013
was 41.8 %). Belgium's water exploitation index is
around 30 % of available resources, partly due to
the high use of cooling water for electricity
production (82
). Additional progress could be made
by introducing new economic instruments to
promote waste prevention, by avoiding
incinerating reusable or recyclable waste, and by
making the reuse and recycling of waste more
economically attractive. Phasing out subsidies for
incineration might also support a shift towards
environmental taxes.
(82) European Commission (2016 forthcoming), EU Resource
Efficiency Scoreboard 2015.

3.3. Transport, energy and environment
57
Box 3.3.1: Security of supply
As highlighted in last year’s report, Belgium faces major challenges as regards the adequacy of its
domestic power generation and the security of supply in general. The reasons for this are the retirement of
unprofitable gas-fired plants, the rising share of intermittent capacity, and the repeated and prolonged outage
of a large proportion of Belgium's nuclear capacity. To avoid the risk of black-outs, the authorities have
created a strategic reserve for the period between November and March. This reserve consists of shut down
gas-fired plants and companies willing to switch off machines in the event of imminent scarcity. It is only if
these additional reserves are depleted that a scheme for controlled load shedding is to be activated (1).
The federal regulator, CREG, highlights how this strategic reserve, while contributing to the security
of supply in the short term, does not compensate for the absence of long-term market price signals that
would lead to new domestic investments (2). While fears of scarcity have been reflected in temporary price
hikes on the wholesale electricity market, CREG points out there would have to be many more such peaks to
trigger investments in large units and that the strategic reserve is no replacement for sufficient capacity to
cover demand under normal circumstances.
Nuclear generation was restored to full capacity in recent months, and the two first nuclear plants
scheduled for mothballing were authorised to continue operating. Legal proceedings have been brought
against both decisions. Although these measures have lowered short-term supply risks, repeated interruptions
have made Belgium’s ageing nuclear power stations an undependable source. Belgium is one of the world’s
most nuclear-dependent countries, as nuclear plants represent about half of installed domestic capacity. The
start of the exit from nuclear power has been repeatedly delayed — from 2015 to 2016 to 2022 — while a full
phase-out is still scheduled for 2025. This implies that half the country’s total domestic capacity is to be shut
down within as little as three years. As a result, investment needs are concentrated in 2020-2025 (3).
The absence of a coherent long-term vision for the energy sector and the lasting uncertainty
surrounding the timing of the nuclear exit has led to a climate unsupportive to long-term investment
decisions, given that amortised nuclear plants are highly profitable. This underscores how a clear,
feasible timetable for the planned nuclear phase-out is needed so that lost capacity can be replaced in good
time. New investment has been mainly in renewable sources, which could benefit from significant subsidies.
Offshore windfarms under development could replace up to one third of the nuclear capacity lost, leaving a
significant shortfall that needs to be closed through a combination of energy efficiency measures, additional
domestic capacity and better connections with grids in other countries. Germany and the Netherlands have
structural generation surpluses, though Belgium’s main links are with the French grid. The envisaged
ALEGrO link with Germany should help in this respect (4). The scheduled expansion of interconnectedness
will also help balance the Belgian system, given the rise in intermittent energy production. The same would
hold for the further development of demand-side and storage management tools.
In other words, Belgium urgently needs a comprehensive view of its long-term energy landscape and
roadmap to arrive there. Authorities have the ambition of reaching an inter-federal ‘energy pact’ for the
next 20-25 years, though little progress has been made so far.
(1) According to a study by the federal regulator, there was never a real risk of shortage in the winter of 2014-2015. Even
if there had been more extreme weather conditions, the strategic reserve would have sufficed, and it would have been
activated for only one day. At the same time, Belgium imported record amounts of electricity. (2) CREG (2015), Study on the measures to be taken in order to ensure an adequate volume of conventional production
means to assure Belgium’s electricity security of supply.
(3) FPB (2014), Het Belgische energiesysteem in 2050: Waar naartoe? (4) The ALEGrO link with Germany and the subsea Nemo link with the UK, the first direct connections with both
countries, are the largest planned projects to strengthen interconnectivity. Both have a capacity of around 1000 MW
and are scheduled to become operational by 2019 at the earliest.

58
2015 Country-specific recommendations (CSRs)
CSR 1
Achieve a fiscal adjustment of at least 0.6 % of
GDP towards the medium-term budgetary
objective in 2015 and in 2016. Use windfall
gains to put the general government debt ratio
on an appropriate downward path. Complement
the pension reform by linking the statutory
retirement age to life expectancy. Agree on an
enforceable distribution of fiscal targets among
all government levels.
Belgium has made some progress in addressing
CSR 1 (this overall assessment of CSR1 does not
include an assessment of compliance with the
Stability and Growth Pact):
Some progress has been made in putting the debt
ratio on a downward path. Consolidation
measures have been taken at all levels of
government to reduce the budget deficit.
However, the targeted structural improvement has
not been reached. In addition, headline deficit
targets have also been revised upwards, as
economic growth is lower than previously
expected. Unfavourable economic conditions,
notably modest economic growth and particularly
low inflation, have made it more demanding to
put the debt-to-GDP ratio on a downward path.
Belgium implemented growth-enhancing
structural reforms which are expected to
contribute to debt reduction in the medium/long
term.
Some progress has been made in linking the
retirement age to life expectancy. The federal
parliament adopted the last part of the pension
reform agreed in 2014, notably an increase in the
statutory retirement age to 66 years in 2025 and
67 in 2030. On the other hand, no automatic or
semi-automatic link has been introduced to adapt
the pension age or other parameters further to take
account of demographic changes. The
government is considering introducing a points
system which would facilitate parametric
changes.
Limited progress has been made towards an
enforceable distribution of fiscal targets among
the various levels of government. The
Cooperation Agreement reached between the
different levels of government at the end of 2013,
which formalises fiscal policy coordination, has
(83) The following categories are used to assess progress in implementing the 2015 CSRs:
No progress: The Member State (MS) has neither announced nor adopted measures to address the CSR. This category also applies if
the MS has commissioned a study group to evaluate possible measures. Limited progress: The MS has announced some measures to address the CSR, but these appear insufficient and/or their
adoption/implementation is at risk.
Some progress: The MS has announced or adopted measures to address the CSR. These are promising, but not all of them have been implemented and it is not certain that all will be.
Substantial progress: The MS has adopted measures, most of which have been implemented. They go a long way towards
addressing the CSR. Fully implemented: The MS has adopted and implemented measures that address the CSR appropriately.
ANNEX A
Overview Table
Commitments Summary assessment (83
)

A. Overview Table
59
not been fully implemented The distribution of
the fiscal trajectory for the general government in
the 2015 Stability Programme is only indicative,
and no formal distribution of targets has been
agreed. This hampers the strengthened monitoring
role of the High Council of Finance, as it cannot
assess compliance with agreed targets as provided
for by the Cooperation Agreement.
CSR 2
Adopt and implement a comprehensive tax
reform broadening the tax base, shifting the tax
burden away from labour and removing
inefficient tax expenditures.
Belgium has made some progress in addressing CSR
2.
Measures have been taken to reduce the tax
wedge on labour through decreases in personal
income taxation and social security contributions.
Employers' social security contributions will
gradually decrease, from maximum 32.4 % to
maximum 25 % for the highest wages between
2016 and 2018, and from 17.3 % to 10.9 % for the
lowest wages between 2016 and 2019. These
reductions will partly replace existing wage
subsidies. Specific reductions for SMEs and self-
employed people will be enlarged. There will be
cuts in personal income taxation to increase take-
home pay and strengthen purchasing power: the
ceiling for tax-deductible professional expenses
will be raised a second time (to EUR 4 210 from
2016). Income between EUR 8 711 and
EUR 12 400, which is currently taxed at 30 %,
will be taxed at 25 %. The lower limit of the 45 %
tax bracket will be raised, widening the 40 % tax
bracket.
To finance this tax shift away from labour, tax
bases have been broadened and taxes that distort
growth less have been raised. This applies
especially to taxes on consumption. The reduced
VAT rate for electricity was abolished in
September 2015. Excise duties on alcohol,
tobacco, diesel and soft drinks will gradually
increase between 2016 and 2018. New revenues
will also come from increased capital taxation,
notably: higher withholding taxes on dividends,
interests and royalties; a new speculative
transaction tax on short-term capital gains on
shares; and the reform of the taxation of real
estate investment funds. Regional governments
are implementing a system of kilometre-based
road charging for heavy duty vehicles. In 2016,
the Brussels Capital Region abolished the
regional poll tax of EUR 89. This will be financed
by a 12 % rise in recurrent immovable property

A. Overview Table
60
taxes.
Some tax expenditures have been removed or
reduced. The reduced VAT rate for electricity was
abolished in September 2015. The Walloon
government reformed the deduction for owner-
occupied housing and made it more focused on
low and middle-income owners. The Brussels
Capital Region is to abolish the personal income
tax deduction for owner-occupiers with a single
home in 2017. Instead, buyers will be entitled to a
reduction in registration duties of up to
EUR 22 500 for a dwelling they intend to occupy
(provided that it is their only one), subject to
certain limits.
CSR 3
Improve the functioning of the labour market by
reducing financial disincentives to work,
increasing labour market access for specific
target groups and addressing skills shortages
and mismatches.
Belgium has made some progress in addressing CSR
3:
Incentives to work have been strengthened by
several measures to reduce the tax wedge
(increased tax credit for low-waged workers and a
higher ceiling for tax-deductible professional
costs) as well as by parametric reforms of the
unemployment benefit system affecting part-time
workers and elderly unemployed people in
particular. Additional measures to reduce the tax
wedge have been adopted but have yet to enter
into force. Several measures have been taken to
gradually reduce social security contributions as
of 2016 (see CSR 2).
Working arrangements between Flemish and
Brussels regional employment services were
strengthened in October 2015. Under the altered
cooperation agreement, Flanders (VDAB) will
have the authority to organise the entire job
mediation trajectory (from training to job
placement) for unemployed Brussels residents
seeking employment for which knowledge of
Dutch is required.
In Flanders, the government has proposed a Draft
Decree beginning of 2016 which retains reduced
employer social security contributions for low-
and middle schooled workers below the age of 25
(subject to a wage ceiling), for workers above the
age of 55 and for people with a disability.
In Wallonia, government and social partners have
reached agreement on an encompassing reform
which refocuses the transferred employment

A. Overview Table
61
incentive schemes on the activation of benefits of
young and long-term unemployed and reduced
social security contributions for older workers.
The French Community launched in 2015 a major
reform of its education system which should
address educational inequalities and improve the
vocational and training system. A reorganisation
in ten geographical areas of the latter has started
and the dual learning system was streamlined in
September 2015.
The Flemish Community is pursuing its
secondary education reform. Key decisions
related to vocational and training are yet to be
taken. A new action plan to strengthen the fight
against early school leaving was adopted early
2016 in parliament. The implementation of the
STEM action plan is moving forward.
CSR 4
Restore competitiveness by ensuring, in
consultation with the social partners and in
accordance with national practices, that wages
evolve in line with productivity.
Belgium has made limited progress in addressing
CSR 4:
While considerable progress has been made on
correcting the historic labour cost gap, progress
on revising the wage-setting framework is less
tangible. A reform of the Law of 1996 on the
national wage-setting framework, announced in
the 2014 government agreement, has not been
enacted so far. Discussions of the projected
reform continue between the social partners.
Europe 2020 (national targets and progress)
Employment rate target set in the 2015 NRP:
73.2 %.
The employment rate stood at:
67.2 % in 2012;
67.2 % in 2013;
67.3 % in 2014.
Belgium has fallen a long way behind the trajectory
towards the 2020 employment target.
R&D target set in the 2015 NRP: 3 % of GDP
(including budgetary costs of federal tax
measures in favour of R&D staff, estimated at
0.18 % of GDP in 2020 by BE).
Gross domestic expenditure on R&D (% of GDP):
2.36 % in 2012;
2.42 % in 2013;

A. Overview Table
62
2.46 % in 2014.
On the basis of recent trends, Belgium is broadly on
track to reach the 2020 R&D intensity target.
Greenhouse gas emissions, national target:
-15 % in 2020 compared with 2005 (in non-ETS
sectors).
According to the latest national projections submitted
to the Commission and taking into account existing
measures, it is expected that the target will be missed:
-9 % in 2020 compared with 2005 (i.e. a projected
shortfall of 6 percentage points).
2020 renewable energy target: 13 %. Share of renewable energy in gross final energy
consumption:
7.4 % in 2012;
7.9 % in 2013;
8.0 % in 2014.
Belgium has made good progress on developing
renewables, exceeding the 2013/2014 interim targets.
However, the distance to the target remains
considerable. With a 4.9 % share of renewables in
transport in 2014, Belgium is halfway in achieving
the binding 2020 target of 10 % in transport.
Energy efficiency, 2020 energy consumption
targets:
43.7Mtoe (primary energy consumption);
32.5Mtoe (final energy consumption).
Gross inland consumption of energy:
47.3Mtoe in 2012 (final consumption: 35.0Mtoe);
48.6Mtoe in 2013 (final consumption: 36.2Mtoe).
Belgium is not on track to meet its national energy
efficiency targets, either for final or for primary
energy consumption.
Early school leaving (ESL) target: 9.5 %. Young people leaving education and training early
(percentage of the population aged 18-24 with at
most lower secondary education and not in further
education or training):
12.0 % in 2012;
11.0 % in 2013;
9.8 % in 2014.
Early school leaving is below the EU average (9.8 %
compared with 11.2 %) and close to the 2020 target
of 9.5 %.
A. Overview Table
63
The improvement in the average masks wide
disparities between subgroups of the population and
between regions. The rate among young people from
migrant backgrounds is twice the overall rate.
Tertiary education target: 47 %. The tertiary educational attainment rate stood at:
43.9 % in 2012;
42.7 % in 2013;
43.8 % in 2014.
Belgium’s rate significantly exceeds the EU average
(37.9 % in 2014). However, the gap between the
national target and the actual figure has remained
broadly constant over the years.
Target for reducing the number of people at risk
of poverty or social exclusion, expressed as an
absolute number of people: 380 000 (base year
2010: 2 235 000).
The number of people at-risk-of-poverty or social
exclusion (x 1 000 persons) stood at:
2 356 in 2012;
2 286 in 2013;
2 339 in 2014.
The number of people at risk of poverty or social
exclusion rose again in 2014. To meet the 2020
target, the reduction would have to be as much as
484 000 people between 2014 and 2020. Some
subgroups of the population are disproportionately at
risk.

64
ANNEX B
MIP scoreboard
Table B.1: The MIP scoreboard for Belgium
Flags: p: provisional.
Note: Figures highlighted are those falling outside the threshold established in the European Commission's Alert Mechanism
Report. For REER and ULC, the first threshold applies to euro area Member States.
Source: European Commission
Thresholds 2009 2010 2011 2012 2013 2014
Current account balance,
(% of GDP) 3 year average -4%/6% 0.0 -0.1 -0.1 0.2 -0.4 -0.1
-35% 57.3 65.1 60.8 51.7 51.6 57.2
Real effective exchange
rate - 42 trading partners,
HICP deflator
3 years % change ±5% & ±11% 3.9 0.5 -1.6 -4.3 -0.3 -0.5
Export market share - %
of world exports5 years % change -6% -9.1 -11.5 -7.3 -15.1 -11.7 -10.7
Nominal unit labour cost
index (2010=100)3 years % change 9% & 12% 10.1 7.5 5.3 5.5 8.5 5.6
6% -0.1 1.4 1.0 0.2 0.1 -1.1p
14% 6.2 3.2 21.4 14.2 -0.1 1.0
133% 164.8 161.7 174.0 186.8 180.7 181.4
60% 99.5 99.6 102.2 104.1 105.1 106.7
Unemployment rate 3 year average 10% 7.5 7.7 7.8 7.7 7.7 8.2
16.5% -1.6 -0.5 7.4 -6.3 -3.7 4.9
-0.2% 0.4 0.6 -0.4 0.0 -0.2 1.0
0.5% -0.7 0.3 0.2 -0.1 -0.2 0.8
2% 1.4 3.6 0.7 -2.1 1.3 4.5
Activity rate - % of total population aged 15-64 (3 years
change in p.p)
Long-term unemployment rate - % of active population
aged 15-74 (3 years change in p.p)
Youth unemployment rate - % of active population aged
15-24 (3 years change in p.p)
External imbalances
and competitiveness
New employment
indicators
Net international investment position (% of GDP)
Deflated house prices (% y-o-y change)
Total financial sector liabilities (% y-o-y change)
Private sector credit flow as % of GDP, consolidated
Private sector debt as % of GDP, consolidated
General government sector debt as % of GDP
Internal imbalances

65
ANNEX C
Standard Tables
Table C.1: Financial market indicators
1) Latest data Q2 2015.
2) Latest data September 2015. Monetary authorities, monetary and financial institutions are not included.
* Measured in basis points.
Source: IMF (financial soundness indicators); European Commission (long-term interest rates); World Bank (gross external
debt); Eurostat (private debt); ECB (all other indicators).
2010 2011 2012 2013 2014 2015
Total assets of the banking sector (% of GDP) 310.8 316.7 280.1 260.1 275.1 262.6
Share of assets of the five largest banks (% of total assets) 74.9 70.8 66.3 64.0 65.8 -
Foreign ownership of banking system (% of total assets) 59.4 64.3 64.1 65.4 65.6 -
Financial soundness indicators:
- non-performing loans (% of total loans)1)
2.8 3.3 3.8 4.3 4.4 4.0
- capital adequacy ratio (%)1) 19.3 18.5 18.2 18.7 17.6 18.2
- return on equity (%)1) 10.6 1.2 3.4 16.0 7.9 9.7
Bank loans to the private sector (year-on-year % change) -2.4 -1.4 -1.2 6.2 9.1 6.8
Lending for house purchase (year-on-year % change) 6.6 -1.9 6.0 10.1 19.5 12.1
Loan to deposit ratio 62.4 60.1 56.6 58.2 59.6 62.3
Central Bank liquidity as % of liabilities 2.7 6.9 5.4 2.5 1.6 1.0
Private debt (% of GDP) 161.7 174.0 186.8 180.7 181.4 -
Gross external debt (% of GDP)2)
- public 55.6 50.1 41.7 56.5 67.7 68.8
- private 90.1 103.6 78.3 103.5 102.4 106.7
Long-term interest rate spread versus Bund (basis points)* 71.9 162.5 150.5 84.0 55.0 34.4
Credit default swap spreads for sovereign securities (5-year)* 94.9 173.2 124.8 36.3 31.0 30.0

C. Standard Tables
66
Table C.2: Labour market and social indicators
(1) Unemployed people are all those who were not employed but had actively sought work and were ready to begin
working immediately or within two weeks.
(2) The long-term unemployed are peoples who have been unemployed for at least 12 months.
(3) Not in education, employment or training.
(4) Average for first three quarters of 2015. Data for total unemployment and youth unemployment rates are seasonally
adjusted.
Source: European Commission (EU Labour Force Survey)
2010 2011 2012 2013 2014 2015 (4)
Employment rate
(% of population aged 20-64)67.6 67.3 67.2 67.2 67.3 67.2
Employment growth
(% change from previous year)0.6 1.4 0.4 -0.4 0.3 0.7
Employment rate of women
(% of female population aged 20-64)61.6 61.5 61.7 62.1 62.9 62.9
Employment rate of men
(% of male population aged 20-64)73.5 73.0 72.7 72.3 71.6 71.4
Employment rate of older workers
(% of population aged 55-64)37.3 38.7 39.5 41.7 42.7 43.8
Part-time employment (% of total employment,
aged 15 years and over)24.0 25.1 25.1 24.7 24.1 24.8
Fixed term employment (% of employees with a fixed term
contract, aged 15 years and over)8.1 9.0 8.1 8.2 8.7 9.1
Transitions from temporary to permanent employment 36.1 32.5 43.2 38.2 33.4 -
Unemployment rate(1)
(% active population,
age group 15-74)8.3 7.2 7.6 8.4 8.5 8.5
Long-term unemployment rate(2)
(% of labour force) 4.1 3.5 3.4 3.9 4.3 4.4
Youth unemployment rate
(% active population aged 15-24)22.4 18.7 19.8 23.7 23.2 21.9
Youth NEET(3)
rate (% of population aged 15-24) 10.9 11.8 12.3 12.7 12.0 -
Early leavers from education and training (% of pop. aged 18-24
with at most lower sec. educ. and not in further education or
training)
11.9 12.3 12.0 11.0 9.8 -
Tertiary educational attainment (% of population aged 30-34
having successfully completed tertiary education)44.4 42.6 43.9 42.7 43.8 -
Formal childcare (30 hours or over; % of population aged less
than 3 years)19.0 20.0 27.0 25.0 - -

C. Standard Tables
67
Table C.3: Labour market and social indicators (continued)
(1) People at risk of poverty or social exclusion (AROPE): individuals who are at risk of poverty (AROP) and/or suffering from
severe material deprivation (SMD) and/or living in households with zero or very low work intensity (LWI).
(2) At-risk-of-poverty rate (AROP): proportion of people with an equivalised disposable income below 60 % of the national
equivalised median income.
(3) Proportion of people who experience at least four of the following forms of deprivation: not being able to afford to i)
pay their rent or utility bills, ii) keep their home warm enough, iii) cope with unexpected expenses, iv) eat meat, fish or a
protein equivalent every second day, v) enjoy a week of holiday away from home once a year, vi) have a car, vii) have a
washing machine, viii) have a colour TV, or ix) have a telephone.
(4) People living in households with very low work intensity: proportion of people aged 0-59 living in households where the
adults (excluding dependent children) worked less than 20 % of their total work-time potential in the previous 12 months.
(5) For EE, CY, MT, SI and SK, thresholds in nominal values in euros; harmonised index of consumer prices (HICP) = 100 in 2006
(2007 survey refers to 2006 incomes).
Source: For expenditure for social protection benefits ESSPROS; for social inclusion EU-SILC.
Expenditure on social protection benefits (% of GDP) 2009 2010 2011 2012 2013 2014
Sickness/healthcare 8.1 8.0 8.1 8.3 8.3 -
Invalidity 2.1 2.1 2.1 2.2 2.4 -
Old age and survivors 11.4 11.0 11.3 11.3 11.7 -
Family/children 2.3 2.2 2.2 2.1 2.2 -
Unemployment 3.7 3.7 3.6 3.6 3.4 -
Housing and social exclusion n.e.c. 0.2 0.2 0.2 0.2 0.2 -
Total 28.5 27.9 28.4 28.6 28.9 -
of which: means-tested benefits 1.5 1.4 1.4 1.5 1.6 -
Social inclusion indicators 2009 2010 2011 2012 2013 2014
People at risk of poverty or social exclusion(1)
(% of total population)20.2 20.8 21.0 21.6 20.8 21.2
Children at risk of poverty or social exclusion
(% of people aged 0-17)20.5 23.2 23.3 22.8 21.9 23.2
At-risk-of-poverty rate(2)
(% of total population) 14.6 14.6 15.3 15.3 15.1 15.5
Severe material deprivation rate(3)
(% of total population) 5.2 5.9 5.7 6.3 5.1 5.9
Proportion of people living in low work intensity households(4)
(% of people aged 0-59)12.3 12.7 13.8 13.9 14.0 14.6
In-work at-risk-of-poverty rate (% of persons employed) 4.6 4.5 4.2 4.5 4.4 4.8
Impact of social transfers (excluding pensions) on reducing
poverty45.3 45.3 45.0 44.8 42.6 43.6
Poverty thresholds, expressed in national currency at constant
prices(5) 10892 10977 11029 10815 11163 11140
Gross disposable income (households; growth %) 1.8 0.7 2.0 2.6 0.5 1.1
Inequality of income distribution (S80/S20 income quintile
share ratio)3.9 3.9 3.9 4.0 3.8 3.8

C. Standard Tables
68
Table C.4: Structural policy and business environment indicators
(1) The methodologies, including the assumptions, underpinning this indicator are shown in detail here:
http://www.doingbusiness.org/methodology.
(2) Average of the answer to question Q7B_a. ‘[Bank loan]: If you applied and tried to negotiate for th is type of financing
over the past six months, what was the outcome?’ Answers were codified as follows: zero if the respondent received
everything they applied for, one if they received most of it, two if they received only a limited part of it, three if their
application was refused or rejected. Responses to the effect that the application is still pending, or that the respondent
doesn't know the answer, are treated as missing values.
(3) Percentage of the population aged 15-64 having completed tertiary education.
(4) Percentage of the population aged 20-24 having attained at least upper secondary education.
(5) Index: 0 = not regulated; 6 = most regulated. The methodologies underpinning the OECD product market regulation
indicators are shown in detail here:
http://www.oecd.org/competition/reform/indicatorsofproductmarketregulationhomepage.htm
(6) Aggregate OECD indicators of regulation in energy, transport and communications (ETCR).
Source: European Commission; World Bank — Doing Business (for enforcing contracts and time needed to start a business);
OECD (for the product market regulation indicators); SAFE (for outcome of SMEs' applications for bank loans).
Performance indicators 2009 2010 2011 2012 2013 2014
Labour productivity (real, per person employed, y-o-y)
Labour productivity in industry 0.25 6.86 -0.32 -0.05 2.93 3.61
Labour productivity in construction 2.86 0.47 -1.69 1.50 0.37 1.63
Labour productivity in market services -1.65 1.74 0.22 -1.16 0.01 0.38
Unit labour costs (ULC) (whole economy, y-o-y)
ULC in industry 1.77 -5.56 2.82 3.87 0.06 -1.46
ULC in construction 1.56 -0.14 1.36 1.40 1.10 -2.41
ULC in market services 3.59 -0.62 1.46 3.70 1.83 0.14
Business environment 2009 2010 2011 2012 2013 2014
Time needed to enforce contracts(1)
(days) 505 505 505 505 505 505
Time needed to start a business(1)
(days) 4.0 4.0 4.0 4.0 4.0 4.0
Outcome of applications by SMEs for bank loans(2) 0.29 0.45 0.48 0.68 0.54 0.36
Research and innovation 2009 2010 2011 2012 2013 2014
R&D intensity 1.98 2.05 2.15 2.36 2.42 2.46
Total public expenditure on education as % of GDP, for all levels of
education combined6.57 6.58 6.55 6.60 na na
Number of science & technology people employed as % of total
employment48 50 50 50 50 52
Population having completed tertiary education(3) 29 31 30 31 32 33
Young people with upper secondary level education(4) 83 83 82 83 83 84
Trade balance of high technology products as % of GDP 0.20 0.37 0.22 0.14 0.33 0.51
Product and service markets and competition 2003 2008 2013
OECD product market regulation (PMR)(5)
, overall 1.64 1.52 1.39
OECD PMR(5)
, retail 4.68 4.56 4.06
OECD PMR(5)
, professional services 2.52 2.47 2.47
OECD PMR(5)
, network industries(6) 2.84 2.08 1.84

C. Standard Tables
69
Table C.5: Green growth
All macro intensity indicators are expressed as a ratio of a physical quantity to GDP (in 2005 prices)
Energy intensity: gross inland energy consumption (in kgoe) divided by GDP (in EUR)
Carbon intensity: greenhouse gas emissions (in kg CO2 equivalents) divided by GDP (in EUR)
Resource intensity: domestic material consumption (in kg) divided by GDP (in EUR)
Waste intensity: waste (in kg) divided by GDP (in EUR)
Energy balance of trade: the balance of energy exports and imports, expressed as % of GDP
Weighting of energy in HICP: the proportion of "energy" items in the consumption basket used for the construction of the
HICP.
Difference between energy price change and inflation: energy component of HICP, and total HICP inflation (annual %
change).
Real unit energy cost: real energy costs as a percentage of total value added for the economy .
Environmental taxes and labour taxes: from European Commission, ‘Taxation trends in the European Union’
Industry energy intensity: final energy consumption of industry (in kgoe) divided by gross value added of industry (in 2005
EUR).
Real unit energy costs for manufacturing industry: real costs as a percentage of value added for manufacturing sectors.
Share of energy-intensive industries in the economy: share of gross value added of the energy-intensive industries in GDP.
Electricity and gas prices for medium-sized industrial users: consumption band 500–20 00MWh and 10 000–100 000 GJ; figures
excl. VAT.
Municipal waste recycling rate: ratio of recycled municipal waste to total municipal waste.
Public R&D for energy or for the environment: government spending on R&D (GBAORD) for these categories as % of GDP.
Proportion of greenhouse gas (GHG) emissions covered by EU Emission Trading System (ETS): based on greenhouse gas
emissions (excl. land use, land use change and forestry) as reported by Member States to the European Environment
Agency Transport energy intensity: final energy consumption of transport activity (kgoe) divided by transport industry gross
value added (in 2005 EUR).
Transport carbon intensity: greenhouse gas emissions in transport activity divided by gross value added of the transport
sector.
Energy import dependency: net energy imports divided by gross inland energy consumption incl. consumption of
international bunker fuels.
Aggregated supplier concentration index: covers oil, gas and coal. Smaller values indicate larger diversification and hence
lower risk.
Diversification of the energy mix: Herfindahl index over natural gas, total petrol products, nuclear heat, renewable energies
and solid fuels.
* European Commission and European Environment Agency
Source: European Commission (Eurostat) unless indicated otherwise
Green growth performance 2009 2010 2011 2012 2013 2014
Macroeconomic
Energy intensity kgoe / € 0.18 0.19 0.18 0.17 0.17 -
Carbon intensity kg / € 0.39 0.40 0.36 0.35 0.35 -
Resource intensity (reciprocal of resource productivity) kg / € 0.50 0.49 0.51 0.46 0.45 0.46
Waste intensity kg / € - 0.19 - 0.20 - -
Energy balance of trade % GDP -3.2 -3.7 -4.6 -5.0 -4.5 -3.9
Weighting of energy in HICP % 10.90 11.24 11.02 11.71 11.29 10.91
Difference between energy price change and inflation % -12.9 4.7 14.6 3.3 -5.8 -8.0
Real unit of energy cost % of value added 12.8 14.9 16.7 - - -
Ratio of labour taxes to environmental taxes ratio 10.9 10.7 10.6 11.2 11.8 11.8
Environmental taxes % GDP 2.2 2.2 2.2 2.1 2.1 2.1
Sectoral
Industry energy intensity kgoe / € 0.20 0.23 0.23 0.21 0.21 -
Real unit energy cost for manufacturing industry % of value added 54.1 64.2 75.4 - - -
Share of energy-intensive industries in the economy % GDP 11.19 12.03 11.85 11.61 12.33 12.43
Electricity prices for medium-sized industrial users € / kWh 0.11 0.11 0.11 0.11 0.11 0.11
Gas prices for medium-sized industrial users € / kWh 0.03 0.03 0.03 0.03 0.04 0.03
Public R&D for energy % GDP 0.01 0.01 0.01 0.01 0.01 0.01
Public R&D for environment % GDP 0.02 0.02 0.01 0.01 0.01 0.01
Municipal waste recycling rate % 95.8 97.4 96.8 96.0 98.3 -
Share of GHG emissions covered by ETS* % 37.5 38.4 38.4 37.0 37.9 38.0
Transport energy intensity kgoe / € 0.60 0.60 0.58 0.55 0.56 -
Transport carbon intensity kg / € 1.57 1.54 1.48 1.38 1.41 -
Security of energy supply
Energy import dependency % 75.5 78.0 75.8 76.1 77.5 -
Aggregated supplier concentration index HHI 16.0 16.4 22.0 13.7 17.3 -
Diversification of energy mix HHI 0.29 0.29 0.28 0.27 0.27 -