![[XLS]seekingalpha.com · Web view2016/08/08 · HD SUPPLY HOLDINGS INC HDS HOME BANCORP INC HBCP HEADWATERS INC HW HOME BANCSHARES INC HOMB HEALTHCARE REALTY TRUST HR HOME DEPOT INC](https://static.fdocuments.net/doc/165x107/5b1e7c767f8b9af1328b87e9/xls-web-view20160808-hd-supply-holdings-inc-hds-home-bancorp-inc-hbcp.jpg)
THIRD QUARTER 2017 REPORT - Healthcare Trust Inc · As of September 30, 2017, Healthcare Trust,...
2
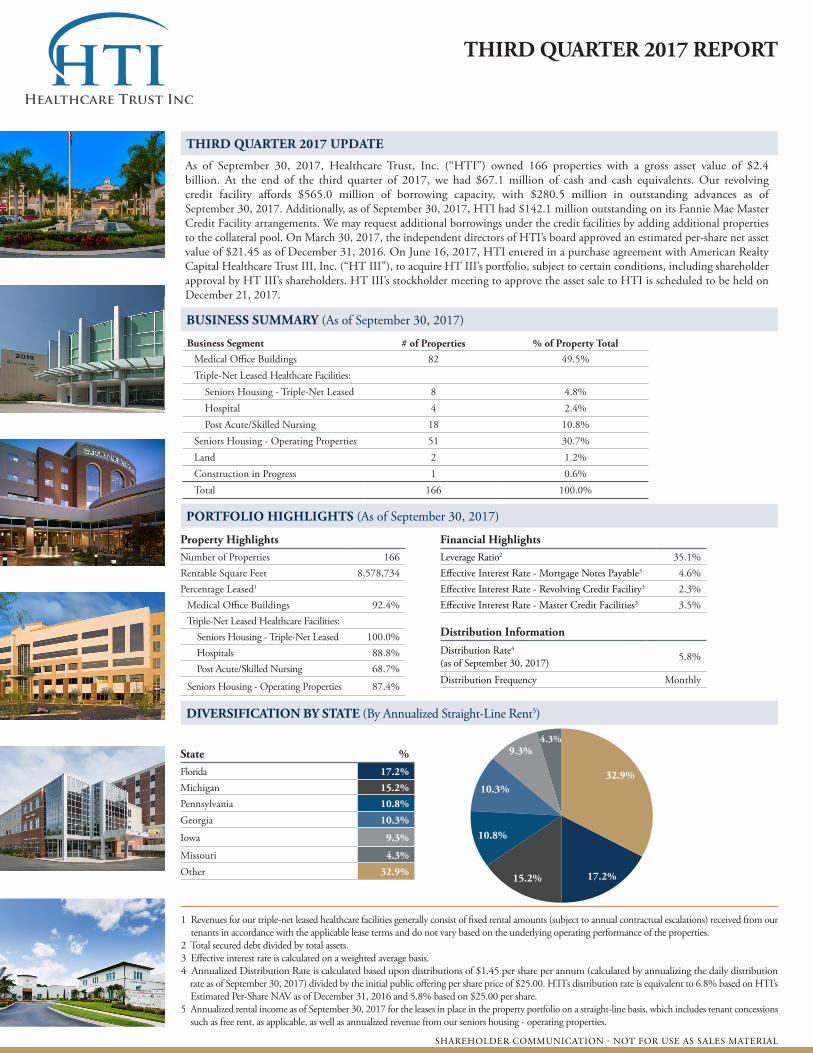
As of September 30, 2017, Healthcare Trust, Inc. (“HTI”) owned 166 properties with a gross asset value of $2.4 billion. At the end of the third quarter of 2017, we had $67.1 million of cash and cash equivalents. Our revolving credit facility affords $565.0 million of borrowing capacity, with $280.5 million in outstanding advances as of September 30, 2017. Additionally, as of September 30, 2017, HTI had $142.1 million outstanding on its Fannie Mae Master Credit Facility arrangements. We may request additional borrowings under the credit facilities by adding additional properties to the collateral pool. On March 30, 2017, the independent directors of HTI’s board approved an estimated per-share net asset value of $21.45 as of December 31, 2016. On June 16, 2017, HTI entered in a purchase agreement with American Realty Capital Healthcare Trust III, Inc. (“HT III”), to acquire HT III’s portfolio, subject to certain conditions, including shareholder approval by HT III’s shareholders. HT III’s stockholder meeting to approve the asset sale to HTI is scheduled to be held on December 21, 2017. THIRD QUARTER 2017 UPDATE BUSINESS SUMMARY (As of September 30, 2017) PORTFOLIO HIGHLIGHTS (As of September 30, 2017) DIVERSIFICATION BY STATE (By Annualized Straight-Line Rent 5 ) Business Segment # of Properties % of Property Total Medical Office Buildings 82 49.5% Triple-Net Leased Healthcare Facilities: Seniors Housing - Triple-Net Leased 8 4.8% Hospital 4 2.4% Post Acute/Skilled Nursing 18 10.8% Seniors Housing - Operating Properties 51 30.7% Land 2 1.2% Construction in Progress 1 0.6% Total 166 100.0% Property Highlights Number of Properties 166 Rentable Square Feet 8,578,734 Percentage Leased 1 Medical Office Buildings 92.4% Triple-Net Leased Healthcare Facilities: Seniors Housing - Triple-Net Leased 100.0% Hospitals 88.8% Post Acute/Skilled Nursing 68.7% Seniors Housing - Operating Properties 87.4% Financial Highlights Leverage Ratio 2 35.1% Effective Interest Rate - Mortgage Notes Payable 3 4.6% Effective Interest Rate - Revolving Credit Facility 3 2.3% Effective Interest Rate - Master Credit Facilities 3 3.5% State % Florida 17.2% Michigan 15.2% Pennsylvania 10.8% Georgia 10.3% Iowa 9.3% Missouri 4.3% Other 32.9% 32.9% 4.3% 17.2% 15.2% 10.8% 10.3% 9.3% Distribution Information Distribution Rate 4 (as of September 30, 2017) 5.8% Distribution Frequency Monthly 1 Revenues for our triple-net leased healthcare facilities generally consist of fixed rental amounts (subject to annual contractual escalations) received from our tenants in accordance with the applicable lease terms and do not vary based on the underlying operating performance of the properties. 2 Total secured debt divided by total assets. 3 Effective interest rate is calculated on a weighted average basis. 4 Annualized Distribution Rate is calculated based upon distributions of $1.45 per share per annum (calculated by annualizing the daily distribution rate as of September 30, 2017) divided by the initial public offering per share price of $25.00. HTI’s distribution rate is equivalent to 6.8% based on HTI’s Estimated Per-Share NAV as of December 31, 2016 and 5.8% based on $25.00 per share. 5 Annualized rental income as of September 30, 2017 for the leases in place in the property portfolio on a straight-line basis, which includes tenant concessions such as free rent, as applicable, as well as annualized revenue from our seniors housing - operating properties. SHAREHOLDER COMMUNICATION - NOT FOR USE AS SALES MATERIAL THIRD QUARTER 2017 REPORT
Transcript of THIRD QUARTER 2017 REPORT - Healthcare Trust Inc · As of September 30, 2017, Healthcare Trust,...
As of September 30, 2017, Healthcare Trust, Inc. (“HTI”) owned 166 properties with a gross asset value of $2.4 billion. At the end of the third quarter of 2017, we had $67.1 million of cash and cash equivalents. Our revolving credit facility affords $565.0 million of borrowing capacity, with $280.5 million in outstanding advances as of September 30, 2017. Additionally, as of September 30, 2017, HTI had $142.1 million outstanding on its Fannie Mae Master Credit Facility arrangements. We may request additional borrowings under the credit facilities by adding additional properties to the collateral pool. On March 30, 2017, the independent directors of HTI’s board approved an estimated per-share net asset value of $21.45 as of December 31, 2016. On June 16, 2017, HTI entered in a purchase agreement with American Realty Capital Healthcare Trust III, Inc. (“HT III”), to acquire HT III’s portfolio, subject to certain conditions, including shareholder approval by HT III’s shareholders. HT III’s stockholder meeting to approve the asset sale to HTI is scheduled to be held on December 21, 2017.
THIRD QUARTER 2017 UPDATE
BUSINESS SUMMARY (As of September 30, 2017)
PORTFOLIO HIGHLIGHTS (As of September 30, 2017)
DIVERSIFICATION BY STATE (By Annualized Straight-Line Rent5)
Business Segment # of Properties % of Property TotalMedical Office Buildings 82 49.5%Triple-Net Leased Healthcare Facilities: Seniors Housing - Triple-Net Leased 8 4.8% Hospital 4 2.4% Post Acute/Skilled Nursing 18 10.8%Seniors Housing - Operating Properties 51 30.7%Land 2 1.2%Construction in Progress 1 0.6%Total 166 100.0%
Property HighlightsNumber of Properties 166Rentable Square Feet 8,578,734Percentage Leased1
Medical Office Buildings 92.4%Triple-Net Leased Healthcare Facilities: Seniors Housing - Triple-Net Leased 100.0% Hospitals 88.8% Post Acute/Skilled Nursing 68.7%
Seniors Housing - Operating Properties 87.4%
Financial HighlightsLeverage Ratio2 35.1%Effective Interest Rate - Mortgage Notes Payable3 4.6%Effective Interest Rate - Revolving Credit Facility3 2.3%Effective Interest Rate - Master Credit Facilities3 3.5%
State %Florida 17.2%
Michigan 15.2%
Pennsylvania 10.8%
Georgia 10.3%
Iowa 9.3%
Missouri 4.3%
Other 32.9%
32.9%
4.3%
17.2%15.2%
10.8%
10.3%
9.3%
Distribution Information
Distribution Rate4
(as of September 30, 2017) 5.8%
Distribution Frequency Monthly
1 Revenues for our triple-net leased healthcare facilities generally consist of fixed rental amounts (subject to annual contractual escalations) received from our tenants in accordance with the applicable lease terms and do not vary based on the underlying operating performance of the properties.
2 Total secured debt divided by total assets. 3 Effective interest rate is calculated on a weighted average basis. 4 Annualized Distribution Rate is calculated based upon distributions of $1.45 per share per annum (calculated by annualizing the daily distribution rate as of September 30, 2017) divided by the initial public offering per share price of $25.00. HTI’s distribution rate is equivalent to 6.8% based on HTI’s Estimated Per-Share NAV as of December 31, 2016 and 5.8% based on $25.00 per share.5 Annualized rental income as of September 30, 2017 for the leases in place in the property portfolio on a straight-line basis, which includes tenant concessions such as free rent, as applicable, as well as annualized revenue from our seniors housing - operating properties.
SHAREHOLDER COMMUNICATION - NOT FOR USE AS SALES MATERIAL
THIRD QUARTER 2017 REPORT
PROPERTY AT A GLANCE
Address 3755 Peachtree Road NE Atlanta, GA 30319
Net Leasable Area 323,352 rentable square feet
Acquisition Date December 15, 2015
Property Type Senior Housing Property
Percentage Occupied 95%
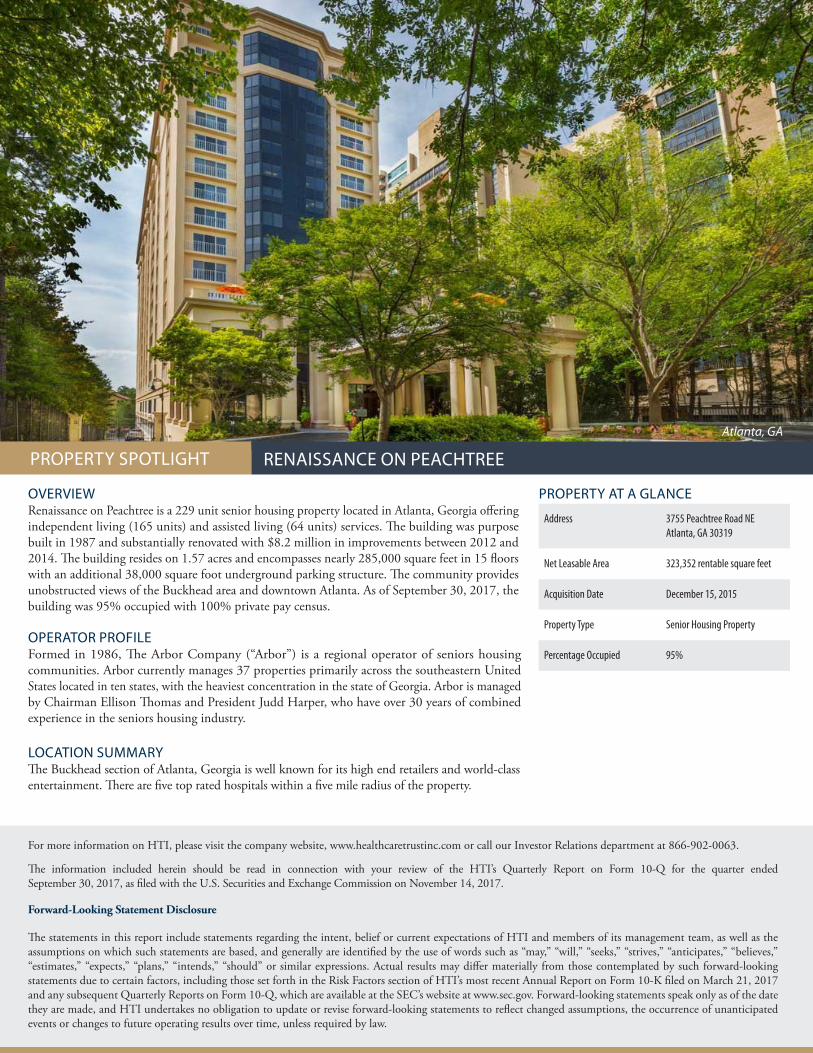
OVERVIEWRenaissance on Peachtree is a 229 unit senior housing property located in Atlanta, Georgia offering independent living (165 units) and assisted living (64 units) services. The building was purpose built in 1987 and substantially renovated with $8.2 million in improvements between 2012 and 2014. The building resides on 1.57 acres and encompasses nearly 285,000 square feet in 15 floors with an additional 38,000 square foot underground parking structure. The community provides unobstructed views of the Buckhead area and downtown Atlanta. As of September 30, 2017, the building was 95% occupied with 100% private pay census.
PROPERTY SPOTLIGHT RENAISSANCE ON PEACHTREE
Atlanta, GA
LOCATION SUMMARYThe Buckhead section of Atlanta, Georgia is well known for its high end retailers and world-class entertainment. There are five top rated hospitals within a five mile radius of the property.
OPERATOR PROFILEFormed in 1986, The Arbor Company (“Arbor”) is a regional operator of seniors housing communities. Arbor currently manages 37 properties primarily across the southeastern United States located in ten states, with the heaviest concentration in the state of Georgia. Arbor is managed by Chairman Ellison Thomas and President Judd Harper, who have over 30 years of combined experience in the seniors housing industry.
For more information on HTI, please visit the company website, www.healthcaretrustinc.com or call our Investor Relations department at 866-902-0063.
The information included herein should be read in connection with your review of the HTI’s Quarterly Report on Form 10-Q for the quarter ended September 30, 2017, as filed with the U.S. Securities and Exchange Commission on November 14, 2017.
Forward-Looking Statement Disclosure
The statements in this report include statements regarding the intent, belief or current expectations of HTI and members of its management team, as well as the assumptions on which such statements are based, and generally are identified by the use of words such as “may,” “will,” “seeks,” “strives,” “anticipates,” “believes,” “estimates,” “expects,” “plans,” “intends,” “should” or similar expressions. Actual results may differ materially from those contemplated by such forward-looking statements due to certain factors, including those set forth in the Risk Factors section of HTI’s most recent Annual Report on Form 10-K filed on March 21, 2017 and any subsequent Quarterly Reports on Form 10-Q, which are available at the SEC’s website at www.sec.gov. Forward-looking statements speak only as of the date they are made, and HTI undertakes no obligation to update or revise forward-looking statements to reflect changed assumptions, the occurrence of unanticipated events or changes to future operating results over time, unless required by law.