The Gabelli Equity Trust Inc. - GAMCO Investors The Gabelli Equity Trust Inc.
36
(Y)our Portfolio Management Team Mario J. Gabelli, CFA Chief Investment Officer Christopher J. Marangi Co-Chief Investment Officer BA, Williams College MBA, Columbia Business School Kevin V. Dreyer Co-Chief Investment Officer BSE, University of Pennsylvania MBA, Columbia Business School Robert D. Leininger, CFA Portfolio Manager BA, Amherst College MBA, Wharton School, University of Pennsylvania Daniel M. Miller Managing Director, GAMCO Investors BS, University of Miami To Our Shareholders, For the year ended December 31, 2017, the net asset value (“NAV”) total return of The Gabelli Equity Trust Inc. (the “Fund”) was 24.6%, compared with total returns of 21.8% and 28.1% for the Standard & Poor’s (“S&P”) 500 Index and the Dow Jones Industrial Average, respectively. The total return for the Fund’s publicly traded shares was 24.6%. The Fund’s NAV per share was $6.47, while the price of the publicly traded shares closed at $6.19 on the New York Stock Exchange (“NYSE”). See below for additional performance information. Enclosed are the financial statements, including the schedule of investments, as of December 31, 2017. Comparative Results Average Annual Returns through December 31, 2017 (a) (Unaudited) 1 Year 5 Year 10 Year 15 Year 20 Year 25 Year Since Inception (08/21/86) Gabelli Equity Trust NAV Total Return (b) ..................... 24.64% 14.41% 8.11% 12.19% 9.31% 10.61% 11.05% Investment Total Return (c) ................ 24.65 13.56 7.54 11.08 8.80 10.40 10.61 S&P 500 Index ........................... 21.83 15.79 8.50 9.92 7.20 9.69 10.29(d) Dow Jones Industrial Average ................. 28.07 16.31 9.24 10.24 8.35 10.96 11.38(d) Nasdaq Composite Index .................... 29.80 19.50 11.35 12.81 8.67 9.73 10.00(e) (a) Returns represent past performance and do not guarantee future results. Investment returns and the principal value of an investment will fluctuate. When shares are sold, they may be worth more or less than their original cost. Current performance may be lower or higher than the performance data presented. Visit www.gabelli.com for performance information as of the most recent month end. Investors should carefully consider the investment objectives, risks, charges, and expenses of the Fund before investing. The Dow Jones Industrial Average is an unmanaged index of 30 large capitalization stocks. The S&P 500 and the Nasdaq Composite Indices are unmanaged indicators of stock market performance. Dividends are considered reinvested except for the Nasdaq Composite Index. You cannot invest directly in an index. (b) Total returns and average annual returns reflect changes in the NAV per share, reinvestment of distributions at NAV on the ex-dividend date, adjustments for rights offerings, spin-offs, and taxes paid on undistributed long term capital gains and are net of expenses. Since inception return is based on an initial NAV of $9.34. (c) Total returns and average annual returns reflect changes in closing market values on the NYSE, reinvestment of distributions, and adjustments for rights offerings, spin-offs, and taxes paid on undistributed long term capital gains. Since inception return is based on an initial offering price of $10.00. (d) From August 31, 1986, the date closest to the Fund’s inception for which data are available. (e) From September 30, 1986, the date closest to the Fund’s inception for which data are available. The Gabelli Equity Trust Inc. Annual Report — December 31, 2017
Transcript of The Gabelli Equity Trust Inc. - GAMCO Investors The Gabelli Equity Trust Inc.

(Y)our Portfolio Management Team
Mario J. Gabelli, CFAChief Investment Officer
Christopher J. MarangiCo-Chief Investment Officer
BA, Williams CollegeMBA, ColumbiaBusiness School
Kevin V. DreyerCo-Chief Investment Officer
BSE, University ofPennsylvania
MBA, ColumbiaBusiness School
Robert D. Leininger, CFAPortfolio Manager
BA, Amherst CollegeMBA, Wharton School,
University of Pennsylvania
Daniel M. MillerManaging Director,GAMCO Investors
BS, University of Miami
To Our Shareholders,For the year ended December 31, 2017, the net asset value (“NAV”) total return of The Gabelli Equity Trust Inc. (the
“Fund”) was 24.6%, compared with total returns of 21.8% and 28.1% for the Standard & Poor’s (“S&P”) 500 Index and theDow Jones Industrial Average, respectively. The total return for the Fund’s publicly traded shares was 24.6%. The Fund’s NAVper share was $6.47, while the price of the publicly traded shares closed at $6.19 on the New York Stock Exchange (“NYSE”).See below for additional performance information.
Enclosed are the financial statements, including the schedule of investments, as of December 31, 2017.
Comparative Results
Average Annual Returns through December 31, 2017 (a) (Unaudited)
1 Year 5 Year 10 Year 15 Year 20 Year 25 Year
SinceInception(08/21/86)
Gabelli Equity TrustNAV Total Return (b) . . . . . . . . . . . . . . . . . . . . . 24.64% 14.41% 8.11% 12.19% 9.31% 10.61% 11.05%Investment Total Return (c) . . . . . . . . . . . . . . . . 24.65 13.56 7.54 11.08 8.80 10.40 10.61
S&P 500 Index . . . . . . . . . . . . . . . . . . . . . . . . . . . 21.83 15.79 8.50 9.92 7.20 9.69 10.29(d)Dow Jones Industrial Average . . . . . . . . . . . . . . . . . 28.07 16.31 9.24 10.24 8.35 10.96 11.38(d)Nasdaq Composite Index . . . . . . . . . . . . . . . . . . . . 29.80 19.50 11.35 12.81 8.67 9.73 10.00(e)(a) Returns represent past performance and do not guarantee future results. Investment returns and the principal value of an investment will fluctuate.
When shares are sold, they may be worth more or less than their original cost. Current performance may be lower or higher than the performancedata presented. Visit www.gabelli.com for performance information as of the most recent month end. Investors should carefully consider theinvestment objectives, risks, charges, and expenses of the Fund before investing. The Dow Jones Industrial Average is an unmanaged index of 30large capitalization stocks. The S&P 500 and the Nasdaq Composite Indices are unmanaged indicators of stock market performance. Dividends areconsidered reinvested except for the Nasdaq Composite Index. You cannot invest directly in an index.
(b) Total returns and average annual returns reflect changes in the NAV per share, reinvestment of distributions at NAV on the ex-dividend date,adjustments for rights offerings, spin-offs, and taxes paid on undistributed long term capital gains and are net of expenses. Since inception return isbased on an initial NAV of $9.34.
(c) Total returns and average annual returns reflect changes in closing market values on the NYSE, reinvestment of distributions, and adjustments forrights offerings, spin-offs, and taxes paid on undistributed long term capital gains. Since inception return is based on an initial offering price of$10.00.
(d) From August 31, 1986, the date closest to the Fund’s inception for which data are available.(e) From September 30, 1986, the date closest to the Fund’s inception for which data are available.
The Gabelli Equity Trust Inc.Annual Report — December 31, 2017
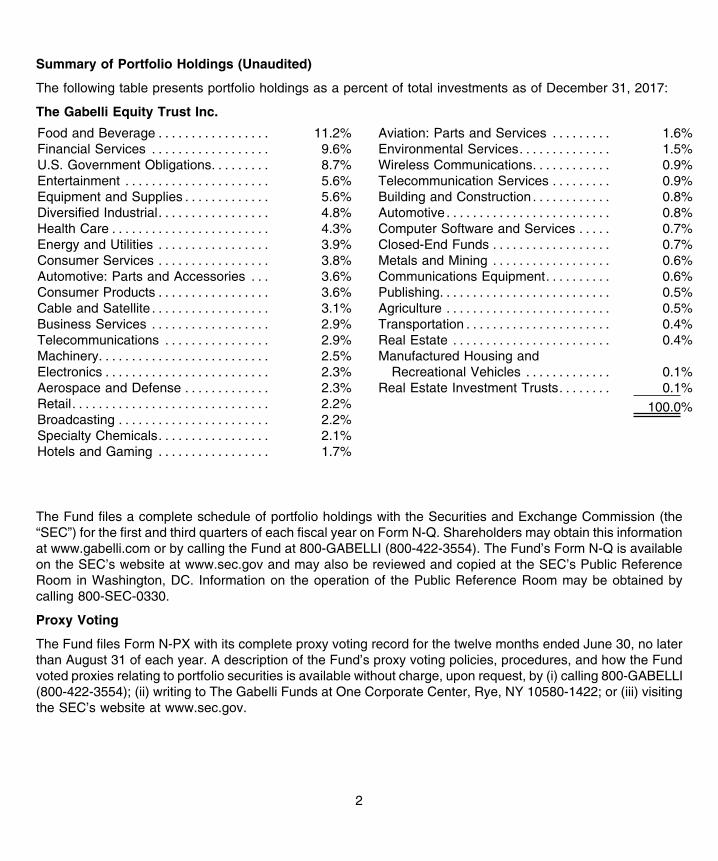
The following table presents portfolio holdings as a percent of total investments as of December 31, 2017:
The Gabelli Equity Trust Inc.
Food and Beverage . . . . . . . . . . . . . . . . . 11.2%Financial Services . . . . . . . . . . . . . . . . . . 9.6%U.S. Government Obligations. . . . . . . . . 8.7%Entertainment . . . . . . . . . . . . . . . . . . . . . . 5.6%Equipment and Supplies . . . . . . . . . . . . . 5.6%Diversified Industrial. . . . . . . . . . . . . . . . . 4.8%Health Care . . . . . . . . . . . . . . . . . . . . . . . . 4.3%Energy and Utilities . . . . . . . . . . . . . . . . . 3.9%Consumer Services . . . . . . . . . . . . . . . . . 3.8%Automotive: Parts and Accessories . . . 3.6%Consumer Products . . . . . . . . . . . . . . . . . 3.6%Cable and Satellite . . . . . . . . . . . . . . . . . . 3.1%Business Services . . . . . . . . . . . . . . . . . . 2.9%Telecommunications . . . . . . . . . . . . . . . . 2.9%Machinery. . . . . . . . . . . . . . . . . . . . . . . . . . 2.5%Electronics . . . . . . . . . . . . . . . . . . . . . . . . . 2.3%Aerospace and Defense . . . . . . . . . . . . . 2.3%Retail. . . . . . . . . . . . . . . . . . . . . . . . . . . . . . 2.2%Broadcasting . . . . . . . . . . . . . . . . . . . . . . . 2.2%Specialty Chemicals. . . . . . . . . . . . . . . . . 2.1%Hotels and Gaming . . . . . . . . . . . . . . . . . 1.7%
Aviation: Parts and Services . . . . . . . . . 1.6%Environmental Services. . . . . . . . . . . . . . 1.5%Wireless Communications. . . . . . . . . . . . 0.9%Telecommunication Services . . . . . . . . . 0.9%Building and Construction . . . . . . . . . . . . 0.8%Automotive . . . . . . . . . . . . . . . . . . . . . . . . . 0.8%Computer Software and Services . . . . . 0.7%Closed-End Funds . . . . . . . . . . . . . . . . . . 0.7%Metals and Mining . . . . . . . . . . . . . . . . . . 0.6%Communications Equipment. . . . . . . . . . 0.6%Publishing. . . . . . . . . . . . . . . . . . . . . . . . . . 0.5%Agriculture . . . . . . . . . . . . . . . . . . . . . . . . . 0.5%Transportation . . . . . . . . . . . . . . . . . . . . . . 0.4%Real Estate . . . . . . . . . . . . . . . . . . . . . . . . 0.4%Manufactured Housing and
Recreational Vehicles . . . . . . . . . . . . . 0.1%Real Estate Investment Trusts. . . . . . . . 0.1%
100.0%
The Fund files a complete schedule of portfolio holdings with the Securities and Exchange Commission (the“SEC”) for the first and third quarters of each fiscal year on Form N-Q. Shareholders may obtain this informationat www.gabelli.com or by calling the Fund at 800-GABELLI (800-422-3554). The Fund’s Form N-Q is availableon the SEC’s website at www.sec.gov and may also be reviewed and copied at the SEC’s Public ReferenceRoom in Washington, DC. Information on the operation of the Public Reference Room may be obtained bycalling 800-SEC-0330.
Proxy Voting
The Fund files Form N-PX with its complete proxy voting record for the twelve months ended June 30, no laterthan August 31 of each year. A description of the Fund’s proxy voting policies, procedures, and how the Fundvoted proxies relating to portfolio securities is available without charge, upon request, by (i) calling 800-GABELLI(800-422-3554); (ii) writing to The Gabelli Funds at One Corporate Center, Rye, NY 10580-1422; or (iii) visitingthe SEC’s website at www.sec.gov.
Summary of Portfolio Holdings (Unaudited)
2
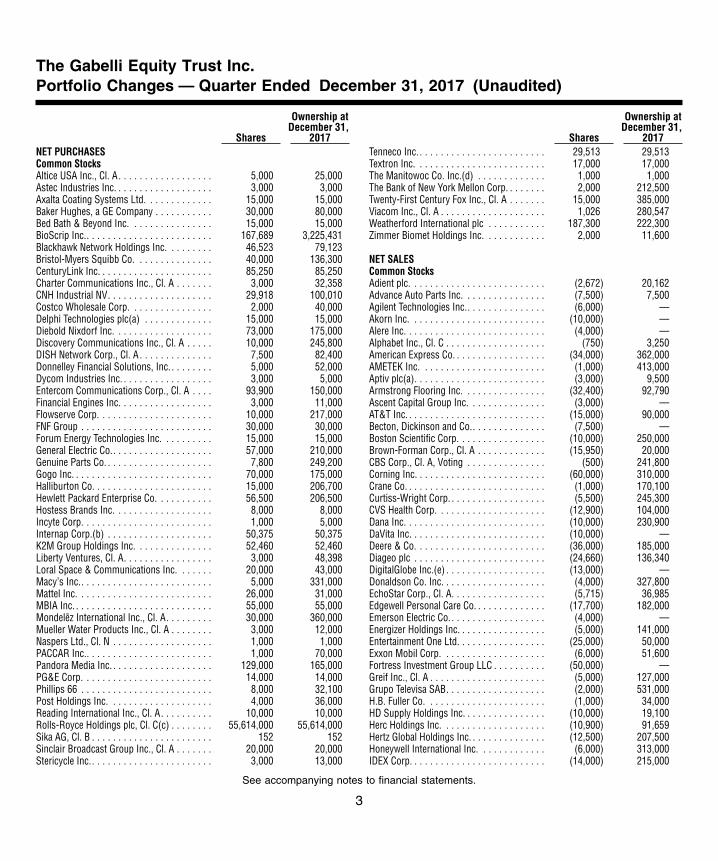
Shares
Ownership atDecember 31,
2017NET PURCHASESCommon StocksAltice USA Inc., Cl. A. . . . . . . . . . . . . . . . . . 5,000 25,000Astec Industries Inc. . . . . . . . . . . . . . . . . . . 3,000 3,000Axalta Coating Systems Ltd. . . . . . . . . . . . . 15,000 15,000Baker Hughes, a GE Company . . . . . . . . . . . 30,000 80,000Bed Bath & Beyond Inc. . . . . . . . . . . . . . . . 15,000 15,000BioScrip Inc.. . . . . . . . . . . . . . . . . . . . . . . . 167,689 3,225,431Blackhawk Network Holdings Inc. . . . . . . . . 46,523 79,123Bristol-Myers Squibb Co. . . . . . . . . . . . . . . 40,000 136,300CenturyLink Inc. . . . . . . . . . . . . . . . . . . . . . 85,250 85,250Charter Communications Inc., Cl. A . . . . . . . 3,000 32,358CNH Industrial NV. . . . . . . . . . . . . . . . . . . . 29,918 100,010Costco Wholesale Corp. . . . . . . . . . . . . . . . 2,000 40,000Delphi Technologies plc(a) . . . . . . . . . . . . . 15,000 15,000Diebold Nixdorf Inc. . . . . . . . . . . . . . . . . . . 73,000 175,000Discovery Communications Inc., Cl. A . . . . . 10,000 245,800DISH Network Corp., Cl. A . . . . . . . . . . . . . . 7,500 82,400Donnelley Financial Solutions, Inc. . . . . . . . . 5,000 52,000Dycom Industries Inc. . . . . . . . . . . . . . . . . . 3,000 5,000Entercom Communications Corp., Cl. A . . . . 93,900 150,000Financial Engines Inc. . . . . . . . . . . . . . . . . . 3,000 11,000Flowserve Corp. . . . . . . . . . . . . . . . . . . . . . 10,000 217,000FNF Group . . . . . . . . . . . . . . . . . . . . . . . . . 30,000 30,000Forum Energy Technologies Inc. . . . . . . . . . 15,000 15,000General Electric Co.. . . . . . . . . . . . . . . . . . . 57,000 210,000Genuine Parts Co. . . . . . . . . . . . . . . . . . . . . 7,800 249,200Gogo Inc. . . . . . . . . . . . . . . . . . . . . . . . . . . 70,000 175,000Halliburton Co. . . . . . . . . . . . . . . . . . . . . . . 15,000 206,700Hewlett Packard Enterprise Co. . . . . . . . . . . 56,500 206,500Hostess Brands Inc. . . . . . . . . . . . . . . . . . . 8,000 8,000Incyte Corp. . . . . . . . . . . . . . . . . . . . . . . . . 1,000 5,000Internap Corp.(b) . . . . . . . . . . . . . . . . . . . . 50,375 50,375K2M Group Holdings Inc. . . . . . . . . . . . . . . 52,460 52,460Liberty Ventures, Cl. A. . . . . . . . . . . . . . . . . 3,000 48,398Loral Space & Communications Inc. . . . . . . 20,000 43,000Macy’s Inc.. . . . . . . . . . . . . . . . . . . . . . . . . 5,000 331,000Mattel Inc. . . . . . . . . . . . . . . . . . . . . . . . . . 26,000 31,000MBIA Inc. . . . . . . . . . . . . . . . . . . . . . . . . . . 55,000 55,000Mondelez International Inc., Cl. A. . . . . . . . . 30,000 360,000Mueller Water Products Inc., Cl. A . . . . . . . . 3,000 12,000Naspers Ltd., Cl. N . . . . . . . . . . . . . . . . . . . 1,000 1,000PACCAR Inc.. . . . . . . . . . . . . . . . . . . . . . . . 1,000 70,000Pandora Media Inc. . . . . . . . . . . . . . . . . . . . 129,000 165,000PG&E Corp. . . . . . . . . . . . . . . . . . . . . . . . . 14,000 14,000Phillips 66 . . . . . . . . . . . . . . . . . . . . . . . . . 8,000 32,100Post Holdings Inc. . . . . . . . . . . . . . . . . . . . 4,000 36,000Reading International Inc., Cl. A. . . . . . . . . . 10,000 10,000Rolls-Royce Holdings plc, Cl. C(c) . . . . . . . . 55,614,000 55,614,000Sika AG, Cl. B . . . . . . . . . . . . . . . . . . . . . . . 152 152Sinclair Broadcast Group Inc., Cl. A . . . . . . . 20,000 20,000Stericycle Inc.. . . . . . . . . . . . . . . . . . . . . . . 3,000 13,000
Shares
Ownership atDecember 31,
2017Tenneco Inc. . . . . . . . . . . . . . . . . . . . . . . . . 29,513 29,513Textron Inc. . . . . . . . . . . . . . . . . . . . . . . . . 17,000 17,000The Manitowoc Co. Inc.(d) . . . . . . . . . . . . . 1,000 1,000The Bank of New York Mellon Corp. . . . . . . . 2,000 212,500Twenty-First Century Fox Inc., Cl. A . . . . . . . 15,000 385,000Viacom Inc., Cl. A . . . . . . . . . . . . . . . . . . . . 1,026 280,547Weatherford International plc . . . . . . . . . . . 187,300 222,300Zimmer Biomet Holdings Inc. . . . . . . . . . . . 2,000 11,600
NET SALESCommon StocksAdient plc. . . . . . . . . . . . . . . . . . . . . . . . . . (2,672) 20,162Advance Auto Parts Inc. . . . . . . . . . . . . . . . (7,500) 7,500Agilent Technologies Inc.. . . . . . . . . . . . . . . (6,000) —Akorn Inc. . . . . . . . . . . . . . . . . . . . . . . . . . (10,000) —Alere Inc. . . . . . . . . . . . . . . . . . . . . . . . . . . (4,000) —Alphabet Inc., Cl. C . . . . . . . . . . . . . . . . . . . (750) 3,250American Express Co. . . . . . . . . . . . . . . . . . (34,000) 362,000AMETEK Inc. . . . . . . . . . . . . . . . . . . . . . . . (1,000) 413,000Aptiv plc(a). . . . . . . . . . . . . . . . . . . . . . . . . (3,000) 9,500Armstrong Flooring Inc. . . . . . . . . . . . . . . . (32,400) 92,790Ascent Capital Group Inc. . . . . . . . . . . . . . . (3,000) —AT&T Inc. . . . . . . . . . . . . . . . . . . . . . . . . . . (15,000) 90,000Becton, Dickinson and Co.. . . . . . . . . . . . . . (7,500) —Boston Scientific Corp. . . . . . . . . . . . . . . . . (10,000) 250,000Brown-Forman Corp., Cl. A . . . . . . . . . . . . . (15,950) 20,000CBS Corp., Cl. A, Voting . . . . . . . . . . . . . . . (500) 241,800Corning Inc. . . . . . . . . . . . . . . . . . . . . . . . . (60,000) 310,000Crane Co. . . . . . . . . . . . . . . . . . . . . . . . . . . (1,000) 170,100Curtiss-Wright Corp. . . . . . . . . . . . . . . . . . . (5,500) 245,300CVS Health Corp. . . . . . . . . . . . . . . . . . . . . (12,900) 104,000Dana Inc. . . . . . . . . . . . . . . . . . . . . . . . . . . (10,000) 230,900DaVita Inc. . . . . . . . . . . . . . . . . . . . . . . . . . (10,000) —Deere & Co. . . . . . . . . . . . . . . . . . . . . . . . . (36,000) 185,000Diageo plc . . . . . . . . . . . . . . . . . . . . . . . . . (24,660) 136,340DigitalGlobe Inc.(e) . . . . . . . . . . . . . . . . . . . (13,000) —Donaldson Co. Inc. . . . . . . . . . . . . . . . . . . . (4,000) 327,800EchoStar Corp., Cl. A. . . . . . . . . . . . . . . . . . (5,715) 36,985Edgewell Personal Care Co. . . . . . . . . . . . . . (17,700) 182,000Emerson Electric Co. . . . . . . . . . . . . . . . . . . (4,000) —Energizer Holdings Inc. . . . . . . . . . . . . . . . . (5,000) 141,000Entertainment One Ltd. . . . . . . . . . . . . . . . . (25,000) 50,000Exxon Mobil Corp. . . . . . . . . . . . . . . . . . . . (6,000) 51,600Fortress Investment Group LLC . . . . . . . . . . (50,000) —Greif Inc., Cl. A . . . . . . . . . . . . . . . . . . . . . . (5,000) 127,000Grupo Televisa SAB. . . . . . . . . . . . . . . . . . . (2,000) 531,000H.B. Fuller Co. . . . . . . . . . . . . . . . . . . . . . . (1,000) 34,000HD Supply Holdings Inc. . . . . . . . . . . . . . . . (10,000) 19,100Herc Holdings Inc. . . . . . . . . . . . . . . . . . . . (10,900) 91,659Hertz Global Holdings Inc. . . . . . . . . . . . . . . (12,500) 207,500Honeywell International Inc. . . . . . . . . . . . . (6,000) 313,000IDEX Corp. . . . . . . . . . . . . . . . . . . . . . . . . . (14,000) 215,000
The Gabelli Equity Trust Inc.Portfolio Changes — Quarter Ended December 31, 2017 (Unaudited)
See accompanying notes to financial statements.
3
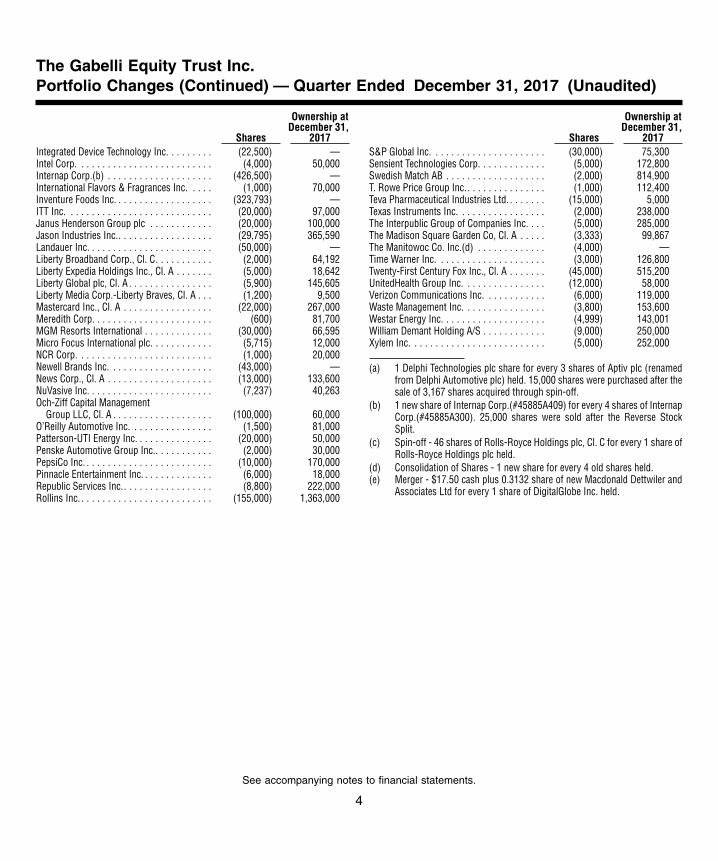
Shares
Ownership atDecember 31,
2017Integrated Device Technology Inc. . . . . . . . . (22,500) —Intel Corp. . . . . . . . . . . . . . . . . . . . . . . . . . (4,000) 50,000Internap Corp.(b) . . . . . . . . . . . . . . . . . . . . (426,500) —International Flavors & Fragrances Inc. . . . . (1,000) 70,000Inventure Foods Inc. . . . . . . . . . . . . . . . . . . (323,793) —ITT Inc. . . . . . . . . . . . . . . . . . . . . . . . . . . . (20,000) 97,000Janus Henderson Group plc . . . . . . . . . . . . (20,000) 100,000Jason Industries Inc.. . . . . . . . . . . . . . . . . . (29,795) 365,590Landauer Inc. . . . . . . . . . . . . . . . . . . . . . . . (50,000) —Liberty Broadband Corp., Cl. C. . . . . . . . . . . (2,000) 64,192Liberty Expedia Holdings Inc., Cl. A . . . . . . . (5,000) 18,642Liberty Global plc, Cl. A . . . . . . . . . . . . . . . . (5,900) 145,605Liberty Media Corp.-Liberty Braves, Cl. A . . . (1,200) 9,500Mastercard Inc., Cl. A . . . . . . . . . . . . . . . . . (22,000) 267,000Meredith Corp. . . . . . . . . . . . . . . . . . . . . . . (600) 81,700MGM Resorts International . . . . . . . . . . . . . (30,000) 66,595Micro Focus International plc. . . . . . . . . . . . (5,715) 12,000NCR Corp. . . . . . . . . . . . . . . . . . . . . . . . . . (1,000) 20,000Newell Brands Inc. . . . . . . . . . . . . . . . . . . . (43,000) —News Corp., Cl. A . . . . . . . . . . . . . . . . . . . . (13,000) 133,600NuVasive Inc. . . . . . . . . . . . . . . . . . . . . . . . (7,237) 40,263Och-Ziff Capital Management
Group LLC, Cl. A . . . . . . . . . . . . . . . . . . . (100,000) 60,000O’Reilly Automotive Inc. . . . . . . . . . . . . . . . (1,500) 81,000Patterson-UTI Energy Inc. . . . . . . . . . . . . . . (20,000) 50,000Penske Automotive Group Inc.. . . . . . . . . . . (2,000) 30,000PepsiCo Inc. . . . . . . . . . . . . . . . . . . . . . . . . (10,000) 170,000Pinnacle Entertainment Inc. . . . . . . . . . . . . . (6,000) 18,000Republic Services Inc.. . . . . . . . . . . . . . . . . (8,800) 222,000Rollins Inc. . . . . . . . . . . . . . . . . . . . . . . . . . (155,000) 1,363,000
Shares
Ownership atDecember 31,
2017S&P Global Inc. . . . . . . . . . . . . . . . . . . . . . (30,000) 75,300Sensient Technologies Corp. . . . . . . . . . . . . (5,000) 172,800Swedish Match AB . . . . . . . . . . . . . . . . . . . (2,000) 814,900T. Rowe Price Group Inc.. . . . . . . . . . . . . . . (1,000) 112,400Teva Pharmaceutical Industries Ltd. . . . . . . . (15,000) 5,000Texas Instruments Inc. . . . . . . . . . . . . . . . . (2,000) 238,000The Interpublic Group of Companies Inc. . . . (5,000) 285,000The Madison Square Garden Co, Cl. A . . . . . (3,333) 99,867The Manitowoc Co. Inc.(d) . . . . . . . . . . . . . (4,000) —Time Warner Inc. . . . . . . . . . . . . . . . . . . . . (3,000) 126,800Twenty-First Century Fox Inc., Cl. A . . . . . . . (45,000) 515,200UnitedHealth Group Inc. . . . . . . . . . . . . . . . (12,000) 58,000Verizon Communications Inc. . . . . . . . . . . . (6,000) 119,000Waste Management Inc. . . . . . . . . . . . . . . . (3,800) 153,600Westar Energy Inc. . . . . . . . . . . . . . . . . . . . (4,999) 143,001William Demant Holding A/S . . . . . . . . . . . . (9,000) 250,000Xylem Inc. . . . . . . . . . . . . . . . . . . . . . . . . . (5,000) 252,000
(a) 1 Delphi Technologies plc share for every 3 shares of Aptiv plc (renamedfrom Delphi Automotive plc) held. 15,000 shares were purchased after thesale of 3,167 shares acquired through spin-off.
(b) 1 new share of Internap Corp.(#45885A409) for every 4 shares of InternapCorp.(#45885A300). 25,000 shares were sold after the Reverse StockSplit.
(c) Spin-off - 46 shares of Rolls-Royce Holdings plc, Cl. C for every 1 share ofRolls-Royce Holdings plc held.
(d) Consolidation of Shares - 1 new share for every 4 old shares held.(e) Merger - $17.50 cash plus 0.3132 share of new Macdonald Dettwiler and
Associates Ltd for every 1 share of DigitalGlobe Inc. held.
The Gabelli Equity Trust Inc.Portfolio Changes (Continued) — Quarter Ended December 31, 2017 (Unaudited)
See accompanying notes to financial statements.
4

Shares CostMarketValue
COMMON STOCKS — 90.6%Food and Beverage — 11.2%
3,000 Ajinomoto Co. Inc. . . . . . . . . . . . . $ 52,866 $ 56,472105,200 Brown-Forman Corp., Cl. A. . . . 1,820,590 7,073,64820,000 Brown-Forman Corp., Cl. B. . . . 793,678 1,373,40063,800 Campbell Soup Co. . . . . . . . . . . . 1,781,130 3,069,41865,000 Chr. Hansen Holding A/S . . . . . . 2,725,303 6,096,99115,000 Coca-Cola European Partners
plc . . . . . . . . . . . . . . . . . . . . . . . . . 275,290 597,750135,000 Conagra Brands Inc. . . . . . . . . . . 4,266,922 5,085,45030,000 Constellation Brands Inc.,
Cl. A . . . . . . . . . . . . . . . . . . . . . . . 376,266 6,857,10018,000 Crimson Wine Group Ltd.† . . . . 91,848 192,060
201,500 Danone SA . . . . . . . . . . . . . . . . . . . 9,779,634 16,911,7451,277,600 Davide Campari-Milano SpA. . . 3,498,059 9,879,694
136,340 Diageo plc, ADR . . . . . . . . . . . . . . 12,287,694 19,909,73082,400 Dr Pepper Snapple Group Inc.. 2,704,892 7,997,74480,000 Flowers Foods Inc.. . . . . . . . . . . . 263,976 1,544,80076,200 Fomento Economico Mexicano
SAB de CV, ADR. . . . . . . . . . . . 1,872,322 7,155,18055,000 General Mills Inc. . . . . . . . . . . . . . 2,252,522 3,260,950
1,848,400 Grupo Bimbo SAB de CV,Cl. A . . . . . . . . . . . . . . . . . . . . . . . 2,624,248 4,095,857
41,300 Heineken NV. . . . . . . . . . . . . . . . . . 1,962,995 4,307,6998,000 Hostess Brands Inc.† . . . . . . . . . 96,065 118,480
11,000 Ingredion Inc. . . . . . . . . . . . . . . . . 162,440 1,537,800105,000 ITO EN Ltd. . . . . . . . . . . . . . . . . . . . 2,422,898 4,137,56427,000 Kellogg Co. . . . . . . . . . . . . . . . . . . . 1,489,530 1,835,46064,000 Kerry Group plc, Cl. A . . . . . . . . . 735,609 7,184,48886,666 Lamb Weston Holdings Inc. . . . 2,655,649 4,892,2969,700 LVMH Moet Hennessy Louis
Vuitton SE . . . . . . . . . . . . . . . . . 335,341 2,856,09045,000 Maple Leaf Foods Inc.. . . . . . . . . 828,035 1,282,339
360,000 Mondelez International Inc.,Cl. A . . . . . . . . . . . . . . . . . . . . . . . 13,102,609 15,408,000
14,000 Morinaga Milk Industry Co.Ltd. . . . . . . . . . . . . . . . . . . . . . . . . 299,202 633,681
41,000 Nestlé SA. . . . . . . . . . . . . . . . . . . . . 1,791,828 3,525,886170,000 PepsiCo Inc. . . . . . . . . . . . . . . . . . . 12,136,114 20,386,40039,200 Pernod Ricard SA. . . . . . . . . . . . . 3,228,300 6,206,13436,000 Post Holdings Inc.† . . . . . . . . . . . 1,666,611 2,852,28040,000 Remy Cointreau SA . . . . . . . . . . . 2,377,486 5,543,29055,000 The Kraft Heinz Co.. . . . . . . . . . . 1,910,653 4,276,80099,600 The Coca-Cola Co. . . . . . . . . . . . . 3,092,328 4,569,64832,000 The Hain Celestial Group
Inc.† . . . . . . . . . . . . . . . . . . . . . . . 214,736 1,356,4803,000 The J.M. Smucker Co. . . . . . . . . 149,101 372,720
131,000 Tootsie Roll Industries Inc. . . . . 1,755,700 4,768,40048,000 Tyson Foods Inc., Cl. A. . . . . . . . 397,211 3,891,360
341,000 Yakult Honsha Co. Ltd. . . . . . . . . 9,700,538 25,724,429109,978,219 228,825,713
Shares CostMarketValue
Financial Services — 9.6%362,000 American Express Co.(a) . . . . . . $ 26,543,022 $ 35,950,22025,000 American International Group
Inc. . . . . . . . . . . . . . . . . . . . . . . . . 1,374,505 1,489,50014,520 Argo Group International
Holdings Ltd.. . . . . . . . . . . . . . . 389,834 895,15872,000 Banco Santander SA, ADR . . . . 545,542 470,880
114 Berkshire Hathaway Inc.,Cl. A† . . . . . . . . . . . . . . . . . . . . . . 335,298 33,926,401
79,123 Blackhawk Network HoldingsInc.† . . . . . . . . . . . . . . . . . . . . . . . 2,689,076 2,820,735
12,800 CIT Group Inc. . . . . . . . . . . . . . . . . 548,363 630,14488,000 Citigroup Inc. . . . . . . . . . . . . . . . . . 4,162,621 6,548,0809,000 Cullen/Frost Bankers Inc.. . . . . . 665,261 851,850
24,000 Deutsche Bank AG . . . . . . . . . . . . 679,775 456,72011,000 Financial Engines Inc. . . . . . . . . . 364,369 333,30030,000 FNF Group. . . . . . . . . . . . . . . . . . . . 1,064,754 1,177,20068,000 H&R Block Inc. . . . . . . . . . . . . . . . 1,532,208 1,782,96040,000 Interactive Brokers Group Inc.,
Cl. A . . . . . . . . . . . . . . . . . . . . . . . 643,310 2,368,400100,000 Janus Henderson Group plc . . . 3,032,331 3,826,00061,400 JPMorgan Chase & Co. . . . . . . . 3,250,397 6,566,11629,800 Kinnevik AB, Cl. A. . . . . . . . . . . . . 494,015 1,039,336
145,000 Legg Mason Inc. . . . . . . . . . . . . . . 4,109,572 6,087,10088,000 Leucadia National Corp. . . . . . . . 1,259,355 2,331,12014,000 Loews Corp. . . . . . . . . . . . . . . . . . . 558,454 700,420
125,000 Marsh & McLennanCompanies Inc. . . . . . . . . . . . . 3,772,923 10,173,750
55,000 MBIA Inc.† . . . . . . . . . . . . . . . . . . . 424,467 402,6009,000 Moody’s Corp. . . . . . . . . . . . . . . . . 312,150 1,328,490
60,000 Och-Ziff Capital ManagementGroup LLC, Cl. A . . . . . . . . . . . 144,675 150,000
20,000 PayPal Holdings Inc.†. . . . . . . . . 651,955 1,472,40075,300 S&P Global Inc.. . . . . . . . . . . . . . . 4,144,836 12,755,820
124,100 State Street Corp. . . . . . . . . . . . . . 5,719,003 12,113,40117,000 SunTrust Banks Inc. . . . . . . . . . . 358,050 1,098,03010,000 Synchrony Financial . . . . . . . . . . 275,012 386,100
112,400 T. Rowe Price Group Inc.. . . . . . 4,543,039 11,794,132212,500 The Bank of New York Mellon
Corp. . . . . . . . . . . . . . . . . . . . . . . 6,816,744 11,445,25020,000 The Charles Schwab Corp. . . . . 292,250 1,027,40012,300 The Dun & Bradstreet Corp. . . . 292,691 1,456,44310,000 The PNC Financial Services
Group Inc. . . . . . . . . . . . . . . . . . 956,448 1,442,9003,000 TransUnion†. . . . . . . . . . . . . . . . . . 128,898 164,880
13,000 W. R. Berkley Corp. . . . . . . . . . . . 476,775 931,450150,000 Waddell & Reed Financial Inc.,
Cl. A . . . . . . . . . . . . . . . . . . . . . . . 3,429,408 3,351,000235,000 Wells Fargo & Co. . . . . . . . . . . . . 7,377,851 14,257,450
94,359,237 196,003,136
The Gabelli Equity Trust Inc.Schedule of Investments — December 31, 2017
See accompanying notes to financial statements.
5
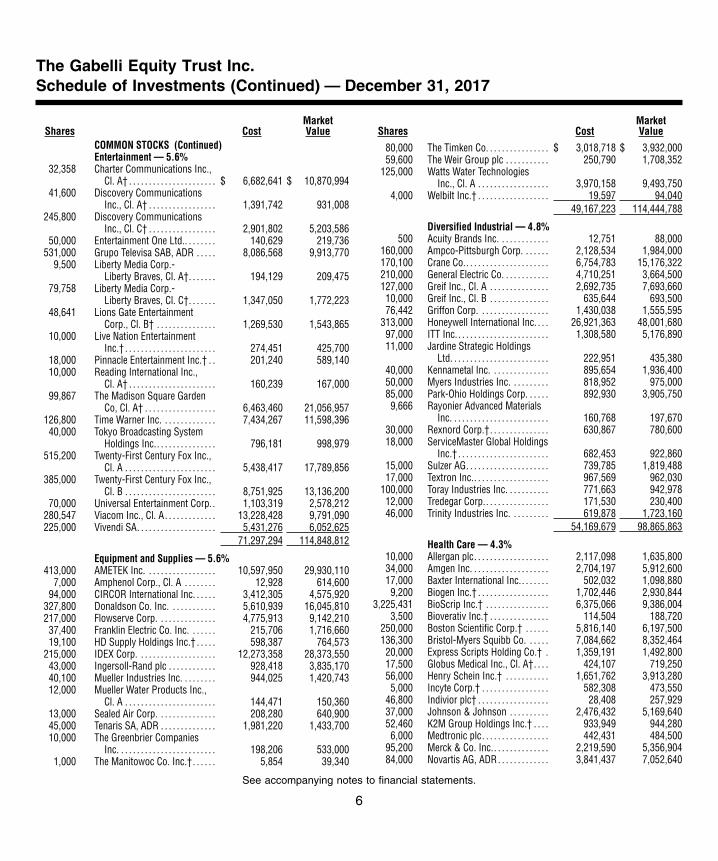
Shares CostMarketValue
COMMON STOCKS (Continued)Entertainment — 5.6%
32,358 Charter Communications Inc.,Cl. A† . . . . . . . . . . . . . . . . . . . . . . $ 6,682,641 $ 10,870,994
41,600 Discovery CommunicationsInc., Cl. A† . . . . . . . . . . . . . . . . . 1,391,742 931,008
245,800 Discovery CommunicationsInc., Cl. C† . . . . . . . . . . . . . . . . . 2,901,802 5,203,586
50,000 Entertainment One Ltd.. . . . . . . . 140,629 219,736531,000 Grupo Televisa SAB, ADR . . . . . 8,086,568 9,913,770
9,500 Liberty Media Corp.-Liberty Braves, Cl. A†. . . . . . . 194,129 209,475
79,758 Liberty Media Corp.-Liberty Braves, Cl. C†. . . . . . . 1,347,050 1,772,223
48,641 Lions Gate EntertainmentCorp., Cl. B† . . . . . . . . . . . . . . . 1,269,530 1,543,865
10,000 Live Nation EntertainmentInc.† . . . . . . . . . . . . . . . . . . . . . . . 274,451 425,700
18,000 Pinnacle Entertainment Inc.† . . 201,240 589,14010,000 Reading International Inc.,
Cl. A† . . . . . . . . . . . . . . . . . . . . . . 160,239 167,00099,867 The Madison Square Garden
Co, Cl. A† . . . . . . . . . . . . . . . . . . 6,463,460 21,056,957126,800 Time Warner Inc. . . . . . . . . . . . . . 7,434,267 11,598,39640,000 Tokyo Broadcasting System
Holdings Inc.. . . . . . . . . . . . . . . 796,181 998,979515,200 Twenty-First Century Fox Inc.,
Cl. A . . . . . . . . . . . . . . . . . . . . . . . 5,438,417 17,789,856385,000 Twenty-First Century Fox Inc.,
Cl. B . . . . . . . . . . . . . . . . . . . . . . . 8,751,925 13,136,20070,000 Universal Entertainment Corp.. 1,103,319 2,578,212
280,547 Viacom Inc., Cl. A. . . . . . . . . . . . . 13,228,428 9,791,090225,000 Vivendi SA. . . . . . . . . . . . . . . . . . . . 5,431,276 6,052,625
71,297,294 114,848,812
Equipment and Supplies — 5.6%413,000 AMETEK Inc. . . . . . . . . . . . . . . . . . 10,597,950 29,930,110
7,000 Amphenol Corp., Cl. A . . . . . . . . 12,928 614,60094,000 CIRCOR International Inc. . . . . . 3,412,305 4,575,920
327,800 Donaldson Co. Inc. . . . . . . . . . . . 5,610,939 16,045,810217,000 Flowserve Corp. . . . . . . . . . . . . . . 4,775,913 9,142,210
37,400 Franklin Electric Co. Inc. . . . . . . 215,706 1,716,66019,100 HD Supply Holdings Inc.† . . . . . 598,387 764,573
215,000 IDEX Corp. . . . . . . . . . . . . . . . . . . . 12,273,358 28,373,55043,000 Ingersoll-Rand plc . . . . . . . . . . . . 928,418 3,835,17040,100 Mueller Industries Inc. . . . . . . . . 944,025 1,420,74312,000 Mueller Water Products Inc.,
Cl. A . . . . . . . . . . . . . . . . . . . . . . . 144,471 150,36013,000 Sealed Air Corp. . . . . . . . . . . . . . . 208,280 640,90045,000 Tenaris SA, ADR . . . . . . . . . . . . . . 1,981,220 1,433,70010,000 The Greenbrier Companies
Inc. . . . . . . . . . . . . . . . . . . . . . . . . 198,206 533,0001,000 The Manitowoc Co. Inc.†. . . . . . 5,854 39,340
Shares CostMarketValue
80,000 The Timken Co. . . . . . . . . . . . . . . . $ 3,018,718 $ 3,932,00059,600 The Weir Group plc . . . . . . . . . . . 250,790 1,708,352
125,000 Watts Water TechnologiesInc., Cl. A . . . . . . . . . . . . . . . . . . 3,970,158 9,493,750
4,000 Welbilt Inc.† . . . . . . . . . . . . . . . . . . 19,597 94,04049,167,223 114,444,788
Diversified Industrial — 4.8%500 Acuity Brands Inc. . . . . . . . . . . . . 12,751 88,000
160,000 Ampco-Pittsburgh Corp. . . . . . . 2,128,534 1,984,000170,100 Crane Co.. . . . . . . . . . . . . . . . . . . . . 6,754,783 15,176,322210,000 General Electric Co. . . . . . . . . . . . 4,710,251 3,664,500127,000 Greif Inc., Cl. A . . . . . . . . . . . . . . . 2,692,735 7,693,66010,000 Greif Inc., Cl. B . . . . . . . . . . . . . . . 635,644 693,50076,442 Griffon Corp. . . . . . . . . . . . . . . . . . 1,430,038 1,555,595
313,000 Honeywell International Inc. . . . 26,921,363 48,001,68097,000 ITT Inc.. . . . . . . . . . . . . . . . . . . . . . . 1,308,580 5,176,89011,000 Jardine Strategic Holdings
Ltd. . . . . . . . . . . . . . . . . . . . . . . . . 222,951 435,38040,000 Kennametal Inc. . . . . . . . . . . . . . . 895,654 1,936,40050,000 Myers Industries Inc. . . . . . . . . . 818,952 975,00085,000 Park-Ohio Holdings Corp. . . . . . 892,930 3,905,7509,666 Rayonier Advanced Materials
Inc. . . . . . . . . . . . . . . . . . . . . . . . . 160,768 197,67030,000 Rexnord Corp.†. . . . . . . . . . . . . . . 630,867 780,60018,000 ServiceMaster Global Holdings
Inc.† . . . . . . . . . . . . . . . . . . . . . . . 682,453 922,86015,000 Sulzer AG. . . . . . . . . . . . . . . . . . . . . 739,785 1,819,48817,000 Textron Inc.. . . . . . . . . . . . . . . . . . . 967,569 962,030
100,000 Toray Industries Inc. . . . . . . . . . . 771,663 942,97812,000 Tredegar Corp.. . . . . . . . . . . . . . . . 171,530 230,40046,000 Trinity Industries Inc. . . . . . . . . . 619,878 1,723,160
54,169,679 98,865,863
Health Care — 4.3%10,000 Allergan plc. . . . . . . . . . . . . . . . . . . 2,117,098 1,635,80034,000 Amgen Inc. . . . . . . . . . . . . . . . . . . . 2,704,197 5,912,60017,000 Baxter International Inc.. . . . . . . 502,032 1,098,8809,200 Biogen Inc.† . . . . . . . . . . . . . . . . . . 1,702,446 2,930,844
3,225,431 BioScrip Inc.† . . . . . . . . . . . . . . . . 6,375,066 9,386,0043,500 Bioverativ Inc.† . . . . . . . . . . . . . . . 114,504 188,720
250,000 Boston Scientific Corp.† . . . . . . 5,816,140 6,197,500136,300 Bristol-Myers Squibb Co. . . . . . 7,084,662 8,352,46420,000 Express Scripts Holding Co.† . 1,359,191 1,492,80017,500 Globus Medical Inc., Cl. A†. . . . 424,107 719,25056,000 Henry Schein Inc.† . . . . . . . . . . . 1,651,762 3,913,2805,000 Incyte Corp.† . . . . . . . . . . . . . . . . . 582,308 473,550
46,800 Indivior plc† . . . . . . . . . . . . . . . . . . 28,408 257,92937,000 Johnson & Johnson . . . . . . . . . . 2,476,432 5,169,64052,460 K2M Group Holdings Inc.† . . . . 933,949 944,2806,000 Medtronic plc. . . . . . . . . . . . . . . . . 442,431 484,500
95,200 Merck & Co. Inc.. . . . . . . . . . . . . . 2,219,590 5,356,90484,000 Novartis AG, ADR. . . . . . . . . . . . . 3,841,437 7,052,640
The Gabelli Equity Trust Inc.Schedule of Investments (Continued) — December 31, 2017
See accompanying notes to financial statements.
6

Shares CostMarketValue
COMMON STOCKS (Continued)Health Care (Continued)
40,263 NuVasive Inc.†. . . . . . . . . . . . . . . . $ 2,437,038 $ 2,354,9831,500 Shire plc, ADR . . . . . . . . . . . . . . . . 289,815 232,6805,000 Teva Pharmaceutical
Industries Ltd., ADR. . . . . . . . 91,150 94,75058,000 UnitedHealth Group Inc.. . . . . . . 6,077,905 12,786,6804,000 Waters Corp.† . . . . . . . . . . . . . . . . 285,470 772,760
250,000 William Demant Holding A/S† . 2,276,453 6,990,66811,600 Zimmer Biomet Holdings Inc. . 909,794 1,399,77235,000 Zoetis Inc. . . . . . . . . . . . . . . . . . . . . 1,122,327 2,521,400
53,865,712 88,721,278
Energy and Utilities — 3.9%11,000 ABB Ltd., ADR . . . . . . . . . . . . . . . . 171,270 295,02039,000 Anadarko Petroleum Corp. . . . . 2,262,604 2,091,96059,000 Apache Corp. . . . . . . . . . . . . . . . . . 2,771,519 2,490,98080,000 Baker Hughes, a GE Company . 3,044,117 2,531,20080,000 BP plc, ADR . . . . . . . . . . . . . . . . . . 3,952,168 3,362,40016,000 CMS Energy Corp. . . . . . . . . . . . . 102,219 756,800
185,100 ConocoPhillips . . . . . . . . . . . . . . . 8,559,949 10,160,139204,000 El Paso Electric Co. . . . . . . . . . . . 5,709,272 11,291,40098,400 Enbridge Inc. . . . . . . . . . . . . . . . . . 2,488,608 3,848,42424,000 Eversource Energy . . . . . . . . . . . . 545,324 1,516,32051,600 Exxon Mobil Corp. . . . . . . . . . . . . 2,263,473 4,315,82415,000 Forum Energy Technologies
Inc.† . . . . . . . . . . . . . . . . . . . . . . . 218,950 233,250140,000 GenOn Energy Inc.,
Escrow†(b) . . . . . . . . . . . . . . . . 0 0206,700 Halliburton Co. . . . . . . . . . . . . . . . 4,633,259 10,101,429
4,000 Marathon Oil Corp.. . . . . . . . . . . . 111,366 67,72022,000 Marathon Petroleum Corp. . . . . 836,230 1,451,56020,000 Murphy USA Inc.† . . . . . . . . . . . . 886,754 1,607,20040,000 National Fuel Gas Co. . . . . . . . . . 2,460,759 2,196,40013,000 NextEra Energy Inc. . . . . . . . . . . . 762,169 2,030,4701,000 Niko Resources Ltd., OTC†. . . . 54,403 373,000 Niko Resources Ltd.,
Toronto† . . . . . . . . . . . . . . . . . . . 923 13132,400 Oceaneering International Inc.. 437,629 684,93650,000 Patterson-UTI Energy Inc. . . . . . 1,030,645 1,150,50014,000 PG&E Corp. . . . . . . . . . . . . . . . . . . 603,593 627,62032,100 Phillips 66 . . . . . . . . . . . . . . . . . . . . 2,587,758 3,246,915
120,000 Rowan Companies plc, Cl. A† . 4,470,497 1,879,20020,000 RPC Inc.. . . . . . . . . . . . . . . . . . . . . . 259,649 510,60015,000 Southwest Gas Holdings Inc. . . 347,695 1,207,200
101,000 The AES Corp. . . . . . . . . . . . . . . . . 862,703 1,093,830222,300 Weatherford International
plc†. . . . . . . . . . . . . . . . . . . . . . . . 791,067 926,991143,001 Westar Energy Inc.. . . . . . . . . . . . 8,034,454 7,550,453
61,261,026 79,226,909
Consumer Services — 3.8%20,000 eBay Inc.† . . . . . . . . . . . . . . . . . . . . 416,823 754,800
Shares CostMarketValue
40,000 IAC/InterActiveCorp.† . . . . . . . . . $ 1,022,109 $ 4,891,20018,642 Liberty Expedia Holdings Inc.,
Cl. A† . . . . . . . . . . . . . . . . . . . . . . 411,913 826,400225,200 Liberty Interactive Corp. QVC
Group, Cl. A†. . . . . . . . . . . . . . . 3,714,133 5,499,38421,000 Liberty TripAdvisor Holdings
Inc., Cl. A† . . . . . . . . . . . . . . . . . 247,059 197,92548,398 Liberty Ventures, Cl. A† . . . . . . . 1,071,440 2,625,108
1,363,000 Rollins Inc. . . . . . . . . . . . . . . . . . . . 37,546,049 63,420,3905,500 TripAdvisor Inc.† . . . . . . . . . . . . . 194,460 189,530
44,623,986 78,404,737
Consumer Products — 3.6%100,000 Avon Products Inc.† . . . . . . . . . . 308,016 215,00014,100 Christian Dior SE . . . . . . . . . . . . . 534,292 5,152,32727,000 Church & Dwight Co. Inc. . . . . . 383,636 1,354,59065,600 Coty Inc., Cl. A. . . . . . . . . . . . . . . . 1,210,144 1,304,784
182,000 Edgewell Personal Care Co.† . . 14,239,088 10,808,980141,000 Energizer Holdings Inc. . . . . . . . 5,187,308 6,765,18027,600 Essity AB, Cl. B† . . . . . . . . . . . . . . 294,742 783,9482,100 Givaudan SA. . . . . . . . . . . . . . . . . . 725,396 4,853,199
90,000 Hanesbrands Inc. . . . . . . . . . . . . . 775,521 1,881,90023,800 Harley-Davidson Inc.. . . . . . . . . . 1,105,662 1,210,9441,270 Hermes International. . . . . . . . . . 444,999 679,998
31,000 Mattel Inc. . . . . . . . . . . . . . . . . . . . . 459,161 476,78011,000 National Presto Industries
Inc. . . . . . . . . . . . . . . . . . . . . . . . . 529,994 1,093,95010,000 Oil-Dri Corp. of America. . . . . . . 171,255 415,00046,800 Reckitt Benckiser Group plc . . . 1,391,995 4,371,90127,600 Svenska Cellulosa AB, Cl. B . . . 73,685 284,475
814,900 Swedish Match AB. . . . . . . . . . . . 10,248,449 32,106,84738,083,343 73,759,803
Automotive: Parts and Accessories — 3.6%20,162 Adient plc . . . . . . . . . . . . . . . . . . . . 947,614 1,586,7499,500 Aptiv plc. . . . . . . . . . . . . . . . . . . . . . 537,675 805,885
107,600 BorgWarner Inc. . . . . . . . . . . . . . . 4,288,790 5,497,284230,900 Dana Inc. . . . . . . . . . . . . . . . . . . . . . 2,469,623 7,391,10915,000 Delphi Technologies plc†. . . . . . 755,120 787,050
249,200 Genuine Parts Co.. . . . . . . . . . . . . 12,659,575 23,676,492365,590 Jason Industries Inc.† . . . . . . . . 805,348 866,448163,000 Modine Manufacturing Co.† . . . 3,002,704 3,292,60081,000 O’Reilly Automotive Inc.† . . . . . 13,776,439 19,483,740
111,000 Standard Motor Products Inc. . 1,220,821 4,985,01073,000 Superior Industries
International Inc. . . . . . . . . . . . 1,462,789 1,084,05029,513 Tenneco Inc. . . . . . . . . . . . . . . . . . . 1,724,523 1,727,69114,000 Visteon Corp.†. . . . . . . . . . . . . . . . 764,850 1,751,960
44,415,871 72,936,068
Cable and Satellite — 3.1%253,600 AMC Networks Inc., Cl. A† . . . . 12,064,774 13,714,688
1,000 Cable One Inc. . . . . . . . . . . . . . . . . 345,163 703,350
The Gabelli Equity Trust Inc.Schedule of Investments (Continued) — December 31, 2017
See accompanying notes to financial statements.
7
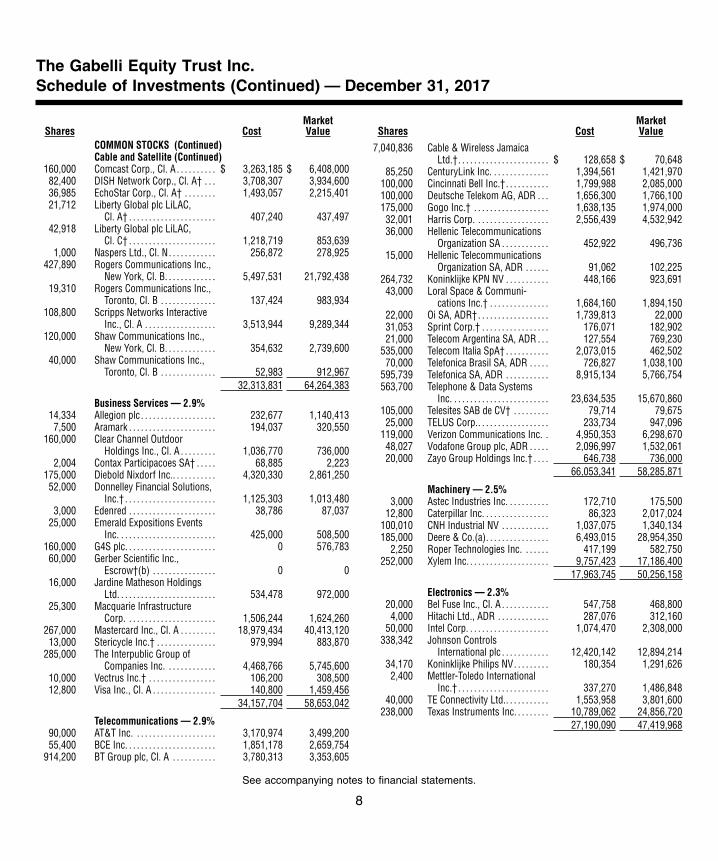
Shares CostMarketValue
COMMON STOCKS (Continued)Cable and Satellite (Continued)
160,000 Comcast Corp., Cl. A . . . . . . . . . . $ 3,263,185 $ 6,408,00082,400 DISH Network Corp., Cl. A† . . . 3,708,307 3,934,60036,985 EchoStar Corp., Cl. A† . . . . . . . . 1,493,057 2,215,40121,712 Liberty Global plc LiLAC,
Cl. A† . . . . . . . . . . . . . . . . . . . . . . 407,240 437,49742,918 Liberty Global plc LiLAC,
Cl. C† . . . . . . . . . . . . . . . . . . . . . . 1,218,719 853,6391,000 Naspers Ltd., Cl. N. . . . . . . . . . . . 256,872 278,925
427,890 Rogers Communications Inc.,New York, Cl. B. . . . . . . . . . . . . 5,497,531 21,792,438
19,310 Rogers Communications Inc.,Toronto, Cl. B . . . . . . . . . . . . . . 137,424 983,934
108,800 Scripps Networks InteractiveInc., Cl. A . . . . . . . . . . . . . . . . . . 3,513,944 9,289,344
120,000 Shaw Communications Inc.,New York, Cl. B. . . . . . . . . . . . . 354,632 2,739,600
40,000 Shaw Communications Inc.,Toronto, Cl. B . . . . . . . . . . . . . . 52,983 912,967
32,313,831 64,264,383
Business Services — 2.9%14,334 Allegion plc . . . . . . . . . . . . . . . . . . . 232,677 1,140,4137,500 Aramark . . . . . . . . . . . . . . . . . . . . . . 194,037 320,550
160,000 Clear Channel OutdoorHoldings Inc., Cl. A . . . . . . . . . 1,036,770 736,000
2,004 Contax Participacoes SA† . . . . . 68,885 2,223175,000 Diebold Nixdorf Inc.. . . . . . . . . . . 4,320,330 2,861,25052,000 Donnelley Financial Solutions,
Inc.† . . . . . . . . . . . . . . . . . . . . . . . 1,125,303 1,013,4803,000 Edenred . . . . . . . . . . . . . . . . . . . . . . 38,786 87,037
25,000 Emerald Expositions EventsInc. . . . . . . . . . . . . . . . . . . . . . . . . 425,000 508,500
160,000 G4S plc. . . . . . . . . . . . . . . . . . . . . . . 0 576,78360,000 Gerber Scientific Inc.,
Escrow†(b) . . . . . . . . . . . . . . . . 0 016,000 Jardine Matheson Holdings
Ltd. . . . . . . . . . . . . . . . . . . . . . . . . 534,478 972,00025,300 Macquarie Infrastructure
Corp. . . . . . . . . . . . . . . . . . . . . . . 1,506,244 1,624,260267,000 Mastercard Inc., Cl. A . . . . . . . . . 18,979,434 40,413,12013,000 Stericycle Inc.† . . . . . . . . . . . . . . . 979,994 883,870
285,000 The Interpublic Group ofCompanies Inc. . . . . . . . . . . . . 4,468,766 5,745,600
10,000 Vectrus Inc.† . . . . . . . . . . . . . . . . . 106,200 308,50012,800 Visa Inc., Cl. A . . . . . . . . . . . . . . . . 140,800 1,459,456
34,157,704 58,653,042
Telecommunications — 2.9%90,000 AT&T Inc. . . . . . . . . . . . . . . . . . . . . 3,170,974 3,499,20055,400 BCE Inc. . . . . . . . . . . . . . . . . . . . . . . 1,851,178 2,659,754
914,200 BT Group plc, Cl. A . . . . . . . . . . . 3,780,313 3,353,605
Shares CostMarketValue
7,040,836 Cable & Wireless JamaicaLtd.†. . . . . . . . . . . . . . . . . . . . . . . $ 128,658 $ 70,648
85,250 CenturyLink Inc. . . . . . . . . . . . . . . 1,394,561 1,421,970100,000 Cincinnati Bell Inc.†. . . . . . . . . . . 1,799,988 2,085,000100,000 Deutsche Telekom AG, ADR . . . 1,656,300 1,766,100175,000 Gogo Inc.† . . . . . . . . . . . . . . . . . . . 1,638,135 1,974,00032,001 Harris Corp. . . . . . . . . . . . . . . . . . . 2,556,439 4,532,94236,000 Hellenic Telecommunications
Organization SA . . . . . . . . . . . . 452,922 496,73615,000 Hellenic Telecommunications
Organization SA, ADR . . . . . . 91,062 102,225264,732 Koninklijke KPN NV . . . . . . . . . . . 448,166 923,69143,000 Loral Space & Communi-
cations Inc.† . . . . . . . . . . . . . . . 1,684,160 1,894,15022,000 Oi SA, ADR†. . . . . . . . . . . . . . . . . . 1,739,813 22,00031,053 Sprint Corp.† . . . . . . . . . . . . . . . . . 176,071 182,90221,000 Telecom Argentina SA, ADR . . . 127,554 769,230
535,000 Telecom Italia SpA† . . . . . . . . . . . 2,073,015 462,50270,000 Telefonica Brasil SA, ADR . . . . . 726,827 1,038,100
595,739 Telefonica SA, ADR . . . . . . . . . . . 8,915,134 5,766,754563,700 Telephone & Data Systems
Inc. . . . . . . . . . . . . . . . . . . . . . . . . 23,634,535 15,670,860105,000 Telesites SAB de CV† . . . . . . . . . 79,714 79,67525,000 TELUS Corp.. . . . . . . . . . . . . . . . . . 233,734 947,096
119,000 Verizon Communications Inc. . 4,950,353 6,298,67048,027 Vodafone Group plc, ADR . . . . . 2,096,997 1,532,06120,000 Zayo Group Holdings Inc.† . . . . 646,738 736,000
66,053,341 58,285,871
Machinery — 2.5%3,000 Astec Industries Inc. . . . . . . . . . . 172,710 175,500
12,800 Caterpillar Inc. . . . . . . . . . . . . . . . . 86,323 2,017,024100,010 CNH Industrial NV . . . . . . . . . . . . 1,037,075 1,340,134185,000 Deere & Co.(a). . . . . . . . . . . . . . . . 6,493,015 28,954,350
2,250 Roper Technologies Inc. . . . . . . 417,199 582,750252,000 Xylem Inc. . . . . . . . . . . . . . . . . . . . . 9,757,423 17,186,400
17,963,745 50,256,158
Electronics — 2.3%20,000 Bel Fuse Inc., Cl. A . . . . . . . . . . . . 547,758 468,8004,000 Hitachi Ltd., ADR . . . . . . . . . . . . . 287,076 312,160
50,000 Intel Corp. . . . . . . . . . . . . . . . . . . . . 1,074,470 2,308,000338,342 Johnson Controls
International plc . . . . . . . . . . . . 12,420,142 12,894,21434,170 Koninklijke Philips NV. . . . . . . . . 180,354 1,291,6262,400 Mettler-Toledo International
Inc.† . . . . . . . . . . . . . . . . . . . . . . . 337,270 1,486,84840,000 TE Connectivity Ltd.. . . . . . . . . . . 1,553,958 3,801,600
238,000 Texas Instruments Inc. . . . . . . . . 10,789,062 24,856,72027,190,090 47,419,968
The Gabelli Equity Trust Inc.Schedule of Investments (Continued) — December 31, 2017
See accompanying notes to financial statements.
8
Shares CostMarketValue
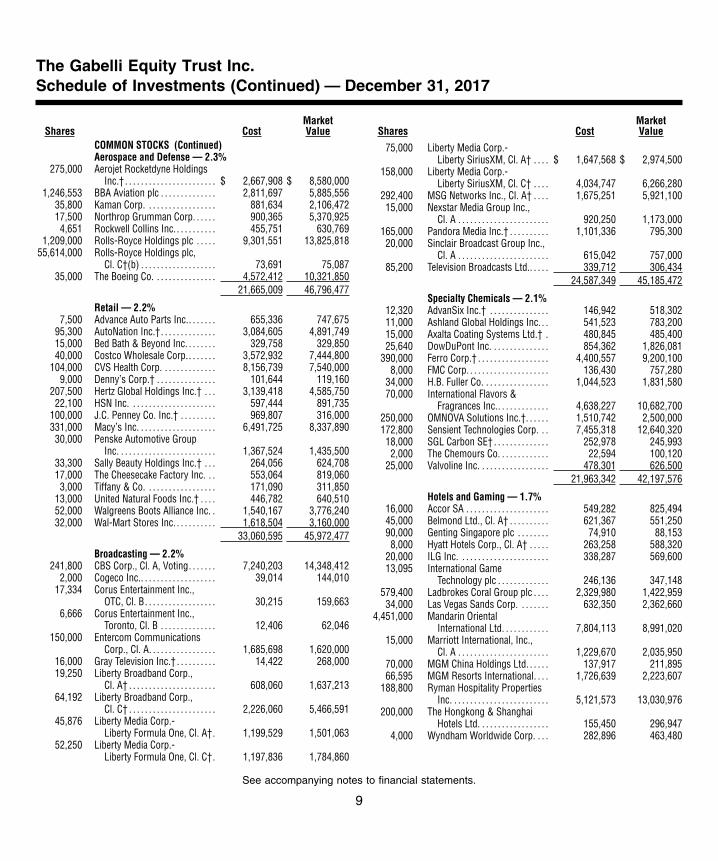
COMMON STOCKS (Continued)Aerospace and Defense — 2.3%
275,000 Aerojet Rocketdyne HoldingsInc.† . . . . . . . . . . . . . . . . . . . . . . . $ 2,667,908 $ 8,580,000
1,246,553 BBA Aviation plc . . . . . . . . . . . . . . 2,811,697 5,885,55635,800 Kaman Corp. . . . . . . . . . . . . . . . . . 881,634 2,106,47217,500 Northrop Grumman Corp. . . . . . 900,365 5,370,9254,651 Rockwell Collins Inc. . . . . . . . . . . 455,751 630,769
1,209,000 Rolls-Royce Holdings plc . . . . . 9,301,551 13,825,81855,614,000 Rolls-Royce Holdings plc,
Cl. C†(b) . . . . . . . . . . . . . . . . . . . 73,691 75,08735,000 The Boeing Co. . . . . . . . . . . . . . . . 4,572,412 10,321,850
21,665,009 46,796,477
Retail — 2.2%7,500 Advance Auto Parts Inc.. . . . . . . 655,336 747,675
95,300 AutoNation Inc.†. . . . . . . . . . . . . . 3,084,605 4,891,74915,000 Bed Bath & Beyond Inc. . . . . . . . 329,758 329,85040,000 Costco Wholesale Corp.. . . . . . . 3,572,932 7,444,800
104,000 CVS Health Corp. . . . . . . . . . . . . . 8,156,739 7,540,0009,000 Denny’s Corp.† . . . . . . . . . . . . . . . 101,644 119,160
207,500 Hertz Global Holdings Inc.† . . . 3,139,418 4,585,75022,100 HSN Inc. . . . . . . . . . . . . . . . . . . . . . 597,444 891,735
100,000 J.C. Penney Co. Inc.† . . . . . . . . . 969,807 316,000331,000 Macy’s Inc. . . . . . . . . . . . . . . . . . . . 6,491,725 8,337,89030,000 Penske Automotive Group
Inc. . . . . . . . . . . . . . . . . . . . . . . . . 1,367,524 1,435,50033,300 Sally Beauty Holdings Inc.† . . . 264,056 624,70817,000 The Cheesecake Factory Inc. . . 553,064 819,0603,000 Tiffany & Co. . . . . . . . . . . . . . . . . . 171,090 311,850
13,000 United Natural Foods Inc.† . . . . 446,782 640,51052,000 Walgreens Boots Alliance Inc. . 1,540,167 3,776,24032,000 Wal-Mart Stores Inc. . . . . . . . . . . 1,618,504 3,160,000
33,060,595 45,972,477
Broadcasting — 2.2%241,800 CBS Corp., Cl. A, Voting. . . . . . . 7,240,203 14,348,412
2,000 Cogeco Inc.. . . . . . . . . . . . . . . . . . . 39,014 144,01017,334 Corus Entertainment Inc.,
OTC, Cl. B. . . . . . . . . . . . . . . . . . 30,215 159,6636,666 Corus Entertainment Inc.,
Toronto, Cl. B . . . . . . . . . . . . . . 12,406 62,046150,000 Entercom Communications
Corp., Cl. A. . . . . . . . . . . . . . . . . 1,685,698 1,620,00016,000 Gray Television Inc.† . . . . . . . . . . 14,422 268,00019,250 Liberty Broadband Corp.,
Cl. A† . . . . . . . . . . . . . . . . . . . . . . 608,060 1,637,21364,192 Liberty Broadband Corp.,
Cl. C† . . . . . . . . . . . . . . . . . . . . . . 2,226,060 5,466,59145,876 Liberty Media Corp.-
Liberty Formula One, Cl. A†. 1,199,529 1,501,06352,250 Liberty Media Corp.-
Liberty Formula One, Cl. C†. 1,197,836 1,784,860
Shares CostMarketValue
75,000 Liberty Media Corp.-Liberty SiriusXM, Cl. A† . . . . $ 1,647,568 $ 2,974,500
158,000 Liberty Media Corp.-Liberty SiriusXM, Cl. C† . . . . 4,034,747 6,266,280
292,400 MSG Networks Inc., Cl. A† . . . . 1,675,251 5,921,10015,000 Nexstar Media Group Inc.,
Cl. A . . . . . . . . . . . . . . . . . . . . . . . 920,250 1,173,000165,000 Pandora Media Inc.† . . . . . . . . . . 1,101,336 795,30020,000 Sinclair Broadcast Group Inc.,
Cl. A . . . . . . . . . . . . . . . . . . . . . . . 615,042 757,00085,200 Television Broadcasts Ltd.. . . . . 339,712 306,434
24,587,349 45,185,472
Specialty Chemicals — 2.1%12,320 AdvanSix Inc.† . . . . . . . . . . . . . . . 146,942 518,30211,000 Ashland Global Holdings Inc. . . 541,523 783,20015,000 Axalta Coating Systems Ltd.† . 480,845 485,40025,640 DowDuPont Inc. . . . . . . . . . . . . . . 854,362 1,826,081
390,000 Ferro Corp.† . . . . . . . . . . . . . . . . . . 4,400,557 9,200,1008,000 FMC Corp. . . . . . . . . . . . . . . . . . . . . 136,430 757,280
34,000 H.B. Fuller Co. . . . . . . . . . . . . . . . . 1,044,523 1,831,58070,000 International Flavors &
Fragrances Inc.. . . . . . . . . . . . . 4,638,227 10,682,700250,000 OMNOVA Solutions Inc.†. . . . . . 1,510,742 2,500,000172,800 Sensient Technologies Corp. . . 7,455,318 12,640,32018,000 SGL Carbon SE† . . . . . . . . . . . . . . 252,978 245,9932,000 The Chemours Co. . . . . . . . . . . . . 22,594 100,120
25,000 Valvoline Inc. . . . . . . . . . . . . . . . . . 478,301 626,50021,963,342 42,197,576
Hotels and Gaming — 1.7%16,000 Accor SA . . . . . . . . . . . . . . . . . . . . . 549,282 825,49445,000 Belmond Ltd., Cl. A† . . . . . . . . . . 621,367 551,25090,000 Genting Singapore plc . . . . . . . . 74,910 88,1538,000 Hyatt Hotels Corp., Cl. A† . . . . . 263,258 588,320
20,000 ILG Inc. . . . . . . . . . . . . . . . . . . . . . . 338,287 569,60013,095 International Game
Technology plc . . . . . . . . . . . . . 246,136 347,148579,400 Ladbrokes Coral Group plc . . . . 2,329,980 1,422,95934,000 Las Vegas Sands Corp. . . . . . . . 632,350 2,362,660
4,451,000 Mandarin OrientalInternational Ltd. . . . . . . . . . . . 7,804,113 8,991,020
15,000 Marriott International, Inc.,Cl. A . . . . . . . . . . . . . . . . . . . . . . . 1,229,670 2,035,950
70,000 MGM China Holdings Ltd. . . . . . 137,917 211,89566,595 MGM Resorts International. . . . 1,726,639 2,223,607
188,800 Ryman Hospitality PropertiesInc. . . . . . . . . . . . . . . . . . . . . . . . . 5,121,573 13,030,976
200,000 The Hongkong & ShanghaiHotels Ltd. . . . . . . . . . . . . . . . . . 155,450 296,947
4,000 Wyndham Worldwide Corp. . . . 282,896 463,480
The Gabelli Equity Trust Inc.Schedule of Investments (Continued) — December 31, 2017
See accompanying notes to financial statements.
9

Shares CostMarketValue
COMMON STOCKS (Continued)Hotels and Gaming (Continued)
6,000 Wynn Resorts Ltd. . . . . . . . . . . . . $ 469,634 $ 1,011,54021,983,462 35,020,999
Aviation: Parts and Services — 1.6%41,666 Arconic Inc. . . . . . . . . . . . . . . . . . . 880,949 1,135,399
245,300 Curtiss-Wright Corp. . . . . . . . . . . 16,792,924 29,889,80525,500 KLX Inc.†. . . . . . . . . . . . . . . . . . . . . 1,033,565 1,740,375
18,707,438 32,765,579
Environmental Services — 1.5%35,000 Pentair plc. . . . . . . . . . . . . . . . . . . . 1,197,464 2,471,700
222,000 Republic Services Inc. . . . . . . . . 7,960,364 15,009,420153,600 Waste Management Inc. . . . . . . 5,303,785 13,255,680
14,461,613 30,736,800
Wireless Communications — 0.9%25,000 Altice USA Inc., Cl. A† . . . . . . . . 706,648 530,750
105,000 America Movil SAB de CV,Cl. L, ADR. . . . . . . . . . . . . . . . . . 735,232 1,800,750
99,000 Millicom International CellularSA, SDR . . . . . . . . . . . . . . . . . . . 6,382,128 6,686,009
150,000 NTT DoCoMo Inc.. . . . . . . . . . . . . 2,980,751 3,542,48946,075 Tim Participacoes SA, ADR. . . . 352,294 889,70830,000 T-Mobile US Inc.†. . . . . . . . . . . . . 1,241,494 1,905,300
104,600 United States Cellular Corp.† . . 4,965,942 3,936,09817,364,489 19,291,104
Telecommunication Services — 0.9%145,605 Liberty Global plc, Cl. A† . . . . . . 2,504,125 5,218,483382,893 Liberty Global plc, Cl. C† . . . . . . 7,953,868 12,957,099
10,457,993 18,175,582
Building and Construction — 0.8%92,790 Armstrong Flooring Inc.† . . . . . 1,634,297 1,570,00718,000 Assa Abloy AB, Cl. B . . . . . . . . . . 310,378 373,9075,000 Dycom Industries Inc.† . . . . . . . 413,996 557,150
80,000 Fortune Brands Home &Security Inc. . . . . . . . . . . . . . . . 2,239,525 5,475,200
91,659 Herc Holdings Inc.† . . . . . . . . . . . 3,275,866 5,738,77045,000 Layne Christensen Co.† . . . . . . . 573,982 564,750
152 Sika AG, Cl. B. . . . . . . . . . . . . . . . . 1,156,735 1,207,3279,604,779 15,487,111
Automotive — 0.8%88,000 General Motors Co. . . . . . . . . . . . 3,365,341 3,607,120
158,000 Navistar International Corp.† . . 4,003,563 6,775,04070,000 PACCAR Inc.. . . . . . . . . . . . . . . . . . 370,327 4,975,600
7,739,231 15,357,760
Computer Software and Services — 0.7%3,250 Alphabet Inc., Cl. C† . . . . . . . . . . 2,639,031 3,400,800
15,000 Blucora Inc.† . . . . . . . . . . . . . . . . . 74,987 331,500
Shares CostMarketValue
6,000 Check Point SoftwareTechnologies Ltd.† . . . . . . . . . $ 101,862 $ 621,720
4,733 CommerceHub Inc., Cl. A† . . . . 31,317 104,07913,466 CommerceHub Inc., Cl. C† . . . . 84,093 277,265
206,500 Hewlett Packard EnterpriseCo. . . . . . . . . . . . . . . . . . . . . . . . . 2,780,788 2,965,340
50,375 Internap Corp.† . . . . . . . . . . . . . . . 388,218 791,39123,000 InterXion Holding NV† . . . . . . . . 338,737 1,355,39012,000 Micro Focus International plc,
ADR† . . . . . . . . . . . . . . . . . . . . . . 364,238 403,08020,000 NCR Corp.†. . . . . . . . . . . . . . . . . . . 354,380 679,80020,900 Rockwell Automation Inc. . . . . . 648,748 4,103,71515,000 VeriFone Systems Inc.† . . . . . . . 329,752 265,650
8,136,151 15,299,730
Metals and Mining — 0.6%37,400 Agnico Eagle Mines Ltd. . . . . . . 1,530,570 1,727,13254,000 Barrick Gold Corp. . . . . . . . . . . . . 1,581,120 781,38030,000 Cleveland-Cliffs Inc.† . . . . . . . . . 296,432 216,30080,000 Freeport-McMoRan Inc.† . . . . . 1,408,020 1,516,8004,300 Materion Corp. . . . . . . . . . . . . . . . 97,512 208,980
50,000 New Hope Corp. Ltd. . . . . . . . . . . 67,580 97,531143,600 Newmont Mining Corp. . . . . . . . 5,120,536 5,387,872160,000 TimkenSteel Corp.† . . . . . . . . . . . 2,837,427 2,430,400140,000 Turquoise Hill Resources
Ltd.†. . . . . . . . . . . . . . . . . . . . . . . 726,343 480,20015,000 Vale SA, ADR . . . . . . . . . . . . . . . . . 171,892 183,450
13,837,432 13,030,045
Communications Equipment — 0.6%9,000 Apple Inc. . . . . . . . . . . . . . . . . . . . . 1,353,080 1,523,070
310,000 Corning Inc. . . . . . . . . . . . . . . . . . . 8,092,475 9,916,9009,445,555 11,439,970
Publishing — 0.5%1,100 Graham Holdings Co., Cl. B . . . 588,093 614,185
81,700 Meredith Corp. . . . . . . . . . . . . . . . 4,100,268 5,396,285125,000 News Corp., Cl. A . . . . . . . . . . . . . 1,939,129 2,026,250133,600 News Corp., Cl. B . . . . . . . . . . . . . 1,548,212 2,217,76040,000 The E.W. Scripps Co., Cl. A† . . 399,742 625,200
8,575,444 10,879,680
Agriculture — 0.5%200,000 Archer-Daniels-Midland Co. . . . 9,150,371 8,016,00013,000 Monsanto Co. . . . . . . . . . . . . . . . . 574,981 1,518,14010,000 The Mosaic Co. . . . . . . . . . . . . . . . 428,085 256,600
10,153,437 9,790,740
Transportation — 0.4%15,000 Daseke Inc.†. . . . . . . . . . . . . . . . . . 133,500 214,350
131,200 GATX Corp. . . . . . . . . . . . . . . . . . . . 4,730,843 8,155,3924,864,343 8,369,742
The Gabelli Equity Trust Inc.Schedule of Investments (Continued) — December 31, 2017
See accompanying notes to financial statements.
10

Shares CostMarketValue
COMMON STOCKS (Continued)Real Estate — 0.4%
25,000 Forest City Realty Trust Inc.,Cl. A . . . . . . . . . . . . . . . . . . . . . . . $ 514,096 $ 602,500
56,000 Griffin Industrial Realty Inc. . . . 542,694 2,055,200270,000 The St. Joe Co.† . . . . . . . . . . . . . . 4,963,197 4,873,500
6,019,987 7,531,200
Manufactured Housing and Recreational Vehicles — 0.1%5,000 Martin Marietta Materials Inc. . 106,125 1,105,200
30,000 Nobility Homes Inc. . . . . . . . . . . . 349,956 588,75042,000 Skyline Corp.† . . . . . . . . . . . . . . . . 256,482 539,700
712,563 2,233,650
Real Estate Investment Trusts — 0.1%15,000 Gaming and Leisure
Properties Inc. . . . . . . . . . . . . . 188,901 555,00029,000 Rayonier Inc. . . . . . . . . . . . . . . . . . 454,837 917,270
643,738 1,472,270
TOTAL COMMON STOCKS . . . . 1,062,884,251 1,851,950,493
CLOSED-END FUNDS — 0.7%130,000 Altaba Inc.†. . . . . . . . . . . . . . . . . . . 2,884,194 9,080,500
4,285 Royce Global Value Trust Inc. . 37,280 46,32130,000 Royce Value Trust Inc. . . . . . . . . 368,797 485,10090,302 The Central Europe, Russia,
and Turkey Fund Inc. . . . . . . . 2,597,549 2,202,466143,158 The New Germany Fund Inc. . . 1,865,297 2,784,423
7,753,117 14,598,810
TOTAL CLOSED-END FUNDS . . 7,753,117 14,598,810
CONVERTIBLE PREFERRED STOCKS — 0.0%Telecommunications — 0.0%
21,000 Cincinnati Bell Inc.,6.750%, Ser. B . . . . . . . . . . . . 515,202 1,071,000
RIGHTS — 0.0%Entertainment — 0.0%
139,123 Media General Inc., expire12/31/18†(b). . . . . . . . . . . . . . . 0 0
PrincipalAmount
U.S. GOVERNMENT OBLIGATIONS — 8.7%U.S. Cash Management Bills — 1.7%
$35,000,000 U.S. Cash Management Bills,1.220%††, 01/02/18 . . . . . . . 34,998,814 35,000,000
PrincipalAmount Cost
MarketValue
U.S. Treasury Bills — 7.0%$142,445,000 U.S. Treasury Bills,
1.065% to 1.405%††,01/04/18 to 03/29/18. . . . . . . $ 142,315,956 $ 142,319,893
TOTAL U.S. GOVERNMENTOBLIGATIONS. . . . . . . . . . . . . . 177,314,770 177,319,893
TOTAL INVESTMENTS — 100.0%. . . . . . . . . . . . $1,248,467,340 2,044,940,196
Other Assets and Liabilities (Net) . . . . . . . . . . . . . . . . . . . . . . . . 300,008
PREFERRED STOCK(12,520,529 preferred shares outstanding). . . . . . . . . . . . . . (412,913,225)
NET ASSETS — COMMON STOCK(252,112,464 common shares outstanding). . . . . . . . . . . . . $1,632,326,979
NET ASSET VALUE PER COMMON SHARE($1,632,326,979 ÷ 252,112,464 shares outstanding) . . . . . $ 6.47
(a) Securities, or a portion thereof, with a value of $56,967,830 were pledgedas collateral for futures contracts.
(b) Security is valued using significant unobservable inputs and is classifiedas Level 3 in the fair value hierarchy.
† Non-income producing security.†† Represents annualized yield at date of purchase.ADR American Depositary ReceiptSDR Swedish Depositary Receipt
Geographic Diversification% of Total
InvestmentsMarketValue
North America . . . . . . . . . . . . . . . 83.0% $1,697,346,434Europe . . . . . . . . . . . . . . . . . . . 13.2 269,124,267Japan . . . . . . . . . . . . . . . . . . . . 1.9 38,926,964Latin America . . . . . . . . . . . . . . . 1.9 38,562,694Asia/Pacific . . . . . . . . . . . . . . . . . 0.0* 700,912South Africa . . . . . . . . . . . . . . . . 0.0* 278,925Total Investments . . . . . . . . . . . . . 100.0% $2,044,940,196
* Amount represents less than 0.05%.
The Gabelli Equity Trust Inc.Schedule of Investments (Continued) — December 31, 2017
See accompanying notes to financial statements.
11
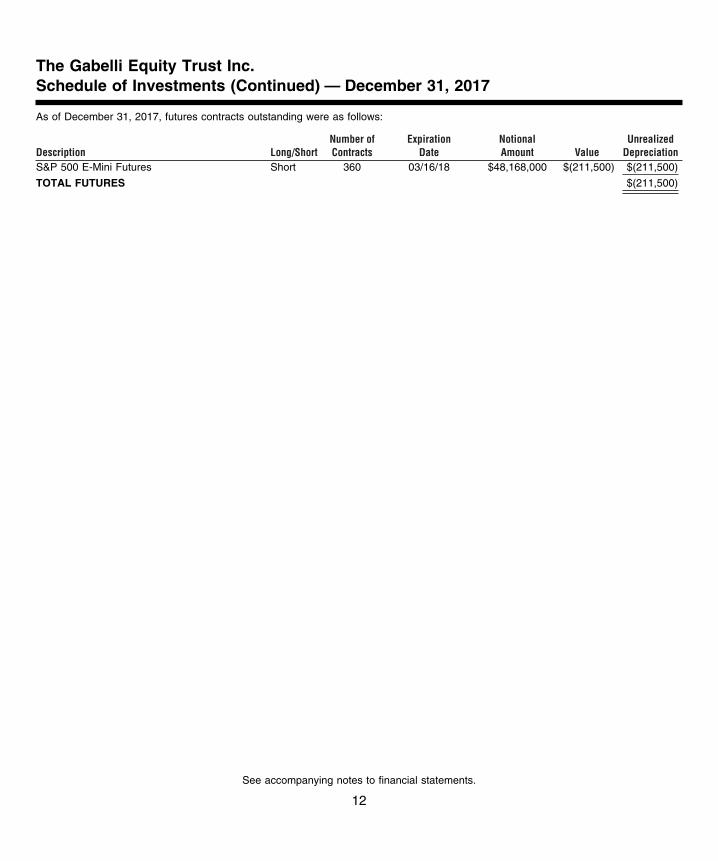
As of December 31, 2017, futures contracts outstanding were as follows:
Description Long/ShortNumber ofContracts
ExpirationDate
NotionalAmount Value
UnrealizedDepreciation
S&P 500 E-Mini Futures Short 360 03/16/18 $48,168,000 $(211,500) $(211,500)
TOTAL FUTURES $(211,500)
The Gabelli Equity Trust Inc.Schedule of Investments (Continued) — December 31, 2017
See accompanying notes to financial statements.
12
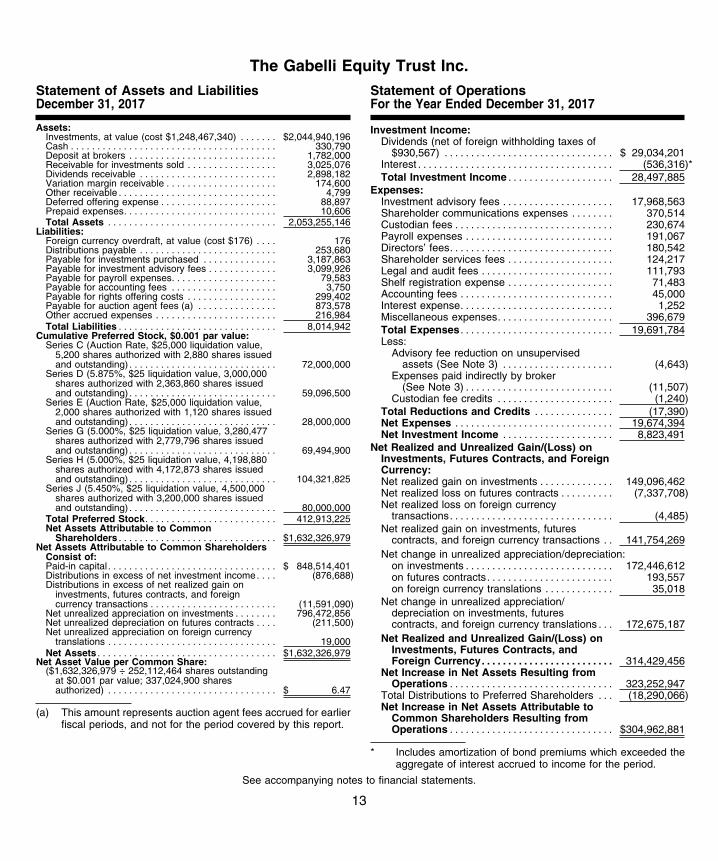
Assets:Investments, at value (cost $1,248,467,340) . . . . . . . $2,044,940,196Cash . . . . . . . . . . . . . . . . . . . . . . . . . . . . . . . . . . . . . . . 330,790Deposit at brokers . . . . . . . . . . . . . . . . . . . . . . . . . . . . 1,782,000Receivable for investments sold . . . . . . . . . . . . . . . . . 3,025,076Dividends receivable . . . . . . . . . . . . . . . . . . . . . . . . . . 2,898,182Variation margin receivable . . . . . . . . . . . . . . . . . . . . . 174,600Other receivable . . . . . . . . . . . . . . . . . . . . . . . . . . . . . . 4,799Deferred offering expense . . . . . . . . . . . . . . . . . . . . . . 88,897Prepaid expenses. . . . . . . . . . . . . . . . . . . . . . . . . . . . . 10,606Total Assets . . . . . . . . . . . . . . . . . . . . . . . . . . . . . . . . 2,053,255,146
Liabilities:Foreign currency overdraft, at value (cost $176) . . . . 176Distributions payable . . . . . . . . . . . . . . . . . . . . . . . . . . 253,680Payable for investments purchased . . . . . . . . . . . . . . 3,187,863Payable for investment advisory fees . . . . . . . . . . . . . 3,099,926Payable for payroll expenses. . . . . . . . . . . . . . . . . . . . 79,583Payable for accounting fees . . . . . . . . . . . . . . . . . . . . 3,750Payable for rights offering costs . . . . . . . . . . . . . . . . . 299,402Payable for auction agent fees (a) . . . . . . . . . . . . . . . 873,578Other accrued expenses . . . . . . . . . . . . . . . . . . . . . . . 216,984Total Liabilities . . . . . . . . . . . . . . . . . . . . . . . . . . . . . . 8,014,942
Cumulative Preferred Stock, $0.001 par value:Series C (Auction Rate, $25,000 liquidation value,
5,200 shares authorized with 2,880 shares issuedand outstanding) . . . . . . . . . . . . . . . . . . . . . . . . . . . . 72,000,000
Series D (5.875%, $25 liquidation value, 3,000,000shares authorized with 2,363,860 shares issuedand outstanding) . . . . . . . . . . . . . . . . . . . . . . . . . . . . 59,096,500
Series E (Auction Rate, $25,000 liquidation value,2,000 shares authorized with 1,120 shares issuedand outstanding) . . . . . . . . . . . . . . . . . . . . . . . . . . . . 28,000,000
Series G (5.000%, $25 liquidation value, 3,280,477shares authorized with 2,779,796 shares issuedand outstanding) . . . . . . . . . . . . . . . . . . . . . . . . . . . . 69,494,900
Series H (5.000%, $25 liquidation value, 4,198,880shares authorized with 4,172,873 shares issuedand outstanding) . . . . . . . . . . . . . . . . . . . . . . . . . . . . 104,321,825
Series J (5.450%, $25 liquidation value, 4,500,000shares authorized with 3,200,000 shares issuedand outstanding) . . . . . . . . . . . . . . . . . . . . . . . . . . . . 80,000,000
Total Preferred Stock. . . . . . . . . . . . . . . . . . . . . . . . . 412,913,225Net Assets Attributable to Common
Shareholders . . . . . . . . . . . . . . . . . . . . . . . . . . . . . . $1,632,326,979Net Assets Attributable to Common Shareholders
Consist of:Paid-in capital . . . . . . . . . . . . . . . . . . . . . . . . . . . . . . . . $ 848,514,401Distributions in excess of net investment income. . . . (876,688)Distributions in excess of net realized gain on
investments, futures contracts, and foreigncurrency transactions . . . . . . . . . . . . . . . . . . . . . . . . (11,591,090)
Net unrealized appreciation on investments . . . . . . . . 796,472,856Net unrealized depreciation on futures contracts . . . . (211,500)Net unrealized appreciation on foreign currency
translations . . . . . . . . . . . . . . . . . . . . . . . . . . . . . . . . 19,000Net Assets . . . . . . . . . . . . . . . . . . . . . . . . . . . . . . . . . . $1,632,326,979
Net Asset Value per Common Share:($1,632,326,979 ÷ 252,112,464 shares outstanding
at $0.001 par value; 337,024,900 sharesauthorized) . . . . . . . . . . . . . . . . . . . . . . . . . . . . . . . . $ 6.47
(a) This amount represents auction agent fees accrued for earlierfiscal periods, and not for the period covered by this report.
Investment Income:Dividends (net of foreign withholding taxes of
$930,567) . . . . . . . . . . . . . . . . . . . . . . . . . . . . . . . . $ 29,034,201Interest . . . . . . . . . . . . . . . . . . . . . . . . . . . . . . . . . . . . . (536,316)*Total Investment Income . . . . . . . . . . . . . . . . . . . . 28,497,885
Expenses:Investment advisory fees . . . . . . . . . . . . . . . . . . . . . 17,968,563Shareholder communications expenses . . . . . . . . 370,514Custodian fees . . . . . . . . . . . . . . . . . . . . . . . . . . . . . . 230,674Payroll expenses . . . . . . . . . . . . . . . . . . . . . . . . . . . . 191,067Directors’ fees. . . . . . . . . . . . . . . . . . . . . . . . . . . . . . . 180,542Shareholder services fees . . . . . . . . . . . . . . . . . . . . 124,217Legal and audit fees . . . . . . . . . . . . . . . . . . . . . . . . . 111,793Shelf registration expense . . . . . . . . . . . . . . . . . . . . 71,483Accounting fees . . . . . . . . . . . . . . . . . . . . . . . . . . . . . 45,000Interest expense. . . . . . . . . . . . . . . . . . . . . . . . . . . . . 1,252Miscellaneous expenses. . . . . . . . . . . . . . . . . . . . . . 396,679Total Expenses . . . . . . . . . . . . . . . . . . . . . . . . . . . . . 19,691,784Less:
Advisory fee reduction on unsupervisedassets (See Note 3) . . . . . . . . . . . . . . . . . . . . . (4,643)
Expenses paid indirectly by broker(See Note 3) . . . . . . . . . . . . . . . . . . . . . . . . . . . . (11,507)
Custodian fee credits . . . . . . . . . . . . . . . . . . . . . . (1,240)Total Reductions and Credits . . . . . . . . . . . . . . . (17,390)Net Expenses . . . . . . . . . . . . . . . . . . . . . . . . . . . . . . 19,674,394Net Investment Income . . . . . . . . . . . . . . . . . . . . . 8,823,491
Net Realized and Unrealized Gain/(Loss) onInvestments, Futures Contracts, and ForeignCurrency:Net realized gain on investments . . . . . . . . . . . . . . 149,096,462Net realized loss on futures contracts . . . . . . . . . . (7,337,708)Net realized loss on foreign currency
transactions. . . . . . . . . . . . . . . . . . . . . . . . . . . . . . . (4,485)Net realized gain on investments, futures
contracts, and foreign currency transactions . . 141,754,269Net change in unrealized appreciation/depreciation:
on investments . . . . . . . . . . . . . . . . . . . . . . . . . . . . 172,446,612on futures contracts. . . . . . . . . . . . . . . . . . . . . . . . 193,557on foreign currency translations . . . . . . . . . . . . . 35,018
Net change in unrealized appreciation/depreciation on investments, futurescontracts, and foreign currency translations . . . 172,675,187
Net Realized and Unrealized Gain/(Loss) onInvestments, Futures Contracts, andForeign Currency. . . . . . . . . . . . . . . . . . . . . . . . . 314,429,456
Net Increase in Net Assets Resulting fromOperations . . . . . . . . . . . . . . . . . . . . . . . . . . . . . . . 323,252,947
Total Distributions to Preferred Shareholders . . . (18,290,066)Net Increase in Net Assets Attributable to
Common Shareholders Resulting fromOperations . . . . . . . . . . . . . . . . . . . . . . . . . . . . . . . $304,962,881
* Includes amortization of bond premiums which exceeded theaggregate of interest accrued to income for the period.
The Gabelli Equity Trust Inc.
Statement of Assets and LiabilitiesDecember 31, 2017
Statement of OperationsFor the Year Ended December 31, 2017
See accompanying notes to financial statements.
13

Year EndedDecember 31, 2017
Year EndedDecember 31, 2016
Operations:Net investment income. . . . . . . . . . . . . . . . . . . . . . . . . . . . . . . . . . . . . . . . . . . . . . . . . . . . . . . . . $ 8,823,491 $ 15,423,713Net realized gain on investments, futures contracts, and foreign currency transactions. 141,754,269 131,917,570Net change in unrealized appreciation/depreciation on investments, futures contracts,
and foreign currency translations . . . . . . . . . . . . . . . . . . . . . . . . . . . . . . . . . . . . . . . . . . . . . . 172,675,187 34,137,256Net Increase in Net Assets Resulting from Operations. . . . . . . . . . . . . . . . . . . . . . . . . . 323,252,947 181,478,539
Distributions to Preferred Shareholders:Net investment income. . . . . . . . . . . . . . . . . . . . . . . . . . . . . . . . . . . . . . . . . . . . . . . . . . . . . . . . . (1,122,792) (2,007,644)Net realized gain . . . . . . . . . . . . . . . . . . . . . . . . . . . . . . . . . . . . . . . . . . . . . . . . . . . . . . . . . . . . . . (17,167,274) (14,203,236)Total Distributions to Preferred Shareholders . . . . . . . . . . . . . . . . . . . . . . . . . . . . . . . . . . (18,290,066) (16,210,880)Net Increase in Net Assets Attributable to Common Shareholders Resulting
from Operations. . . . . . . . . . . . . . . . . . . . . . . . . . . . . . . . . . . . . . . . . . . . . . . . . . . . . . . . . . . . 304,962,881 165,267,659
Distributions to Common Shareholders:Net investment income. . . . . . . . . . . . . . . . . . . . . . . . . . . . . . . . . . . . . . . . . . . . . . . . . . . . . . . . . (8,169,123) (16,172,854)Net realized gain . . . . . . . . . . . . . . . . . . . . . . . . . . . . . . . . . . . . . . . . . . . . . . . . . . . . . . . . . . . . . . (124,904,270) (114,416,126)Return of capital . . . . . . . . . . . . . . . . . . . . . . . . . . . . . . . . . . . . . . . . . . . . . . . . . . . . . . . . . . . . . . (965,800) (957,245)Total Distributions to Common Shareholders . . . . . . . . . . . . . . . . . . . . . . . . . . . . . . . . . . (134,039,193) (131,546,225)
Fund Share Transactions:Net increase from common shares issued in rights offering. . . . . . . . . . . . . . . . . . . . . . . . . 173,327,861 —Net decrease in net assets from preferred offering cost charged to capital . . . . . . . . . . . — (2,845,000)Net increase in net assets from common shares issued upon reinvestment of
distributions. . . . . . . . . . . . . . . . . . . . . . . . . . . . . . . . . . . . . . . . . . . . . . . . . . . . . . . . . . . . . . . . . 8,540,513 —Net increase in net assets from repurchase of preferred shares. . . . . . . . . . . . . . . . . . . . . 19,887 81,639Rights offering costs for common shares charged to paid-in capital. . . . . . . . . . . . . . . . . . (600,000) —Net Increase/(Decrease) in Net Assets from Fund Share Transactions . . . . . . . . . . . 181,288,261 (2,763,361)Net Increase in Net Assets Attributable to Common Shareholders . . . . . . . . . . . . . . 352,211,949 30,958,073
Net Assets Attributable to Common Shareholders:Beginning of year . . . . . . . . . . . . . . . . . . . . . . . . . . . . . . . . . . . . . . . . . . . . . . . . . . . . . . . . . . . . . 1,280,115,030 1,249,156,957End of year (including undistributed net investment income of $0 and $0,
respectively) . . . . . . . . . . . . . . . . . . . . . . . . . . . . . . . . . . . . . . . . . . . . . . . . . . . . . . . . . . . . . . . . $1,632,326,979 $1,280,115,030
The Gabelli Equity Trust Inc.
Statement of Changes in Net Assets Attributable to Common Shareholders
See accompanying notes to financial statements.
14

Year Ended December 31,2017 2016 2015 2014 2013
Operating Performance:Net asset value, beginning of year. . . . . . . . . . . . . . . . . . . . . . . . . . . . . . . $ 5.84 $ 5.70 $ 6.78 $ 7.23 $ 5.60Net investment income . . . . . . . . . . . . . . . . . . . . . . . . . . . . . . . . . . . . . . 0.04 0.07 0.06 0.07 0.06Net realized and unrealized gain/(loss) on investments, futures contracts,
swap contracts, and foreign currency transactions. . . . . . . . . . . . . . . . . 1.42 0.75 (0.44) 0.30 2.26Total from investment operations . . . . . . . . . . . . . . . . . . . . . . . . . . . . . . . 1.46 0.82 (0.38) 0.37 2.32
Distributions to Preferred Shareholders: (a)Net investment income . . . . . . . . . . . . . . . . . . . . . . . . . . . . . . . . . . . . . . (0.00)(b) (0.01) (0.01) (0.01) (0.01)Net realized gain . . . . . . . . . . . . . . . . . . . . . . . . . . . . . . . . . . . . . . . . . . . (0.08) (0.06) (0.05) (0.05) (0.06)Total distributions to preferred shareholders . . . . . . . . . . . . . . . . . . . . . . . (0.08) (0.07) (0.06) (0.06) (0.07)
Net Increase/(Decrease) in Net Assets Attributable to CommonShareholders Resulting from Operations . . . . . . . . . . . . . . . . . . . . . . . . 1.38 0.75 (0.44) 0.31 2.25
Distributions to Common Shareholders:Net investment income . . . . . . . . . . . . . . . . . . . . . . . . . . . . . . . . . . . . . . (0.04) (0.08) (0.05) (0.05) (0.05)Net realized gain . . . . . . . . . . . . . . . . . . . . . . . . . . . . . . . . . . . . . . . . . . . (0.57) (0.52) (0.44) (0.49) (0.57)Return of capital . . . . . . . . . . . . . . . . . . . . . . . . . . . . . . . . . . . . . . . . . . . (0.00)(b) (0.00)(b) (0.15) (0.10) —Total distributions to common shareholders . . . . . . . . . . . . . . . . . . . . . . . (0.61) (0.60) (0.64) (0.64) (0.62)
Fund Share Transactions:Increase/decrease in net asset value from common share transactions . . . . (0.14) — — (0.12) 0.00(b)Increase in net asset value from repurchase of preferred shares . . . . . . . . . 0.00(b) 0.00(b) 0.00(b) 0.00(b) 0.00(b)Offering costs and adjustment to offering costs for preferred shares
charged to paid-in capital . . . . . . . . . . . . . . . . . . . . . . . . . . . . . . . . . . . — (0.01) — — 0.00(b)Offering costs for common shares charged to paid-in capital . . . . . . . . . . . (0.00)(b) — — — —Total Fund share transactions . . . . . . . . . . . . . . . . . . . . . . . . . . . . . . . . . . (0.14) (0.01) 0.00(b) (0.12) 0.00(b)
Net Asset Value Attributable to Common Shareholders, End of Year $ 6.47 $ 5.84 $ 5.70 $ 6.78 $ 7.23NAV total return † . . . . . . . . . . . . . . . . . . . . . . . . . . . . . . . . . . . . . . . . . . 24.64% 13.66% (6.85)% 4.68% 41.90%Market value, end of year . . . . . . . . . . . . . . . . . . . . . . . . . . . . . . . . . . . . . $ 6.19 $ 5.52 $ 5.31 $ 6.47 $ 7.75Investment total return †† . . . . . . . . . . . . . . . . . . . . . . . . . . . . . . . . . . . . 24.65% 15.71% (8.54)% (6.08)% 52.44%
Ratios to Average Net Assets and Supplemental Data:Net assets including liquidation value of preferred shares,
end of year (in 000’s) . . . . . . . . . . . . . . . . . . . . . . . . . . . . . . . . . . . . . . $2,045,240 $1,693,448 $1,582,823 $1,820,361 $1,712,663Net assets attributable to common shares, end of year (in 000’s) . . . . . . . . $1,632,327 $1,280,115 $1,249,157 $1,486,491 $1,378,436Ratio of net investment income to average net assets attributable to
common shares before preferred distributions . . . . . . . . . . . . . . . . . . . 0.64% 1.23% 0.91% 0.82% 0.84%Ratio of operating expenses to average net assets attributable to common
shares:before fee reductions . . . . . . . . . . . . . . . . . . . . . . . . . . . . . . . . . . . . . . 1.42%(c) 1.44%(c) 1.36%(c) 1.37% 1.40%net of fee reductions, if any . . . . . . . . . . . . . . . . . . . . . . . . . . . . . . . . . 1.42%(c) 1.44%(c) 1.25%(c) 1.33% 1.40%
Ratio of operating expenses to average net assets including liquidationvalue of preferred shares:before fee reductions . . . . . . . . . . . . . . . . . . . . . . . . . . . . . . . . . . . . . . 1.10%(c) 1.10%(c) 1.10%(c) 1.10% 1.10%net of fee reductions, if any . . . . . . . . . . . . . . . . . . . . . . . . . . . . . . . . . 1.10%(c) 1.10%(c) 1.01%(c) 1.07% 1.10%
Portfolio turnover rate . . . . . . . . . . . . . . . . . . . . . . . . . . . . . . . . . . . . . . . 11.4% 12.7% 8.9% 10.9% 10.0%
The Gabelli Equity Trust Inc.Financial Highlights
Selected data for a common share outstanding throughout each year:
See accompanying notes to financial statements.
15

Year Ended December 31,2017 2016 2015 2014 2013
Cumulative Preferred Stock:Auction Rate Series C PreferredLiquidation value, end of year (in 000’s) . . . . . . . . . . . . . . . . . . . . . . . . . . $ 72,000 $ 72,000 $ 72,000 $ 72,000 $ 72,000Total shares outstanding (in 000’s) . . . . . . . . . . . . . . . . . . . . . . . . . . . . . . 3 3 3 3 3Liquidation preference per share. . . . . . . . . . . . . . . . . . . . . . . . . . . . . . . . $ 25,000 $ 25,000 $ 25,000 $ 25,000 $ 25,000Liquidation value(d). . . . . . . . . . . . . . . . . . . . . . . . . . . . . . . . . . . . . . . . . $ 25,000 $ 25,000 $ 25,000 $ 25,000 $ 25,000Asset coverage per share(e) . . . . . . . . . . . . . . . . . . . . . . . . . . . . . . . . . . . $123,830 $102,426 $118,593 $136,308 $128,1065.875% Series D PreferredLiquidation value, end of year (in 000’s) . . . . . . . . . . . . . . . . . . . . . . . . . . $ 59,097 $ 59,097 $ 59,097 $ 59,097 $ 59,097Total shares outstanding (in 000’s) . . . . . . . . . . . . . . . . . . . . . . . . . . . . . . 2,364 2,364 2,364 2,364 2,364Liquidation preference per share. . . . . . . . . . . . . . . . . . . . . . . . . . . . . . . . $ 25.00 $ 25.00 $ 25.00 $ 25.00 $ 25.00Average market value(f) . . . . . . . . . . . . . . . . . . . . . . . . . . . . . . . . . . . . . . $ 26.16 $ 26.22 $ 25.69 $ 25.21 $ 25.27Asset coverage per share(e) . . . . . . . . . . . . . . . . . . . . . . . . . . . . . . . . . . . $ 123.83 $ 102.43 $ 118.59 $ 136.31 $ 128.11Auction Rate Series E PreferredLiquidation value, end of year (in 000’s) . . . . . . . . . . . . . . . . . . . . . . . . . . $ 28,000 $ 28,000 $ 28,000 $ 28,000 $ 28,000Total shares outstanding (in 000’s) . . . . . . . . . . . . . . . . . . . . . . . . . . . . . . 1 1 1 1 1Liquidation preference per share. . . . . . . . . . . . . . . . . . . . . . . . . . . . . . . . $ 25,000 $ 25,000 $ 25,000 $ 25,000 $ 25,000Liquidation value(d). . . . . . . . . . . . . . . . . . . . . . . . . . . . . . . . . . . . . . . . . $ 25,000 $ 25,000 $ 25,000 $ 25,000 $ 25,000Asset coverage per share(e) . . . . . . . . . . . . . . . . . . . . . . . . . . . . . . . . . . . $123,830 $102,426 $118,593 $136,308 $128,1065.000% Series G PreferredLiquidation value, end of year (in 000’s) . . . . . . . . . . . . . . . . . . . . . . . . . . $ 69,495 $ 69,743 $ 69,925 $ 70,099 $ 70,373Total shares outstanding (in 000’s) . . . . . . . . . . . . . . . . . . . . . . . . . . . . . . 2,780 2,791 2,797 2,804 2,815Liquidation preference per share. . . . . . . . . . . . . . . . . . . . . . . . . . . . . . . . $ 25.00 $ 25.00 $ 25.00 $ 25.00 $ 25.00Average market value(f) . . . . . . . . . . . . . . . . . . . . . . . . . . . . . . . . . . . . . . $ 24.50 $ 24.67 $ 23.78 $ 23.32 $ 23.91Asset coverage per share(e) . . . . . . . . . . . . . . . . . . . . . . . . . . . . . . . . . . . $ 123.83 $ 102.43 $ 118.59 $ 136.31 $ 128.115.000% Series H PreferredLiquidation value, end of year (in 000’s) . . . . . . . . . . . . . . . . . . . . . . . . . . $104,322 $104,494 $104,644 $104,674 $104,757Total shares outstanding (in 000’s) . . . . . . . . . . . . . . . . . . . . . . . . . . . . . . 4,173 4,180 4,186 4,187 4,190Liquidation preference per share. . . . . . . . . . . . . . . . . . . . . . . . . . . . . . . . $ 25.00 $ 25.00 $ 25.00 $ 25.00 $ 25.00Average market value(f) . . . . . . . . . . . . . . . . . . . . . . . . . . . . . . . . . . . . . . $ 24.64 $ 25.00 $ 24.33 $ 22.82 $ 23.85Asset coverage per share(e) . . . . . . . . . . . . . . . . . . . . . . . . . . . . . . . . . . . $ 123.83 $ 102.43 $ 118.59 $ 136.31 $ 128.115.450% Series J PreferredLiquidation value, end of period (in 000’s). . . . . . . . . . . . . . . . . . . . . . . . . $ 80,000 $ 80,000 — — —Total shares outstanding (in 000’s) . . . . . . . . . . . . . . . . . . . . . . . . . . . . . . 3,200 3,200 — — —Liquidation preference per share. . . . . . . . . . . . . . . . . . . . . . . . . . . . . . . . $ 25.00 $ 25.00 — — —Average market value(f) . . . . . . . . . . . . . . . . . . . . . . . . . . . . . . . . . . . . . . $ 25.36 $ 25.43 — — —Asset coverage per share(e) . . . . . . . . . . . . . . . . . . . . . . . . . . . . . . . . . . . $ 123.83 $ 102.43 — — —Asset Coverage(g) . . . . . . . . . . . . . . . . . . . . . . . . . . . . . . . . . . . . . . . . . 495% 410% 474% 545% 512%
† Based on net asset value per share, adjusted for reinvestment of distributions at net asset value on the ex-dividend dates and adjustments for the rightsoffering.
†† Based on market value per share, adjusted for reinvestment of distributions at prices determined under the Fund’s dividend reinvestment plan and adjustmentsfor the rights offering.
(a) Calculated based on average common shares outstanding on the record dates throughout the years.(b) Amount represents less than $0.005 per share.(c) The Fund received credits from a designated broker who agreed to pay certain Fund operating expenses. For the years ended December 31, 2017, 2016,
and 2015, there was no impact on the expense ratios.(d) Since February 2008, the weekly auctions have failed. Holders that have submitted orders have not been able to sell any or all of their shares in the
auction.(e) Asset coverage per share is calculated by combining all series of preferred stock.(f) Based on weekly prices.(g) Asset coverage is calculated by combining all series of preferred stock.
The Gabelli Equity Trust Inc.Financial Highlights (Continued)
See accompanying notes to financial statements.
16
1. Organization. The Gabelli Equity Trust Inc. (the “Fund”) is a non-diversified closed-end management investmentcompany organized as a Maryland corporation on May 20, 1986 and registered under the Investment CompanyAct of 1940, as amended (the “1940 Act”), whose primary objective is long term growth of capital with incomeas a secondary objective. Investment operations commenced on August 21, 1986.
The Fund will invest at least 80% of its assets in equity securities under normal market conditions (the “80%Policy”). The 80% Policy may be changed without shareholder approval. The Fund will provide shareholderswith notice at least sixty days prior to the implementation of any changes in the 80% Policy.
2. Significant Accounting Policies. As an investment company, the Fund follows the investment companyaccounting and reporting guidance, which is part of U.S. generally accepted accounting principles (“GAAP”)that may require the use of management estimates and assumptions in the preparation of its financial statements.Actual results could differ from those estimates. The following is a summary of significant accounting policiesfollowed by the Fund in the preparation of its financial statements.
Security Valuation. Portfolio securities listed or traded on a nationally recognized securities exchange or tradedin the U.S. over-the-counter market for which market quotations are readily available are valued at the lastquoted sale price or a market’s official closing price as of the close of business on the day the securities arebeing valued. If there were no sales that day, the security is valued at the average of the closing bid and askedprices or, if there were no asked prices quoted on that day, then the security is valued at the closing bid priceon that day. If no bid or asked prices are quoted on such day, the security is valued at the most recentlyavailable price or, if the Board of Directors (the “Board”) so determines, by such other method as the Boardshall determine in good faith to reflect its fair market value. Portfolio securities traded on more than one nationalsecurities exchange or market are valued according to the broadest and most representative market, as determinedby Gabelli Funds, LLC (the “Adviser”).
Portfolio securities primarily traded on a foreign market are generally valued at the preceding closing valuesof such securities on the relevant market, but may be fair valued pursuant to procedures established by theBoard if market conditions change significantly after the close of the foreign market, but prior to the close ofbusiness on the day the securities are being valued. Debt obligations for which market quotations are readilyavailable are valued at the average of the latest bid and asked prices. If there were no asked prices quotedon such day, the security is valued using the closing bid price, unless the Board determines such amount doesnot reflect the securities’ fair value, in which case these securities will be fair valued as determined by theBoard. Certain securities are valued principally using dealer quotations. Futures contracts are valued at theclosing settlement price of the exchange or board of trade on which the applicable contract is traded. OTCfutures and options on futures for which market quotations are readily available will be valued by quotationsreceived from a pricing service or, if no quotations are available from a pricing service, by quotations obtainedfrom one or more dealers in the instrument in question by the Adviser.
Securities and assets for which market quotations are not readily available are fair valued as determined bythe Board. Fair valuation methodologies and procedures may include, but are not limited to: analysis and reviewof available financial and non-financial information about the company; comparisons with the valuation andchanges in valuation of similar securities, including a comparison of foreign securities with the equivalent U.S.dollar value American Depositary Receipt securities at the close of the U.S. exchange; and evaluation of anyother information that could be indicative of the value of the security.
The Gabelli Equity Trust Inc.Notes to Financial Statements
17

The inputs and valuation techniques used to measure fair value of the Fund’s investments are summarizedinto three levels as described in the hierarchy below:
• Level 1 — quoted prices in active markets for identical securities;• Level 2 — other significant observable inputs (including quoted prices for similar securities, interest
rates, prepayment speeds, credit risk, etc.); and• Level 3 — significant unobservable inputs (including the Board’s determinations as to the fair value
of investments).
A financial instrument’s level within the fair value hierarchy is based on the lowest level of any input bothindividually and in the aggregate that is significant to the fair value measurement. The inputs or methodologyused for valuing securities are not necessarily an indication of the risk associated with investing in those securities.The summary of the Fund’s investments in securities and other financial instruments by inputs used to valuethe Fund’s investments as of December 31, 2017 is as follows:
Valuation InputsLevel 1
Quoted PricesLevel 2 Other Significant
Observable InputsLevel 3 Significant
Unobservable InputsTotal Market Value
at 12/31/17INVESTMENTS IN SECURITIES:ASSETS (Market Value):Common Stocks:
Aerospace and Defense $ 46,721,390 — $75,087 $ 46,796,477Business Services 58,653,042 — 0 58,653,042Electronics 46,951,168 $ 468,800 — 47,419,968Energy and Utilities 79,226,909 — 0 79,226,909Manufactured Housing and Recreational
Vehicles 1,644,900 588,750 — 2,233,650Other Industries (a) 1,617,620,447 — — 1,617,620,447
Total Common Stocks 1,850,817,856 1,057,550 75,087 1,851,950,493Closed-End Funds 14,598,810 — — 14,598,810Convertible Preferred Stocks (a) 1,071,000 — — 1,071,000Rights (a) — — 0 0U.S. Government Obligations — 177,319,893 — 177,319,893TOTAL INVESTMENTS IN SECURITIES –
ASSETS $1,866,487,666 $178,377,443 $75,087 $2,044,940,196
OTHER FINANCIAL INSTRUMENTS:*LIABILITIES (Net Unrealized Depreciation):
EQUITY CONTRACTSIndex Futures Contracts - Short Position $ (211,500) — — $ (211,500)
(a) Please refer to the Schedule of Investments (“SOI”) for the industry classifications of these portfolio holdings.* Other financial instruments are derivatives reflected in the SOI, such as options, futures, forwards, and swaps, which may be valued
at the unrealized appreciation/depreciation of the instrument.
The Fund did not have material transfers among Level 1, Level 2, and Level 3 during the year ended December 31, 2017.The Fund’s policy is to recognize transfers among Levels as of the beginning of the reporting period.
The Gabelli Equity Trust Inc.Notes to Financial Statements (Continued)
18

Additional Information to Evaluate Qualitative Information.
General. The Fund uses recognized industry pricing services – approved by the Board and unaffiliated withthe Adviser – to value most of its securities, and uses broker quotes provided by market makers of securitiesnot valued by these and other recognized pricing sources. Several different pricing feeds are received to valuedomestic equity securities, international equity securities, preferred equity securities, and fixed income securities.The data within these feeds are ultimately sourced from major stock exchanges and trading systems wherethese securities trade. The prices supplied by external sources are checked by obtaining quotations or actualtransaction prices from market participants. If a price obtained from the pricing source is deemed unreliable,prices will be sought from another pricing service or from a broker/dealer that trades that security or similarsecurities.
Fair Valuation. Fair valued securities may be common or preferred equities, warrants, options, rights, orfixed income obligations. Where appropriate, Level 3 securities are those for which market quotations are notavailable, such as securities not traded for several days, or for which current bids are not available, or whichare restricted as to transfer. When fair valuing a security, factors to consider include recent prices of comparablesecurities that are publicly traded, reliable prices of securities not publicly traded, the use of valuation models,current analyst reports, valuing the income or cash flow of the issuer, or cost if the preceding factors do notapply. A significant change in the unobservable inputs could result in a lower or higher value in Level 3 securities.The circumstances of Level 3 securities are frequently monitored to determine if fair valuation measures continueto apply.
The Adviser reports quarterly to the Board the results of the application of fair valuation policies and procedures.These may include backtesting the prices realized in subsequent trades of these fair valued securities to fairvalues previously recognized.
Derivative Financial Instruments. The Fund may engage in various portfolio investment strategies by investingin derivative financial instruments for the purposes of increasing the income of the Fund, hedging against changesin the value of its portfolio securities and in the value of securities it intends to purchase, or hedging againsta specific transaction with respect to either the currency in which the transaction is denominated or anothercurrency. Investing in certain derivative financial instruments, including participation in the options, futures, orswap markets, entails certain execution, liquidity, hedging, tax, and securities, interest, credit, or currency marketrisks. Losses may arise if the Adviser’s prediction of movements in the direction of the securities, foreign currency,and interest rate markets is inaccurate. Losses may also arise if the counterparty does not perform its dutiesunder a contract, or, in the event of default, the Fund may be delayed in or prevented from obtaining paymentsor other contractual remedies owed to it under derivative contracts. The creditworthiness of the counterpartiesis closely monitored in order to minimize these risks. Participation in derivative transactions involves investmentrisks, transaction costs, and potential losses to which the Fund would not be subject absent the use of thesestrategies. The consequences of these risks, transaction costs, and losses may have a negative impact onthe Fund’s ability to pay distributions.
Collateral requirements differ by type of derivative. Collateral requirements are set by the broker or exchangeclearing house for exchange traded derivatives, while collateral terms are contract specific for derivatives tradedover-the-counter. Securities pledged to cover obligations of the Fund under derivative contracts are noted in
The Gabelli Equity Trust Inc.Notes to Financial Statements (Continued)
19

the Schedule of Investments. Cash collateral, if any, pledged for the same purpose will be reported separatelyin the Statement of Assets and Liabilities.
The Fund’s policy with respect to offsetting is that, absent an event of default by the counterparty or a terminationof the agreement, the master agreement does not result in an offset of reported amounts of financial assetsand financial liabilities in the Statement of Assets and Liabilities across transactions between the Fund andthe applicable counterparty. The enforceability of the right to offset may vary by jurisdiction.
The Fund’s derivative contracts held at December 31, 2017, if any, are not accounted for as hedging instrumentsunder GAAP and are disclosed in the Schedule of Investments.
Swap Agreements. The Fund may enter into equity contract for difference swap transactions for the purposeof increasing the income of the Fund. The use of swaps is a highly specialized activity that involves investmenttechniques and risks different from those associated with ordinary portfolio security transactions. In an equitycontract for difference swap, a set of future cash flows is exchanged between two counterparties. One of thesecash flow streams will typically be based on a reference interest rate combined with the performance of anotional value of shares of a stock. The other will be based on the performance of the shares of a stock.Depending on the general state of short term interest rates and the returns on the Fund’s portfolio securitiesat the time an equity contract for difference swap transaction reaches its scheduled termination date, there isa risk that the Fund will not be able to obtain a replacement transaction or that the terms of the replacementwill not be as favorable as on the expiring transaction.
During the year ended December 31, 2017, the Fund held no investments in equity contract for differenceswap agreements.
Futures Contracts. The Fund may engage in futures contracts for the purpose of hedging against changesin the value of its portfolio securities and in the value of securities it intends to purchase. Upon entering intoa futures contract, the Fund is required to deposit with the broker an amount of cash or cash equivalents equalto a certain percentage of the contract amount. This is known as the “initial margin.” Subsequent payments(“variation margin”) are made or received by the Fund each day, depending on the daily fluctuations in thevalue of the contract, and are included in unrealized appreciation/depreciation on futures contracts. The Fundrecognizes a realized gain or loss when the contract is closed.
There are several risks in connection with the use of futures contracts as a hedging instrument. The changein value of futures contracts primarily corresponds with the value of their underlying instruments, which maynot correlate with the change in value of the hedged investments. In addition, there is the risk that the Fundmay not be able to enter into a closing transaction because of an illiquid secondary market. Open positions infutures contracts at December 31, 2017 are presented within the Schedule of Investments.
During the year ended December 31, 2017, the Fund held an average monthly notional amount of equity futurescontracts of approximately $39,586,433 while outstanding.
As of December 31, 2017, the equity risk exposure associated with the futures contracts can be found in theStatement of Assets and Liabilities, under Assets, Variation margin receivable. For the year ended December 31, 2017,the effect of futures contracts with equity risk exposure can be found in the Statement of Operations, under
The Gabelli Equity Trust Inc.Notes to Financial Statements (Continued)
20

Net Realized and Unrealized Gain/(Loss) on Investments, Futures Contracts, and Foreign Currency, Net realizedloss on futures contracts, and Net change in unrealized appreciation/depreciation on futures contracts.
Limitations on the Purchase and Sale of Futures Contracts, Certain Options, and Swaps. Subject to theguidelines of the Board, the Fund may engage in “commodity interest” transactions (generally, transactions infutures, certain options, certain currency transactions, and certain types of swaps) only for bona fide hedgingor other permissible transactions in accordance with the rules and regulations of the Commodity Futures TradingCommission (“CFTC”). Pursuant to amendments by the CFTC to Rule 4.5 under the Commodity ExchangeAct (“CEA”), the Adviser has filed a notice of exemption from registration as a “commodity pool operator” withrespect to the Fund. The Fund and the Adviser are therefore not subject to registration or regulation as acommodity pool operator under the CEA. In addition, certain trading restrictions are now applicable to the Fundwhich permit the Fund to engage in commodity interest transactions that include (i) “bona fide hedging” transactions,as that term is defined and interpreted by the CFTC and its staff, without regard to the percentage of the Fund’sassets committed to margin and options premiums and (ii) non-bona fide hedging transactions, provided thatthe Fund does not enter into such non-bona fide hedging transactions if, immediately thereafter, either (a) thesum of the amount of initial margin deposits on the Fund’s existing futures positions or swaps positions andoption or swaption premiums would exceed 5% of the market value of the Fund’s liquidating value, after takinginto account unrealized profits and unrealized losses on any such transactions, or (b) the aggregate net notionalvalue of the Fund’s commodity interest transactions would not exceed 100% of the market value of the Fund’sliquidating value, after taking into account unrealized profits and unrealized losses on any such transactions.Therefore, in order to claim the Rule 4.5 exemption, the Fund is limited in its ability to invest in commodityfutures, options, and certain types of swaps (including securities futures, broad based stock index futures, andfinancial futures contracts). As a result, in the future the Fund will be more limited in its ability to use theseinstruments than in the past, and these limitations may have a negative impact on the ability of the Adviser tomanage the Fund, and on the Fund’s performance.
Investments in Other Investment Companies. The Fund may invest, from time to time, in shares of otherinvestment companies (or entities that would be considered investment companies but are excluded from thedefinition pursuant to certain exceptions under the 1940 Act) (the “Acquired Funds”) in accordance with the1940 Act and related rules. Shareholders in the Fund would bear the pro rata portion of the periodic expensesof the Acquired Funds in addition to the Fund’s expenses. For the year ended December 31, 2017, the Fund’spro rata portion of the periodic expenses charged by the Acquired Funds was approximately 1 basis point.
Foreign Currency Translations. The books and records of the Fund are maintained in U.S. dollars. Foreigncurrencies, investments, and other assets and liabilities are translated into U.S. dollars at current exchangerates. Purchases and sales of investment securities, income, and expenses are translated at the exchangerate prevailing on the respective dates of such transactions. Unrealized gains and losses that result from changesin foreign exchange rates and/or changes in market prices of securities have been included in unrealizedappreciation/depreciation on investments and foreign currency translations. Net realized foreign currency gainsand losses resulting from changes in exchange rates include foreign currency gains and losses between tradedate and settlement date on investment securities transactions, foreign currency transactions, and the differencebetween the amounts of interest and dividends recorded on the books of the Fund and the amounts actuallyreceived. The portion of foreign currency gains and losses related to fluctuation in exchange rates betweenthe initial purchase trade date and subsequent sale trade date is included in realized gain/(loss) on investments.
The Gabelli Equity Trust Inc.Notes to Financial Statements (Continued)
21
Foreign Securities. The Fund may directly purchase securities of foreign issuers. Investing in securities offoreign issuers involves special risks not typically associated with investing in securities of U.S. issuers. Therisks include possible revaluation of currencies, the inability to repatriate funds, less complete financial informationabout companies, and possible future adverse political and economic developments. Moreover, securities ofmany foreign issuers and their markets may be less liquid and their prices more volatile than securities ofcomparable U.S. issuers.
Foreign Taxes. The Fund may be subject to foreign taxes on income, gains on investments, or currency repatriation,a portion of which may be recoverable. The Fund will accrue such taxes and recoveries as applicable, basedupon its current interpretation of tax rules and regulations that exist in the markets in which it invests.
Restricted Securities. The Fund may invest up to 10% of its net assets in securities for which the marketsare restricted. Restricted securities include securities whose disposition is subject to substantial legal or contractualrestrictions. The sale of restricted securities often requires more time and results in higher brokerage chargesor dealer discounts and other selling expenses than the sale of securities eligible for trading on national securitiesexchanges or in the over-the-counter markets. Restricted securities may sell at a price lower than similar securitiesthat are not subject to restrictions on resale. Securities freely saleable among qualified institutional investorsunder special rules adopted by the SEC may be treated as liquid if they satisfy liquidity standards establishedby the Board. The continued liquidity of such securities is not as well assured as that of publicly traded securities,and, accordingly, the Board will monitor their liquidity. At December 31, 2017, the Fund held no restrictedsecurities.
Securities Transactions and Investment Income. Securities transactions are accounted for on the trade datewith realized gain/(loss) on investments determined by using the identified cost method. Interest income (includingamortization of premium and accretion of discount) is recorded on an accrual basis. Premiums and discountson debt securities are amortized using the effective yield to maturity method. Dividend income is recorded onthe ex-dividend date, except for certain dividends from foreign securities that are recorded as soon after theex-dividend date as the Fund becomes aware of such dividends.
Custodian Fee Credits and Interest Expense. When cash balances are maintained in the custody account,the Fund receives credits which are used to offset custodian fess. The gross expenses paid under the custodyarrangement are included in custodian fees in the Statement of Operations with the corresponding expenseoffset, if any, shown as “Custodian fee credits.” When cash balances are overdrawn, the Fund is charged anoverdraft fee of 110% of the 90 day U.S. Treasury Bill rate on outstanding balances. This amount, if any, wouldbe included in the Statement of Operations.
Distributions to Shareholders. Distributions to common shareholders are recorded on the ex-dividend date.Distributions to shareholders are based on income and capital gains as determined in accordance with federalincome tax regulations, which may differ from income and capital gains as determined under GAAP. Thesedifferences are primarily due to differing treatments of income and gains on various investment securities andforeign currency transactions held by the Fund, timing differences, and differing characterizations of distributionsmade by the Fund. Distributions from net investment income for federal income tax purposes include net realizedgains on foreign currency transactions. These book/tax differences are either temporary or permanent in nature.To the extent these differences are permanent, adjustments are made to the appropriate capital accounts inthe period when the differences arise. Permanent differences were primarily due to tax treatment of currency
The Gabelli Equity Trust Inc.Notes to Financial Statements (Continued)
22
gains and losses, disallowed expenses, and investments in partnerships and real estate securities. These reclassificationshave no impact on the NAV of the Fund. For the year ended December 31, 2017, reclassifications were madeto decrease distributions in excess of net investment income by $282,311 and increase distributions in excessof net realized gain on investments, future contracts, and foreign currency transactions by $765,544, with anoffsetting adjustment to paid-in capital.
Under the Fund’s current common share distribution policy, the Fund declares and pays quarterly distributionsfrom net investment income, capital gains, and paid-in capital. The actual source of the distribution is determinedafter the end of the year. Pursuant to this policy, distributions during the year may be made in excess of requireddistributions. To the extent such distributions are made from current earnings and profits, they are consideredordinary income or long term capital gains. The Fund’s current distribution policy may restrict the Fund’s abilityto pass through to shareholders all of its net realized long term capital gains as a Capital Gain Dividend andmay cause such gains to be treated as ordinary income. Distributions sourced from paid-in capital should notbe considered as dividend yield or the total return from an investment in the Fund. The Board will continue tomonitor the Fund’s distribution level, taking into consideration the Fund’s NAV and the financial market environment.The Fund’s distribution policy is subject to modification by the Board at any time.
Distributions to shareholders of the Fund’s Series C Auction Rate Cumulative Preferred Stock, 5.875% Series DCumulative Preferred Stock, Series E Auction Rate Cumulative Preferred Stock, 5.000% Series G CumulativePreferred Stock, 5.000% Series H Cumulative Preferred Stock, and 5.450% Series J Cumulative PreferredStock (“Preferred Stock”) are recorded on a daily basis and are determined as described in Note 5.
The tax character of distributions paid during the years ended December 31, 2017 and 2016 was as follows:
Year EndedDecember 31, 2017
Year EndedDecember 31, 2016
Common Preferred Common PreferredDistributions paid from:Ordinary income (inclusive of short term capital gains) . . . . . . . . . . $ 8,169,123 $ 1,122,792 $ 18,270,058 $ 2,267,984Net long term capital gains . . . . . . . . . . . . . . . . . . . . . . . . . . . . . . . . . . 124,904,270 17,167,274 112,318,922 13,942,896Return of capital. . . . . . . . . . . . . . . . . . . . . . . . . . . . . . . . . . . . . . . . . . . . 965,800 — 957,245 —Total distributions paid . . . . . . . . . . . . . . . . . . . . . . . . . . . . . . . . . . . . . . $134,039,193 $18,290,066 $131,546,225 $16,210,880
Provision for Income Taxes. The Fund intends to continue to qualify as a regulated investment companyunder Subchapter M of the Internal Revenue Code of 1986, as amended (the “Code”). It is the policy of theFund to comply with the requirements of the Code applicable to regulated investment companies and to distributesubstantially all of its net investment company taxable income and net capital gains. Therefore, no provisionfor federal income taxes is required.
As of December 31, 2017, the components of accumulated earnings/losses on a tax basis were as follows:
Net unrealized appreciation on investments, futures contracts, and foreigncurrency translations . . . . . . . . . . . . . . . . . . . . . . . . . . . . . . . . . . . . . . . . . . . . . . . . . . $784,066,258
Other temporary differences* . . . . . . . . . . . . . . . . . . . . . . . . . . . . . . . . . . . . . . . . . . . . . (253,680)Total. . . . . . . . . . . . . . . . . . . . . . . . . . . . . . . . . . . . . . . . . . . . . . . . . . . . . . . . . . . . . . . . . . . $783,812,578
* Other temporary differences are due to preferred share class distribution payables.
The Gabelli Equity Trust Inc.Notes to Financial Statements (Continued)
23
At December 31, 2017, the temporary differences between book basis and tax basis unrealized appreciationwere primarily due to deferral of losses from wash sales for tax purposes, adjustments on the sale of securitiesno longer deemed passive foreign investment companies, and basis adjustments on investments inpartnerships.
The following summarizes the tax cost of investments and the related net unrealized appreciation at December 31, 2017:
Cost
GrossUnrealized
Appreciation
GrossUnrealized
DepreciationNet UnrealizedAppreciation
Investments and derivative instruments . . . . . . . $1,260,681,438 $844,668,829 $(60,621,571) $784,047,258
The Fund is required to evaluate tax positions taken or expected to be taken in the course of preparing theFund’s tax returns to determine whether the tax positions are “more-likely-than-not” of being sustained by theapplicable tax authority. Income tax and related interest and penalties would be recognized by the Fund astax expense in the Statement of Operations if the tax positions were deemed not to meet the more-likely-than-notthreshold. For the year ended December 31, 2017, the Fund did not incur any income tax, interest, or penalties.As of December 31, 2017, the Adviser has reviewed all open tax years and concluded that there was no impactto the Fund’s net assets or results of operations. The Fund’s federal and state tax returns for the prior threefiscal years remain open, subject to examination. On an ongoing basis, the Adviser will monitor the Fund’s taxpositions to determine if adjustments to this conclusion are necessary.
3. Investment Advisory Agreement and Other Transactions. The Fund has entered into an investmentadvisory agreement (the “Advisory Agreement”) with the Adviser which provides that the Fund will pay theAdviser a fee, computed weekly and paid monthly, equal on an annual basis to 1.00% of the value of theFund’s average weekly net assets including the liquidation value of preferred stock. In accordance with theAdvisory Agreement, the Adviser provides a continuous investment program for the Fund’s portfolio and overseesthe administration of all aspects of the Fund’s business and affairs.
As per the approval of the Board, the Fund compensates officers of the Fund, who are employed by the Fundand are not employed by the Adviser (although the officers may receive incentive based variable compensationfrom affiliates of the Adviser). During the year ended December 31, 2017, the Fund paid or accrued $191,067in payroll expenses in the Statement of Operations.
The Adviser has agreed to reduce the management fee on the incremental assets attributable to the Series C,Series D, and Series E Preferred Stock (“C, D, and E Preferred Stock”) if the total return of the NAV of thecommon shares of the Fund, including distributions and advisory fee subject to reduction, does not exceedthe stated dividend rate of the C, D, and E Preferred Stock for the year. The Fund’s total return on the NAVof the common shares is monitored on a monthly basis to assess whether the total return on the NAV of thecommon shares exceeds the stated dividend rate of the C, D, and E Preferred Stock for the period. For theyear ended December 31, 2017, the Fund’s total return on the NAV of the common shares exceeded thedividend rate of the outstanding C, D, and E Preferred Stock. Thus, advisory fees of the C, D, and E PreferredStock were accrued.
During the year ended December 31, 2017, the Fund paid $42,212 in brokerage commissions on securitytrades to G.research, LLC, an affiliate of the Adviser.
The Gabelli Equity Trust Inc.Notes to Financial Statements (Continued)
24

During the year ended December 31, 2017, the Fund received credits from a designated broker who agreedto pay certain Fund operating expenses. The amount of such expenses paid through this directed brokeragearrangement during this period was $11,507.
The cost of calculating the Fund’s NAV per share is a Fund expense pursuant to the Advisory Agreementbetween the Fund and the Adviser. During the year ended December 31, 2017, the Fund paid or accrued$45,000 to the Adviser in connection with the cost of computing the Fund’s NAV.
There was a reduction in the advisory fee paid to the Adviser relating to certain portfolio holdings, i.e., unsupervisedassets, of the Fund with respect to which the Adviser transferred dispositive and voting control to the Fund’sProxy Voting Committee. During the year ended December 31, 2017, the Fund’s Proxy Voting Committeeexercised control and discretion over all rights to vote or consent with respect to such securities, and the Adviserreduced its fee with respect to such securities by $4,643.
The Fund pays each Director who is not considered an affiliated person an annual retainer of $15,000 plus$2,000 for each Board meeting attended. Each Director is reimbursed by the Fund for any out of pocket expensesincurred in attending meetings. All Board committee members receive $1,000 per meeting attended. The AuditCommittee Chairman receives an annual fee of $3,000, the Proxy Voting Committee Chairman receives anannual fee of $1,500, and the Nominating Committee Chairman and the Lead Director each receives an annualfee of $2,000. A Director may receive a single meeting fee, allocated among the participating funds, for participationin certain meetings held on behalf of multiple funds. Directors who are directors or employees of the Adviseror an affiliated company receive no compensation or expense reimbursement from the Fund.
The Fund engaged in sale transactions with funds that have a common investment adviser. These sales transactionscomplied with Rule 17a-7 under the Act and amounted to $2,421,000.
4. Portfolio Securities. Purchases and sales of securities during the year ended December 31, 2017, otherthan short term securities and U.S. Government obligations, aggregated $200,596,211 and $287,925,977,respectively.
5. Capital. The Fund’s Articles of Incorporation, as amended, permit the Fund to issue 337,024,900 shares ofcommon stock (par value $0.001) and authorizes the Board to increase its authorized shares from time totime. The Board has authorized the repurchase of its shares on the open market when the shares are tradingon the NYSE at a discount of 10% or more (or such other percentage as the Board may determine from timeto time) from the NAV of the shares. During the years ended December 31, 2017 and 2016, the Fund did notrepurchase any shares of its common stock in the open market.
The Gabelli Equity Trust Inc.Notes to Financial Statements (Continued)
25
Transactions in shares of common stock were as follows:
Year EndedDecember 31, 2017
Year EndedDecember 31, 2016
Shares Amount Shares AmountIncrease from common shares issued in rights offering . . . . . . . . . . . . . . 31,514,058 $173,327,861 — —Increase from common shares issued upon reinvestment of
distributions. . . . . . . . . . . . . . . . . . . . . . . . . . . . . . . . . . . . . . . . . . . . . . . . . . . 1,358,240 8,540,513 — —Net increase . . . . . . . . . . . . . . . . . . . . . . . . . . . . . . . . . . . . . . . . . . . . . . . . . . . . 32,872,298 $181,868,374 — —
The Fund has an effective shelf registration authorizing the offering of an additional $500 million of commonor preferred shares. As of December 31, 2017, after considering the common share rights offering, the Fundhas approximately $327 million available for issuance under the current shelf registration.
On November 6, 2017, the Fund distributed one transferable right for each of the 220,598,406 common sharesoutstanding on that date. Seven rights were required to purchase one additional common share at the subscriptionprice of $5.50 per share. On December 19, 2017, the Fund issued 31,514,058 common shares receiving netproceeds of $172,727,861, after the deduction of estimated offering expenses of $600,000. The NAV of theFund was reduced by $0.14 per share on the day the additional shares were issued due to the additional sharesbeing issued below NAV.
The Fund’s Articles of Incorporation, as amended, authorize the issuance of up to 18,000,000 shares of $0.001par value Preferred Stock. The Preferred Stock is senior to the common stock and results in the financialleveraging of the common stock. Such leveraging tends to magnify both the risks and opportunities to commonshareholders. Dividends on shares of the Preferred Stock are cumulative. The Fund is required by the 1940Act and by the Fund’s Articles Supplementary to meet certain asset coverage tests with respect to the PreferredStock. If the Fund fails to meet these requirements and does not correct such failure, the Fund may be requiredto redeem, in part or in full, the Series C, Series D, Series E, Series G, Series H, and Series J Preferred Stockat redemption prices of $25,000, $25, $25,000, $25, $25, and $25, respectively, per share plus an amountequal to the accumulated and unpaid dividends whether or not declared on such shares in order to meet theserequirements. Additionally, failure to meet the foregoing asset coverage requirements could restrict the Fund’sability to pay dividends to common shareholders and could lead to sales of portfolio securities at inopportunetimes. The income received on the Fund’s assets may vary in a manner unrelated to the fixed and variablerates, which could have either a beneficial or detrimental impact on net investment income and gains availableto common shareholders.
On March 31, 2016, the Fund received $77,212,332 (after underwriting discounts of $2,520,000 and offeringexpenses of $267,668) from the public offering of 3,200,000 shares of Series J Preferred. Commencing March31, 2021 and any time thereafter, the Fund, at its option, may redeem the Series J Preferred at its redemptionprice, plus any accrued and unpaid dividends.
The Gabelli Equity Trust Inc.Notes to Financial Statements (Continued)
26

For Series C and Series E Preferred Stocks, the dividend rates, as set by the auction process that is generallyheld every seven days, are expected to vary with short term interest rates. Since February 2008, the numberof shares of Series C and Series E Preferred Stock subject to bid orders by potential holders has been lessthan the number of shares of Series C and Series E Preferred Stock subject to sell orders. Holders that havesubmitted sell orders have not been able to sell any or all of the Series C and Series E Preferred Stock forwhich they have submitted sell orders. Therefore, the weekly auctions have failed, and the dividend rate hasbeen the maximum rate. For Series C and Series E Preferred Stock, the maximum auction rate is 175% ofthe “AA” Financial Composite Commercial Paper Rate. Existing Series C and Series E shareholders may submitan order to hold, bid, or sell such shares on each auction date, or trade their shares in the secondary market.
The Fund may also redeem at any time, in whole or in part, the Series C, Series D, Series E, Series G, andSeries H Preferred Stock at their respective liquidation prices plus any accrued and unpaid dividends. In addition,the Board has authorized the repurchase of Series D, Series G, Series H, and Series J Preferred Stock in theopen market at prices less than the $25 liquidation value per share. During the year ended December 31,2017, the Fund did not repurchase or redeem any shares of Series C, Series D, Series E, and Series J PreferredStock. During the years ended December 31, 2017 and 2016, the Fund repurchased and retired 9,905 and7,300 of the Series G Preferred in the open market at an investment of $235,625 and $169,201 and averagediscounts of approximately 4.89% and 7.33%, respectively, and repurchased and retired 6,900 and 6,000 ofthe Series H Preferred in the open market at an investment of $163,263 and $138,542 and average discountsof approximately 5.39% and 7.68%, respectively.
The Fund has the authority to purchase its auction rate Series C and Series E preferred shares through negotiatedprivate transactions. The Fund is not obligated to purchase any dollar amount or number of auction rate preferredshares, and the timing and amount of any auction rate preferred shares purchased will depend on marketconditions, share price, capital availability, and other factors. The Fund is not soliciting holders to sell theseshares nor recommending that holders offer them to the Fund. Any offers can be accepted or rejected in theFund’s discretion.
The following table summarizes Cumulative Preferred Stock information:
Series Issue Date Authorized
Number of SharesOutstanding at
12/31/17 Net Proceeds2017 Dividend
Rate Range
DividendRate at
12/31/17
AccruedDividends at
12/31/17C Auction Rate. . . . . . . . . . . . . . June 27, 2002 5,200 2,880 $128,246,557 0.963% to 2.538% 2.538% $20,304D 5.875%. . . . . . . . . . . . . . . . . October 7, 2003 3,000,000 2,363,860 $ 72,375,842 Fixed Rate 5.875% $48,221E Auction Rate . . . . . . . . . . . . . . October 7, 2003 2,000 1,120 $ 49,350,009 1.085% to 2.503% 2.503% $ 3,894G 5.000%. . . . . . . . . . . . . . . . . August 1, 2012 3,280,477 2,779,796 $ 69,407,417 Fixed Rate 5.000% $48,260H 5.000%. . . . . . . . . . . . . . . . . September 28, 2012 4,198,880 4,172,873 $100,865,695 Fixed Rate 5.000% $72,446J 5.450% . . . . . . . . . . . . . . . . . March 28, 2016 4,500,000 3,200,000 $ 77,212,332 Fixed Rate 5.450% $60,555
The holders of Preferred Stock generally are entitled to one vote per share held on each matter submitted toa vote of shareholders of the Fund and will vote together with holders of common stock as a single class. Theholders of Preferred Stock voting together as a single class also have the right currently to elect two Directorsand, under certain circumstances, are entitled to elect a majority of the Board of Directors. In addition, theaffirmative vote of a majority of the votes entitled to be cast by holders of all outstanding shares of the preferredstock, voting as a single class, will be required to approve any plan of reorganization adversely affecting thepreferred stock, and the approval of two-thirds of each class, voting separately, of the Fund’s outstanding votingstock must approve the conversion of the Fund from a closed-end to an open-end investment company. The
The Gabelli Equity Trust Inc.Notes to Financial Statements (Continued)
27

approval of a majority (as defined in the 1940 Act) of the outstanding preferred stock and a majority (as definedin the 1940 Act) of the Fund’s outstanding voting securities are required to approve certain other actions, includingchanges in the Fund’s investment objectives or fundamental investment policies.
6. Indemnifications. The Fund enters into contracts that contain a variety of indemnifications. The Fund’smaximum exposure under these arrangements is unknown. However, the Fund has not had prior claims orlosses pursuant to these contracts. Management has reviewed the Fund’s existing contracts and expects therisk of loss to be remote.
7. Subsequent Events. Management has evaluated the impact on the Fund of all subsequent events occurringthrough the date the financial statements were issued and has determined that there were no subsequentevents requiring recognition or disclosure in the financial statements.
The Gabelli Equity Trust Inc.Notes to Financial Statements (Continued)
28
To the Board of Directors and Shareholders ofThe Gabelli Equity Trust Inc.:
Opinion on the Financial Statements
We have audited the accompanying statement of assets and liabilities, including the schedule of investments,of The Gabelli Equity Trust Inc. (the “Fund”) as of December 31, 2017, the related statement of operations forthe year ended December 31, 2017, the statement of changes in net assets attributable to common shareholdersfor each of the two years in the period ended December 31, 2017, including the related notes, and the financialhighlights for each of the five years in the period ended December 31, 2017 (collectively referred to as the“financial statements”). In our opinion, the financial statements present fairly, in all material respects, the financialposition of the Fund as of December 31, 2017, the results of its operations for the year then ended, the changesin its net assets attributable to common shareholders for each of the two years in the period ended December31, 2017 and the financial highlights for each of the five years in the period ended December 31, 2017 inconformity with accounting principles generally accepted in the United States of America.
Basis for Opinion
These financial statements are the responsibility of the Fund’s management. Our responsibility is to expressan opinion on the Fund’s financial statements based on our audits. We are a public accounting firm registeredwith the Public Company Accounting Oversight Board (United States) (“PCAOB”) and are required to be independentwith respect to the Fund in accordance with the U.S. federal securities laws and the applicable rules and regulationsof the Securities and Exchange Commission and the PCAOB.
We conducted our audits of these financial statements in accordance with the standards of the PCAOB. Thosestandards require that we plan and perform the audit to obtain reasonable assurance about whether the financialstatements are free of material misstatement, whether due to error or fraud.
Our audits included performing procedures to assess the risks of material misstatement of the financial statements,whether due to error or fraud, and performing procedures that respond to those risks. Such procedures includedexamining, on a test basis, evidence regarding the amounts and disclosures in the financial statements. Ouraudits also included evaluating the accounting principles used and significant estimates made by management,as well as evaluating the overall presentation of the financial statements. Our procedures included confirmationof securities owned as of December 31, 2017 by correspondence with the custodian, transfer agent and brokers;when replies were not received from brokers, we performed other auditing procedures. We believe that ouraudits provide a reasonable basis for our opinion.
PricewaterhouseCoopers LLPNew York, New YorkFebruary 27, 2018
We have served as the auditor of one or more investment companies in Gabelli/GAMCO Fund Complex since1986.
The Gabelli Equity Trust Inc.Report of Independent Registered Public Accounting Firm
29
The business and affairs of the Fund are managed under the direction of the Fund’s Board of Directors. Information pertaining to theDirectors and officers of the Fund is set forth below. The Fund’s Statement of Additional Information includes additional information aboutthe Fund’s Directors and officers and is available without charge, upon request, by calling 800-GABELLI (800-422-3554) or by writing toThe Gabelli Equity Trust Inc. at One Corporate Center, Rye, NY 10580-1422.
Name, Position(s)Address1
and Age
Term of Officeand Length ofTime Served2
Number ofFunds in Fund
ComplexOverseen by
DirectorPrincipal Occupation(s)During Past Five Years
Other DirectorshipsHeld by Director3
INTERESTED DIRECTORS4:
Mario J. Gabelli, CFAChairman andChief Investment OfficerAge: 75
Since 1986** 32 Chairman, Chief Executive Officer, and ChiefInvestment Officer– Value Portfolios of GAMCOInvestors, Inc. and Chief Investment Officer–Value Portfolios of Gabelli Funds, LLC andGAMCO Asset Management Inc.; Director/Trustee or Chief Investment Officer of otherregistered investment companies within theGabelli/GAMCO Fund Complex; Chief ExecutiveOfficer of GGCP, Inc.; Executive Chairman ofAssociated Capital Group, Inc.
Director of Morgan GroupHoldings, Inc. (holding company);Chairman of the Board and ChiefExecutive Officer of LICT Corp.(multimedia and communicationservices company); Director ofCIBL, Inc. (broadcasting andwireless communications);Director of ICTC Group Inc.(communications)
INDEPENDENT DIRECTORS5:
Anthony J. Colavita6
DirectorAge: 82
Since 1999*** 28 President of the law firm ofAnthony J. Colavita, P.C.
—
James P. Conn6
DirectorAge: 79
Since 1989* 27 Former Managing Director and Chief InvestmentOfficer of Financial Security Assurance HoldingsLtd. (1992-1998)
—
Frank J. Fahrenkopf, Jr.DirectorAge: 78
Since 1998*** 12 Co-Chairman of the Commission on PresidentialDebates; Former President and Chief ExecutiveOfficer of the American Gaming Association(1995-2013); Former Chairman of theRepublican National Committee (1983-1989)
Director of First Republic Bank(banking); Director of EldoradoResorts, Inc. (casino entertainmentcompany)
Arthur V. FerraraDirectorAge: 87
Since 2001** 8 Former Chairman of the Board and ChiefExecutive Officer of The Guardian Life InsuranceCompany of America (1993-1995)
—
William F. HeitmannDirectorAge: 68
Since 2012** 4 Managing Director and Senior Advisor ofPerlmutter Investment Company (real estate);Senior Vice President of Finance, VerizonCommunications, and President, VerizonInvestment Management (1971-2011)
—
Michael J. FerrantinoDirectorAge: 46
Since 2017* 2 Chief Executive Officer of InterEx Inc. —
Salvatore J. ZizzaDirectorAge: 72
Since 1986*** 30 President of Zizza & Associates Corp. (privateholding company); Chairman of HarborDiversified, Inc. (pharmaceuticals); Chairman ofBAM (semiconductor and aerospacemanufacturing); Chairman of Bergen Cove RealtyInc.; Chairman of Metropolitan Paper RecyclingInc. (recycling) (2005-2014)
Director and Vice Chairman ofTrans-Lux Corporation (businessservices); Director and Chairmanof Harbor Diversified Inc.(pharmaceuticals)
The Gabelli Equity Trust Inc.Additional Fund Information (Unaudited)
30
Name, Position(s)Address1
and Age
Term of Officeand Length ofTime Served2
Principal Occupation(s)During Past Five Years
OFFICERS:
Bruce N. AlpertPresidentAge: 66
Since 2003 Executive Vice President and Chief Operating Officer of Gabelli Funds, LLC since 1988;Officer of registered investment companies within the Gabelli/GAMCO Fund Complex;Senior Vice President of GAMCO Investors, Inc. since 2008
John C. BallTreasurerAge: 41
Since 2017 Treasurer of all the registered investment companies within the Gabelli/GAMCO FundComplex since 2017; Vice President and Assistant Treasurer of AMG Funds, 2014-2017;Vice President of State Street Corporation, 2007-2014
Agnes MulladyVice PresidentAge: 59
Since 2006 Officer of all of the registered investment companies within the Gabelli/GAMCO FundComplex since 2006; President and Chief Operating Officer of the Fund Division of GabelliFunds, LLC since 2015; Chief Executive Officer of G.distributors, LLC since 2010; SeniorVice President of GAMCO Investors, Inc. since 2009; Vice President of Gabelli Funds, LLCsince 2007; Executive Vice President of Associated Capital Group, Inc. since 2016
Andrea R. MangoSecretary andVice PresidentAge: 45
Since 2013 Vice President of GAMCO Investors, Inc. since 2016; Counsel of Gabelli Funds, LLC since2013; Secretary of all registered investment companies within the Gabelli/GAMCO FundComplex since 2013; Vice President of all closed-end funds within the Gabelli/GAMCOFund Complex since 2014; Corporate Vice President within the Corporate ComplianceDepartment of New York Life Insurance Company, 2011-2013
Richard J. WalzChief Compliance OfficerAge: 58
Since 2013 Chief Compliance Officer of all of the registered investment companies within the Gabelli/GAMCO Fund Complex since 2013; Chief Compliance Officer of AEGON USA InvestmentManagement, 2011-2013
Molly A.F. MarionVice President andOmbudsmanAge: 63
Since 2009 Vice President and/or Ombudsman of closed-end funds within the Gabelli/GAMCO FundComplex; Vice President of GAMCO Investors, Inc. since 2012
Carter W. AustinVice PresidentAge: 51
Since 2000 Vice President and/or Ombudsman of closed-end funds within the Gabelli/GAMCO FundComplex; Senior Vice President (since 2015) and Vice President (1996-2015) of GabelliFunds, LLC
David I. SchachterVice PresidentAge: 64
Since 2013 Vice President and/or Ombudsman of closed-end funds within the Gabelli/GAMCO FundComplex; Vice President (since 2015) of GAMCO Investors, Inc. and Vice President (1999-2015) of G.research, LLC
1 Address: One Corporate Center, Rye, NY 10580-1422, unless otherwise noted.2 The Fund’s Board of Directors is divided into three classes, each class having a term of three years. Each year the term of office of
one class expires and the successor or successors elected to such class serve for a three year term. The three year term for eachclass expires as follows:* Term expires at the Fund’s 2018 Annual Meeting of Shareholders or until their successors are duly elected and qualified.** Term expires at the Fund’s 2019 Annual Meeting of Shareholders or until their successors are duly elected and qualified.*** Term expires at the Fund’s 2020 Annual Meeting of Shareholders or until their successors are duly elected and qualified.For officers, includes time served in prior officer positions with the Fund. Each officer will hold office for an indefinite term until the datehe or she resigns or retires or until his or her successor is elected and qualified.
3 This column includes only directorships of companies required to report to the SEC under the Securities Exchange Act of 1934, asamended, i.e., public companies, or other investment companies registered under the 1940 Act.
4 “Interested person” of the Fund as defined in the 1940 Act. Mr. Gabelli is considered an “interested person” because of his affiliationwith Gabelli Funds, LLC, which acts as the Fund’s investment adviser.
5 Directors who are not interested persons are considered “Independent” Directors.6 This Director is elected solely by and represents the stockholders of the preferred stock issued by this Fund.
The Gabelli Equity Trust Inc.Additional Fund Information (Continued) (Unaudited)
31
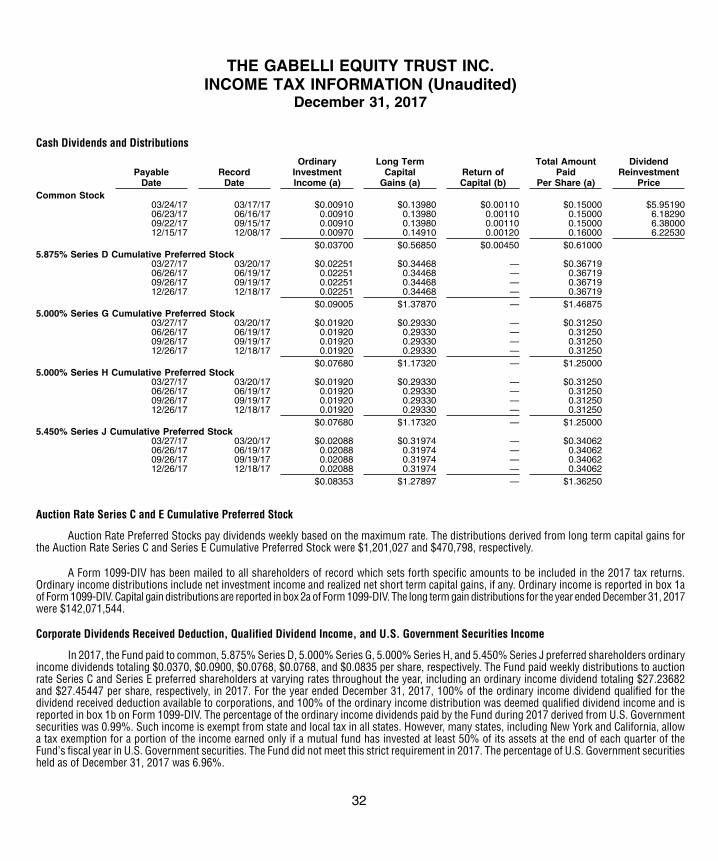
Cash Dividends and Distributions
PayableDate
RecordDate
OrdinaryInvestmentIncome (a)
Long TermCapital
Gains (a)Return ofCapital (b)
Total AmountPaid
Per Share (a)
DividendReinvestment
PriceCommon Stock
03/24/17 03/17/17 $0.00910 $0.13980 $0.00110 $0.15000 $5.9519006/23/17 06/16/17 0.00910 0.13980 0.00110 0.15000 6.1829009/22/17 09/15/17 0.00910 0.13980 0.00110 0.15000 6.3800012/15/17 12/08/17 0.00970 0.14910 0.00120 0.16000 6.22530
$0.03700 $0.56850 $0.00450 $0.610005.875% Series D Cumulative Preferred Stock
03/27/17 03/20/17 $0.02251 $0.34468 — $0.3671906/26/17 06/19/17 0.02251 0.34468 — 0.3671909/26/17 09/19/17 0.02251 0.34468 — 0.3671912/26/17 12/18/17 0.02251 0.34468 — 0.36719
$0.09005 $1.37870 — $1.468755.000% Series G Cumulative Preferred Stock
03/27/17 03/20/17 $0.01920 $0.29330 — $0.3125006/26/17 06/19/17 0.01920 0.29330 — 0.3125009/26/17 09/19/17 0.01920 0.29330 — 0.3125012/26/17 12/18/17 0.01920 0.29330 — 0.31250
$0.07680 $1.17320 — $1.250005.000% Series H Cumulative Preferred Stock
03/27/17 03/20/17 $0.01920 $0.29330 — $0.3125006/26/17 06/19/17 0.01920 0.29330 — 0.3125009/26/17 09/19/17 0.01920 0.29330 — 0.3125012/26/17 12/18/17 0.01920 0.29330 — 0.31250
$0.07680 $1.17320 — $1.250005.450% Series J Cumulative Preferred Stock
03/27/17 03/20/17 $0.02088 $0.31974 — $0.3406206/26/17 06/19/17 0.02088 0.31974 — 0.3406209/26/17 09/19/17 0.02088 0.31974 — 0.3406212/26/17 12/18/17 0.02088 0.31974 — 0.34062
$0.08353 $1.27897 — $1.36250
Auction Rate Series C and E Cumulative Preferred Stock
Auction Rate Preferred Stocks pay dividends weekly based on the maximum rate. The distributions derived from long term capital gains forthe Auction Rate Series C and Series E Cumulative Preferred Stock were $1,201,027 and $470,798, respectively.
A Form 1099-DIV has been mailed to all shareholders of record which sets forth specific amounts to be included in the 2017 tax returns.Ordinary income distributions include net investment income and realized net short term capital gains, if any. Ordinary income is reported in box 1aof Form 1099-DIV. Capital gain distributions are reported in box 2a of Form 1099-DIV. The long term gain distributions for the year ended December 31, 2017were $142,071,544.
Corporate Dividends Received Deduction, Qualified Dividend Income, and U.S. Government Securities Income
In 2017, the Fund paid to common, 5.875% Series D, 5.000% Series G, 5.000% Series H, and 5.450% Series J preferred shareholders ordinaryincome dividends totaling $0.0370, $0.0900, $0.0768, $0.0768, and $0.0835 per share, respectively. The Fund paid weekly distributions to auctionrate Series C and Series E preferred shareholders at varying rates throughout the year, including an ordinary income dividend totaling $27.23682and $27.45447 per share, respectively, in 2017. For the year ended December 31, 2017, 100% of the ordinary income dividend qualified for thedividend received deduction available to corporations, and 100% of the ordinary income distribution was deemed qualified dividend income and isreported in box 1b on Form 1099-DIV. The percentage of the ordinary income dividends paid by the Fund during 2017 derived from U.S. Governmentsecurities was 0.99%. Such income is exempt from state and local tax in all states. However, many states, including New York and California, allowa tax exemption for a portion of the income earned only if a mutual fund has invested at least 50% of its assets at the end of each quarter of theFund’s fiscal year in U.S. Government securities. The Fund did not meet this strict requirement in 2017. The percentage of U.S. Government securitiesheld as of December 31, 2017 was 6.96%.
THE GABELLI EQUITY TRUST INC.INCOME TAX INFORMATION (Unaudited)
December 31, 2017
32
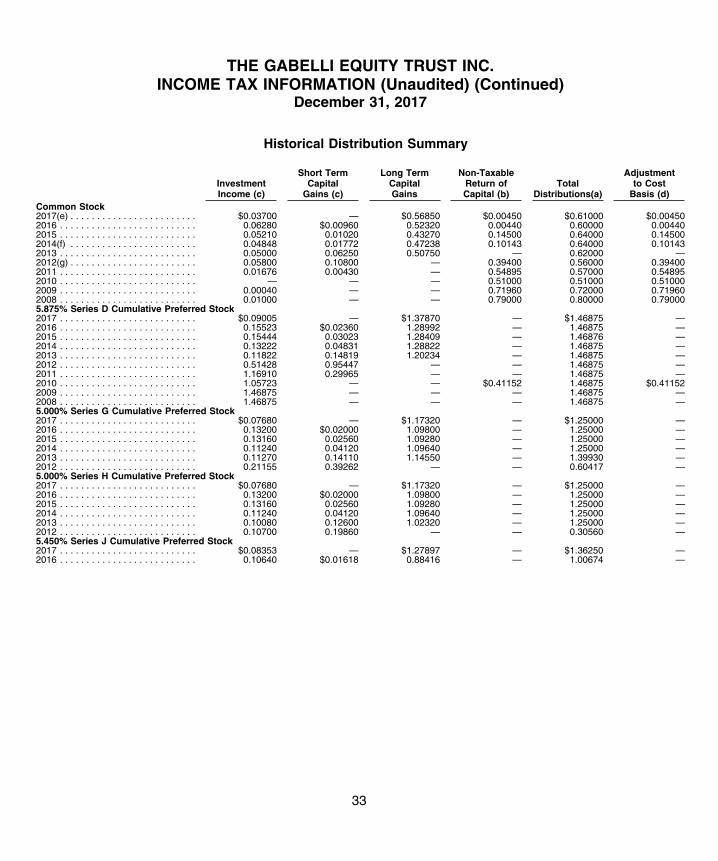
Historical Distribution Summary
InvestmentIncome (c)
Short TermCapital
Gains (c)
Long TermCapitalGains
Non-TaxableReturn ofCapital (b)
TotalDistributions(a)
Adjustmentto Cost
Basis (d)Common Stock2017(e) . . . . . . . . . . . . . . . . . . . . . . . . $0.03700 — $0.56850 $0.00450 $0.61000 $0.004502016 . . . . . . . . . . . . . . . . . . . . . . . . . . 0.06280 $0.00960 0.52320 0.00440 0.60000 0.004402015 . . . . . . . . . . . . . . . . . . . . . . . . . . 0.05210 0.01020 0.43270 0.14500 0.64000 0.145002014(f) . . . . . . . . . . . . . . . . . . . . . . . . 0.04848 0.01772 0.47238 0.10143 0.64000 0.101432013 . . . . . . . . . . . . . . . . . . . . . . . . . . 0.05000 0.06250 0.50750 — 0.62000 —2012(g) . . . . . . . . . . . . . . . . . . . . . . . . 0.05800 0.10800 — 0.39400 0.56000 0.394002011 . . . . . . . . . . . . . . . . . . . . . . . . . . 0.01676 0.00430 — 0.54895 0.57000 0.548952010 . . . . . . . . . . . . . . . . . . . . . . . . . . — — — 0.51000 0.51000 0.510002009 . . . . . . . . . . . . . . . . . . . . . . . . . . 0.00040 — — 0.71960 0.72000 0.719602008 . . . . . . . . . . . . . . . . . . . . . . . . . . 0.01000 — — 0.79000 0.80000 0.790005.875% Series D Cumulative Preferred Stock2017 . . . . . . . . . . . . . . . . . . . . . . . . . . $0.09005 — $1.37870 — $1.46875 —2016 . . . . . . . . . . . . . . . . . . . . . . . . . . 0.15523 $0.02360 1.28992 — 1.46875 —2015 . . . . . . . . . . . . . . . . . . . . . . . . . . 0.15444 0.03023 1.28409 — 1.46876 —2014 . . . . . . . . . . . . . . . . . . . . . . . . . . 0.13222 0.04831 1.28822 — 1.46875 —2013 . . . . . . . . . . . . . . . . . . . . . . . . . . 0.11822 0.14819 1.20234 — 1.46875 —2012 . . . . . . . . . . . . . . . . . . . . . . . . . . 0.51428 0.95447 — — 1.46875 —2011 . . . . . . . . . . . . . . . . . . . . . . . . . . 1.16910 0.29965 — — 1.46875 —2010 . . . . . . . . . . . . . . . . . . . . . . . . . . 1.05723 — — $0.41152 1.46875 $0.411522009 . . . . . . . . . . . . . . . . . . . . . . . . . . 1.46875 — — — 1.46875 —2008 . . . . . . . . . . . . . . . . . . . . . . . . . . 1.46875 — — — 1.46875 —5.000% Series G Cumulative Preferred Stock2017 . . . . . . . . . . . . . . . . . . . . . . . . . . $0.07680 — $1.17320 — $1.25000 —2016 . . . . . . . . . . . . . . . . . . . . . . . . . . 0.13200 $0.02000 1.09800 — 1.25000 —2015 . . . . . . . . . . . . . . . . . . . . . . . . . . 0.13160 0.02560 1.09280 — 1.25000 —2014 . . . . . . . . . . . . . . . . . . . . . . . . . . 0.11240 0.04120 1.09640 — 1.25000 —2013 . . . . . . . . . . . . . . . . . . . . . . . . . . 0.11270 0.14110 1.14550 — 1.39930 —2012 . . . . . . . . . . . . . . . . . . . . . . . . . . 0.21155 0.39262 — — 0.60417 —5.000% Series H Cumulative Preferred Stock2017 . . . . . . . . . . . . . . . . . . . . . . . . . . $0.07680 — $1.17320 — $1.25000 —2016 . . . . . . . . . . . . . . . . . . . . . . . . . . 0.13200 $0.02000 1.09800 — 1.25000 —2015 . . . . . . . . . . . . . . . . . . . . . . . . . . 0.13160 0.02560 1.09280 — 1.25000 —2014 . . . . . . . . . . . . . . . . . . . . . . . . . . 0.11240 0.04120 1.09640 — 1.25000 —2013 . . . . . . . . . . . . . . . . . . . . . . . . . . 0.10080 0.12600 1.02320 — 1.25000 —2012 . . . . . . . . . . . . . . . . . . . . . . . . . . 0.10700 0.19860 — — 0.30560 —5.450% Series J Cumulative Preferred Stock2017 . . . . . . . . . . . . . . . . . . . . . . . . . . $0.08353 — $1.27897 — $1.36250 —2016 . . . . . . . . . . . . . . . . . . . . . . . . . . 0.10640 $0.01618 0.88416 — 1.00674 —
THE GABELLI EQUITY TRUST INC.INCOME TAX INFORMATION (Unaudited) (Continued)
December 31, 2017
33

Historical Distribution Summary (Continued)
InvestmentIncome (c)
Short TermCapital
Gains (c)
Long TermCapitalGains
Non-TaxableReturn ofCapital (b)
TotalDistributions(a)
Adjustmentto Cost
Basis (d)Auction Rate Series C Cumulative Preferred Stock2017 . . . . . . . . . . . . . . . . . . . . . . . . . . $ 27.23682 — $417.02318 — $444.26000 —2016 . . . . . . . . . . . . . . . . . . . . . . . . . . 18.45541 $ 2.80628 153.35831 — 174.62000 —2015 . . . . . . . . . . . . . . . . . . . . . . . . . . 4.58660 0.89764 38.13575 — 43.61999 —2014 . . . . . . . . . . . . . . . . . . . . . . . . . . 2.81131 1.02727 27.39142 — 31.23000 —2013 . . . . . . . . . . . . . . . . . . . . . . . . . . 2.49523 3.12766 25.37712 — 31.00000 —2012 . . . . . . . . . . . . . . . . . . . . . . . . . . 13.04312 24.20688 — — 37.25000 —2011 . . . . . . . . . . . . . . . . . . . . . . . . . . 29.61842 7.59158 — — 37.21000 —2010 . . . . . . . . . . . . . . . . . . . . . . . . . . 47.84624 — — $18.62376 66.47000 $18.623762009 . . . . . . . . . . . . . . . . . . . . . . . . . . 70.60000 — — — 70.60000 —2008 . . . . . . . . . . . . . . . . . . . . . . . . . . 760.66000 — — — 760.66000 —
Auction Rate Series E Cumulative Preferred Stock2017 . . . . . . . . . . . . . . . . . . . . . . . . . . $ 27.45447 — $420.35553 — $447.81000 —2016 . . . . . . . . . . . . . . . . . . . . . . . . . . 18.51566 $ 2.81544 153.85890 — 175.19000 —2015 . . . . . . . . . . . . . . . . . . . . . . . . . . 4.84737 0.94868 40.30395 — 46.10000 —2014 . . . . . . . . . . . . . . . . . . . . . . . . . . 2.68709 0.98187 26.18104 — 29.85000 —2013 . . . . . . . . . . . . . . . . . . . . . . . . . . 2.56686 3.21745 26.10568 — 31.89000 —2012 . . . . . . . . . . . . . . . . . . . . . . . . . . 12.47587 23.15413 — — 35.63000 —2011 . . . . . . . . . . . . . . . . . . . . . . . . . . 27.47723 7.04277 — — 34.52000 —2010 . . . . . . . . . . . . . . . . . . . . . . . . . . 48.73162 — — $18.96838 67.70000 $18.968382009 . . . . . . . . . . . . . . . . . . . . . . . . . . 65.24000 — — — 65.24000 —2008 . . . . . . . . . . . . . . . . . . . . . . . . . . 783.29000 — — — 783.29000 —
(a) Total amounts may differ due to rounding.(b) Non-taxable.(c) Taxable as ordinary income.(d) Decrease in cost basis.(e) On November 6, 2017, the Fund also distributed Rights equivalent to $0.14 per common share based upon full subscription of all issued shares.(f) On September 19, 2014, the Fund also distributed Rights equivalent to $0.12 per common share based upon full subscription of all issued shares.(g) On June 29, 2012, the Fund also distributed Rights equivalent to $0.12 per common share based upon full subscription of all issued shares.
All designations are based on financial information available as of the date of this annual report and, accordingly, are subject to change. Foreach item, it is the intention of the Fund to designate the maximum amount permitted under the Internal Revenue Code and the regulations thereunder.
THE GABELLI EQUITY TRUST INC.INCOME TAX INFORMATION (Unaudited) (Continued)
December 31, 2017
34

THE GABELLI EQUITY TRUST INC.One Corporate CenterRye, NY 10580-1422
Portfolio Management Team Biographies
Mario J. Gabelli, CFA, is Chairman, Chief Executive Officer, and Chief Investment Officer - Value Portfolios ofGAMCO Investors, Inc. that he founded in 1977, and Chief Investment Officer - Value Portfolios of Gabelli Funds, LLCand GAMCO Asset Management Inc. He is also Executive Chairman of Associated Capital Group, Inc. Mr. Gabelli isa summa cum laude graduate of Fordham University and holds an MBA degree from Columbia Business Schooland Honorary Doctorates from Fordham University and Roger Williams University.
Christopher J. Marangi joined Gabelli in 2003 as a research analyst. Currently he is a Managing Director andCo-Chief Investment Officer for GAMCO Investors, Inc.’s Value team. In addition, he serves as a portfolio managerof Gabelli Funds, LLC and manages several funds within the Gabelli/GAMCO Fund Complex. Mr. Marangi graduatedmagna cum laude and Phi Beta Kappa with a BA in Political Economy from Williams College and holds an MBAdegree with honors from Columbia Business School.
Kevin V. Dreyer joined Gabelli in 2005 as a research analyst covering companies within the consumer sector.Currently he is a Managing Director and Co-Chief Investment Officer for GAMCO Investors, Inc.’s Value team. Inaddition, he serves as a portfolio manager of Gabelli Funds, LLC and manages several funds within the Gabelli/GAMCOFund Complex. Mr. Dreyer received a BSE from the University of Pennsylvania and an MBA degree from ColumbiaBusiness School.
Robert D. Leininger, CFA, joined GAMCO Investors, Inc. in 1993 as an equity analyst. Subsequently, he was apartner and portfolio manager at Rorer Asset Management before rejoining GAMCO in 2010 where he currentlyserves as a portfolio manager of Gabelli Funds, LLC. Mr. Leininger is a magna cum laude graduate of AmherstCollege with a degree in Economics and holds an MBA degree from the Wharton School at the University ofPennsylvania.
Daniel M. Miller has been the portfolio manager of The Gabelli Focus Five Fund since inception of the investmentstrategy on January 1, 2012. He is also a Managing Director of GAMCO Investors, Inc. Mr. Miller joined the Firmin 2002 and graduated magna cum laude with a degree in finance from the University of Miami in Coral Gables,Florida.
We have separated the portfolio managers’ commentary from the financial statements and investment portfolio due tocorporate governance regulations stipulated by the Sarbanes-Oxley Act of 2002. We have done this to ensure that thecontent of the portfolio managers’ commentary is unrestricted. Both the commentary and the financial statements, includingthe portfolio of investments, will be available on our website at www.gabelli.com.
The Net Asset Value per share appears in the Publicly Traded Funds column, under the heading “General EquityFunds,” in Monday’s The Wall Street Journal. It is also listed in Barron’s Mutual Funds/Closed End Funds sectionunder the heading “General Equity Funds.”
The Net Asset Value per share may be obtained each day by calling (914) 921-5070 or visiting www.gabelli.com.
The NASDAQ symbol for the Net Asset Value is “XGABX.”
Notice is hereby given in accordance with Section 23(c) of the Investment Company Act of 1940, as amended, that theFund may, from time to time, purchase its common shares in the open market when the Fund’s shares are trading at adiscount of 10% or more from the net asset value of the shares. The Fund may also, from time to time, purchase itspreferred shares in the open market when the preferred shares are trading at a discount to the liquidation value.
THE GABELLI EQUITY TRUST INC.One Corporate CenterRye, NY 10580-1422
t 800-GABELLI (800-422-3554)f 914-921-5118e [email protected]
GABELLI.COM
DIRECTORS
Mario J. Gabelli, CFAChairman andChief Executive Officer,GAMCO Investors, Inc.Executive Chairman,Associated Capital Group, Inc.
Anthony J. ColavitaPresident,Anthony J. Colavita, P.C.
James P. ConnFormer Managing Director &Chief Investment Officer,Financial Security AssuranceHoldings Ltd.
Frank J. Fahrenkopf, Jr.Former President &Chief Executive Officer,American Gaming Association
Michael J. FerrantinoChief Executive Officer,InterEx, Inc.
Arthur V. FerraraFormer Chairman &Chief Executive Officer,Guardian Life InsuranceCompany of America
William F. HeitmannFormer Senior Vice Presidentof Finance,Verizon Communications, Inc.
Salvatore J. ZizzaChairman,Zizza & Associates Corp.
OFFICERS
Bruce N. AlpertPresident
John C. BallTreasurer
Agnes MulladyVice President
Andrea R. MangoSecretary & Vice President
Richard J. WalzChief Compliance Officer
Molly A.F. MarionVice President & Ombudsman
Carter W. AustinVice President
David I. SchachterVice President
INVESTMENT ADVISER
Gabelli Funds, LLCOne Corporate CenterRye, New York 10580-1422
CUSTODIAN
The Bank of New York Mellon
COUNSEL
Willkie Farr & Gallagher LLP
TRANSFER AGENT ANDREGISTRAR
Computershare Trust Company, N.A.
THEGABELLIEQUITYTRUST INC.
GAB
Annual ReportDecember 31, 2017
GAB Q4/2017