Thesis outline - Rensselaer Polytechnic...
64
CHAPTER 3 The Experiment and the Diagnostic 3.1 RFP The RFP is an example of a toroidal plasma confinement device which utilizes magnetic fields to confine the plasma. A unique feature of the RFP is reversal of the toroidal component of the magnetic field in the edge region of the plasma. Additionally, the RFP is also known for its comparable magnitudes of toroidal and poloidal fields. The radial profile of the RFP magnetic fields is shown in FIGURE 1. 1 1
Transcript of Thesis outline - Rensselaer Polytechnic...

CHAPTER 3
The Experiment and the Diagnostic
3.1 RFP
The RFP is an example of a toroidal plasma confinement device which utilizes
magnetic fields to confine the plasma. A unique feature of the RFP is reversal of the
toroidal component of the magnetic field in the edge region of the plasma. Additionally,
the RFP is also known for its comparable magnitudes of toroidal and poloidal fields.
The radial profile of the RFP magnetic fields is shown in FIGURE 1.
FIGURE 1. Radial profiles of MST magnetic fields for a 380 kA standard plasma
discharge.
The relatively weak toroidal magnetic field causes the safety factor in the RFP
to be less than 1 everywhere. From the purview of resistive MHD, thiswhich has a
negative impact on plasma stability and causes the magnetic fluctuations to be relatively
large [ref]. The RFP is an example of a laboratory experiment that exhibits a dynamo
mechanism for plasma sustainment. At the heart of this mechanism is the a naturally
1
1
Ken Connor, 01/03/-1,
It is not known for this. Just state that the toroidal and poloidal fields are comparable. You may want to make some comment here that HIBP systems have been used extensively on tokamaks, so some comments will be made on the similarities and differences between RFPs and tokamaks.
Ken Connor, 01/03/-1,
Are these profiles typical of MST or of RFPs in general?

occurring relaxation phenomenon, which causes the plasma to evolve to a minimum
energy state. The sawtooth phenomenon in the RFP is a discrete dynamo event that
brings the plasma closer to this relaxed state. The prevalence of magnetic fluctuations in
the RFP and its relative magnitude (~1% of mean fields) has enabled the study of
magnetic fluctuations and fluctuation induced transport to flourish in the MST-RFP
[ref- proposal]. The interested reader is suggested the following references, which
provide detailed discussions on the achievements of the MST-RFP to date [ref].
3.1.1 RFP plasma formation and sustainment
The phenomenon of field reversal in magnetic confinement systems was first
experimentally observed in the ZETA device in 1960 [ref] and spawned a multitude of
experimental investigations on the RFP. However, it was not until 1974, that a
theoretical explanation for field reversal and plasma relaxation was actually
propoundedproposed by J.B. Taylor [ref]. Many features that are observed in RFP
experiments are found to agree with the Taylor model of plasma relaxation. In this work
he established a connection between the spontaneous field reversal generated in the RFP
and the phenomenon of plasma relaxation in toroidal devices where the confining fields
obeyed certain characteristics. He identified the requirement for reversal to hinge on
two quantities that were inherently related to the total plasma current, size of the minor
radius and the magnetic field on axis. In RFP operation these terms are known as “the
pinch parameter theta” and “the field reversal parameter F” and are defined by the
following equations:
2
2
Ken Connor, 01/03/-1,
Are you going to tell us what they are?
Ken Connor, 01/03/-1,
This sentence seems useless to me. Please read over this paragraph and determine what is important to know about RFPs for the purpose of your HIBP investigations. It matters that there are sawteeth and that the equilibrium changes as a result. Does the equilibrium relax to a different state after each sawtooth event or is it just cycling around some average. Your language is not clear. Also, we do need to know that the magnetic fluctuations are larger than we have seen on tokamaks and stellarators, with some exceptions.

The details of the RFP relaxation are discussed in a number of references [ref]. The
dynamo mechanism, which is believed to sustain the RFP field reversal is discussed in
detail in the following references [ref]. The following qualitative discussion will be
limited to the startup, formation and sustainment of the MST-RFP. FIGURE 2
illustrates the startup and formation of the MST plasma discharge. The individual steps
are further explained below.
FIGURE 2. MST-RFP startup
3
3

The operation of the MST begins with the charging up of capacitor banks, which are
used for poloidal and toroidal field generation (not indicated in the FIGURE). The
following steps take place in sequence to produce an MST plasma discharge:
(1) A small amount of gas is puffed into the system and ionized.
(2) Current is driven in the shell in the poloidal direction.
(3) The surface current produces a toroidal magnetic field inside the vacuum vessel
in accordance with Ampere’s law.
(4) At this point a larger capacitor bank is discharged and a change of poloidal flux
is activated by transformer action. The change in flux produces an inductive
electric field in the toroidal direction.
(5) Further gas is injected into the vacuum vessel. The gas that was ionized in (1)
now follows the field lines and starts to ionize the neutral fuel species just
injected. Once ionized, the particles are confined to their lowest order Larmor
radius excursions about the field lines and cause further ionization. The density
of the plasma begins to increase at this point.
(6) The consequence of the action mentioned in step (5) causes the plasma current
to be formed.
(7) In accordance with Ampere’s law the toroidal plasma current gives rise to a
poloidal component of the magnetic field.
4
4

Beyond this startup and formation step of the MST plasma is the phenomenon of
field reversal and plasma sustainment. The reversal of the toroidal field takes place
almost immediately after the formation of the plasma. As explained above, owing to the
relative magnitudes of the field components, once the pinch parameter, ‘theta’ reaches a
critical value the reversal criterion becomes satisfied and the plasma begins to
spontaneously reverse. The time trace of the average toroidal magnetic field and the
magnetic field at the wall for a typical 380 kA MST discharge is shown in FIGURE 3.
The field at the wall begins to undergo the reversal process at ~2 ms. A time trace of the
pinch parameter is also plotted in FIGURE 3, which shows that no reversal occurs
below the critical theta value. The sustainment of the plasma is provided by a pulse-
forming network that drives the inductive electric field for a period of 20-30 ms [ref]. In
general the plasma is sustained for a time period of almost 70ms in a 380 kA discharge.
5
5
Ken Connor, 01/03/-1,
What is the critical theta value?

FIGURE 3 Plots of average toroidal field <Bt>, toroidal field at the wall Bt(wall) and pinch parameter – theta in a high current standard discharge
3.1.2 The sawtooth cycle
The process of generation of the toroidal flux following the redistribution of current in
the core constitutes the sawtooth crash in the RFP. The dynamics of the sawtooth crash
have been described in numerous references [ref]. Basically tThe process results out
offrom the redistribution of parallel current and magnetic reconnection.
The inductive electric field, E, and the mainly toroidal field drive parallel
current in the core. Quantitatively this is given by the following equation:
6
6
Ken Connor, 01/03/-1,
You are missing a term in this equation.
Ken Connor, 01/03/-1,
Poor sentence.

The term is higher in the core because both the inductive electric field and majority
of the magnetic field there are in the toroidal direction. At the reversal surface this
product is zero. At the edge this value is small and negative. The variation in the
product of across the minor radius causes the current profile to be peaked in the
core. Additionally, because the electron temperature in the core of the plasma is higher
than at the edge, this causes the resistivity in the core to be lower compared tois lower
than at the edge (assuming Spitzer resistivity ). The lowering of core
resistivity also causes the current profile in the core to become peaked. Consequently as
the current gradient starts to increase as a result of this resistivity profile, it acts a source
of free energy to drive the tearing instability. These tearing instabilities then bring the
plasma closer to a relaxed state in a discrete event or “sawtooth”. The dynamo
mechanism that is associated with a sawtooth crash generates toroidal flux in the edge
of the plasma as is evident from the plot of the average toroidal field in FIGURE 3.
7
7
Ken Connor, 01/03/-1,
How does the figure show this? Be specific.
Ken Connor, 01/03/-1,
Be specific. Where in the core?

In MST the sawtooth cycle is defined to be the time period ranging from the beginning
of one sawtooth crash to the beginning of the next. It is characterized by a rather quick
crash phase on the order of a 100 microseconds followed by a relatively slow rise phase
on the order of a few milliseconds. The period in between can be described as one in
which the plasma is in a quasi-equilibrium phase. The global parameters such as plasma
current and density do not change that dramatically during this time period. This time
period is also seen to be an opportune moment for HIBP measurements because of the
rather slow variation in the magnetic topology compared to the violentthe fast changes
during the sawtooth cycle. The HIBP experiments discussed in this thesis focus on
results obtained at times that are at least 1ms away from the sawtooth crash.
3.2 MST
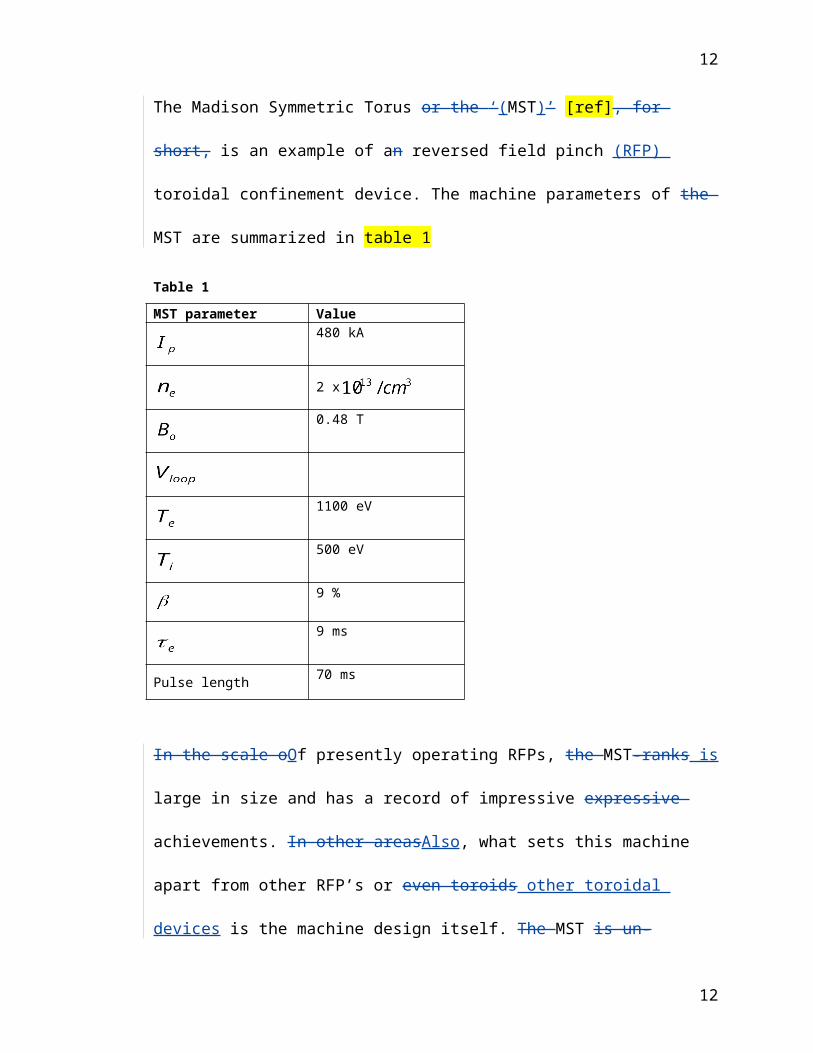
The Madison Symmetric Torus or the ‘(MST)’ [ref], for short, is an example of an
reversed field pinch (RFP) toroidal confinement device. The machine parameters of the
MST are summarized in table 1
Table 1
MST parameter Value480 kA
2 x
0.48 T
1100 eV
500 eV
9 %
8
8
Ken Connor, 01/03/-1,
Maximum parameters??
Ken Connor, 01/03/-1,
In checking the references, it appears that the standard way to refer to MST is NOT as the MST. Thus, you should be sure to change all ‘the MST’ in your thesis to ‘MST.’

9 ms
Pulse length 70 ms
In the scale oOf presently operating RFPs, the MST-ranks is large in size and has a
record of impressive expressive achievements. In other areasAlso, what sets this
machine apart from other RFP’s or even toroids other toroidal devices is the machine
design itself. The MST is un-encumbered byhas no external field coils and utilizes a one
turn iron core transformer, a thick aluminum vacuum shell and an array of pulse
forming networks to achieve plasma confinement [ref]. A schematic diagram of the
device is given in FIGURE 4 below.
FIGURE 4. Schematic of the MST-RFP [ref]
The MST operational procedure is remarkably simple considering the
engineering complexity of this device. The operator needs only to be mindful of a
handful of items for successful operation such as main bank voltages (that determine the
toroidal field & the plasma current) and gas fueling. Waveforms of the primary current
9
9

in the transformer and the plasma current are monitored once the discharge takes place.
In addition, the following quantities: (a) density, (b) radiation levels, (c) field reversal
parameter and (d) termination of the plasma current are important parameters that
determine the overall characteristic of a plasma discharge. The cycle time of operation
depends on (a) how much capacitor bank voltage is required to produce the plasma,
(b)the time needed for cooling of the vacuum vessel and (c)the time needed for data
acquired to be stored and readying digitizers for acquiring data for the subsequent shot.
Typical cycle time for operation ranges from 2.5 to 4 minutes depending on the plasma
current. In a typical day, it is not uncommon to take over 200 shots. The MST is capable
of operating in a multitude of modes that produce a variety of discharges. A number of
these discharges were utilized in the experiments discussed in this thesis and are
described below.
3.2.3 MST parameters
The plasmas produced in MST are monitored on a shot shot-to- shot basis. There are a
number of parameters that are monitored immediately after a discharge takes place and
there are other parameters that need significant signal processing before they are known
to any appreciable extent. In general, 7 different types of discharges can be produced in
MST. This thesis deals with three of the variants. The various important plasma
parameters (both operator controlled and machine determined) and the nature of these
discharges will be described below. Some plasma parameters in a typical standard
discharge is are illustrated in FIGURE 5.
10
10
Ken Connor, 01/03/-1,
Just ‘some’ parameters? Why did you choose to show these? I assume that they are the most significant for the HIBP.

FIGURE 5 Typical parameters in an MST standard discharge
3.2.3.1. Plasma current
The plasma current in MST ranges from 140-450 kA. Typically 250-280 kA is
categorized as low current and 350-450 kA as high current. The total plasma current is
measured using a rogowski Rogowski coil [ref] and is reproduced rather well on a shot-
to- shot basis. However, it has been often observed that the flat-top in MST is not
always re-producible. In some cases the current flat tops after reaching a peak value
(before a sawtooth crash). While in others the plasma current starts to decay rather
rapidly after it peaks. This decay can be up to 3% of the peak value. The main cause for
this irregularity in the plasma current is due to mechanisms that control the way in
which the capacitor banks fire in the “pulse-forming network (PFN)”. This irregularity
is a very important cause of concern from an HIBP perspective. Since the HIBP particle
trajectories are sensitive to the magnetic field, any deviation by more than a few percent
in the current can cause significant changes in the measurement location. Hence,
11
11
Ken Connor, 01/03/-1,
Where is this discussed. Refer to the section and possibly note how much the sample location can move.
Ken Connor, 01/03/-1,
You will have to explain this further. Is the decay due to lack of power from the banks, poor timing or what?
Ken Connor, 01/03/-1,
As you discuss the changes in these parameters, refer to the figure and take the reader through the changes observed.
reliable HIBP measurements are made over a time period when the changes are limited
to less than a few percent.
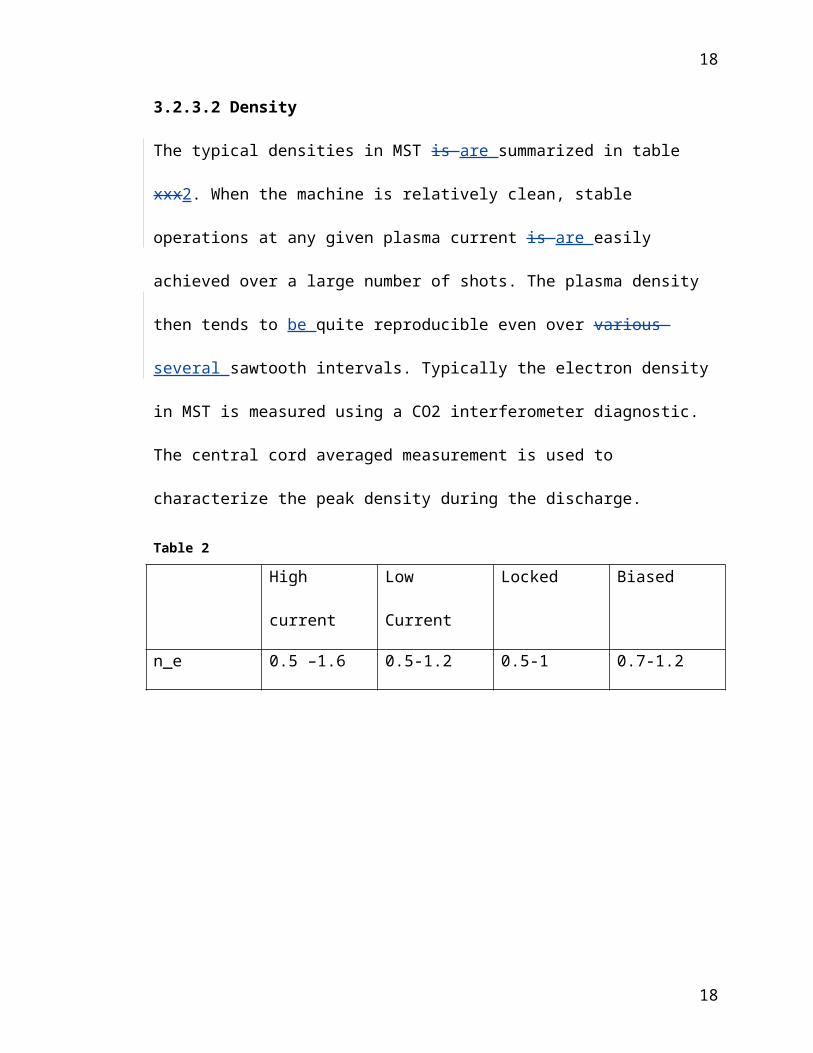
3.2.3.2 Density
The typical densities in MST is are summarized in table xxx2. When the machine is
relatively clean, stable operations at any given plasma current is are easily achieved
over a large number of shots. The plasma density then tends to be quite reproducible
even over various several sawtooth intervals. Typically the electron density in MST is
measured using a CO2 interferometer diagnostic. The central cord averaged
measurement is used to characterize the peak density during the discharge.
Table 2
High current Low Current Locked Biased
n_e 0.5 –1.6 0.5-1.2 0.5-1 0.7-1.2
Table 2. Density range in four different MST plasma discharges. All values are
multiplied by
Edge biased discharges are characterized by a sudden change in the plasma density at
the time when plasma biasing is applied. Typically the plasma density is 0.4-0.5
before biasing and reaches a value of 1 x once during biasing is
applied. The dramatic increase in density during biasing stems from the injection of
contaminating materials from the probeselectrodes. The control of plasma density is
inherently related to machine wall cleanliness because fueling from the vacuum vessel
wall can be a significant component of the total fuel used to produce the plasma.
12
12
Ken Connor, 01/03/-1,
Negative or positive bias?
Ken Connor, 01/03/-1,
This sentence again is afflicted with a fundamental problem in your writing style. You say a few percent is the limit of acceptable change. A few usually refers to a single digit number. However, you stated above that the change can be up to 3%. Thus, it appears that the decay is always acceptable.

3.2.3.3 Field reversal parameter
The field reversal parameter is also an important quantity for monitoring the plasma.
Typically this is a very easy parameter to control and is more or less reproducible. The
field reversal parameter, F, varies quite dramatically at the sawtooth crash. Typically, F
decreases very rapidly in magnitude 1-1.5 ms after the crash and remains more or less
flat before the next crash. At the onset of a sawtooth crash, the magnitude of F increases
sharply. This behavior is consistent with the RFP dynamo theory. The increase in F at
the crash signals a reduction of toroidal flux outside the reversal surface and an increase
in toroidal flux inside it. This flux generation and conversion process also signals a
dramatic change in the magnetic equilibrium, which is centered about the sawtooth
crash.
3.2.3.4 Sawtooth crash
The sawtooth crash is not an operator-controlled feature of the machine. The sawtooth
oscillation is characteristic of all standard MST discharges. While sawtooth crashes are
essential for plasma to be sustained they also introduce abrupt changes in the magnetic
topology. Such crashes typically occur at multiple times during a shot with no specific
periodicity. Furthermore, neither the time event of a sawtooth crash, nor the interval
between two successive crashes is identical in any two discharges. However, in
discharges that are “similar”, sawtooth crashes occur more or less aroundat
approximately the same time during the shot. It is important to note that the physics that
hinges onof the sawtooth crash may or may not be similar from one crash to the next,
much less from one discharge to another. The dominant n=6 toroidal mode rotation is
one such parameter that can change dramatically from one sawtooth cycle to the next
13
13
Ken Connor, 01/03/-1,
I don’t think that this is consistent with your comments above about the flux at the surface.
Ken Connor, 01/03/-1,
Try writing this section again. Your description is not clear and is partly wrong. Refer to the figure and take the reader through the changes in F.

and plays an important role in the HIBP potential profile measurement. Physics issues
surrounding a sawtooth crash have been ongoing subject of investigation in the MST
[reference Ted’s thesis].
In 380 kA discharges, there are usually 3-4 sawtooth crashes during the flat-top
phase. The time period between each successive crash ranges from 7-9 ms. On the other
hand, sSawteeth are more prevalent in a low current discharge with the time between
two successive crashes lessening to around 5-6 ms. There is no major change in
sawtooth activity in biased discharges compared to the low current standard case.
However, the locked discharge is devoid ofhas no sawtooth crashes.
3.2.3.5 Mode Velocity
Like the sawtooth crash, the magnetic more mode rotation velocity is also determined
solely by the dynamics of the plasma. The m=1,n=6 magnetic mode is the dominant
mode in MST (as inferred from MHD theory). From an HIBP perspective, the n=6
mode velocity has been found to be an important constraint in determining shot to
shotshot-to-shot reproducibility because factsince it has been found to co-relatecorrelate
remarkably well with the magnitude of the plasma potential. This constraint has been
identified as being important for HIBP electric field measurements and has not
previously been discussed in this connection. This is because the phase rotation of the
n=6 mode has been experimentally determined to be very closely coupled to the toroidal
impurity flow in low current standard discharges. Hence, any relationship between the
toroidal flow and the radial electric field can also be related to the phase velocity of this
mode. This topic will be discussed in detail in chapters 4 and 6.
14
14
Ken Connor, 01/03/-1,
Again, make sure that you provide a reference for each piece of information you include.
Ken Connor, 01/03/-1,
What do you mean by constraint? I know, but the typical reader will not unless they have read the rest of the thesis.
Ken Connor, 01/03/-1,
Reference?

The co-relationcorrelation between mode speed and plasma rotation has not been
established in the core in high current discharges. This is because since carbon emission
profiles burn up inside the hot core < r/a =0.7 rendering it very difficult to obtain a
reliable measurement of the plasma flow. But it is expected that the close co-
relationcorrelation discussed observed inat low currents should also prevail at higher
currents as well. Such comparisons will be made in the short-term future with the
CHERS diagnostic measurement of the core toroidal flow.
3.2.4. MST Discharges
There are basically 3 different types of plasmas produced in MST, namely (a) standard,
(b) pulsed poloidal current drive (PPCD) and (c) spontaneous enhanced confinement
[ref]. There are various permutations in on a standard discharge and with the plasma
produced in each is found to be characteristically different from the otherunique in
some characteristic. While changing the plasma current and density alone can produce
differences in plasma discharges, the permutations described herein result from changes
brought about by more complicated mechanisms. Three such discharges are: locked,
edge biased and f=0 discharges [ref]. Locked and edge biased discharges are interesting
from an HIBP perspective because the measured plasma potential and radial electric
field are both different from the standard discharge. Only HIBP measurements
associated with the variations in the standard discharge will be discussed in this thesis.
Typical time traces of the various parameters in these discharges will be plotted
presented and discussed in connection with the experiments in chapter 4.
15
15

3.2.4.1 Standard discharge
The word “standard” in this context refers to the most basic type of plasma produced in
MST. In these discharges, no extra effort is required to clean the vacuum vessel walls,
take extra efforts to monitor fuel injected into the plasma (enhanced confinement
discharge [ref]), or to apply external electric fields to modify plasma currents (pulsed
poloidal current drive discharges). The current in the standard discharge ranges from
120 kA to up to 500 kA. Low current discharges range from 200-280 kA and high
currents range from 380-450 kA. Certain minimum conditions are required to produce
this discharge, namely a relatively good vacuum (> 2 e-6 Torr) and relatively clean
MST chamber for plasma breakdown to occur (plasma cleanliness is not easily
quantitatively explained). The standard discharges, for the most part, are rather
reproducible and allow for averaging of data collected even over different sawtooth
events (discussed below). On a shot to shotshot-to-shot basis, the main variations in the
standard discharge are the rotation velocity of the n=6 mode velocity, the electron
density and instances the times at which sawteeth occur during the discharge. The
operational range of the various plasma parameters in a high current standard discharge
is quantitatively described in table 3. Details about Cchanges in these parameters over
the time period associated with HIBP measurements will be discussed in chapter 4.
Table 3
MST parameter Value380 kA
1.0 x
0.358 T
16
16
Ken Connor, 01/03/-1,
There is no range presented for most parameters.

325 eV
300 eV
6 %
1-2 ms
Pulse length 70 ms
3.2.4.2. Locked discharge
A locked discharge is produced when a rotating magnetic structure phase locks relative
to the vacuum vessel, or simply ceases to rotate in the lab frame. In the MST, such a
magnetic structure is the n=6 toroidal number mode. Mode locking occurs when the
mode’s angular velocity is made to match that of some other entity such as an externally
applied field error though an electromagnetic torque. Typically in a standard discharge,
the phenomenon of locking occurs immediately following a sawtooth crash. Prior to the
sawtooth crash, the phase velocity of the n=6 mode reaches up to 40 km/s, although
values in the range of 20-30 are more typical. In the time period of ~100 s near the
crash there is a rapid deceleration of the mode, a phenomenon described as temporary
locking. Immediately following the sawtooth crash the modes are observed to re-
accelerate on a slower time scale of a few ms. In some instances, due to the
electromagnetic interaction between a field error and the magnetic mode, the
acceleration is retarded and the mode remains permanently locked for the remainder of
17
17
the discharge [ref]. FIGURE 6 shows the time trace of the n=6 mode phase velocity in a
typical locked discharge.
FIGURE 6. n=6 mode velocity in a locked discharge. Locking occurs at 13.5ms.
While the mechanisms underlying the phenomenon of mode locking are
identified, detailed information about the relationship between plasma parameters or
equilibrium quantities and locking is not quite clear. In particular, the relationship
between the radial electric field and mode locking is an interesting study because of the
close physics ties of both with plasma rotation.
Characteristically, the plasma condition in locked discharges tends to be rather
degraded. The plasma confinement time rapidly decreases, the density can increase or
remain constant, while the electron temperature decreases [ref]. The plasma potential in
the core is also observed to decrease in locked shots by about 500-600V. Locked
discharges can be produced at almost any plasma current, though it is more prevalent in
high current discharges, where the modes can lock spontaneously during the discharge.
The occurrence of locking is also observed to increase with plasma density at fixed
plasma currents. In discharges where locking does not spontaneously occur, the plasma
18
18

can be induced into locking by application of externally applied field errors [ref]. This
method is often used to produce locking in low current discharges.
Locking is also dependent to an extent on the fueling species. Natural locking
tends to be less prevalent in standard 250-380 kA plasmas, which use Deuterium as the
main fuel species. On the contrary, Hydrogen plasmas tend to naturally lock even at low
plasma currents [ref].
3.4.2.3 Edge Biased discharge
In low plasma currents (less than 280 kA), insertion of biased electrodes in standard
rotating plasmas hasve been found to impact the edge and core rotation. Particularly, the
rotation at the edge is observed to increase substantially while that at the core is seen to
slow down considerably. Thus, there has been considerable interest in investigating the
radial electric field in response to these dramatic changes in rotation. While the edge
electric field has been measured with probes in such discharges, in the core had
remained uninvestigated until now. measurements in the edge have been shown to
exhibit strong E x B flow shear behavior, and results are consistent with the reduction in
electrostatic turbulence induced particle transport due to enhanced flow shear [ref-
terry]. On the other hand, biased discharges are not bereft of biasing does not reduce
the magnetic fluctuations that plague the standard discharge in MST, hence no
reduction in magnetic fluctuation induced particle transport is observed in these
discharges.
The procedure of bringing about a biased discharge is illustrated in FIGURE 7
[ref]. Typically a couple of probes or current injectors are inserted 8-10cm into the
19
19
Ken Connor, 01/03/-1,
Electrodes?
Ken Connor, 01/03/-1,
Reference? I have not caught all the places where you need to add references, so check everything over carefully to be sure that you have not just stated something without any support. Also, be sure that the reader knows the difference between the edge and the core.

plasma and turned on for a period of 10 ms during the middle of a discharge. Current is
driven along the magnetic field by applying an electrostatic voltage between electrodes
that intercept the field lines. Electrons are injected along the field lines and an electron
current equal to the injected current is simultaneously driven across magnetic field lines
to the wall [ref].
FIGURE 7. Set up for producing a biased discharge. The probe is biased negative with respect to the MST vacuum chamber.
The mode and plasma rotation at the edge are affected in the following way. The
J x B forces created by the injected current exerts a torque on the plasma causing a
strong toroidal flow. At the edge the magnetic field is mostly in the poloidal direction
and the injected current is radial thus causing a net toroidal force. Naturally, the overall
dynamics of mode rotation is determined by a torque balance between the forces due to
viscosity, other drag forces and that due to the J x B forces caused by current injection.
The forces that affect the rotation are in the toroidal direction, hence it is also assumed
that E x B forces at the edge are expected to contribute to the total flow there. While the
changes in the edge flow can be explained by the changes brought about injecting edge
radial current, the changes in the core flow profile are due to other mechanisms. One
20
20
Ken Connor, 01/03/-1,
More than one electrode?
such mechanism is due to viscous coupling between the edge and the core plasma that
brings about a change in the core rotation in response to the changes at the edge. The
exact dynamics is are more complicated and described in [ref]. Experimental
measurements of core flow in these discharges show that the overall magnitude of the
toroidal impurity flow is reduced by over 75% over the duration of biasing. The
poloidal impurity flow is not observed to change much at all. The impact of this change
in rotation will be discussed further in chapter 6 in connection with the radial electric
field measurements in the core region. One of the main reasons biased discharges are
limited to low currents is because of probe survival issues. High plasma temperatures
are characteristic of higher temperatures and provide virtually no chance for probe tip
survival.
Besides changes in rotation, a dramatic increase in the plasma density also
occurs during the time of biasing. This increase is primarily due to the emission of
particles from the probes. High level of UV radiation also takes place in a biased
discharge and is primarily due to the increase in the impurity species from probe
contamination. The UV level can increase by more than a factor of 4-5 times compared
to a standard discharge. This poses significant challenges for HIBP measurements
because of UV loading of HIBP ion beam deflection system [ref].
3.2.5 Diagnostics
The MST is diagnosed by a plethora of diagnostics that measure a host of important
plasma parameters [ref]. The type of diagnostic, the plasma parameters measured by
each MST diagnostic and the operating conditions conducive for each tool experimental
21
21
Ken Connor, 01/03/-1,
High temperatures are like high temperatures? You better try to write this again.
Ken Connor, 01/03/-1,
Is this the same reference? It is not clear.

conditions under which each is able to operate is are given in TABLE 4 below. The
actual range of plasma coverage is not indicated in the table and varies from diagnostic
to diagnostic.
DIAGNOSTIC PARAMETER OPERATIONAL RANGE
Thomson Scattering Electron temperatureIon dynamics spectrometer Limited to plasma
edge in high IpCHERS Ion density &
temperature profile>250 kA
Rutherford Scattering Ion temperatureImpurity line monitors UV Radiation
Co2 interferometer Density profile All IpFIR interferometer Central density All Ip
Polarimeter Current profile High IpCoil array/ Rogowski coils Magnetic fluctuations All Ip
Motional Stark Effect Mean B on axis All IpHIBP Plasma Potential
Electric fieldPhi/ n fluctuations
>250 kAUV loading affects
sweeps in f=0Langmuir probe Plasma Potential
Electric fieldPotential/density
fluctuations
Limited to edge in low and high Ip
Table 4. List of diagnostics on MST.
3.2 HIBP
In this section the HIBP diagnostic [ref], will be described. It is to be emphasized that
the HIBP is quite superior in a number of ways to Langmuir probes [ref], which are also
utilized to measure the plasma potential. The unperturbing nature of HIBP
measurements and the accessibility to the core makes this diagnostic unparalleled in the
area of electric field measurements. But this advantage does not come without
limitations. Whereas probes are easy to install and operate and do not require
knowledge of complicated magnetic geometries, the HIBP operation is relatively
22
22
Ken Connor, 01/03/-1,
This section is pretty pointless..

tedious, requires precise calibration, alignment and routine maintenance and the data
gathered requires significant interpretation. The actual complexity of the HIBP arises
from the large number of components in the system. Despite the vast number of issues
the principle of HIBP diagnostic is remarkably simple.
3.2.1 Technique of Heavy Ion Beam Probing
The technique of Heavy ion beam probing is illustrated in FIGURE 8 . The MST-HIBP
operation is based on the injection of consists of injecting energetically charged ion
species consisting of Sodium or Potassium ions into the MST plasma. These singly
charged ions called the “primary beam” becomes further ionized in the plasma,
primarily due to collisions with the plasma electrons. This ionization occurs along the
length of the entire primary beam and the resultant doubly ions ized beam becomes
separated from the primary by virtue of the Lorentz force acting on the particles as
shown in FIGURE 8.
23
23

Title:msth.epsCreator:fig2dev Version 3.2.3 Patchlevel Preview:This EPS picture was not savedwith a preview included in it.Comment:This EPS picture will print to aPostScript printer, but not toother types of printers.
FIGURE 8 Principles of Heavy Ion Beam Probing
While this spray of secondary ions emanates along the primary beam, only a portion of
it actually exits from the machine vessel and enters the region of the HIBP called the
“secondary beamline”. There the secondary beam is no longer acted upon by the
magnetic fields in the plasma and quite simply drifts towards the entrance of the
electrostatic energy analyzer. In practice, tThe MST-HIBP system is equipped with
electrostatic deflection plates in the secondary beamline to alter the ion beam trajectory.
The beam then enters the analyzer through a 10 cm by 0.6cm opening called the
“entrance aperture”. There are three such apertures in the MST HIBP analyzer and their
opening sizes can be individually controlled. The HIBP analyzer utilizes an electrostatic
field to deflect the incoming ion beam onto a detector (also shown in FIGURE 8). This
detector consists of four electrically isolated plates, of which two are placed side by side
vertically and horizontally, respectively. The beam energy of the secondary beam is
computed using experimentally determined calibration constants, the relative amounts
24
24

of signal on the four detector plates and knowledge of the angles of the analyzer
orientation with respect to the beamline axis.
3.2.2 Principles of potential measurement
The HIBP measurement of plasma potential is based on the principle of conservation of
energy. An illustration of potential measurement is shown in FIGURE 9.
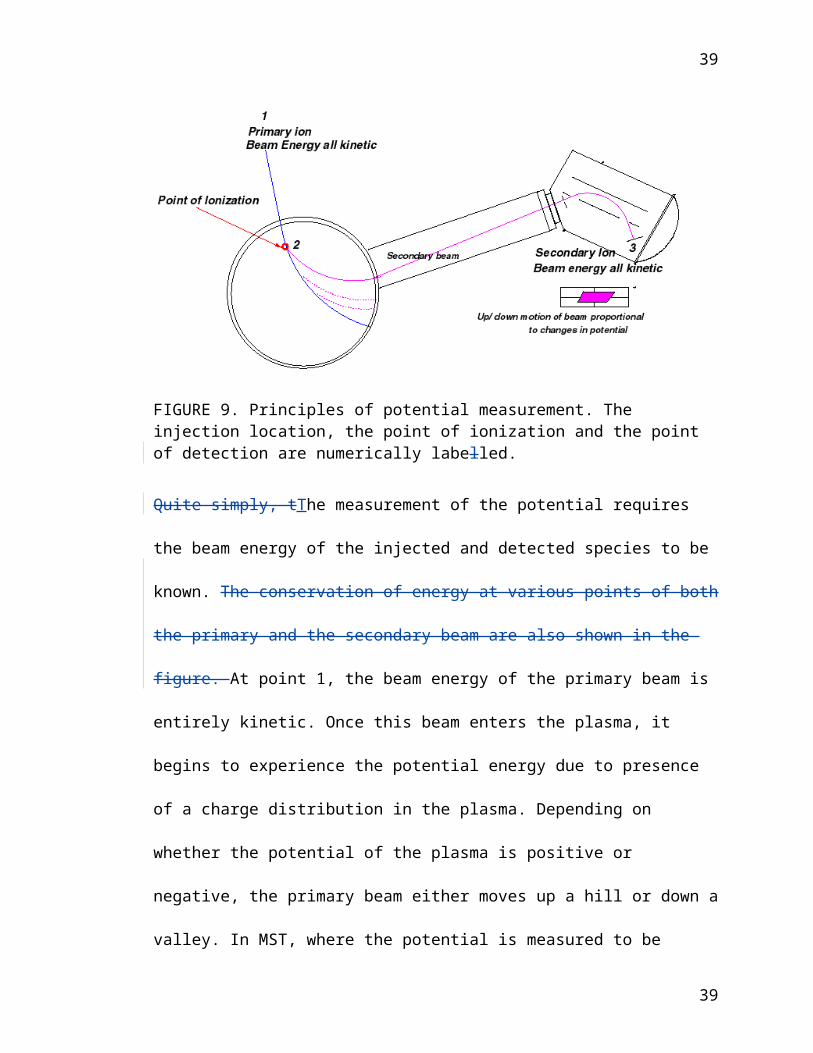
FIGURE 9. Principles of potential measurement. The injection location, the point of ionization and the point of detection are numerically labelled.
Quite simply, tThe measurement of the potential requires the beam energy of the
injected and detected species to be known. The conservation of energy at various points
of both the primary and the secondary beam are also shown in the figure. At point 1, the
beam energy of the primary beam is entirely kinetic. Once this beam enters the plasma,
it begins to experience the potential energy due to presence of a charge distribution in
the plasma. Depending on whether the potential of the plasma is positive or negative,
the primary beam either moves up a hill or down a valley. In MST, where the potential
25
25

is measured to be positive, the ion beam slows down as it moves up the potential hill. In
doing so, it loses its kinetic energy and gains an equivalent amount of potential energy
(assuming that collisions have not caused the particles to loose any energy). At point 2,
the ion that has moved up the hill looses an electron and becomes doubly charged1. The
beam energy of this “new” species is now different because of the loss of an electron.
The kinetic energy of the new beam is not different from the kinetic energy of the
primary beam because the momentum transfer that takes place during the electron loss
process is negligible. However, the potential energy of the primary beam is different
from that of the secondary because of difference in the electronic charge of the two
species. The doubly charged beam now makes its way down the potential hill and
proceeds to exit the plasma, gaining kinetic energy in the process. Once it exits the
plasma, its energy is entirely kinetic. The general expression for the plasma potential
can be obtained in the following way:
The total energy of the primary beam at points 1 and 2 are is given by:
(1)
(2)
where, T and U refer to the kinetic and potential energy respectively. The subscript
“primary “ refers to the primary beam. The numerical subscript refers to the location in
the system as shown in FIGURE 9.
Since the total energy is conserved, we can equate (1) and (2):
or rearranging:
1 There is nothing special about location 2. Ionization occurs along the entire path of the primary beam. Point 2 here simply illustrates a point where the emerging secondary beam can follow a trajectory which will allow it to safely exit the MST chamber and be detected.
26
26
(3)
The total energy of the secondary beam at point 2 and 3 isare:
(4)
(5)
Similarly equating the total energy of the secondary beam at points 2 and 3 we get:
(6)
Since the kinetic energy of the primary and the secondary beam at point 2 are not very
different (difference being equal to the kinetic energy of the electron), these two
quantities can be equated to one another. I.e:
Equation 6 then becomes:
(7)
Substituting the expression for from equation 3 in equation 7 we get:
Re-arranging this we get:
(8)
The potential energies in the above equation can be expressed in terms of the plasma
potential ( ) of the measurement location.
27
27

The terms on the right can be expressed in terms of measurable HIBP primary beam (
) and secondary beam ( ) energies. The primary beam energy is simply
the charge of the primary beam times the accelerating voltage.
The charged species in the MST-HIBP experiments are simply singly and doubly
ionized. I.e
Finally expressing equation 8 in terms of the above quantities and re-arranging we get:
(9)
While the beam energy of the injected beam is relatively straightforward to
obtain, calculation of the energy of the secondary beam is not trivial. The secondary ion
beam energy is given by the following formula [ref]:
The quantities featured in this equation are: (a) The accelerator and analyzer voltages,
(b) calibration constants of the analyzer, namely the “gain (G)” and “offline processing
term (Ff)” and (c) the detected signals on each of the four detector plates.
In terms of this new definition for the detectedthe measured secondary beam energy
equation 9 can be re-expressed as:
(10)
28
28

This equation shows that the accuracy of the measurement on of plasma potential
weighs very heavilydepends on the how well the energy analyzer is calibrated.
However, for the measurement of the radial electric field the more important quantity is
the offline processing term. Equation XX (10) does not into account any angular effects
in the computation of plasma potential. In general the two calibration constants G and F
are functions of two angles and . These angles are illustrated in FIGURE 10 and
measured with respect to the beamline and analyzer. The impact of their effects will be
treated in the appendices.
FIGURE 10. Illustration of angles and made by the secondary beam. The FIGURE
on the top is a view from above and the FIGURE below is a side view of the system
3.2.3 MST-HIBP system
29
29
Ken Connor, 01/03/-1,
This statement is not correct. G and F are functions of angle, so angular dependence is included.
Ken Connor, 01/03/-1,
Doesn’t calibration give you both G and F?

The MST-HIBP system [ref] was custom designed for the Madison Symmetric Torus.
However, a large percentage of the system requirements were adapted from previous
Rensselaer HIBP systems. A great deal of the system is documented in [ref]
The MST HIBP system consistscomprises of the following essential items: An ion
accelerator, two beamlines- one for the primary beam and one for the secondary beam,
multiple sets of sweep or deflection plates- needed for steering the primary and
secondary beam, high voltage power supplies, an electrostatic energy analyzer and high
voltage measurement equipment. An outline of the system is illustrated in FIGURE 11.
The energy analyzer will be discussed in appendix B.
The accelerator injection system in the present MST-HIBP system is a linear
accelerator with two electrodes that initially launch the ions into the long accelerating
column. The accelerating column consists of a series of precision divider resistors. The
present accelerator has been safely tested at over 100 keV, although the power supplies
are capable of providing 200 kV. In the ATF, a slightly modified version of this
accelerator system operated at up to 200 kV in an SF6 enclosure. Other equipment such
as the power supplies and precision dividers were all previously utilized in the ATF and
ISX-B HIBP systems. Information about them can be found in [refs]. The high
precision voltage dividers as well as the meters that were attached to it for reading the
high voltage system were re-calibrated at Ross High Voltage corporation.
30
30
Ken Connor, 01/03/-1,
Write a shorter version of the sentences I deleted. The info you have provided is mostly of no use.
Ken Connor, 01/03/-1,
You will have to choose either MST HIBP or MST-HIBP, but not both.

FIGURE 11 Major components of the MST-HIBP system
3.2.3.1 MST-HIBP design work
There are many important items that needed consideration in designing an HIBP
system. While the HIBP had to be custom designed, the specific problems facing the
initial design work harbored focused on two main items: the beam energy requirement
and the location of the primary and the secondary beamline. These two items were
addressed in a preliminary design study where it was determined that the MST-HIBP
had an enormous good deal of flexibility in the ion species to be used for probing. In
addition, it was determined that a highly three dimensional beamline positioning would
be required for successful detection of the secondary ion beam. Secondly, given the
sheer size of the diagnostic, the real-estate requirements also played important role in
31
31
Ken Connor, 01/03/-1,
Be specific. Give some real information on the required angular range.

the design work. In this regard, several different schemes were investigated that ensured
that the HIBP location on MST would not be impeded by fit with already existing
diagnostics and other machine hardware. This aspect of the design work required a great
amount of theoretical work primarily because the choice of port pairs was to be
determined based on what would provide the optimal coverage of the plasma, which at
the same time had to also satisfy real estate constraints. Thirdly, the incorporation of
previously existing components from the ATF, ISX-B and the TEXT HIBPs has been
an important part of the design work of the MST-HIBP diagnostic. This has been both a
cost as well as a time saving feature of the design. Finally, a number of other important
issues ranging from overcoming challenges provided by small ports and large level of
UV during the plasma discharge played an equally important role in the final shaping of
the MST-HIBP design. [ ref]
3.2.3.2 Beam energy requirement
The beam energy requirement is addressed by examining the equation for the Larmor
radius of the HIBP beam in a given magnetic field.
32
32

(11)
Rearranging the above equation and setting the condition that (minor radius) we
obtain the following relation:
(12)
HIBP parameters are on right hand side of this equation and are expressed as a function
of ion beam parameters. Where refers to the beam energy of the HIBP ion beam
and “m”m is the mass of the beam species. The left hand side of the equation is
expressed in terms of machine parameters namely, (a) , B is the peak magnetic field and
(b) a is the minor radiusi.
The inequality arises because of the need for the HIBP ion beam to escape any possible
confinement in the plasma. What is important to observe in the above equation is that
the beam energy varies as the square of the magnetic field, which in MST is
significantly less than those of other beam probe systems.
The maximum magnetic field in the MST is in on the order of 0.48 T. This is a
rather modest magnetic field for the HIBP considering that former devices include a 2T
magnetic field in the TEXT-tokamak. The relatively weak magnetic field and the
relatively large minor radii, compared to other RPI-HIBP’s, limited the beam energy
requirement to low values. Initial calculations of the beam energy indicated that a 40-90
keV Na beam was adequate for HIBP operations on MST. Given the low magnetic
fields and the voltage capability of the HIBP accelerator, even Li ions were considered
feasible for HIBP experiments. The beam energy requirements for Lithium would push
the ion accelerator to its operational limits of 200 keV. Early trajectory calculations also
33
33

showed that a very low energy Li beam (7 keV) could also be used to probe the extreme
edge region of MST [ref]. Given the choice of ions and the range of beam energy, the
MST-HIBP system can be viewed to be an incrediblya very versatile system from the
perspective of Heavy ion beam probing.
The beam energy range indicated above was used as a preliminary guide in two
areas of initial system design study. Firstly, it provided an idea of the maximum beam
energy requirement, which ultimately was used to determine the type of accelerator
needed for the system. Secondly, the projected beam energy served as a guide for
trajectory modeling. These simulations were an integral part of the design work in that
they helped determined the specifics of the energy requirements, the ion species choices
available and layout of the two beamlines.
3.2.3.3 Trajectory modeling and port pair determination
There are three essential ingredients for carrying out trajectory simulation
studies. The first is identifying the inputs for computer simulations, second is the
development of the program that computes the various ion orbits and the third
ingredient is the magnetic field of the machine that is to be probed.
Computer simulations help determine what region of a plasma cross section can
be experimentally investigated and help answer questions regarding the nature of
deflection system required for steering the primary and secondary ion beams. On a new
system, the simulation work is also inherently related to the ports that are available for
use or to establish the choice of ports if none have been pre-determined. In MST port
pairs could not be a-priori specified and the simulation study revolved around fixing
34
34
Ken Connor, 01/03/-1,
The paragraph is too wordy. Just say that no existing port pair was found to work so the design was based on selecting the largest available port for the secondary beam line and locating a new port for the primary beamline. Also, the input port was kept as small as possible to meet MST field error requirements.

one port that was available and then varying the location of the other port to search for
the optimal beam-probe design. In this regard, the location of the exit port was fixed
while the entrance port (primary beamline) was allowed to vary. This is because the
secondary beam fan spans the entire exit port, while the primary beam is limited to
~1cm in diameter. In MST the largest available port was 4.5” and was chosen for this
purpose.
Simulation of the trajectory of the HIBP primary and secondary ion beams were
conducted to determine (a) the location of the entrance port and (b) the overall plasma
coverage. This part of the study required a great amount of iteration because of the need
of the trajectory simulation to not only start with a given injection port, but also to
determine the plasma coverage using this port [ref –dong’s thesis, rpi report, proposal].
At the core of the computer simulation program was a fortran code which solved
a differential equation governing the motion of a charged particle in a magnetic field.
This code was utilized in various other RPI-HIBP machine design studies and was
subsequently modified for adaptation to the MST [ref-steve aceto]. The standard inputs
to the trajectory simulation program apart from those described above are (a) the choice
of probing species and (b) the energy of the injected beam. Other variables include the
direction at which the ion beam is injected into the plasma.
Preliminary information about the magnetic field was provided by the MST
group. Since the HIBP ion orbits are extremely sensitive to the magnetic field, the
accuracy of the trajectory study is determined to a large extent by just how well
established the magnetic equilibrium is. It is in this context, that the design of the MST-
HIBP experienced one of the largest obstacles. The magnetic model that was initially
35
35
Ken Connor, 01/03/-1,
Do not editorialize. Again, I may have missed some of these statements, so check over your entire thesis to be sure that you eliminate them. You also never give any specific information on how accurate any of the field models are. I know you discuss this elsewhere, but remember that you must be quantitative in your presentation. Also, you should mention the differences in the trajectories that result from the different models.
Ken Connor, 01/03/-1,
No one cares how much work it was.

provided for the purpose of computing the ion orbits was an alpha model [ref- on alpha
model and new model]. This model describes the pressureless equilibrium of the MST.
While some of the early design work was carried out using the alpha model, it was soon
repeated using a more accurate two- dimensional toroidal model. The results between
ofthe two models were noticeably different as expected [ref-lei hibp paper].
One outstanding feature of tThe HIBP ion orbits in the MST is their highlyare
fully three dimensional nature. Typical primary and secondary ion beam trajectories in
the MST are illustrated in FIGURE 12 ( Prof Connor, I will include this as soon as I can
get the screen capture software to work-11/27/01). These trajectories are much like
those in a Stellarator [ref]. Three-dimensional trajectories in MST arise because of the
relatively equal magnitudes of the poloidal and toroidal components of the confining
magnetic field. In MST, the toroidal field component dominates in the core region while
the poloidal component starts to become larger at r/a~0.4. Hence, the toroidal deflection
of the primary and secondary beam is unavoidablesignificant.
The results of trajectory modeling for the experiments discussed in this thesis
will be discussed at length in chapter 5. Recently established techniques for determining
new and improved equilibrium corresponding to actual experiments have played an
integral part of the electric field study in the MST-RFP.
The entrance port was located 10 degrees toroidally and 86 degrees poloidally
away from the exit port. The location was also governed to an extent by physical
constraints stemming from the size of the iron core, the length of the primary beamline
and its tilt angle among other things. The poloidal separation was influenced primarily
by the three dimensional nature of the ion beam in the plasma. Real estate constraints
36
36
Ken Connor, 01/03/-1,
Again, this is a useless paragraph. Either say something specific or skip it. You could mention here that the sensitivity of the trajectories to the field has now been used to improve the field model. Just saying something played a part is useless.
Ken Connor, 01/03/-1,
Don’t make your thesis sound like you are telling a story. Describe what was tried and what you learned. This paragraph should be rewritten. Describe the models used to find the trajectories. Why were different models used?

were also important to a lesser extent in determining the length of the secondary
beamline and analyzer.
3.2.3.4 Sweep system design
As discussed in the section above, the result of the simulation study was also
used to design the ion beam deflection system. This system is significantly more
complicated than that installed on any previous RPI-HIBP system.
The layout of the primary beamline deflection system is shown in FIGURE 13.
The type of arrangement of plates shown in this FIGURE is called a cross over sweep
design [ref]. The name cross over stems from the fact that the primary beam is deflected
by two sets of radial/toroidal sweep plates with each set deflecting the beam in
completely opposite directions.
FIGURE 13. Cross over sweep system used to deflect the primary beam ions in the MST-HIBP
The goal of the primary beamline sweeps was to deflect ion beam energies of up
to 200 keV by as much as plus/minus 20 degrees in the radial direction and plus/minus
five degrees in the toroidal direction. The basic components of this system comprise
consist of four sets of stainless steel parallel plates. Two sets of plates are aligned in the
37
37
Ken Connor, 01/03/-1,
Why was a cross over system used? Has this been done before?

toroidal direction and the other two sets are aligned to produce a deflection of the
injected ion beam in the radial direction. The alternate orientation of the deflection
plates is also evident in the FIGURE 13.
A second sweep system was also incorporated in the secondary beamline of the
MST HIBP. This is the first application of such a deflection system on an RPI -HIBP.
Its inclusion was to accommodate the wide spread of angles made by secondary beam
fan that exits the MST vacuum vessel. Unlike the primary there is only one set of plates
capable of steering the fan in a vertical direction and two sets of sweeps that deflect the
beam in lateral or toroidal direction. The layout of this system is shown in FIGURE 14.
FIGURE 14. MST-HIBP primary and secondary sweep systems
3.2.3.7 Other design work
Like cross over sweeps, magnetic suppression structures in the primary and secondary
beamlines are among some of the newer components in the MST-HIBP. Numerous tests
were conducted pre-installation, to determine characterize the loading suffered by the
HIBP deflection plates due to the plasma particles and UV escaping from the ports.
Despite the relatively small size of the entrance and exit ports in the MST, tests of
scaled sweep plates showed that the level of UV and plasma was so abundant large that
38
38
the plates could barely hold any voltage with out some kind of a suppression scheme
[ref].
Further experimentation at 200 kA plasma current and density of 1 x were
performed. The system included a small 1 cm aperture, magnets and a wire mesh. These
tests showed that both positive and negative voltages of up to +/- 5kV could be held
[ref]. In general the plates could not hold much positive voltage because of current
saturation. However, the aperture size of 1 cm was too small for a practical HIBP
experimentation. In order to fully utilize the ports available new magnetic suppression
schemes were devised.
A more detailed description of the magnet surpression structure in the primary as well
as the secondary beamline as well as their performance is given in [ref]. In
summarySummarily, one magnetic aperture was utilized in the primary beamline and
two large magnetic apertures were put in place in the secondary beamline. The peak
magnetic field in the center of the latter structure is in the order of 2 kG. A photograph
of one of the two magnetic apertures used in the secondary beamline is shown in
FIGURE 15. The housing is fixed inside one of the spool pieces connecting the
secondary beamline to MST. The back of the secondary beamline gate valve is also
seen in this picture. In many experiments up to 12 Nd magnets were utilized.
3.2.3.6 Summary
The MST-RFP has provided a novel opportunity for the HIBP diagnostic. The
design of the MST-RFP allowed for operational ease and the ability to reproduce large
number of plasma discharges in a given day. There are a wide variety of interesting
39
39
Ken Connor, 01/03/-1,
Again, this is an almost useless paragraph. A thesis is not a story. Give specific information. The summary is an opportunity to highlight the key aspects of the section and to show that you understand the big picture.
Ken Connor, 01/03/-1,
You need to be more specific. What is being suppressed? What was tried and why? What was the final configuration settled on and why? What is the impact on the theoretical performance of the HIBP? Any kind of aperture will limit performance.

discharges that can be produced in the MST-RFP. These are interesting from the view
point of HIBP measurement of radial electric field because of the physics connection
with plasma rotation. The plasma produced magnetic fields and the dynamo activity in
the RFP has presented challenges for the MST-HIBP system design and operation. The
MST-HIBP design work, fabrication of required parts, installation, calibration,
operation and data analysis spanned almost 6years. This was the first ever beam probe
to be installed in an RFP device and was challenged during every phase described
above. A great deal of new development work was incorporated into the design of the
MST-HIBP system, which was essential for its proper functioning.
40
40