THESIS DIETARY FIBER CONTENT OF DRY PEA, CHICKPEA AND ...
73
THESIS DIETARY FIBER CONTENT OF DRY PEA, CHICKPEA AND LENTIL DETERMINED USING THE CONSENSUS ANALYTICAL METHOD, AOAC 2011.25 Submitted by Yiran Chen Department of Horticulture and Landscape Architecture In partial fulfillment of the requirements For the Degree of Master of Science Colorado State University Fort Collins, Colorado Fall 2017 Master’s Committee: Advisor: Henry Thompson Mark Brick Stephen Wallner
Transcript of THESIS DIETARY FIBER CONTENT OF DRY PEA, CHICKPEA AND ...

THESIS
DIETARY FIBER CONTENT OF DRY PEA, CHICKPEA AND LENTIL DETERMINED
USING THE CONSENSUS ANALYTICAL METHOD, AOAC 2011.25
Submitted by
Yiran Chen
Department of Horticulture and Landscape Architecture
In partial fulfillment of the requirements
For the Degree of Master of Science
Colorado State University
Fort Collins, Colorado
Fall 2017
Master’s Committee:
Advisor: Henry Thompson
Mark Brick
Stephen Wallner

Copyright by Yiran Chen 2017
All Rights Reserved

ii
ABSTRACT
DIETARY FIBER CONTENT OF DRY PEA, CHICKPEA, AND LENTIL DETERMINED
USING THE CONSENSUS ANALYTICAL METHOD, AOAC 2011.25
The health benefits of dietary fiber and its constituents have been well documented. However, the
consumption of dietary fiber is lower than recommended levels worldwide, and the gap between actual
consumption and recommended intake represents a widely unrecognized health risk. One approach to
address the dietary fiber gap is to return to an ancient tradition that was abandoned in the last 50 years, i.e.
the consumption of pulse crops as a dietary staple. To better advocate for an increase in pulse
consumption, the determination of the fiber content of these crops using the consensus definition of
dietary fiber published in 2009 and the method that conforms to that definition (AOAC 2011.25) is
needed. The overall goal of this thesis was to analyze the dietary fiber content of three major pulse crops,
dry pea (Pisum sativum L.), lentil (Lens culinaris L.) and chickpea (Cicer arietinum L.) using the
consensus definition and method of analysis.
OBJECTIVE: The objectives of this project were: 1) to measure dietary fiber content of dry pea, lentil
and chickpea using the AOAC 2011.25 method, and 2) to explore relationships among fiber content,
pulse genotype (cultivar) and the environment in which these crops were grown.
REASERCH DESIGN AND METHOD: The pulse crops analyzed included 11 cultivars of dry pea,
13 cultivars of lentil and 24 cultivars of chickpea, each grown in two locations. Each cultivar was
analyzed for insoluble dietary fiber, soluble dietary fiber, oligosaccharides and total dietary fiber content
using the AOAC 2011.25 method of analysis.
RESULTS: Average total dietary fiber content was 24.6% for dry pea, 20.1% for lentil, and 21.8% for
chickpea. The range in total dietary fiber was from 20.1 to 30.6% among dry pea cultivars, from 17.6 to
iii
21.6% among lentil cultivars and from 15.8 to 25.8% among chickpea cultivars. Dietary fiber content in
pulse crops varied significantly by cultivar while location of production had a limited effect.
CONCLUSION: The pulse crops assessed varied widely in dietary fiber content among cultivars within
species indicating that breeding and selection can be used to improve pulse crops for this health beneficial
trait, without concern that those improvements would be influenced by factors such as location of
production. Overall, the pulse crops investigated had high dietary fiber content relative to other food
crops, e.g. wheat (T. aestivum L.), corn (Zea mays L.), or rice (Oryza sativa L.), that are widely promoted
in efforts to close the dietary fiber gap. Consumption of 2 to 3 servings per day of any of these pulse crops
would eliminate the dietary fiber gap. The data presented also indicated that consumers can be guided to
choose pulse crop cultivars that are enriched in fiber content as a way to further improve dietary fiber
status without increasing caloric intake. Re-establishing pulse crops as a staple in Western diets
illustrates the potential value of considering the pursuit of ancient solutions to solve 21st century
challenges at the interface of agriculture and human health.

iv
ACKNOWLEDGEMENTS
Firstly, I would like to give my heartfelt thanks to Dr. Henry Thompson for his mentorship in the past few
years and his supervision in finishing this thesis. I enjoyed very much the learning experience as well as
the learning and research environment provided by him.
I would also like to thank the committee members of my oral defense, Dr. Thompson, Dr. Brick and Dr.
Wallner for their guidance. I want to acknowledge every member of the Cancer Prevention Laboratory for
their assistance in my study process. Dr. Vandemark and Dr. McGee shared the knowledge about pulse
crops and Dimas Echeverria shared the experimental methods and skills with me. I own their thanks for
help.
Last but not the least, I would like to thank my parents and the other family members. Their continuous
support and encouragement are indispensable for me.

v
TABLE OF CONTENTS
ABSTRACT .................................................................................................................................................. ii
ACKNOWLEGEMENTS ............................................................................................................................ iv
LIST OF TABLES ...................................................................................................................................... vii
LIST OF FIGURES ................................................................................................................................... viii
CHAPTER 1 INTRODUCTION .................................................................................................................. 1
1.1 Overview ............................................................................................................................................ 1
1.2 The definition of dietary fiber and its constituents ............................................................................ 1
1.2.1 Insoluble dietary fiber ...................................................................................................................... 2
1.2.2 Soluble dietary fiber ......................................................................................................................... 3
1.2.3 Oligosaccharides .............................................................................................................................. 3
1.2.4 Summary ......................................................................................................................................... 4
1.3 The health benefits of dietary fiber ..................................................................................................... 4
1.3.1 Prebiotic effects and gut health ........................................................................................................ 4
1.3.2 Weight maintenance ......................................................................................................................... 5
1.3.3 Diabetes prevention ......................................................................................................................... 5
1.3.4 Cardiovascular Diseases (CVD) ...................................................................................................... 6
1.3.5 Cancer prevention ............................................................................................................................ 6
1.4 The dietary fiber intake gap ................................................................................................................ 7
1.5 Pulse crops, potential candidates to the close the dietary intake gap .................................................. 8
1.6 The objectives of the study ................................................................................................................. 9
CHAPTER 2 MATERIALS AND METHODS .......................................................................................... 10
2.1 Experimental design .......................................................................................................................... 10
2.2 Sample preparation ........................................................................................................................... 10
2.3 AOAC 2011.25 integrated total dietary fiber assay .......................................................................... 10
2.4 Buffer preparation ............................................................................................................................. 10
2.5 Sample Digestion .............................................................................................................................. 11
2.6 Analysis of insoluble and soluble dietary fiber ................................................................................. 12
2.7 Analysis of Oligosaccharides ............................................................................................................ 13
2.8 Protein and Ash Correction ............................................................................................................... 14
2.9 Calculations....................................................................................................................................... 14

vi
CHAPTER 3 DIETARY FIBER CONTENT IN DRY PEAS .................................................................... 16
3.1 Introduction ....................................................................................................................................... 16
3.2 Sample description and measurement ............................................................................................... 17
3.3 Results ............................................................................................................................................... 20
CHAPTER 4 DIETARY FIBER CONTENT OF LENTIL SAMPLES ..................................................... 29
4.1 Introduction ....................................................................................................................................... 29
4.2 Sample description and measurement ............................................................................................... 29
4.3. Results .............................................................................................................................................. 34
CHAPTER 5 DIETARY FIBER CONTENT OF CHICKPEA SAMPLES ............................................... 42
5.1 Introduction ....................................................................................................................................... 42
5.2 Sample description and measurement ............................................................................................... 43
5.3. Results .............................................................................................................................................. 47
CHAPTER 6 PULSE CROP SUMMARY: COMMON BEAN, DRY PEA, LENTIL AND CHICKPEA 54
6.1 Total dietary fiber contents among different pulse crops .................................................................. 54
6.2 Summary ........................................................................................................................................... 57
REFERENCES ........................................................................................................................................... 59

vii
LIST OF TABLES
TABLE
TABLE 3.1 INSOLUBLE DIETARY FIBER (IDF), SOLUBLE DIETARY FIBER (SDF), RAFFINOSE,
STACHYOSE, VERBASCOSE, TOTAL OLIGOSACCHARIDES AND TOTAL DIETARY FIBER
(TDF) AMONG DRY PEA CULTIVARS ................................................................................................. 21
TABLE 3.2 PEARSON CORRELATIONS FOR ALL DRY PEA SAMPLES ........................................ 23
TABLE 3.3 DIETARY FIBER CONTENT FOR DRY PEA SAMPLES BY MARKET CLASSES ....... 24
TABLE 3.4 IDF, SDF, TOTAL OLIGOSACCHARIDES, AND TDF CONTENT BETWEEN TWO
LOCATIONS OF SAMPLES ..................................................................................................................... 25
TABLE 4.1 DIFFERENT MARKET CLASSES OF LENTIL .................................................................. 30
TABLE 4.2 INSOLUBLE DIETARY FIBER (IDF), SOLUBLE DIETARY FIBER (SDF), RAFFINOSE,
STACHYOSE, VERBASCOSE, TOTAL OLIGOSACCHARIDES AND TOTAL DIETARY FIBER
(TDF) AMONG LENTIL CULTIVARS .................................................................................................... 35
TABLE 4.3 PEARSON CORRELATIONS FOR ALL LENTIL SAMPLES ............................................ 37
TABLE 4.4 DIETARY FIBER CONTENT FOR LENTIL SAMPLES OF DIFFERENT MARKET
CLASSES ................................................................................................................................................... 38
TABLE 4.5 IDF, SDF, TOTAL OLIGOSACCHARIDES, AND TDF CONTENT BETWEEN TWO
LOCATIONS OF SAMPLES ..................................................................................................................... 39
TABLE 5.1 INSOLUBLE DIETARY FIBER (IDF), SOLUBLE DIETARY FIBER (SDF), RAFFINOSE,
STACHYOSE, VERBASCOSE, TOTAL OLIGOSACCHARIDES AND TOTAL DIETARY FIBER
(TDF) AMONG CHICKPEA CULTIVARS .............................................................................................. 48
TABLE 5.2 PEARSON CORRELATIONS AMONG ALL CHICKPEA SAMPLES .............................. 50
TABLE 5.3 IDF, SDF, TOTAL OLIGOSACCHARIDES, AND TDF BETWEEN TWO LOCATIONS
OF SAMPLES ............................................................................................................................................ 51
TABLE 6.1 DIETARY FIBER CONTENT OF FOUR PULSE CROPS ................................................... 55
TABLE 6.2 RANGE OF DIETARY FIBER CONTENT (%) AMONG PULSE CROP CULTIVARS ... 55

viii
LIST OF FIGURES
FIGURE
FIGURE 3.1 PHOTOS OF DRY PEA CULTIVARS ................................................................................ 19
FIGURE 3.2 PERCENTAGES OF IDF, SDF, TOTAL OLIGOSACCHARIDES AND TDF AS
REPRESENTED BY THE TOTAL HEIGHT OF THE COLUMN FOR ALL DRY PEA CULTIVARS 22
FIGURE 3.3 PERCENTAGES OF RAFFINOSE, STACHYOSE, VERBASCOSE AND TOTAL
OLIGOSACCHARIDES AS REPRESENTED BY THE TOTAL HEIGHT OF THE COLUMN FOR
ALL DRY PEA CULTIVARS ................................................................................................................... 22
FIGURE 3.4 DIETARY FIBER CONTENTS FOR DRY PEA SAMPLES OF DIFFERENT MARKET
CLASSES .................................................................................................................................................. 24
FIGURE 4.1 PHOTOGRAPHS OF LENTIL CULTIVARS ...................................................................... 33
FIGURE 4.2 PERCENTAGES OF IDF, SDF, TOTAL OLIGOSACCHARIDES AND TDF AS
REPRESENTED BY THE TOTAL HEIGHT OF THE COLUMN FOR ALL LENTIL CULTIVARS ... 36
FIGURE 4.3 PERCENTAGES OF RAFFINOSE, STACHYOSE, VERBASCOSE AND TOTAL
OLIGOSACCHARIDES AND TDF AS REPRESENTED BY THE TOTAL HEIGHT OF THE
COLUMN FOR ALL LENTIL CULTIVARS ........................................................................................... 36
FIGURE 4.4 DIETARY FIBER CONTENTS FOR LENTIL SAMPLES OF DIFFERENT MARKET
CLASSES ................................................................................................................................................... 38
FIGURE 5.1 PHOTOGRAPHS OF CHICKPEA CULTIVARS ................................................................ 47
FIGURE 5.2 THE PERCENTAGE OF IDF, SDF, TOTAL OLIGOSACCHARIDES AND TDF AS
REPRESENTED BY THE TOTAL HEIGHT OF THE COLUMN FOR ALL CHICKPEA CULTIVARS
.................................................................................................................................................................... 49
FIGURE 5.3 THE PERCENTAGE OF RAFFINOSE, STACHYOSE, VERBASCOSE AND TOTAL
OLIGOSACCHARIDES AS REPRESENTED BY THE TOTAL HEIGHT OF THE COLUMN FOR
ALL CHICKPEA CULTIVARS ................................................................................................................ 49

1
CHAPTER 1
INTRODUCTION
1.1 Overview
An important contribution of edible components of plants to the human diet is the carbohydrate polymers
that cannot be hydrolyzed via the endogenous enzymes of the human small intestine. These polymers are
referred to as dietary fiber (1). Dietary fiber has many characteristics, some of which have been reported
to affect physiological function. In addition, increasing levels of fiber in the diet are associated with a
reduction in risk for a number of human disease conditions. A resurgence of interest in dietary fiber and
human health has occurred because inadequate dietary fiber intake is widespread (2). The establishment
of a consensus definition and the development and validation of an integrated method of dietary fiber
analysis that complies with that definition (3) affords the opportunity to evaluate in a uniform manner the
potential contribution of various food crops to human dietary fiber intake. The work reported in this
thesis examines the dietary fiber content of three pulse crops, dry pea, lentil, and chickpea using an
internationally accepted method for dietary fiber analysis.
1.2 The definition of dietary fiber and its constituents
Dietary fiber is an important non-nutritive component of food and has been reported to have various
benefits to human health. In 1976, a definition of dietary fiber was published by Trowell (4). According to
his definition, dietary fiber consists of chemical components which are resistant to digestion by the
alimentary enzymes of humans. As research on dietary fiber progressed, it was realized that Trowell’s
definition of dietary fiber should be modified to include resistant starch (5;6). However, with the deeper
understanding of carbohydrate chemistry and bioavailability, it was determined that oligosaccharides
should also be included as a component of dietary fiber. The CODEX Committee on Nutrition and Foods
for Special Dietary Uses (CCNFSDU) published an internationally agreed upon consensus definition of
dietary fiber in 2009. The current definition states that dietary fiber is comprised of carbohydrate

2
polymers with ten or more monomeric units, which are not hydrolyzed by the endogenous enzymes in the
small intestine of humans. Dietary fiber was classified into three categories: 1. consumed as naturally
occurring in the food, 2. obtained from raw food by physical, enzymatic, or chemical means, and 3.
synthetically produced (7). In the following sections, only naturally occurring dietary fiber will be
discussed.
Naturally occurring dietary fiber has three main components: insoluble dietary fiber (IDF), soluble dietary
fiber (SDF), and oligosaccharides. IDF is mainly comprised of cellulose and resistant starch. The
constituents of SDF include β-glucan, arabinoxylan, pectin, inulin, arabinogalactan, polydextrose and
galactomannan. Among them, arabinoxylan, pectin and inulin will be the focus of discussion since they
are prominent components of pulse crop fiber. Oligosaccharides are carbohydrates containing 3 to 20
sugar units. Of the many oligosaccharides that exist, discussion will be limited to galactans since they are
the major type of oligosaccharides in pulses. IDF is insoluble in both water and ethanol. SDF doesn’t
dissolve in ethanol but can dissolve in water, while oligosaccharides can dissolve in both solvents. The
differential solubility of these three components in water and ethanol is used to isolate and quantify each
component by the AOAC 2011.25 method.
1.2.1 Insoluble dietary fiber
Cellulose is one of the basic components of all plant materials and is composed of -D-glucopyranose
units linked by (1→4) glycosidic bonds (8). Cellulose is an important structural component of the primary
cell wall of plants (9). It is a tough, water-insoluble material that is resistant to degradation in the human
intestine due to the lack of cellulases, i.e., enzymes that cleave the β 1-4 glycosidic linkage. Cellulose
accounts for a large proportion of dietary fiber.
Resistant starches are defined as the portion of starch which is not digested in the upper gastrointestinal
tract (10). Resistant starch usually occurs as granules in plant tissues. Resistant starch can be classified as
types 1, 2, 3 and 4. Type 1 is physically inaccessible to digestion by entrapment in a non-digestible matrix.
Type 2 is ungelatinized resistant granules with type B crystallinity that are slowly hydrolyzed by α-

3
amylase. Type 3 is retrograde starch formed when starch containing foods are cooked and cooled. Type 4
refers to chemically modified resistant starches and industrially processed food ingredients (11).
1.2.2 Soluble dietary fiber
β-glucan is a linear polysaccharide of glucose monomers with β-1,4 and β-1,3 linkages and was first
identified in fungal cell walls by Van Wisselingh (12). β-glucan is water soluble and highly viscous at
low concentration (13). β-glucans occur in the cell walls of cereal grains (14) and in pulses (10).
Arabinoxylan (AX) is a non-digestible carbohydrate and contains a large number of 1,4-linked xylose
units (13). AX is a major hemicellulose component in primary cell wall and a minor component in
secondary cell wall (14). Part of AX can be digested in colon by AX-degrading enzymes (15).
Pectin is a linear polymer of galacturonic acid connected with α-1,4 bonds (16). It is found in the cell
walls of plants where it functions as a hydrating agent and cementing material for the cellulosic network
(17). It is a very abundant class of macromolecule in the cell matrix. Pectin is a water-soluble
polysaccharide that bypasses enzymatic digestion of the small intestine and can be degraded by the
microflora of the colon (13).
Inulin is a storage polysaccharide in numerous plants and is comprised of fructose monomers linked via a
β-(2,1) bond (18). Inulin is not digested in the human upper gastrointestinal tract because the β-(2,1)
chemical linkage between fructose monomers is not digestible by human enzymes, e.g. either ptyalin or
amylase (19)
1.2.3 Oligosaccharides
Three main kinds of oligosaccharides which were measured in our experiments are raffinose, stachyose
and verbascose. These oligosaccharides consist of galactosyl residues linked with α-(1,6) glycosidic
linkage. The difference among these three oligosaccharides is the number of galactose monomers they
contain. Among them, raffinose has one galactose, stachyose has two and verbascose has three galactose

4
(20). Oligosaccharides are distinguished from soluble dietary fiber because of their solubility in water and
ethanol. Oligosaccharides are naturally produced or derived from polysaccharides (21). These
oligosaccharides are resistant to gastric acidity and are not hydrolyzed by human digestive enzymes.
1.2.4 Summary
Insoluble dietary fiber, soluble dietary fiber and oligosaccharides are three main components in dietary
fiber of pulse crops and they are quantified in our experiments. Different constituents within dietary fiber
have been introduced in this section. Studies have been done on the relationships among these chemical
components of dietary fiber and their health benefits as discussed in the next section.
1.3 The health benefits of dietary fiber
Denis Burkitt (22;23) realized the importance of dietary fiber to human health in 1984. He hypothesized
that dietary fiber has protective effects against the development of Western diseases, including diabetes,
hypercholesterolemia, heart disease, diverticular disease and colon cancer. Based on his work, a large
number of investigations have been carried out to explore the health benefits of dietary fiber.
1.3.1 Prebiotic effects and gut health
The microbial community in the small intestine and colon affect the function of the human digestive
system. It has been reported that some components in dietary fiber can function as prebiotics, i.e., they
provide growth promoting substrates to the gut microbial community (24). It has been reported that the
fermentation potential of each fiber type is microbial species and strain dependent and that dietary
patterns with different types and amounts of fibers will differentially modulate the composition of the
intestinal microbiome (25). For example, galacto-oligosaccharides and inulin, which are two components
of dietary fiber, have been reported to increase the abundance of bifidobacteria, a type of bacteria that is
associated with gut health in reducing the metabolism of hydrogen-producing fermentative bacteria (26).
Dietary fiber also induces microbial communities to produce increased amounts of short chain fatty acids
such as butyrate which have been reported to promote cellular health (27).
5
1.3.2 Weight maintenance
Increasing dietary fiber intake has been shown to be associated with a reduction in body weight as
reported in a recently published systematic review and meta-analysis of 21 randomized control studies
(28,29). To illustrate the nature of the evidence reported, a significant weight loss (6.0 kg ± 4.2 kg) was
observed in fifty-four postmenopausal women given a low-fat and high fiber diet for 8 months (30). A
follow-up study from Liu et al based on 121,700 registered nurses for 12 years reported that the group
with high dietary fiber intake gained an average of 1.52 kg less weight than individuals with low intake
(31). In a survey on U.S. women, increased dietary fiber intake was also reported to be associated with
lower body mass index (BMI) (32). Nonetheless, as noted in (29), additional studies are required to
establish the actual magnitude of protection against weight gain. Mechanisms proposed to explain the
weight maintaining effect of dietary fiber include: 1) dietary fiber can lead to bulking, gel formation,
viscosity, a change in gastric content and a delay in gastric emptying, resulting in a suppression of
appetite (33;34); 2) dietary fiber can stretch the walls of the gastrointestinal tract, stimulating the satiety
reflex and slowing the absorption of nutrients like fatty acids and carbohydrates (34,35); 3) soluble
dietary fiber can be fermented in the large intestine, producing glucagon-like peptide and peptide tyrosine
tyrosine (PYY) which in turn can induce a sense of satiety (36,37); and 4) high fiber food has low caloric
density that results in reduced total caloric intake over time (38).
1.3.3 Diabetes prevention
Diabetes mellitus is a common disease worldwide. The International Diabetes Foundation predicts that by
2030, 10% of the world’s population will be diabetic (39). Many studies have reported that the increasing
dietary fiber intake from whole grains can reduce the risk of diabetes. In a prospective study of 162,000
U.S. women without a history of diabetes, the relative risk of developing type 2 diabetes was found to be
0.62 (95% confidence interval 0.57-0.69, p < 0.001) when comparing the highest quintile of whole grain
intake with the lowest (40). Similarly, Ye et al. reported a 26% lower risk of type 2 diabetes among

6
individuals in the American Association of Retired Person (AARP) cohort who consumed 48-80 g/d
whole grains (41).
Greater than 90% of diabetic patients have the type 2 form of the disease which is mainly attributed to
insulin insensitivity. There are several reasons that dietary fiber may reduce the risk of diabetes. Dietary
fiber can reduce extremely high blood glucose levels due to its ability to decrease the intestinal transport
of glucose, thus slowing the appearance of glucose in blood (42). It is also suggested that soluble fiber
causes the slow absorption and digestion of carbohydrates, which leads to slower absorption of glucose
and reduced demand for insulin (43). B-glucan and arabinoxylan are two important components of dietary
fiber that increase food viscosity. The formation of a viscous solution in the stomach can delay gastric
emptying and significantly lower the postprandial glucose response (44). Thus, via glucose regulation
and improved insulin sensitivity, dietary fiber can reduce the risk of diabetes.
1.3.4 Cardiovascular Diseases (CVD)
Over the past five decades, CVD has risen to become the single largest cause of death worldwide,
accounting for 30% of total deaths according to WHO (45). Studies in the 1970s indicated that the
dietary fiber consumption is inversely associated with the risk of CVD and this was confirmed in 2004
by the observation that a significant inverse relation exists between dietary fiber intake and the risk of
CVD among both men and women (46). It was estimated that for every 10 g/day increase in dietary fiber
intake, risk of all coronary events was reduced by 12% (47). There are many factors that can increase the
risk for CVD, such as overweight, elevated blood pressure, high fasting total cholesterol and elevated
blood glucose. A number of studies have indicated that the benefits of dietary fiber in reducing CVD are
through affecting these processes (48-52).
1.3.5 Cancer prevention
Cancer is a disease that accounts for nearly 15% of human deaths globally (53). One possible benefit of
dietary fiber is that it can reduce cancer risk. There are reports that dietary fiber prevents a number of
cancer types including colon cancer (54), esophageal cancer (55), and breast cancer (56). Aune et al. (57)

7
reported an inverse correlation between fiber intake and the risk of colorectal cancer. According to their
analysis, a 16% (95% Confident Interval 0.77-0.92 Relative Risk = 0.84) increase in cancer risk was
observed among people with low intake of dietary fiber. Among different types of dietary fiber, fiber
from whole grains was associated with a 20% reduction of risk (58) while vegetable and fruit fiber did not
lead to an apparent reduction (59) possibly because the intake of these foods is relatively low. Murphy et
al. (60) also suggested that dietary change can lead to a reduction of cancer risk. They found that with a
10 g/day increase in cereal fiber intake, that colorectal cancer risk was reduced by 11%. It was found that
the esophageal cancer risk has a strong inverse correlation with the dietary fiber intake (55).
Breast cancer is the most common cancer in women and the second leading cause of death from cancer in
United States. Dietary fiber has been associated with a significant inverse correlation with the risk of
breast cancer. For an increase of 10 g/d of dietary fiber intake, there is a 7% decrease in breast cancer risk
(95% Confident Interval 0.88-0.98, Relative Risk = 0.93) (56). One possible mechanism to explain this
relationship is that dietary fiber decreases the circulating estrogen concentration by suppressing bacterial
B-glucuronide activity in the gut. This process may inhibit the reabsorption of estrogens in the colon,
increasing the excretion of estrogens in feces, and thereby reducing the risk of breast cancer by lowering
circulating concentrations of this hormone.
1.4 The dietary fiber intake gap
While dietary fiber is not considered an essential nutrient in the human diet, the U.S. Department of
Agriculture and Department of Health and Human Services (2010) recommend consumption of 14 g/1000
Kcal, which is about 25 g of fiber per day for women and 38 g for men. Nonetheless, the importance of
dietary fiber has not been fully recognized by consumers and there is a dietary fiber intake gap all over the
world. As reported by King et al. (2012) (61), the average daily intake of dietary fiber for U.S people
during 1999-2000 is only 15.6 g/day, much lower than the recommended level. Inadequate dietary fiber
intake occurs not only in United State, but also in the other parts of the world. According to the Chinese
Dietary Fiber Intake White Book (2016 Fourth China dietary fiber industry forum by China Association
of Pharmaceutical Biotechnology), the average dietary fiber intake for both city and rural populations in

8
China is about 13 g/day, far less than the daily requirement standard from WHO. According to
investigations in Europe, the average daily dietary fiber intake is less than 20 g/day (62). Meanwhile, for
South America, average daily dietary fiber consumption is only about 6g/1000 kcal (63). Among these
four areas, China and South America have lower dietary fiber intake than in North America and Europe.
One possible reason for such a difference is that in developing countries, the importance of the dietary
fiber to people’s health has not been widely realized. For East Asia countries, inadequate intake of dietary
fiber may also be due to the dietary structure. The main source of carbohydrate in many East Asian
countries is rice, which contains only about 3% w/w dietary fiber.
1.5 Pulse crops, potential candidates to the close the dietary intake gap
Pulse crops such as dry pea, lentil and chickpea as well as common bean (Phaseolus vulgaris L.) are
widely consumed worldwide and have been the very important foods in most population centers for
thousands years ago. Pulses have high nutritional quality and high content of fiber. However, while the
Green Revolution (late 1960s) greatly increased agricultural production worldwide, saving over a billion
people from starvation, it also changed diet structure with increased consumption of high-yielding crops
like wheat, rice and corn with a concomitant decrease of pulse crop consumption (64), leading, in part, to
the dietary fiber intake gap. Increasing pulse crop consumption consciously in our diet structure is, we
believe, a practical way to fill the dietary fiber intake gap.
1.6 The objectives of the study
As discussed in the above sections, dietary fiber has been demonstrated to be important for human health;
however, intake is inadequate for maximal benefit to be attained. It is reasonable to assume that this gap
can be closed by increasing pulse consumption. In view of the fact that the fiber content of dry pea,
chickpea and lentil, has not been determined using AOAC 2011.25, information that is essential for the
promotion of increased consumption of these pulse crops, those analyses were performed in the
experiments reported in this thesis. The objectives of this project were: 1) accurately measure dietary fiber
content in dry pea, lentil and chickpea, and 2) to explore relationships between the fiber content, pulse

9
genotype (variety) and the environment in which these crops were grown. Due to the importance of
these pulse crops and especially due to their potential value in closing the dietary fiber gap worldwide, we
believe the work reported herein has potential for significant clinical impact.
10
CHAPTER 2
MATERIALS AND METHODS
2.1 Experimental design
Chickpea, dry pea, and lentil seed was selected by plant breeders familiar with commercial cultivars of
each pulse crop grown in the United States. Chickpea cultivars were selected by Dr. George Vandemark
(USDA-ARS) and dry pea and lentil were selected by Rebecca McGee (USDA-ARS). Chickpea seed was
harvested from Pullman and Dayton, WA. Lentil seed was harvested from Fairfield and Pullman, WA.
Dry pea seed was harvested from Genesee and Dayton, WA. Within each location, two samples
(replicates) of the same cultivar were obtained from different field plots. The seeds were obtained from 24
varieties of chickpea, 13 varieties of lentil and 11 varieties of dry pea. The annual average daily
temperature of Pullman is 8.7℃, and the average precipitation is about 51.8 cm. The annual average daily
temperature of Dayton is 10.7℃ and the average precipitation is about 49 cm. The annual average daily
temperature of Fairfield is 13.4℃ and the average precipitation is about 33.8 cm. For Genesee, the annual
average daily temperature is 12.2℃ and the average precipitation is about 31.2 cm. The plants were
grown from seed. After harvest, dry seed samples were collected for fiber analysis.
2.2 Sample preparation
Each of the seed samples were cooked and prepared for the AOAC 2011.25 Integrated Total Dietary
Fiber Analysis. Dry seeds were ground into a fine powder using a mechanical grounder (KRUPS
Tipo203). Two replicates of ground samples were weighed to approximately 1 g. The range of sample
weighing was between 0.9950 to 1.0050 g. The powdered sample was then transferred into a 50 ml plastic
Falcon tube and 8 ml nanopure water (18 mega ohm) was then added. The sample was vortexed (Baxter
S/P vortex mixer) until the powder was well dispersed in water. Samples were then cooked at 115℃
under a pressure of 76 kPa for 65 minutes (Market Forge Autoclave). After cooking, the pasty like sample
was cooled down to room temperature and homogenized using a Polytron® PT10/35 with an S type probe,
11
for approximately 15 seconds on speed 6. The probe was then washed with 6 ml nanopure water twice in
a VWR Culture tube 17 x 100 mm to remove all seed particles. The liquids from the two washings were
transferred to the original 50 mL conical tube containing the homogenized seed sample. Final sample
volume was approximately 20 mL. The conical tubes with the homogenized seed sample were stored at -
80˚C until analysis.
2.3 AOAC 2011.25 Integrated Total Dietary Fiber Assay
The total integrated dietary fiber method (AOAC 2011.25) was conducted using a commercial assay kit
(K-INTDF) purchased from Megazyme International, Wicklow, Ireland). The method is based on the
definition of dietary fiber, which was proposed in 2009 by CODEX Committee on Nutrition and Foods
for Special Dietary Uses. The method was accepted and put into use in 2009 by Codex Alimentarius
Commission. In the present study, the assay was carried out with modifications as published in detail by
our laboratory (65). Briefly, the analysis of insoluble and soluble dietary fiber was according to AOAC
2011.25 without modification. Since oligosaccharides in pulses are limited to galactans, HPLC
separation with electrochemical detection was employed to improve the sensitivity and specificity of the
assay for raffinose, stachyose and verbascose.
2.4 Buffer Preparation
For buffer preparation, 23.2 g maleic acid was added into a 2 L flask filled with a suitable amount of
nanopure water. The mixture was stirred with a stirring bar until maleic acid was fully dissolved. 4 M
sodium hydroxide was used to adjust pH to 6.0. 1.2 g calcium chloride and 0.8 g sodium azide were
added into the flask. This buffer was stored at -20 ℃ freezer until it was used.
2.5 Sample Digestion
Seed samples were taken out from -80 ℃ freezer and thawed to room temperature. Amyloglucidase and
pancreatic α amylase were added to the buffer solution and stirred until well proportioned. The enzyme
amount was calculated according to the volume of buffer. The concentration of amyloglucidase was 3.3
Units/mL and 50 Units/mL for pancreatic α-amylase. 250 ml blank square glass bottles were prepared

12
and samples were transferred into the glass bottles. The Falcon tube was washed with 20 ml buffer and
the buffer was added into the sample. The square bottle was placed in Grant OLS200 shaking incubation
water bath and the temperature was kept at 37 ℃ for 16 hours, which simulates the digestion processes.
The square bottle was taken out and 3.0 ml Trizma base was added to adjust pH to approximately 8.0 pH
and pH was recorded for comparison. The precision water incubator was warmed up to 90℃. The square
bottle was then placed into the incubator and the sample was kept at 90℃ for about 20 minutes in order to
inactivate amyloglucidase and pancreatic α amylase, and also for protein denaturation. The square bottle
was taken out and cooled down to 60℃. After that, 0.1 ml protease solution was added into the sample.
The square bottle was then placed in the Grant OLS 200 incubator stable at temperature of 60℃ and
shaken for 30 minutes, enabling protease to digest and denature protein from large pieces to small
fragments. After 30 minutes, the square bottle was taken out from water bath and cooled down to room
temperature. 4 ml of 2 M Acetic acid was added to the sample for pH adjustment to 4.3 in order to
accelerate precipitation. The sample was stirred and stored at 60℃ for 1 hour before gravimetric filtration.
2.6 Analysis of insoluble and soluble dietary fiber
Gravimetric Filtration was applied twice in the analysis. The first gravimetric filtration separated
insoluble dietary fiber from sample and the second filtration isolated soluble dietary fiber from sample.
The details of the first filtration are as follows:
Three hundred and twenty milliliter of 95% ethanol was added to a 500 ml glass Pyrex bottle. The bottle
was placed on the Fisher Scientific Isotemp and the ethanol was warmed up to 60℃ before use. A
weighed 50 ml Pyrex crucible was used for filtration. 1.0 mg Celite was added onto the crucible and the
crucible was placed in oven at 130℃ overnight to dispel water. Before weighing, the crucible was placed
in desiccator until it was cooled down to room temperature. To collect the precipitate, crucible was wetted
by 15 ml of 78% ethanol under vacuum suction to help distribute the Celite at the bottom of the crucible.
Sample from the square bottle was then vacuum-filtered into a 1L flask. The prepared 320 ml 95%
ethanol was mixed with it in a 500ml glass bottle. The precipitated portion of the sample was washed with

13
30 ml 78% ethanol, 30 ml 95% ethanol and 30 ml acetone, subsequently. The crucibles were placed into
an oven and dried it at 105℃ overnight. The crucible was moved into a desiccator and cooled down to
room temperature. The crucible was accurately weighed and the weight was recorded as weight 1. The
sample was separated into Rep 1 and Rep 2 for protein and ash correction. The dry weight of insoluble
dietary fiber was labeled as RIDF.
The soluble dietary fiber contained in the aqueous phase was precipitated when it was mixed with ethanol.
The second filtration was then carried out by the following procedures:
Seventy eight percent of ethanol was added to the crucible under vacuum suction in order to distribute the
celite in the base of crucible. The sample in the 500 ml glass bottle was vacuum-filtered into a 1 L flask.
The soluble dietary fiber precipitated on the crucible was washed with 30 ml 78% ethanol, 30 ml 95%
ethanol and 30 ml acetone, subsequently. The crucible was placed in the oven and was dried at 105 ℃
overnight. The crucible was moved into a desiccator and cooled down to room temperature. The crucible
was accurately weighed and the weight was recorded as weight 2. Samples were separated into Rep 1 and
Rep 2 for protein and ash correction. The soluble dietary fiber weight is labeled as RSDF.
The volume of the aqueous phase which contains oligosaccharides was measured with a graduated
cylinder and was recorded for calculation. 10 ml of the solution was transferred into a 10 ml Falcon tube
for HPLC measurement.
2.7 Analysis of Oligosaccharides
The aqueous phase obtained after second gravimetric filtration was evaluated by high performance liquid
chromatography. The samples were taken from freezer and thawed to room temperature. A 1 ml syringe
was used to take 1 ml of samples. The 1 ml sample was then filtrated through a 25 mm diameter 0.22 µm
pore size filter into a 2 ml HPLC test tube and analyzed by high-performance anion-exchange
chromatography with pulsed amperometric detection (HPAEC-PAD). The experiment was performed
with a Shimadzu instrument (Shimadzu Corp., Kyoto, Japan) equipped with SCL-10Avp system
controller, LC10ATvp pump, DFU-20A5 online degasser, and SIL-10A autosampler with a 20 uL fixed

14
loop. The oligosaccharides were separated by a Dionex CarboPac PA10 anion-exchange resin analytical
column with a Dionex CarboPac PA10 guard column. The mobile phase consisted of 120 mM NaOH
solution at a flow rate of 1.0 ml/min under isocratic conditions. The mobile phase was prepared by
diluting a carbonate-free 50% (w/w) NaOH solution in Milli-Q water. The detection was accomplished by
an ED40 electrochemical detector with a gold working electrode and an Ag/AgCl reference electrode.
Standard was made by using pure sucrose, raffinose, stachyose and verbasecose powder dissolved in pure
water and mixed evenly together. The concentration used to make a standard curve is from 0.005 mM to 1
mM.
2.8 Protein and Ash Correction
The dietary fiber sample residues from the first filtration and second filtration were separated into two
parts. Replicate 1 was used for protein correction, while replicate 2 was used for ash correction. The
precipitate from replicate 1 was moved from the crucibles into a vial for protein detection. Before
detection, the sample was homogenized with a glass rod. About 0.2 g of replicate 1 was weighed and
covered with tinfoil. LECO TruSpec equipment was applied to detect the nitrogen content in the sample
with Dumas method. A conversion of 6.25 was used to convert nitrogen content to protein content. The
protein content is labeled as PIDF and PSDF.
Crucibles with Rep 2 were placed in furnace. Temperature was adjusted to 495℃ and the samples were
kept to burn for 5 hours. The furnace was turned off and cooled down to about 100℃. The crucibles were
moved into desiccator and wait until the crucibles were cooled down to room temperature. The dry weight
of crucible with ash was weighed to the nearest 0.1 mg. Ash weight is labeled as AIDF and ASDF.
2.9 Calculations
Total dietary fiber content (TDF %) was calculated as TDF= IDF+SDF+Oligosaccharides content.
Oligosaccharides were analyzed by HPLC and the calculation was mentioned in chapter 2.7. IDF and
SDF were calculated by the following two equations:
IDF%=(RIDF-AIDF-PIDF-BIDF)/S*100%

15
SDF%=(RSDF-ASDF- PSDF-BSDF)/S*100%
For insoluble dietary fiber sample residues, RIDF is IDF sample residue dry weight, AIDF is the ash dry
weight in the residue, PIDF is the protein dry weight in the residue, BIDF is the residue blank. S is the seed
sample dry weight.
For soluble dietary fiber sample residues, RSDF is the sample residue dry weight, ASDF is the ash dry
weight in the residue, PSDF is the protein dry weight in the residue, BSDF is the residue blank. S is the seed
sample dry weight.
2.10. Statistical Analysis
Analysis of variance was conducted to compare entry and location means for all variables using the Proc
GLM procedure in SAS version 9.2 (SAS Institute Inc., Cary, NC). Two replicates per entry were used
for all variables except as noted. Tukey’s multiple-mean comparison method (p < 0.05) was used to
determine significance among entry means for all variables. Correlation analysis was used to determine
the relationship between dietary fiber components. SPSS version 20 (International Business Machines
Corps., Armonk, NY, USA) and SAS version 9.2 (SAS Institute Inc., Cary, NC, USA) were used.

16
CHAPTER 3
DIETARY FIBER CONTENT IN DRY PEAS
3.1 Introduction
Dry pea is among the world’s oldest crops. It was domesticated in the Middle East approximately 9000
years ago and has been grown worldwide for human and animal consumption (66;67). Dry pea is an
inexpensive and nutritious food being an excellent source of carbohydrate, protein, B-vitamins, folate,
and minerals such as calcium, iron and potassium(67). Dry pea has low fat and sodium content, which
makes it healthier than protein containing foods from animal sources. Dry pea has also been reported to
have disease prevention effects, such as lowering serum cholesterol, reducing heart disease, and
decreasing risk of type 2 diabetes (67).
Total dietary fiber content in dry pea has been measured with different methods (68). Those methods
included gas chromatographic (GC) measurement, enzymatic-gravimetric AOAC methods, and the
methods used in United Kingdom (UK) for dietary fiber measurement. Compared with AOAC methods,
the UK method does not include the measurement of lignin and has an extraction step for removing starch
that is not hydrolyzed by amylase, resulting in the underestimation of total dietary fiber content. The GC
method applied to measure dry pea fiber and the total fiber content was reported to be 16.7% w/w. On the
other hand, Dodevska et al.(69) reported that the dietary fiber content in dry pea samples using AOAC
Method 995.16 was 20.7%. Such inconsistencies caused by the differences in the definition of dietary
fiber and measurement methods demonstrate the importance of carrying out a re-analysis of dry pea fiber
content using the newly developed consensus definition and method.
In the current work, the modified state-of-the-art method, AOAC 2011.25, which is based on the
consensus definition of dietary fiber, was used for the first time to estimate the content of different
components of dietary fiber of dry pea. Eleven dry pea cultivars grown in two different locations were
studied. The main objectives of this experiment were: (1) to update the value of dietary fiber components

17
of dry pea, and (2) to determine if variation exists for dietary fiber among different cultivars. The long
term goal of this study was to obtain results about genetic variation in dietary fiber to develop dry pea
cultivars with improved human health benefits.
3.2 Sample description and measurement
Eleven dry pea cultivars were obtained from two different locations, Pullman and Genesee, WA, except
for the cultivar Melrose, WA. Melrose was only obtained from the Pullman, WA. Photographs of these
samples are shown in Figure 3.1. Samples were divided into different economically important market
classes based on recognized seed phenotypic characteristics. Among them, Columbian, Aragorn,
PS07100471, PS03101445 and Hampton belong to the dry green pea market class. The primary use of
this market class is as whole food. Columbian was a very old cultivar with a small dimple on its surface
and is generally used for split pea soup. Aragorn is developed in New Zealand with good color quality.
PS07100471 and PS03101445 are breeding lines and are similarly as Aragorn. Hampton is a high
yielding cultivar. It has very good color quality and resistance to many plant diseases. Carousel, DS.
Adminal, and PS08101022 belong to the dry yellow pea market class. They are used primarily as animal
feed or for food ingredients after fractionation. The starch fractions are used to make noodles in Asia and
the protein component is used to make foods like energy bars. Spector belongs to the winter market class,
which has a clear seed coat with ‘ghost mottling’ and small seed size. Granger and Melrose, with dark
pigmented seed coat and black hilum, belong to the Austrian winter pea market class. All of these dry pea
varieties, i.e., Granger, Melrose and Spector, were planted in the autumn, overwinter as seedlings, and are
mature about three weeks before spring-sown dry peas. They are cold tolerant and don’t require
vernalization to flower. They are not very palatable and are usually used for animal feed or as a cover
crop that improves soil nitrogen and organic matter content.

18
Dry Green
Dry Yellow

19
Austrian Winter
Winter
Figure 3.1 Seed types for dry pea cultivars evaluated

20
3.3 Results
3.3.1 Dietary fiber content and the cultivars
The content of dietary fiber in dry pea cultivars, including IDF, SDF, raffinose, stachyose, verbascose and
the total oligosaccharides are shown graphically in Table 3.1, Figures 3.2 and 3.3.
IDF content accounted for about 65% of total TDF content. Based on F-test, IDF differed among cultivars
(P = 0.004) and ranged from 14.2 to 19.8% with mean 16.0%. Among tested cultivars, Granger had the
highest IDF content (19.1%) and PS03101445 had the lowest (14.2%). SDF content for dry pea did not
differ among cultivars (P = 0.079) and ranged from 3.3 to 5.2% with a mean of 3.9%. Total
oligosaccharide content differed among cultivars (P = 0.026) and ranged from 4.0 to 5.4% with mean
4.7%. The highest total oligosaccharide content cultivar was Columbian (5.4%) and Melrose (4.0%) was
the lowest. When the individual components of oligosaccharides were considered, raffinose did not differ
among cultivars (P = 0.179). The raffinose content for dry pea samples ranged from 0.6% to 1.1% with a
mean of 0.8%. Stachyose content for dry pea samples did not differ among cultivars (P = 0.214). The
mean stachyose content was 2.5% and ranged from 2.2 to 3.2%. Among dry pea cultivars, verbascose
content was not significantly different (P = 0.087). The mean verbascose content was 1.4% and ranged
from 1.0 to 1.9%. Stachyose content (2.5%) was markedly higher than raffinose (0.8%) and verbascose
(1.4%) among dry pea cultivars. The TDF content for dry pea samples differed among cultivars (P =
0.006) and ranged from 22.3 to 28.0% with mean 24.9%. Granger had the highest TDF content (28%)
while Hampton had the lowest (22.3%) among tested cultivars.

21
Table 3.1 Insoluble dietary fiber (IDF), soluble dietary fiber (SDF), raffinose, stachyose,
verbascose, total oligosaccharides and total dietary fiber (TDF) among dry pea cultivars1
Variety IDFa SDFa Raffinose Stachyose Verbascose OLIGOa TDFa
ARAGORN 14.8 C 5.2 0.6 2.5 1.2 4.4 CDE 24.5 BC
CAROUSEL 15.0 C 4.4 1.1 2.5 1.3 4.8 ABCD 24.1 BC
COLUMBIAN 15.4 BC 3.3 1.1 3.2 1.1 5.4 A 24.1 BC
DS. ADMINAL 16.0 BC 3.5 0.8 2.2 1.3 4.3 CDE 23.8 C
GRANGER 19.1 A 3.8 0.7 2.4 1.9 5.0 ABC 28.0 A
HAMPTON 14.6 C 3.6 0.6 2.2 1.4 4.1 DE 22.3 C
MELROSE 19.8 A 3.9 0.6 2.2 1.2 4.0 E 27.6 A
PS03101445 14.2 C 3.5 0.9 2.6 1.7 5.2 AB 22.9 C
PS071019971 15.5 BC 3.8 0.9 2.5 1.0 4.4 BCDE 23.8 C
PS08101022 15.8 BC 3.7 0.7 2.3 1.6 4.6 ABCDE 24.2 BC
SPECTOR 17.6 AB 4.1 0.8 2.6 1.6 4.9 ABCD 26.7 AB
Overall Mean 16.0 3.9 0.8 2.5 1.4 4.7 24.6
P-valueb 0.004 0.079 0.179 0.214 0.087 0.026 0.006
aAbbreviations: IDF: insoluble dietary fiber; SDF: soluble dietary fiber; OLIGO: total oligosaccharides (raffinose +
stachyose + verbascose); TDF: total dietary fiber (IDF + SDF + OLIGO). Values are expressed as percent of dry weight;
Means followed by same letters are not significantly different at P<0.05. Mean separations were performed using Tukey’s honestly significant difference test. bFor significant of the F-test in the analysis of variance.

22
Figure represents dietary fiber content among dry pea cultivars. Values are expressed by percent of dry weight. Abbreviations for
the legends: IDF = insoluble dietary fiber; SDF = soluble dietary fiber, Total Oligo = total oligosaccharides.
Figure 3.2 Mean percentage IDF, SDF, total oligosaccharides and TDF among dry pea
cultivars. Figure 2 1
Figure represents oligosaccharides content among chickpea cultivars. Values are expressed by percent of dry weight.
Figure 3.3 Mean percentage of raffinose, stachyose, verbascose and total oligosaccharides
among dry pea cultivars. Figure 3 1

23
3.3.2 Correlation analysis among different components of dry pea samples
Pearson correlation analysis was performed to explore possible associations among dietary fiber
components of the dry pea cultivars. The results are shown in Table 3.2. Raffinose had a strong positive
correlation with stachyose. At the same time, verbascose had strong negative correlation with both
raffinose and stachyose. The biosynthesis pathway for raffinose family of oligosaccharides (RFO’s) is
raffinose to stachyose to verbascose and it is reversible (70). From the correlation test, the higher
raffinose content was associated with higher stachyose and lower verbascose. Enzymes in the
biosynthesis pathway may have large impact on adjusting the balance of these three components.
Table 3.2 Pearson correlations for all dry pea samples 2
Correlations IDF SDF Raffinose Stachyose Verbascose Total Oligos
IDF 1
SDF -0.12
Raffinose -0.13 -0.08
Stachyose -0.09 -0.02 0.61**
Verbascose 0.26 0.05 -0.48** -.37*
Total Oligos 0.04 -0.01 0.57** 0.82** 0.16 1
**. Correlation is significant at the 0.01 level (2-tailed).
*. Correlation is significant at the 0.05 level (2-tailed).
Abbreviations: IDF: insoluble dietary fiber, SDF: soluble dietary fiber, Total Oligos: total oligosaccharides
3.3.3 The influence of market class on dietary fiber content
Mean values of IDF, SDF, raffinose, stachyose, verbascose and total oligosaccharides among dry pea
market classes (Table 3.3) are shown in Figure 3.4. IDF content differed among market classes (P=0.01).
SDF, raffinose, stachyose, verbascose and total oligosaccharides were not different among market classes
(P>0.05). TDF content also differed among market classes (P=0.01). Austrian winter and winter dry pea
market classes had higher and dry green and dry yellow market class had lower TDF content.

24
Table 3.3 Dietary fiber content for dry pea samples by market classes 3
Class IDFa SDF Raffinose Stachyose Verbascose Total Oligos TDF
Austrian Winter 19.3 A 3.8 0.7 2.3 1.7 4.7 27.9
A
Dry Green 14.9 B 3.9 0.8 2.6 1.3 4.7 23.5
B
Dry Yellow 15.6 B 3.9 0.9 2.3 1.4 4.6 24.1
B
Winter 17.7 A 4.1 0.8 2.6 1.6 4.9 26.7
A
P-valueb <0.001 0.97 0.66 0.48 0.18 0.87 <0.001
aMeans with the same letters are not significantly different at P<0.05. Mean separations were performed using Tukey’s honestly
significant difference test. Abbreviations: IDF: insoluble dietary fiber, SDF: soluble dietary fiber, Total Oligos: total
oligosaccharides, bP-value for significant of the F-test in the analysis of variance.
Figure represents dietary fiber content among dry pea market classes. Values expressed by percent dry weight. Abbreviations:
IDF = insoluble dietary fiber, SDF = soluble dietary fiber, Total Oligo = total oligosaccharides
Figure 3.4 Mean dietary fiber contents for dry pea samples among different market classes Figure 4.1 1

25
3.3.4 The influence of location
The effect of the location of production on dietary fiber content was also studied. Seed samples grown at
two locations, namely Pullman and Genesee, WA, were compared (Table 3.4). There were no significant
differences in mean IDF, SDF, total oligosaccharides or TDF content grown at the two locations.
Table 3.4 IDF, SDF, Total Oligosaccharides, and TDF content between two locations of
samples4
Cultivar/DF IDFa SDFa Total Oligoa TDFa
Location Pullman Genesee Pullman Genesee Pullman Genesee Pullman Genesee
ARAGORN 16.3 13.3 3.6 6.9 4.5 4.3 24.4 24.6
CAROUSEL 15.6 14.4 4.8 3.9 5.3 4.2 25.8 22.5
COLUMBIAN 15.8 15.0 3.4 3.2 5.2 5.5 24.4 23.7
DS. ADMINAL 15.6 16.4 3.1 3.9 4.1 4.6 22.8 24.9
GRANGER 18.2 20.0 3.4 4.2 4.5 5.6 26.1 29.8
HAMPTON 15.5 13.6 3.6 3.5 4.5 3.8 23.6 21.0
MELROSE
19.8
3.9
4.0
27.6
PS03101445 13.0 15.5 3.6 4.0 4.8 4.1 24.0 23.5
PS071019971 15.6 15.5 4.3 3.2 4.7 4.6 24.4 24.0
PS08101022 15.3 16.3 3.1 3.9 5.5 4.9 21.6 24.2
SPECTOR 17.4 17.8 4.3 4.0 4.8 5.0 26.5 26.9
Mean 15.8 16.1 3.7 4.1 4.8 4.6 24.4 24.8
P-valueb 0.65 0.30 0.36 0.55
aValues are expressed as percent of dry weight; dietary fiber content between two locations (Pullman and Genesee) are measured
with F test. Abbreviations: IDF: insoluble dietary fiber; SDF: soluble dietary fiber; OLIGO: total oligosaccharides (raffinose +
stachyose + verbascose); TDF: total dietary fiber (IDF + SDF + OLIGO), bP-value for significant of the F-test in the analysis of
variance.
3.3.5 Discussion
Despite the important health benefits of dietary fiber in the prevention of chronic diseases and efforts over
many years to educate consumers about these health benefits, insufficient intake of dietary fiber is still
widespread, with less than 10% of all Americans meeting recommended intake levels (71). In a
comparison of 70 different food items, pulse crops were found to have the highest dietary fiber content
(72). In addition to being high in dietary fiber, pulse crops are also high in protein, very low in fat and
supply essential vitamins and minerals. Our laboratory has advanced the idea that the lack of pulse
consumption in countries such as the United States is a significant contributor to the dietary fiber gap,

26
since these crops provide two to three times more dietary fiber per 100 g edible portion than cereal grains,
the type of foods frequently advertised as sources of dietary fiber (72). The high protein and low fat
content of pulses further strengthens the importance of emphasizing their regular consumption to close the
dietary fiber gap.
Dry pea is one of the four highest consumed pulse crops. Our results have shown that the averages IDF,
SDF, total oligosaccharides and TDF among dry pea samples were 24.6%, 16.0%, 3.9% and 4.7%,
respectively. For oligosaccharides, the averages values for raffinose, stachyose and verbascose were 0.8%,
2.5% and 1.4%, respectively. Comparing the AOAC 2011.25 method with the old method AOAC 995.16,
by which TDF content was reported to be 20.6% for dry pea, the new method includes more components,
e.g., fructo-oligosaccharides, galacto-oligosaccharides, polydextrose and maltodextrins. There is
difference between method of 4 g/100g dry weight where TDF between these methods shows about an 18%
in percentage difference. The comparison shows that dietary fiber content in dry pea has been
underestimated by the old method. It is necessary to reevaluate dietary fiber content in dry pea with the
new method. The recommended daily dietary fiber intake amount is 25 g for women and 38 g for men,
while the average daily dietary fiber intake for U.S population is 15.6 g/day. Based on our results, one
serving of dry pea contains an average 4.3 g dietary fiber.
Significant differences in the content of TDF, IDF and total oligosaccharides were observed among dry
pea cultivars. There was a 22.7% difference in TDF between the highest content cultivar and the lowest.
Such substantial differences in fiber content among available cultivars can be used to further improve
gains in fiber intake without the need to change dietary habits. This also provides a rationale for cultivar-
based food labeling. At the same time, the above results indicate that the genetic effects on dietary fiber
content in dry pea samples are marked. Thus, it may be possible to use either traditional approach to
breeding and selection as well as transgene and hybridization technology to develop new cultivars with
higher fiber content.
Genotype-environment interactions are important factors of consideration in breeding for specific
characteristics. Our results show that mean dietary fiber content among cultivars of dry pea was not

27
different between two locations. This finding suggests that the environment impact on dietary fiber
content for dry pea is small. Nonetheless, additional experiments are needed across more diverse growing
conditions in order to more vigorous determine the magnitude of effect that environment imposes on the
expression of genes that regulates fiber synthesis.
Oligosaccharides were shown to be important nutrient sources for some microbes that populate the human
intestine. Raffinose, stachyose and verbascose are the prominent dry pea oligosaccharides, which had
been reported to promote the growth of beneficial intestinal bacteria (26). Among three oligosaccharides
for dry pea, raffinose was positively association with stachyose and negatively associated with verbascose.
However, oligosaccharide content was not correlated with either IDF or SDF (Table 3.2). Thus, it is
valuable to report oligosaccharide content separately rather than including it as a component of SDF.
While more work is needed, it is possible that consumption of high oligosaccharide dry peas could have
specific health benefits. However, for individuals who have poor tolerance of galatans, the consumption
of low oligosaccharides content cultivars may improve tolerance.
Market classes are based on the phenotype of the seeds (color, size or shape) that determine the usage and
economic value. Marked differences in dietary fiber content were observed among different market
classes of dry pea. The dry green and dry yellow market classes had the lowest dietary fiber content
(human food), while the winter and Austrian winter classes (animal feed) had the highest TDF.
Unfortunately, dry pea cultivars with highest content of dietary fiber are not suitable for human
consumption due to their unfavorable taste. This result suggests that it may be possible to introgress
genes from high fiber content market classes into cultivars that are preferred by consumers. It is
noteworthy that within the dry green market class, there is a significant difference in fiber content
between Aragorn which had the highest SDF content and PS03101445 which had the second lowest. The
fact that differences in fiber content exist within a market class supports the feasibility of efforts to further
increase dietary fiber content through breeding and selection.

28
3.3.6 Summary
The average total dietary fiber content for dry pea cultivars is 24.6%. Among different dry pea
cultivars and market classes, dietary fiber content was significantly different. Among four tested
market classes, human food cultivars have lower dietary fiber than animal feeding cultivars.
Location has limited effect on dietary fiber content. Correlations exist among raffinose,
stachyose and verbascose. For dry pea, genetic difference has higher impact than environmental
effects. The dietary fiber content tested by AOAC 2011.25 method is higher than those tested by
old methods. It is valuable to reevaluate dry pea dietary fiber content with the new method.

29
CHAPTER 4
DIETARY FIBER CONTENT OF LENTIL SAMPLES
4.1 Introduction
Lentil is a pulse crop that was domesticated in the Middle-East and is now cultivated worldwide (73,74).
The country that produces the most lentils is Canada. Lentil has high protein and carbohydrate, but low
lipid content. They are also a good source of minerals such as calcium, potassium, manganese and zinc.
Lentil has been reported to promote weight maintenance, reduce the risk of type 2 diabetes,
cardiovascular disease and cancer (75).
Dietary fiber content of lentil samples has been measured by various methods. By using the method of
Van Soest and Wine (76)and McQueen and Nicholson (77), content of neutral detergent fiber (NDF) and
acid detergent fiber (ADF) in lentils were 21.2% and 7.2%, respectively (78). In a separate study reported
by de Almeida Costa et al. (79), insoluble dietary fiber content of lentil was approximately 19.0% and
SDF was approximately 1.4%.
In the current work, the newly developed method AOAC 2011.25 was employed for the first time to
estimate the content of different components of dietary fiber of lentil. Thirteen cultivars representing six
market classes were studied. The objectives of the study were: (1) accurately measure dietary fiber
content in lentils. (2) To determine if variation exists for dietary fiber among different cultivars. The
result of the current work, we believe, can be applied to guide breeding programs to develop lentil
cultivars with improved health benefits.
4.2 Sample description and measurement
Thirteen cultivars of lentil were produced from two locations, Fairfield and Pullman, WA. Cedar,
Crimson and Merrit were only produced from Pullman. For each location, two replicates of the same
cultivar were collected from different field plots. The thirteen lentil cultivars belong to six different
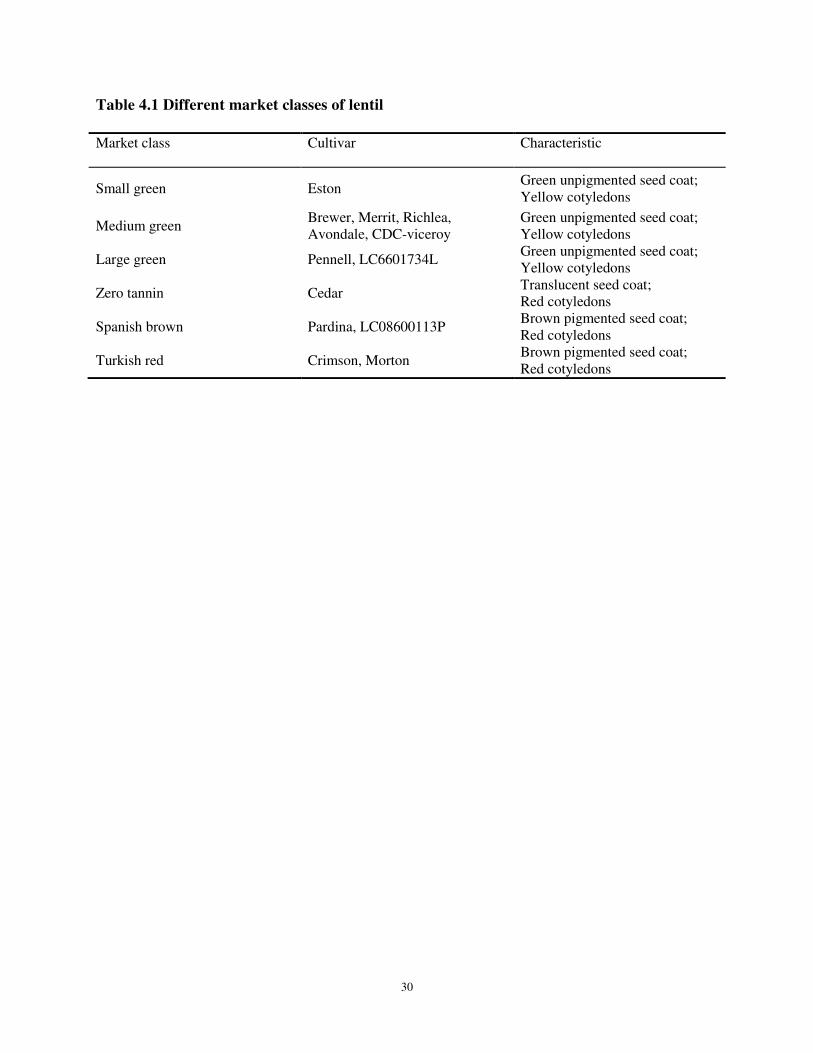
market classes (Table 4.1). Photographs of these thirteen lentil cultivars are shown in Figure 4.1
30
Table 4.1 Different market classes of lentil5
Market class Cultivar Characteristic
Small green Eston Green unpigmented seed coat;
Yellow cotyledons
Medium green Brewer, Merrit, Richlea,
Avondale, CDC-viceroy
Green unpigmented seed coat;
Yellow cotyledons
Large green Pennell, LC6601734L Green unpigmented seed coat;
Yellow cotyledons
Zero tannin Cedar Translucent seed coat;
Red cotyledons
Spanish brown Pardina, LC08600113P Brown pigmented seed coat;
Red cotyledons
Turkish red Crimson, Morton Brown pigmented seed coat;
Red cotyledons

31
Small Green
Medium Green

32
Large Green
Turkish Red
Spanish Brown

33
Zero Tannin
Figure 4.1 Seed types for lentil cultivars evaluated Figure 5 1

34
4.3 Results
4.3.1 The dietary fiber content and the cultivars
The content of dietary fiber in lentil cultivars, including IDF, SDF, raffinose, stachyose, and verbascose
and total oligosaccharides are shown in Table 4.2, Figures 4.2 and 4.3. Based on F-test IDF content
among cultivars was different (P = 0.016) and ranged from 12.2 to 14.7% with mean 13.6%. Crimson had
the highest IDF content (14.7%) and Cedar had the lowest (12.2%). SDF content differed among lentil
cultivars (P < 0.01) and ranged from 2.7 to 3.9% with a mean of 3.2%. Pennell had the highest SDF
content (3.9%) and Morton had the lowest (2.7%). Total oligosaccharide content did not differ among
cultivars (P = 0.115) and ranged from 3.0 to 3.7% with a mean 3.3%. Brewer had the highest total
oligosaccharide content (3.7%) and Crimson had the lowest (3.0%). When the individual component
oligosaccharides were considered, raffinose content differed among cultivars (P = 0.041). The raffinose
content for lentil samples ranged from 0.3 to 0.4% with a mean of 0.3%. Stachyose content for lentil
samples did not differ by cultivar (P = 0.521). The average content of stachyose was 2.0% and ranged
from 1.8 to 2.2%. Among lentil cultivars, verbascose content was not different (P > 0.081). The mean
verbascose content was 1.0% and ranged from 0.8 to 1.2%. Stachyose content (2.0%) was markedly
higher than raffinose (0.3%) and verbascose (1.0%) in all lentil cultivars. The TDF content for lentil
samples differed among cultivars (P < 0.001) and ranged from 18.4 to 21.3% with mean 20.1%. Pennell
had the highest TDF content (21.3%) while Cedar had the lowest (18.4%). The percent difference
between the TDF content of these two cultivars was 14.6%.

35
Table 4.2 Insoluble Dietary Fiber (IDF), soluble dietary fiber (SDF), raffinose, stachyose,
verbascose, total oligosaccharides and total dietary fiber (TDF) among lentil cultivars6
Variety IDF SDF Raffinose Stachyose Verbascose OLIGOS TDF
Avondale 13.6 B 3.1 BCD 0.3 ABCDE 2.1 1.1 3.3 20.0 CD
Brewer 13.8 B 3.3 B 0.3 AB 2.2 1.0 3.7 20.8 AB
CDC Viceroy 13.4 B 3.0 BCDE 0.3 BCDEF 2.2 1.2 3.4 19.8 CDE
Cedar 12.2 C 3.1 BCD 0.3 F 2.0 0.8 3.0 18.4 F
Crimson 14.7 A 2.9 CDE 0.3 BCDEF 1.9 0.8 3.0 20.6 B
Eston 13.5 B 3.0 BCDE 0.3 ABCD 2.2 1.1 3.3 19.9 CDE
LC06601734L 13.7 B 3.3 B 0.3 ABC 2.1 1.1 3.3 20.3 BC
LC08600113P 13.4 B 3.0 BCDE 0.3 CDEF 2.0 1.0 3.4 19.8 CDE
Merrit 13.5 B 3.3 B 0.3 BCDEF 2.0 0.9 3.5 20.3 BC
Morton 13.7 B 2.7 E 0.3 F 1.8 0.8 3.0 19.4 E
Pardina 13.5 B 2.8 DE 0.4 DEF 2.0 0.9 3.2 19.5 DE
Pennell 13.8 B 3.9 A 0.3 A 1.8 0.9 3.6 21.3 A
Richlea 13.7 B 3.2 BC 0.3 CDEF 1.9 0.9 3.1 20.0 CD
Overall Mean 13.6 3.2 0.3 2.0 1.0 3.3 20.1
P-value 0.016 <0.001 0.041 0.521 0.081 0.115 <0.001
aAbbreviations: IDF: insoluble dietary fiber; SDF: soluble dietary fiber; OLIGO: total oligosaccharides (raffinose +
stachyose + verbascose); TDF: total dietary fiber (IDF + SDF + OLIGO). Values are expressed as percent of dry weight;
Means followed by same letters are not significantly different at P<0.05. Mean separations were performed using Tukey’s honestly significant difference test. bFor significant of the F-test in the analysis of variance.

36
Figure represents dietary fiber content among lentil cultivars. Values are expressed by percent of dry weight. Abbreviations for
the legends: IDF = insoluble dietary fiber; SDF = soluble dietary fiber, Total Oligo = total oligosaccharides.
Figure 4.2 Mean percentage IDF, SDF, total oligosaccharides and TDF among lentil
cultivars Figure 6 1
Figure represents oligosaccharides content among lentil cultivars. Values are expressed by percent of dry weight.
Figure 4.3 Mean percentage raffinose, stachyose, verbascose and total oligosaccharides and
TDF among lentil cultivars Figure 7 1

37
4.3.2 Correlation analysis among different fiber components of lentil samples
Pearson correlation coefficients were computed to explore associations among fiber components. The
results were shown in Table 4.3. Raffinose had a strong positive association with SDF and verbascose,
SDF also had positive association with both verbascose and total oligosaccharides. The biosynthesis
pathway for raffinose family of oligosaccharides (RFO’s) is raffinose to stachyose to verbascose and its
reversible(70). From the correlation test, higher raffinose content is associated with both higher stachyose
and verbascose.
Table 4.3 Pearson correlations for all lentil samples7
Correlations IDF SDF Raffinose Stachyose Verbascose Total Oligo
IDF 1
SDF 0.01
Raffinose .34* .51**
Stachyose -.35* 0.14 .30*
Verbascose -0.06 .47** .43** 0.27
Total Oligo -0.19 .43** .55** .75** .83** 1
**. Correlation is significant at the 0.01 level (2-tailed).
*. Correlation is significant at the 0.05 level (2-tailed).
Abbreviations: IDF: insoluble dietary fiber, SDF: soluble dietary fiber, Total Oligos: total oligosaccharides
4.3.3 The influence of market classes on dietary fiber content
The mean values of IDF, SDF, raffinose, stachyose, verbascose and total oligosaccharides (Table 4.4)
among different market classes were shown graphically in Figure 4.4. IDF, SDF, raffinose, stachyose,
verbascose, total oligosaccharides and TDF content differed among market classes (P < 0.05). The Large
green market class had the highest dietary fiber content and zero tannin class had the lowest.

38
Table 4.4 Dietary fiber content for lentil samples of different market classes8
Class IDFa SDF
a Raffinose
a Stachyose
a Verbascose
a Total Oligo
a TDF
a
Medium Green 16.5 A 5.0
AD 0.3
C 2.1
ABC 1.0
AC 3.4
A 20.2
AB Small Green 16.8
AC 5.0
AD 0.3
AC 2.2
AB 1.1
A 3.3
AB 19.9
AB
Large Green 16.8 AC
5.4 B
0.3 C 2.0
AC 1.0
AC 3.5
A 20.8
C
Spanish Brown 16.3 A 4.7
CD 0.3
A 2.0
AC 0.9
ABC 3.3
AB 19.7
B
Zero Tannin 13.3 B 5.5
B 0.3
ABC 2.0
ABC 0.8
ABC 3.0
AB 18.4
D
Turkish Red 17.5 C 4.8 ACD 0.3
B 1.9
C 0.8
BC 3.0
B 20.0
AB
P-valueb 0.02 <0.001 0.01 0.03 <0.001 0.01 <0.001
aMeans with the same letters are not significantly different at P<0.05. Mean separations were performed using Tukey’s honestly
significant difference test. Abbreviations: IDF: insoluble dietary fiber, SDF: soluble dietary fiber, Total Oligos: total
oligosaccharides, S: significant. bP-value for significant of the F-test in the analysis of variance.
*abbreviations: IDF = insoluble dietary fiber, SDF = soluble dietary fiber, Total Oligo = total oligosaccharide
Figure 4.4 Mean dietary fiber contents for lentil samples among different market classes Figure 8 1

39
4.3.4 The influence of location
The effect of location of production of lentil on dietary fiber content was also studied. Samples
from two locations, namely Pullman and Fairfield, were compared (Table 4.5). In general there
was no significant location effect among lentil cultivars for IDF, SDF, total oligosaccharides or
TDF content.
Table 4.5 IDF, SDF, Total Oligosaccharides, and TDF content between two locations of
samples9
Cultivar IDF SDF Total Oligo TDF
Pullman Fairfield Pullman Fairfield Pullman Fairfield Pullman Fairfield
Avondale 13.4 13.8 3.1 3.2 3.3 3.2 19.8 20.2
Brewer 14.2 13.3 3.3 3.3 3.7 3.8 21.2 20.4
CDC Viceroy 13.7 13.1 3.0 3.1 3.3 3.4 20.0 19.6
Eston 13.7 13.4 3.0 3.1 3.4 3.3 20.1 19.7
LC06601734L 14.0 13.5 3.3 3.2 3.2 3.4 20.6 20.1
LC08600113P 13.3 13.5 3.1 2.9 3.4 3.4 19.8 19.9
Merrit 13.8 13.2 3.3 3.2 3.6 3.4 20.7 19.9
Pardina 13.4 13.6 2.8 2.8 3.2 3.2 19.4 19.6
Pennell 13.8 13.8 3.8 3.9 3.7 3.5 21.3 21.3
Richlea 13.7 13.6 3.3 3.1 3.1 3.1 20.1 19.8
Cedar 13.0 11.5 3.1 3.1 3.1 3.0 19.1 17.6
Crimson 15.0 14.5 2.9 2.9 3.2 2.8 21.1 20.1
Morton 14.3 13.1 2.6 2.8 3.0 3.0 19.9 18.9
Mean 13.8 13.4 3.1 3.1 3.3 3.3 20.2 19.8
P-value
0.07
0.93
0.79
0.12 aValues are expressed as percent of dry weight; dietary fiber content between two locations (Pullman and Fairfield) are tested
with F-test. Abbreviations: IDF: insoluble dietary fiber; SDF: soluble dietary fiber; OLIGO: total oligosaccharides (raffinose +
stachyose + verbascose); TDF: total dietary fiber (IDF + SDF + OLIGO). bP-value for significant of the F-test in the analysis of
variance.
4.3.5 Discussion
Our laboratory has proposed that increasing pulse consumption in countries such as the United
States is a practical way to resolve the dietary fiber gap. Lentil has valuable nutritional
characteristics. In addition to being high in dietary fiber, lentil is high in protein and contains
very low fat (80). Mineral and vitamin content in lentil are also high. Moreover, lentils have the

40
highest phenolic component content among pulse crops (80), which suggests that they may have
specific health benefits in addition to their nutritive value. These characteristics of lentil
strengthen its importance for regular consumption in addition to its potential role in resolving the
dietary fiber gap.
While FAO data indicate that lentil is one of the widely consumed pulse crops (81), there are
only limited reports of the dietary fiber content of this crop. Our results show the values of IDF,
SDF, total oligosaccharides and TDF among lentil cultivars were 20.1%, 13.6%, 3.2% and 3.3%,
respectively. For oligosaccharides, the average values of raffinose, stachyose and verbascose
were 0.3%, 2.0% and 1.0%, respectively. The value for TDF is similar to that reported by de
Almeida Costa et al. (79) using method AOAC 1975; however, when comparing the content of
individual components, differences among results become evident. Whereas, 19% for IDF and
1.4% for SDF were reported by using AOAC 1975 method, our results were 13.6% for IDF and
3.6% for SDF. The differences were as high as 33% for IDF and 88% for SDF by percentage.
The portion of each component in dietary fiber has large differences, which is mainly because of
the different definitions and different components measured. When calculating TDF by serving
size, our results indicate that one serving of lentil contains an average of 6.0 g dietary fiber.
Significant differences in the content of TDF, SDF and IDF were observed among different lentil
cultivars. The TDF difference between the highest content cultivar and the lowest was 2.9 g per
100 g dry weight which is a difference of 14.6%. Statistically, the differences in TDF, SDF and
IDF content among different lentil cultivars are significant, which suggest that dietary fiber
content may be altered by breeding and selection. It is notable that the content of total
oligosaccharides did not show large variation among lentil cultivars. These results suggest that

41
oligosaccharides maybe more difficult to increase in a breeding program. The most feasible way
to increase oligosaccharides content in lentil is to affect stachyose content.
Gene-environmental interactions are an important factor of consideration in breeding for specific
characteristics. Our results indicate that environment has limited impact on dietary fiber content.
However, additional experiments are needed under more diverse growing conditions in order to
test more vigorously whether or not environment imposes effects on the expression of genes that
regulate fiber synthesis.
Marked difference in dietary fiber content were observed among different lentil market classes,
although caution is warranted in interpreting this data since there were an unequal number of
cultivars in each market class. Nonetheless, among the six market classes into which lentils were
grouped, large green and zero tannin differed in TDF by 12.5%. From the perspective of
consumers interested in increasing dietary fiber intake, the cultivar Pennell could be marketed for
superior dietary fiber content.
4.3.6 Summary
The average total dietary fiber content for lentil cultivars is 20.1%. Among different lentil
cultivars and market classes, dietary fiber content was different. Six market classes of lentil had
been tested, among which the highest dietary fiber content market class is large green and the
lowest is zero tannin. Location has limited effect on dietary fiber content. Correlations exist
among raffinose, stachyose and verbascose. For lentil, genetic factors have a higher impact than
environmental effects. The dietary fiber content determined by AOAC 2011.25 method is higher
than those reported using older methods. It is important to advocate the use of the method for
lentil dietary fiber content analysis as work in this field progresses.

42
CHAPTER 5
DIETARY FIBER CONTENT OF CHICKPEA SAMPLES
5.1 Introduction
Chickpea is a widely consumed pulse crop. World consumption of chickpea is estimated to be 14.2
million MT (81). There are two different types of chickpea, Desi and Kabuli. The Desi type of chickpea
has pink flowers, anthocyanin pigmentation on stems, and a colored and thick seed coat. The Kabuli type
has white flowers, lacks anthocyanin pigmentation on stems, and has white or beige-colored seeds with a
ram’s head shape (82). Compared to Kabuli chickpea, Desi seed color is darker and seeds are smaller.
Desi types are mostly grown in Asia and Africa while Kabuli types are usually grown in West Asia, North
Africa, North America and Europe. As a food, Desi chickpea is typically split to make stew and Kabuli
chickpea is eaten whole or processed for making hummus. We focused on Kabuli chickpeas in the work
reported herein.
Chickpea contains a high concentration of protein, fiber, carbohydrate and a low concentration of lipid.
Chickpea is a good source for vitamins and minerals and contains phytochemicals like carotenoids and
flavonoids which can provide many human health benefits (83). The impact of chickpea consumption has
been reported to include the regulation of chronic vascular diseases such as cardiovascular disease, blood
pressure and diabetes risk reduction, weight maintenance, and cancer prevention (84).
Dietary fiber content of chickpea has been studied using traditional methods. Giovana et.al. (79)
employed AOAC 1975 to determine the total dietary fiber content and found that the TDF of chickpea is
about 13.9% and the SDF is close to zero. Dalgetty and Baik (2003) (85) applied the AOAC 2001 method
to estimate the fiber content of chickpea and found that the TDF ranged from 18.0 to 22.0% (86).
To the best of our knowledge, there is no application of the AOAC 2011.25 method for measuring dietary
fiber content in chickpea, which was established based on the new consensus definition of dietary fiber.
Due to the health benefits of dietary fiber and the economic value of chickpea, the accurate determination

43
of dietary fiber contents of this pulse crop is of importance. The purpose of the current work, therefore,
was to carry out a systematic measurement of dietary fiber content of different cultivars of chickpea by
employing the AOAC 2011.25 method.
5.2 Sample description
Twenty-four cultivars of Kabuli chickpea, which were harvested from two locations, Pullman and Dayton,
WA, were tested in this experiment. Within each location, two replicates of the same cultivar were
collected from different field at each location. According to the USDA National Agricultural Statistics
Service, Kabuli chickpeas can be divided into two categories based on the diameter of the seeds: Small,
with a diameter <7.9 mm, and Large, with a diameter >7.9 mm. For example, Sierra is a “Large” Kabuli
chickpea and it is the dominant cultivar in the U.S. CDC-Frontier and Billybean are the mostly used in
making hummus in U.S, and they belong to the “Small” Kabuli category (87). The photographs of the
twenty-four cultivars of chickpea evaluated are shown in Figure 5.1.

44
Kabuli

45

46

47
Figure 5.1 Seed types of chickpea cultivars evaluated Figure 9 1
5.3. Results
5.3.1 Dietary fiber content and the cultivars
The content of dietary fiber in chickpea cultivars, including IDF, SDF, raffinose, stachyose, verbascose
and total oligosaccharides are shown in Table 5.1, Figures 5.2 and 5.3. IDF content accounted for about
70% of TDF. Based on F-test IDF content among cultivars did not differ (P = 0.498) and ranged from
14.4 to 17.1% with mean 15.8%. CDC-Frontier had the highest IDF content (17.1%) and
CAO890B0085W (14.4%) had the lowest. SDF content for chickpea differed among cultivars (P < 0.001)
and ranged from 2.0 to 5.8% with a mean of 3.5%. CA0790B0042C had the highest SDF content (5.8%)
and CAO790B0053C (2.0%) had the lowest. Total oligosaccharide content was different among cultivars
(P < 0.001) and ranged from 1.0 to 3.5% with a mean of 2.5%. The cultivar with the highest
oligosaccharide content was Sierra (3.5%) and CA0890B0551C had the lowest (1.0%). When individual
components of total oligosaccharides were considered, raffinose content among cultivars was different (P
< 0.001). The raffinose content for chickpea cultivars ranged from 0.1 to 0.9% with mean 0.6%.
Stachyose content for chickpea samples differ by cultivar (P < 0.001). Mean stachyose content was 1.8%
and ranged from 0.7 to 2.4%. Among chickpea cultivars, verbascose content differed (P < 0.001). The
mean verbascose content was 0.2% and ranged from 0.1 to 0.3%. Stachyose content (1.8%) was markedly
higher than raffinose (0.6%) and verbascose (0.2%) in all chickpea cultivars. The TDF content for
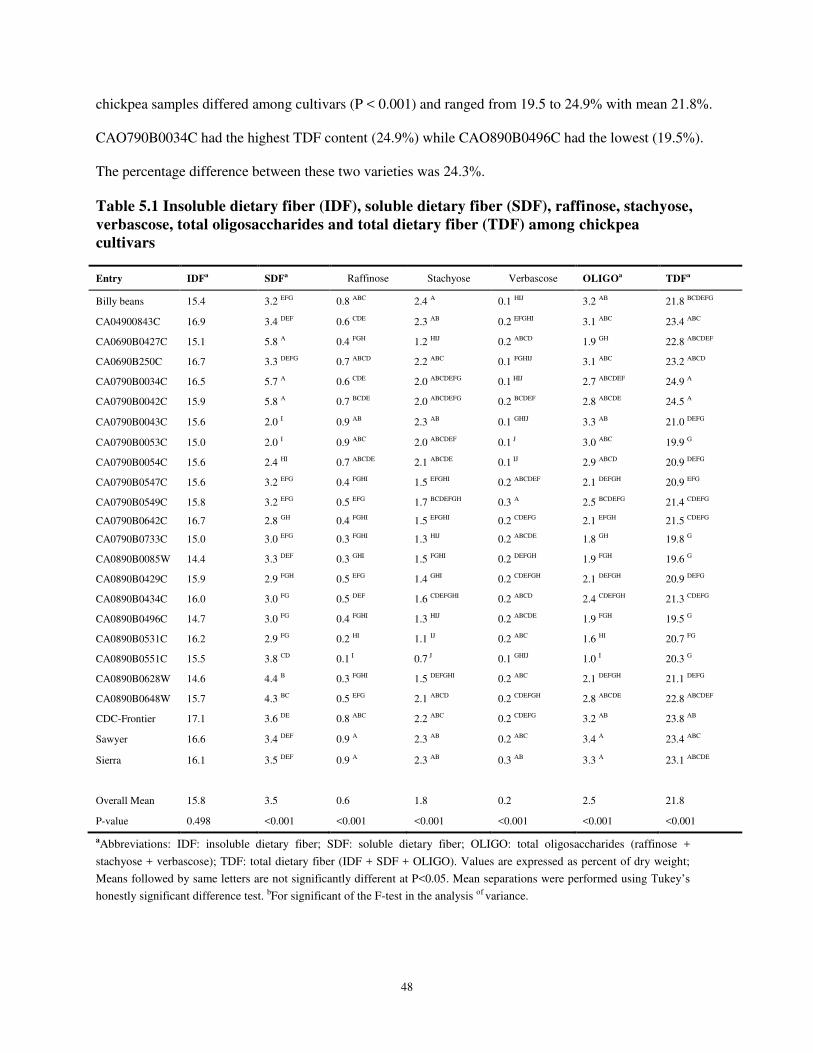
48
chickpea samples differed among cultivars (P < 0.001) and ranged from 19.5 to 24.9% with mean 21.8%.
CAO790B0034C had the highest TDF content (24.9%) while CAO890B0496C had the lowest (19.5%).
The percentage difference between these two varieties was 24.3%.
Table 5.1 Insoluble dietary fiber (IDF), soluble dietary fiber (SDF), raffinose, stachyose,
verbascose, total oligosaccharides and total dietary fiber (TDF) among chickpea
cultivars10
Entry IDFa SDFa Raffinose Stachyose Verbascose OLIGOa TDFa
Billy beans 15.4 3.2 EFG 0.8 ABC 2.4 A 0.1 HIJ 3.2 AB 21.8 BCDEFG
CA04900843C 16.9 3.4 DEF 0.6 CDE 2.3 AB 0.2 EFGHI 3.1 ABC 23.4 ABC
CA0690B0427C 15.1 5.8 A 0.4 FGH 1.2 HIJ 0.2 ABCD 1.9 GH 22.8 ABCDEF
CA0690B250C 16.7 3.3 DEFG 0.7 ABCD 2.2 ABC 0.1 FGHIJ 3.1 ABC 23.2 ABCD
CA0790B0034C 16.5 5.7 A 0.6 CDE 2.0 ABCDEFG 0.1 HIJ 2.7 ABCDEF 24.9 A
CA0790B0042C 15.9 5.8 A 0.7 BCDE 2.0 ABCDEFG 0.2 BCDEF 2.8 ABCDE 24.5 A
CA0790B0043C 15.6 2.0 I 0.9 AB 2.3 AB 0.1 GHIJ 3.3 AB 21.0 DEFG
CA0790B0053C 15.0 2.0 I 0.9 ABC 2.0 ABCDEF 0.1 J 3.0 ABC 19.9 G
CA0790B0054C 15.6 2.4 HI 0.7 ABCDE 2.1 ABCDE 0.1 IJ 2.9 ABCD 20.9 DEFG
CA0790B0547C 15.6 3.2 EFG 0.4 FGHI 1.5 EFGHI 0.2 ABCDEF 2.1 DEFGH 20.9 EFG
CA0790B0549C 15.8 3.2 EFG 0.5 EFG 1.7 BCDEFGH 0.3 A 2.5 BCDEFG 21.4 CDEFG
CA0790B0642C 16.7 2.8 GH 0.4 FGHI 1.5 EFGHI 0.2 CDEFG 2.1 EFGH 21.5 CDEFG
CA0790B0733C 15.0 3.0 EFG 0.3 FGHI 1.3 HIJ 0.2 ABCDE 1.8 GH 19.8 G
CA0890B0085W 14.4 3.3 DEF 0.3 GHI 1.5 FGHI 0.2 DEFGH 1.9 FGH 19.6 G
CA0890B0429C 15.9 2.9 FGH 0.5 EFG 1.4 GHI 0.2 CDEFGH 2.1 DEFGH 20.9 DEFG
CA0890B0434C 16.0 3.0 FG 0.5 DEF 1.6 CDEFGHI 0.2 ABCD 2.4 CDEFGH 21.3 CDEFG
CA0890B0496C 14.7 3.0 FG 0.4 FGHI 1.3 HIJ 0.2 ABCDE 1.9 FGH 19.5 G
CA0890B0531C 16.2 2.9 FG 0.2 HI 1.1 IJ 0.2 ABC 1.6 HI 20.7 FG
CA0890B0551C 15.5 3.8 CD 0.1 I 0.7 J 0.1 GHIJ 1.0 I 20.3 G
CA0890B0628W 14.6 4.4 B 0.3 FGHI 1.5 DEFGHI 0.2 ABC 2.1 DEFGH 21.1 DEFG
CA0890B0648W 15.7 4.3 BC 0.5 EFG 2.1 ABCD 0.2 CDEFGH 2.8 ABCDE 22.8 ABCDEF
CDC-Frontier 17.1 3.6 DE 0.8 ABC 2.2 ABC 0.2 CDEFG 3.2 AB 23.8 AB
Sawyer 16.6 3.4 DEF 0.9 A 2.3 AB 0.2 ABC 3.4 A 23.4 ABC
Sierra 16.1 3.5 DEF 0.9 A 2.3 AB 0.3 AB 3.3 A 23.1 ABCDE
Overall Mean 15.8 3.5 0.6 1.8 0.2 2.5 21.8
P-value 0.498 <0.001 <0.001 <0.001 <0.001 <0.001 <0.001
aAbbreviations: IDF: insoluble dietary fiber; SDF: soluble dietary fiber; OLIGO: total oligosaccharides (raffinose +
stachyose + verbascose); TDF: total dietary fiber (IDF + SDF + OLIGO). Values are expressed as percent of dry weight;
Means followed by same letters are not significantly different at P<0.05. Mean separations were performed using Tukey’s honestly significant difference test. bFor significant of the F-test in the analysis of variance.

49
Figure represents dietary fiber content among chickpea cultivars. Values are expressed by percent of dry weight. Abbreviations
for the legends: IDF = insoluble dietary fiber; SDF = soluble dietary fiber, Total Oligo = total oligosaccharides.
Figure 5.2 Mean percentage of IDF, SDF, total oligosaccharides and TDF among chickpea
cultivars Figure 10 1
Figure represents oligosaccharides content among chickpea cultivars. Values are expressed by percent of dry weight.
Figure 5.3 Mean percentage of raffinose, stachyose, verbascose and total oligosaccharides
among chickpea cultivars Figure 11 1

50
5.3.2 Correlations among different components of dietary fiber
Pearson correlation analysis was conducted to identify the possible associations among dietary
fiber components. The results are shown in Table 5.2. Raffinose had strong positive association
with stachyose, while IDF had a positive association with raffinose, stachyose and total
oligosaccharides. The biosynthesis pathway for raffinose family of oligosaccharides (RFO’s) is
raffinose to stachyose to verbascose and it’s reversible (70). From the correlation test, similarly with dry
pea, for chickpea cultivars, the higher raffinose content will lead higher stachyose and lower verbascose.
Table 5.2 Pearson correlations among all chickpea samples11
Correlations IDF SDF Raffinose Stachyose Verbascose Total Oligo
IDF 1
SDF -0.01
Raffinose 0.26* -0.17
Stachyose 0.25* -0.11 0.88**
Verbascose -0.05 0.16 -0.16 -0.11
Total Oligo 0.26* -0.12 0.94** 0.99** -0.05 1
**. Correlation is significant at the 0.01 level (2-tailed).
*. Correlation is significant at the 0.05 level (2-tailed).
Abbreviations: IDF: insoluble dietary fiber, SDF: soluble dietary fiber, Total Oligos: total oligosaccharides
5.3.3 The influence of location
The effect of the location of production on dietary fiber content was also studied. Samples from
two locations, namely Pullman and Dayton, WA, were compared (Table 5.3). In general there
was no difference in mean IDF, SDF, total oligosaccharides and TDF content among cultivars
between two locations from which chickpea cultivars were harvested.

51
Table 5.3 IDF, SDF, total oligosaccharides, and TDF between two locations of samples12
Cultivar IDFa SDF
a Total Oligo
a TDF
a
Location Pullman Dayton Pullman Dayton Pullman Dayton Pullman Dayton
SIERRA 15.7 16.5 3.5 3.3 3.5 3.5 22.7 23.4
SAWYER 15.9 17.3 3.4 3.3 3.5 3.4 22.8 24.0
CDC-FRONTIER 15.8 18.3 3.6 3.5 3.1 3.4 22.5 25.2
BILLY BEANS 14.5 16.3 3.4 3.0 3.3 3.3 21.1 22.6
CAO4900843C 17.4 16.4 3.6 3.2 3.2 3.0 24.2 22.6
CAO690B250C 16.7 16.8 3.3 3.3 3.1 3.2 23.1 23.4
CAO690B0427C 16.0 14.2 5.7 5.9 2.4 1.3 24.2 21.5
CAO790B0034C 16.2 16.8 6.0 5.4 2.4 3.1 24.6 25.2
CAO790B0042C 16.7 15.2 5.8 5.7 2.7 2.9 25.2 23.9
CAO790B0043C 14.8 16.5 2.1 2.0 3.2 3.5 20.1 21.9
CAO790B0053C 16.1 13.8 2.0 1.9 2.9 3.1 21.1 18.8
CAO790B0054C 16.2 15.0 2.5 2.3 3.0 2.9 21.6 20.3
CAO790B0547C 15.5 15.6 3.0 3.5 1.8 2.3 20.3 21.5
CAO790B0549C 14.2 17.4 2.9 3.5 2.0 3.0 19.1 23.8
CAO790B0642C 17.1 16.4 2.6 2.9 2.3 1.8 22.0 21.1
CAO790B0733C 14.5 15.4 3.0 3.0 2.0 1.8 19.5 20.2
CAO890B0429C 15.5 16.3 2.8 3.0 1.7 2.5 19.9 21.8
CAO890B0085W 15.3 13.4 3.2 3.5 2.1 1.8 20.5 18.7
CAO890B0434C 15.8 16.2 3.2 2.8 2.4 2.4 21.4 21.3
CAO890B0496C 15.7 13.7 3.0 3.0 2.8 0.9 21.5 17.6
CAO890B0531C 17.9 14.5 3.0 2.9 0.9 2.2 21.9 19.6
CAO890B0551C 16.1 14.9 3.8 3.9 1.6 0.4 21.4 19.2
CAO890B0628W 13.8 15.3 4.1 4.8 2.2 1.9 20.1 22.1
CAO890B0648W 15.8 15.6 4.6 4.0 2.9 2.8 23.3 22.4
Mean 15.9 15.5 3.5 3.5 2.4 2.3 21.8 21.3
P-valueb 0.86 0.95 0.88 0.83
aValues are expressed as percent of dry weight; dietary fiber content between two locations (Pullman and Fairfield) are compared
with F-test. Abbreviations: IDF: insoluble dietary fiber; SDF: soluble dietary fiber; OLIGO: total oligosaccharides (raffinose +
stachyose + verbascose); TDF: total dietary fiber (IDF + SDF + OLIGO. bP-value for significant of the F-test in the analysis of
variance.
5.3.4 Discussion
Chickpea is one of the oldest domesticated legumes which originated in the Middle East. India produces
the most chickpea, globally, which accounts for about 67% of the production (88). However, in India and
in other developing countries, the development of food technology and its associated effect in changing
the pattern of food consumption is resulting in a higher risk of chronic diseases such as type-2 diabetes.
52
Consumption trends reveal a decrease in pulse crop consumption in India since the 1990s (89). The same
pattern has also occurred in United States and globally. This raises the possibility of a causal relationship
between decreased pulse consumption and the global pandemic of obesity, and the related diseases, i.e.,
cardiovascular disease, type-2 diabetes, and cancer, whose prevalence has also increased over the same
time interval. The identification of a causal link might relate to dietary fiber intake. Thus accurate data on
the fiber content of chickpeas and other pulse crops is essential.
Our experiment measured the dietary fiber content of twenty-four chickpea cultivars, including IDF, SDF,
raffinose, stachyose, verbascose and the total oligosaccharides by AOAC 2011.25. The average values of
TDF, IDF, SDF and the total oligosaccharides among chickpea cultivars were 21.8%, 15.8%, 3.5% and
2.5%, respectively. For oligosaccharide content, the average values of raffinose, stachyose and verbascose
were 0.6%, 1.8% and 0.2%, respectively. Compared with the older method AOAC 2001, in which
chickpea dietary fiber was reported to be 18 to 22% (86), our results ranged from 19.5 to 24.9%. There is
about 13% difference in dietary fiber content between these two different methods. Once again, it
suggests that older methods underestimated dietary fiber content in comparison to AOAC 2011.25. Based
on the data reported herein, one serving of chickpea contains an average of 7.3g of dietary fiber.
Accordingly, consumption of two servings of chickpea/d could resolve the current dietary fiber gap.
There is a 24.7% difference in TDF content between the highest chickpea cultivar and the lowest. This
magnitude of difference supports the feasibility of breeding and selection to increase dietary fiber content.
For individual components, SDF and total oligosaccharides content were different by cultivar, but IDF
was not. This was surprising since there was considerable variation in IDF among cultivars of other pulse
crops that we have evaluated. It is possible that such lack of variation in chickpea can be explained via
comparative genomics since the complete genetic sequences of various pulse crops are now being
reported.
A significant difference in oligosaccharide content among chickpea cultivars was also observed in this
study. Comparing the highest oligosaccharide content cultivar with the lowest, there was almost a four-
fold difference (Table 5.2). This result suggests that it would be feasible to alter the total oligosaccharide
53
content of chickpea using either traditional breeding approaches or emerging gene editing technologies.
Similar to dry pea and lentil, the dietary fiber content of chickpea was not statistically different between
two locations, which indicate that environment has limited impact on dietary fiber content. Nonetheless,
additional experiments are needed using more diverse growing conditions in order to establish the
magnitude of effect that environment imposes on the expression of genes that regulate dietary fiber
synthesis.
5.3.5 Summary
The average total dietary fiber content for chickpea is 21.8%. Among different chickpea cultivars,
dietary fiber content was significantly different. Oligosaccharides content for chickpea has large
variation which is up to 3.5 fold. Current work indicates that location has a limited effect on
dietary fiber content. Genetic factors have a large impact on dietary fiber content. The dietary
fiber content tested by AOAC 2011.25 method is higher than those tested by older methods. It is
important to promote the use of AOAC 2011.25 method for chickpea dietary fiber content for
encouraging work in the field.

54
CHAPTER 6
PULSE CROP SUMMARY: COMMON BEAN, PEA, LENTIL AND CHICKPEA
Dietary fiber is an important non-nutritive component of food with various health benefits. In many
countries, such as the United States and Canada, the intake of dietary fiber is 50% to 70% below the
recommended levels in greater than 95% of the population. Pulse crops, which have of high protein and
low fat content can provide two to three times more dietary fiber per 100 g edible portion than cereal
grains which are frequently advertised as a key source of dietary fiber. It has been advanced recently (90)
that the lack of pulse consumption is a significant contributor to the dietary fiber gap and that increasing
pulse crop consumption in the daily diet is a potential approach to resolve the dietary fiber intake gap.
Of the seventeen pulses recognized by FAO, chickpea, common bean, dry pea and lentil are the most
widely consumed pulse crops globally and are both affordable and accessible to the majority of
consumers. It is of specific importance and interest to compare the fiber content of these four commonly
consumed pulse crops.
6.1 Total dietary fiber contents among different pulse crops
Table 6.1 shows the mean values among pulse crops for total dietary fiber content and its principal
components, namely insoluble dietary fiber, soluble dietary fibers and total oligosaccharides (i.e. raffinose
+ stachyose + verbascose). Among them, the data for common bean samples were evaluated by Dimas
Echeverria of our laboratory by analyzing 26 common bean entries which belong to the market classes
commonly grown in North America. All four pulse crops have high content of total dietary fiber.
Common bean and dry pea have the highest TDF value, which is higher than chickpea and lentil.
Besides using the unit g dietary fiber/100g dry weight, the units of g/100kcal and g/serving were also
calculated and evaluated. The same ranking can be observed from the perspective of TDF per 100 kcal.

55
However, when comparing TDF per serving (half cup), the sequence becomes different. Usually,
g/serving is used in daily life to calculate total dietary fiber intake (Table 6.1). Common bean and
chickpea contain more dietary fiber than dry pea and lentil per serving.
Table 6.1 Dietary fiber content of four pulse crops13
aAbbreviations: IDF: insoluble dietary fiber; SDF: soluble dietary fiber; OLIGO: total oligosaccharides (raffinose +
stachyose + verbascose); TDF: total dietary fiber (IDF+SDF+OLIGO). bValues are expressed as percent of dry weight;
means with the same letters are not significantly different at P<0.05. Turkey’s honestly significant difference test was
applied for mean separation.
Table 6.2 Range of dietary fiber content (%) among pulse crop cultivars14
Crop IDFa SDF
a OLIGO
a TDF
a
Chickpea 14.4 to 17.1 2.0 to 5.8 1.0 to 3.5 19.5 to 24.9
Common bean 12.3 to 15.7 5.8 to 9.8 3.6 to 5.2 24.1 to 27.4
Dry pea 14.2 to 19.8 3.3 to 5.3 4.0 to 5.4 22.3 to 28.0
Lentil 12.3 to 14.7 2.7 to 3.9 3.0 to 3.7 18.4 to 21.3
aAbbreviations: IDF: insoluble dietary fiber; SDF: soluble dietary fiber; OLIGO: total oligosaccharides (raffinose +
stachyose + verbascose); TDF: total dietary fiber (IDF+SDF+OLIGO). Values are expressed as percent of dry weight.
Table 6.2 summarized the variation in TDF among four most commonly consumed pulse crops. Dry pea,
lentil, common bean (90) and chickpea samples differ in fiber content. The magnitude of variation among
different cultivars suggests the value of adding food labels for cultivar identities, to provide consumers
with more guidance on fiber content among cultivars. Based on data presented in Table 6.2, calculations
Crop IDFa SDF
a OLIGO
a TDF
a
TDFa
g/serving
TDFa
g/ 100 kcal
Chickpea 15.8 A 3.5
A,B 2.5
C 21.8
B 7.1 5.3
Common bean 13.9 B 7.7
A 4.2
A 25.8
A 8.1 6.6
Dry pea 16.2 A
3.9 A,B
4.6 A
24.7 A
4.3 6.4
Lentil 13.6 B
3.1 B
3.3 B
20.0 C
6.0 5.2
p-valueb <0.001 <0.001 <0.001 <0.001

56
were performed to reveal that high fiber cultivars can increase total fiber intake by as much as 30% when
the same amount of the crop is consumed. This significantly increases the feasibility of reaching the
recommended level of dietary fiber consumption without needing to increase caloric intake.
Compared with the data on fiber content determined by older methods, the results from the new method
AOAC 2011.25 are higher in amount and in how dietary fiber is evaluated among its components.
According to the previous studies (91), the dietary fiber content determined by method AOAC 991.43 for
common bean, chickpea, lentil and dry pea are 5.4, 6.2, 5.9 and 10.6%, respectively. The enzymatic-
gravimetric method used by Schakel et al., (92) gives the result of 3.5g/100g for pea and 11.4g/100g for
lentil. However, according to our results by employing the new method AOAC 2011.25, the total fiber
contents of common bean, chickpea, lentil and dry pea are 25.8, 24.7, 20.08 and 21.8%, respectively,
demonstrating that the total dietary fiber content for these pulse crops are higher than suggested by the
older methods of analysis. Such a difference clearly indicates the importance of using fiber contents of the
pulse crops determined using AOAC 2011.25.
Oligosaccharides content in pulse crops have some variations among cultivars. Among the pulse crops
tested, oligosaccharide content in chickpea is markedly different among cultivars. This suggests that for
people who are intolerant to oligosaccharides, it is possible to choose cultivar with lower oligosaccharide
content. The correlations among different oligosaccharides components varied among different pulse
crops and cultivars. Oligosaccharides components in dry pea and chickpea present are similarly correlated
and the correlations differ from those observed in lentil. The correlation of three components, raffinose,
stachyose and verbascose in oligosaccharides provides valuable understanding of the enzymatic pattern in
biosynthesis pathway operation in pulse crops. However, genetic sequence data is needed to better
understand these relationships.
One common question asked by scientists and consumers is whether specific components of dietary fiber
should be emphasized, e.g., insoluble versus soluble dietary fiber, or oligosaccharides. The answer to this
question has varied. The current consensus is that total fiber intake rather than consumption of a specific
component is the most important consideration in terms of human health benefit (93;94).

57
Oligosaccharides are known to be associated with flatulence and have been considered to be an
unfavorable component of dietary fiber. However, recent studies have shown that oligosaccharides can
exert prebiotic effects, and thus their consumption is thought to be also beneficial (25).
6.2 Summary
In summary, the newly developed method AOAC 2011.25 was first applied to determine the total dietary
fiber content of four pulse crops and the amount of each component of dietary fiber in commonly
consumed pulse crops, namely dry pea, lentil and chickpea, and in previous work, common bean. The
impacts of cultivar, market class, and environment on dietary fiber content were studied and the following
conclusions can be drawn:
1. All four pulse crops tested have high dietary fiber content relative to some other food crops, e.g. corn
or rice. Consumption of 2 to 3 servings intake of these pulse crops per day could close the dietary
fiber gap.
2. IDF composes 70% of total dietary fiber content, and stachyose accounts for over half of
oligosaccharide content for all four pulse crops.
3. In comparison with older methods, the AOAC 2011.25 method gives markedly higher values for TDF.
Based on our data, it is clear that other methods underestimate and misclassify the amount of various
fiber components present in pulse crops. It is important to promote the consensus of definition and
method for dietary fiber analysis in not only pulse crops but other food crops as work in the field
progresses.
4. While the environment has limited influence on the fiber content of the pulse crops tested, both
cultivar and market classes had impact on the total dietary fiber content and some dietary fiber
components, indicating that the genetic effect is a dominant factor in regulating dietary fiber content
of pulse crops. The information about market class and genetics is important for consumers who are
interested in increasing their consumption of dietary fiber and for plant breeders who are interested in
developing cultivars with enhanced dietary fiber content.

58
5. People who are not tolerant to oligosaccharides usually have concerns about oligosaccharides content
in pulse crops. Our results suggest that oligosaccharide content vary widely by cultivars. For example,
there is a 3.5 fold difference in oligosaccharide content of chickpea. Knowledge of these differences
not only provides guidance to interested consumers but also inform efforts to alter oligosaccharide
content of pulse crops by breeding and selection.

59
REFERENCES
1. Alimentarius CODEX. (CODEX) guidelines on nutrition labeling CAC/GL 2-1985 as last amended
2010. Secretariat of the CODEX Alimentarius Commission, FAO. Food Standards Programme. 2010.
ROME.
2. Marriot BP, Olsho L, Hadden L, Connor P. Intake of added sugars and selected nutrients in the United
States, National Health and Nutrition Examination Survey (NHANES) 2003-2006. Crit Rev Food Sci
Nutr 2010;50:228-58.
3. McCleary BV, DeVries JW, Rader JI et al. Determination of insoluble, soluble, and total dietary fiber
(CODEX definition) by enzymatic-gravimetric method and liquid chromatography: collaborative study. J
AOAC Int 2012;95:824-844.
4. Trowell H. Definition of dietary fiber and hypotheses that it is a protective factor in certain diseases.
Am J Clin Nutr 1976;29:417-427.
5. Lupton, J. R. Codex final definition of dietary fibre: Issues of implementation. Betteridge, V. A and
Pijls, L. T. Quality Assurance and Safety of Crops & Foods 2009;4:206-212.
6. McCleary BV. Dietary fibre analysis. Proc Nutr Soc 2003;62:3-9.
7. Mudgil D, Barak S. Composition, properties and health benefits of indigestible carbohydrate polymers
as dietary fiber: a review. Int J Biol Macromol 2013;61:1-6.
8. Purves, C. B. Chain Structure in Cellulose and Cellulose Derivatives. Cellulose 1954;4(3): 173-207.
9. O'Sullivan AC, Perez S. The relationship between internal chain length of amylopectin and crystallinity
in starch. Biopolymers 1999;50:381-390.
10. Brummer Y, Kaviani M, Tosh SM. Structural and functional characteristics of dietary fibre in beans,
lentils, peas and chickpeas. Food Research International 2015;67:117-125.
11. Pool-Zobel BL. Inulin-type fructans and reduction in colon cancer risk: review of experimental and
human data. Br J Nutr 2005;93 Suppl 1:S73-S90.
12. Wisselingh CV. Mikrochemische Untersuchungen über die Zellwände der Fungi. Jb wiss Bot
1898;31:619.
13. Lattimer JM, Haub MD. Effects of dietary fiber and its components on metabolic health. Nutrients
2010;2:1266-1289.
14. Varner JE, Lin LS. Plant cell wall architecture. Cell 1989;56:231-239.
15. Neyrinck AM, Possemiers S, Druart C et al. Prebiotic effects of wheat arabinoxylan related to the
increase in bifidobacteria, Roseburia and Bacteroides/Prevotella in diet-induced obese mice. PLoS One
2011;6:e20944.
16. Mohnen D. Pectin structure and biosynthesis. Curr Opin Plant Biol 2008;11:266-77.

60
17. Thakur BR, Singh RK, Handa AK. Chemistry and uses of pectin--a review. Crit Rev Food Sci Nutr
1997;37:47-73.
18. Kaur N, Gupta AK. Applications of inulin and oligofructose in health and nutrition. J Biosci
2002;27:703-714.
19. Flamm G, Glinsmann W, Kritchevsky D, Prosky L, Roberfroid M. Inulin and oligofructose as dietary
fiber: a review of the evidence. Crit Rev Food Sci Nutr 2001;41:353-62.
20. Peterbauer T, Lahuta LB, Blochl A et al. Analysis of the raffinose family oligosaccharide pathway in
pea seeds with contrasting carbohydrate composition. Plant Physiol 2001;127:1764-1772.
21. Courtois J. Oligosaccharides from land plants and algae: production and applications in therapeutics
and biotechnology. Curr Opin Microbiol 2009;12:261-273.
22. Slavin JL. Dietary fiber: classification, chemical analyses, and food sources. J Am Diet Assoc
1987;87:1164-1171.
23. Burkitt DP. Etiology and prevention of colorectal cancer. Hosp Pract (Off Ed) 1984;19:67-77.
24. Elia M, Engfer MB, Green CJ, Silk DB. Systematic review and meta-analysis: the clinical and
physiological effects of fibre-containing enteral formulae. Aliment Pharmacol Ther 2008;27:120-145.
25. Flint HJ, Scott KP, Louis P, Duncan SH. The role of the gut microbiota in nutrition and health. Nat
Rev Gastroenterol Hepatol 2012;9:577-589.
26. Jensen BB, Jorgensen H. Effect of dietary fiber on microbial activity and microbial gas production in
various regions of the gastrointestinal tract of pigs. Appl Environ Microbiol 1994;60:1897-1904.
27. Zeng H, Lazarova DL, Bordonaro M. Mechanisms linking dietary fiber, gut microbiota and colon
cancer prevention. World J Gastrointest Oncol 2014;6:41-51.
28. Viguiliouk E, Blanco MS, Kendall CW, Sievenpiper JL. Can pulses play a role in improving
cardiometabolic health? Evidence from systematic reviews and meta-analyses. Ann N Y Acad Sci
2017;1392:43-57.
29. Alfieri MA, Pomerleau J, Grace DM, Anderson L. Fiber intake of normal weight, moderately obese
and severely obese subjects. Obes Res 1995;3:541-547.
30. Mueller-Cunningham WM, Quintana R, Kasim-Karakas SE. An ad libitum, very low-fat diet results
in weight loss and changes in nutrient intakes in postmenopausal women. J Am Diet Assoc
2003;103:1600-1606.
31. Liu S, Willett WC, Manson JE, Hu FB, Rosner B, Colditz G. Relation between changes in intakes of
dietary fiber and grain products and changes in weight and development of obesity among middle-aged
women. Am J Clin Nutr 2003;78:920-927.
32. Howarth NC, Huang TT, Roberts SB, McCrory MA. Dietary fiber and fat are associated with excess
weight in young and middle-aged US adults. J Am Diet Assoc 2005;105:1365-1372.
33. Wanders AJ, van den Borne JJ, de GC et al. Effects of dietary fibre on subjective appetite, energy
intake and body weight: a systematic review of randomized controlled trials. Obes Rev 2011;12:724-739.

61
34. Weickert MO, Pfeiffer AF. Metabolic effects of dietary fiber consumption and prevention of diabetes.
J Nutr 2008;138:439-442.
35. Gades MD, Stem JS. Chitosan supplementation and fecal fat excretion in men. Obesity research
2003;11:683-688.
36. Clark MJ, Slavin JL. The effect of fiber on satiety and food intake: a systematic review. J Am Coll
Nutr 2013;32:200-211.
37. Keenan HA, Doria A, Aiello LP, King GL. Positivity of C-peptide, GADA and IA2 antibodies in type
1 diabetic patients with extreme duration. Diabetes 2006;55:A65.
38. Saris WH. Glycemic carbohydrate and body weight regulation. Nutr Rev 2003;61:S10-S16.
39. Brussels. International Diabetes Federation. IDF Diabetes Atlas. International Diabetes Federation.
(5th ed). 2011.
40. de Munter JS, Hu FB, Spiegelman D, Franz M, van Dam RM. Whole grain, bran, and germ intake and
risk of type 2 diabetes: a prospective cohort study and systematic review. PLoS Med 2007;4:e261.
41. Ye EQ, Chacko SA, Chou EL, Kugizaki M, Liu S. Greater whole-grain intake is associated with
lower risk of type 2 diabetes, cardiovascular disease, and weight gain. J Nutr 2012;142:1304-1313.
42. Gemen R, de Vries JF, Slavin JL. Relationship between molecular structure of cereal dietary fiber and
health effects: focus on glucose/insulin response and gut health. Nutr Rev 2011;69:22-33.
43. Murakami K, Okubo H, Sasaki S. Effect of dietary factors on incidence of type 2 diabetes: a
systematic review of cohort studies. J Nutr Sci Vitaminol (Tokyo) 2005;51:292-310.
44. Wood PJ, Braaten JT, Scott FW, Riedel KD, Wolynetz MS, Collins MW. Effect of dose and
modification of viscous properties of oat gum on plasma glucose and insulin following an oral glucose
load. Br J Nutr 1994;72:731-743.
45. WHO. Global status report on non-communicable diseases 2010. Retrieved from:
http://www.who.int/nmh/publications/ncd_report2010/en/
46. Satija A, Hu FB. Cardiovascular benefits of dietary fiber. Curr Atheroscler Rep 2012;14:505-514.
47. Pereira MA, O'Reilly E, Augustsson K et al. Dietary fiber and risk of coronary heart disease: a pooled
analysis of cohort studies. Arch Intern Med 2004;164:370-376.
48. Threapleton DE, Greenwood DC, Evans CE et al. Dietary fibre intake and risk of cardiovascular
disease: systematic review and meta-analysis. BMJ 2013;347:f6879.
49. Ludwig DS, Pereira MA, Kroenke CH et al. Dietary fiber, weight gain, and cardiovascular disease
risk factors in young adults. JAMA 1999;282:1539-1546.
50. Walldius G, Jungner I, Holme I, Aastveit AH, Kolar W, Steiner E. High apolipoprotein B, low
apolipoprotein A-I, and improvement in the prediction of fatal myocardial infarction (AMORIS study): a
prospective study. Lancet 2001;358:2026-2033.

62
51. McKeown NM, Meigs JB, Liu S, Wilson PW, Jacques PF. Whole-grain intake is favorably associated
with metabolic risk factors for type 2 diabetes and cardiovascular disease in the Framingham Offspring
Study. Am J Clin Nutr 2002;76:390-398.
52. Slavin JL, Martini MC, Jacobs DR, Jr., Marquart L. Plausible mechanisms for the protectiveness of
whole grains. Am J Clin Nutr 1999;70:459S-463S.
53. Stewart, B. W. K. P and Wild, C. P. World cancer report. 2014.
54. Trock B, Lanza E, Greenwald P. Dietary fiber, vegetables, and colon cancer: critical review and meta-
analyses of the epidemiologic evidence. J Natl Cancer Inst 1990;82:650-661.
55. Coleman HG, Murray LJ, Hicks B et al. Dietary fiber and the risk of precancerous lesions and cancer
of the esophagus: a systematic review and meta-analysis. Nutr Rev 2013;71:474-482.
56. Aune D, Chan DS, Greenwood DC et al. Dietary fiber and breast cancer risk: a systematic review and
meta-analysis of prospective studies. Ann Oncol 2012;23:1394-1402.
57. Aune D, Chan DS, Lau R et al. Dietary fibre, whole grains, and risk of colorectal cancer: systematic
review and dose-response meta-analysis of prospective studies. BMJ 2011;343:d6617.
58. Aune D, Keum N, Giovannucci E et al. Whole grain consumption and risk of cardiovascular disease,
cancer, and all cause and cause specific mortality: systematic review and dose-response meta-analysis of
prospective studies. BMJ 2016;353:i2716.
59. Terry P, Giovannucci E, Michels KB et al. Fruit, vegetables, dietary fiber, and risk of colorectal
cancer. J Natl Cancer Inst 2001;93:525-533.
60. Murphy N, Norat T, Ferrari P et al. Dietary fibre intake and risks of cancers of the colon and rectum
in the European prospective investigation into cancer and nutrition (EPIC). PLoS One 2012;7:e39361.
61. King DE, Mainous AG, III, Lambourne CA. Trends in dietary fiber intake in the United States, 1999-
2008. J Acad Nutr Diet 2012;112:642-648.
62. Cummings JH. Dietary fibre intakes in Europe: overview and summary of European research
activities, conducted by members of the Management Committee of COST 92. European journal of
clinical nutrition 1995;49:S5
63. Scott JM, McDougle L, Schwirian K, Taylor CA. Differences in the dietary intake habits by diabetes
status for African American adults. Ethn Dis 2010;20:99-105.
64. Slavin JL. Dietary fiber and body weight. Nutrition 2005;21:411-418.
65. Kleintop AE, Echeverria D, Brick LA, Thompson HJ, Brick MA. Adaptation of the AOAC 2011.25
integrated total dietary fiber assay to determine the dietary fiber and oligosaccharide content of dry edible
beans. J Agric Food Chem 2013;61:9719-9726.
66. Roy, F. Bioactive proteins and peptides in pulse crops: Pea, chickpea and lentil. Boye, J. I and
Simpson, B. K. Food Research International 2010;43(2),:432-442.

63
67. Dahl WJ, Foster LM, Tyler RT. Review of the health benefits of peas (Pisum sativum L.). Br J Nutr
2012;108 Suppl 1:S3-10.
68. Theander O, Aman P, Westerlund E, Andersson R, Pettersson D. Total dietary fiber determined as
neutral sugar residues, uronic acid residues, and Klason lignin (the Uppsala method): collaborative study.
J AOAC Int 1995;78:1030-1044.
69. Dodevska MS, Djordjevic BI, Sobajic SS, Miletic ID, Djordjevic PB, Dimitrijevic-Sreckovic VS.
Characterisation of dietary fibre components in cereals and legumes used in Serbian diet. Food Chem
2013;141:1624-1629.
70. Sengupta S, Mukherjee S, Basak P, Majumder AL. Significance of galactinol and raffinose family
oligosaccharide synthesis in plants. Front Plant Sci 2015;6:656.
71. Mobley AR, Jones JM, Rodriguez J, Slavin J, Zelman KM. Identifying practical solutions to meet
America's fiber needs: proceedings from the Food & Fiber Summit. Nutrients 2014;6:2540-2551.
72. U.S.Department of Agriculture. Agricultural Research Service. What We Eat in America: Nutrient
Intakes from Food by Gender and Age. National Health and Nutrition Examination Survey (NHANES)
2009-10. Retrieved from; https://data.nal.usda.gov/dataset/what-we-eat-america-wweia-database_117.
73. Sandhu, J. S. History and origin. In Lentil. Singh, S. Springer Netherlands. 2007;1-9.
74. Bhatty, R. S. Composition and quality of lentil (Lens culinaris Medik): a review. Canadian Institute of
Food Science and Technology Journal. 1988; 21(2): 144-160.
75. Patterson CA, Maskus H, Dupasquier C. Pulse crops for health. Cereal Foods World 2009;54:108.
76. Van Soest PJ, R.H.Wine. Use of detergents in the analysis of fibrous feeds. IV, Determination of plant
cell wall constituents. J Assoc Offic Anal Chem 1967;50.
77. McQueen RE, Nicholson J W G. Modification of the neutral-detergent fiber procedure for cereals and
vegetables by using an alpha-amylase. J Assoc Offic Anal Chem 1979.
78. VIDAL-VALVERDE, C. Dietary fiber in processed lentils. Frias, J and Esteban, R. 1992; (57(5)):
1161-1163.
79. GE de Almeida Costa. Chemical composition, dietary fibre and resistant starch contents of raw and
cooked pea, common bean, chickpea and lentil legumes. da Silva Queiroz-Monici, Reis, S. M. P. M, and
de Oliveira, A. C. Food chemistry 2006;94(3):327-330.
80. Takruri HR, Issa AY. Role of lentils (Lens culinaris L.) in human health and nutrition: a review.
Mediterranean Journal of Nutrition and Metabolism 2013;1:3-16.
81. FAOSTAT. 2016. Retrieved from: http://www.fao.org/faostat/en/#data/QC
82. Ofuya, Z. M. The role of pulses in human nutrition: a review. Akhidue, V. Journal of Applied
Sciences and Environmental Management 2005;9(3): 99-104.
83. Ting, Feng. Nutrients and Health Function of Chickpea and Its Application . Food and Nutrition in
China 1, 20. 2011.

64
84. Jukanti AK, Gaur PM, Gowda CL, Chibbar RN. Nutritional quality and health benefits of chickpea
(Cicer arietinum L.): a review. Br J Nutr 2012;108 Suppl 1:S11-S26.
85. Dalgetty DD, Baik BK. Isolation and characterization of cotyledon fibers from peas, lentils, and
chickpeas. Cereal Chemistry 2003;80:310-315.
86. Tosh SM, Yada S. Dietary fibres in pulse seeds and fractions: Characterization, functional attributes,
and applications. Food Research International 2010;43:450-460.
87. Vandemark GJ, Brick MA, Osorno JM, kelly JD, Urrea CA. Edible grain legumes. Yield Gains in
Major US Field Crops 2014;87-124.
88. Saxena MC, Singh KB. The chickpea. Commonwealth Agricultural Bureaux International., 1987.
89. Khanum F, Siddalinga SM, Sudarshana Krishna KR, Santhanam K, Viswanathan KR. Dietary fiber
content of commonly fresh and cooked vegetables consumed in India. Plant Foods Hum Nutr
2000;55:207-218.
90. Chen Y, McGee R, Vandemark G, Brick M, Thompson HJ. Dietary Fiber Analysis of Four Pulses
Using AOAC 2011.25: Implications for Human Health. Nutrients 2016;8.
91. Li BW, Andrews KW, Pehrsson PR. Individual sugars, soluble, and insoluble dietary fiber contents of
70 high consumption foods. Journal of food composition and analysis 2002;15:715-723.
92. Schakel S, Sievert YA, Buzzard IM. Dietary fiber values for common foods. The CRC handbook of
dietary fiber in human nutrition, 2001.
93. Jones JM. CODEX-aligned dietary fiber definitions help to bridge the 'fiber gap'. Nutr J 2014;13:34.
94. Jones JM. Dietary fiber future directions: integrating new definitions and findings to inform nutrition
research and communication. Adv Nutr 2013;4:8-15.


![[Model names] PEA-RP200GAQ PEA-RP250GAQ PEA-RP400GAQ PEA …mitsubishitech.co.uk/Data/Mr-Slim_Indoor/PEA[H]-RP/... · PEA-RP200GAQ Fan Performance Curve 50Hz PEA-RP250GAQ Fan Performance](https://static.fdocuments.net/doc/165x107/600812e007963a6f320df208/model-names-pea-rp200gaq-pea-rp250gaq-pea-rp400gaq-pea-h-rp-pea-rp200gaq.jpg)


![[Model names] PEA-RP200GAQ PEA-RP250GAQ PEA-RP400GAQ PEA …H]-RP/2016-2015/PEA... · PEA-RP200GAQ Fan Performance Curve 50Hz PEA-RP250GAQ Fan Performance Curve 50Hz PEA-RP400GAQ](https://static.fdocuments.net/doc/165x107/5f80bcbd06056748830d6182/model-names-pea-rp200gaq-pea-rp250gaq-pea-rp400gaq-pea-h-rp2016-2015pea.jpg)