Thermokinetic Modeling of Phase Transformation in the ...
9
Thermokinetic Modeling of Phase Transformation in the Laser Powder Deposition Process EHSAN FOROOZMEHR and RADOVAN KOVACEVIC A finite element model coupled with a thermokinetic model is developed to predict the phase transformation of the laser deposition of AISI 4140 on a substrate with the same material. Four different deposition patterns, long-bead, short-bead, spiral-in, and spiral-out, are used to cover a similar area. Using a finite element model, the temperature history of the laser powder deposition (LPD) process is determined. The martensite transformation as well as martensite tempering is considered to calculate the final fraction of martensite, ferrite, cementite, e-carbide, and retained austenite. Comparing the surface hardness topography of different patterns reveals that path planning is a critical parameter in laser surface modification. The predicted results are in a close agreement with the experimental results. DOI: 10.1007/s11661-009-9870-9 ȑ The Minerals, Metals & Materials Society and ASM International 2009 I. INTRODUCTION LASER powder deposition (LPD) in the past two decades has been one of the fastest growing manufac- turing processes. Various applications such as building components with complex geometry, syntheses of func- tionally graded materials, surface coating, and alloying, and repairing valued components have made it a unique processing technique in manufacturing. Locally heating and cooling the material during the process has serious effects on the quality of the deposited material. Kaplan and Groboth [1] analytically studied the effect of param- eters on clad layer formation and overlapping of tracks. Labudovic et al. [2] studied the effect of process param- eters on the formation of residual stress along the height of a single wall deposition. Choi et al. [3,4] had an extensive experimental study on the effect of laser power, laser scanning speed, and powder flow rate on the geometry, microstructure, and defect formation in the process. The studies of the process have shown that the microstructure depends not only on the already mentioned parameters, but also on any parameter that can change the temperature history of each location throughout the buildup. Costa et al. has studied the effect of idle time between layers [5,6] and substrate size [6,7] on the final microstructure and hardness of the deposition of a single wall. Similar work was performed by Wang et al. [8] to investigate the effect of laser power and traverse speed on the phase transformation during the process. Kelly et al. [9] studied the effect of the number of layers in depositing a single wall of a type of titanium alloy on the microstructure evolution. More detailed research has also been performed on defining the effect of process parameters on phase transformation during the heat treatment of materials. [10–12] Obviously, reaching a specific microstructure or hardness level in the buildup requires understanding of the temperature- phase transformation relation. A wide range of metal alloys have been used in the LPD process. Depending on the composition of the material, the microstructure transformation may have different responses to the process parameters. In the current work, a type of low-alloy steel, AISI 4140, is used to cover the surface of a substrate with different deposition patterns. Solid-state phase transformation is defined by the temperature and heating or cooling rate. The molten deposited material after solidification at solidus temperature consists of austenite (c). If the cooling rate is high enough, the martensite transforma- tion, which is a nondiffusive transformation, occurs. The minimum required cooling rate for transforming aus- tenite to martensite for AISI 4140 is about 25 ŶC/s. [13] On the other side, the cooling rate in the LPD process is usually much higher than 25 ŶC/s (on the order of 10 4 ŶC/s [11] ) because of a relatively large cold substrate. Therefore, the austenite by crossing the martensite start temperature (M s ) transforms to martensite until it reaches the martensite end temperature (M f ). If the cooling process stops, the martensite transformation also stops and the martensite is transformed only if the temperature continues to cool. [14] The multipass depo- sition process disturbs the normal cooling trend of the material and may temper the martensite. Tempering the martensite generally has three steps: generation of transition carbides (100 ŶC to 250 ŶC), transforming retained austenite to ferrite and cementite (200 ŶC to 300 ŶC), and replacing the transition carbides with cementite and ferrite (starting from 250 ŶC to 350 ŶC). There might be a forth step for high-alloy steels where alloy carbides are generated at 500 ŶC to 650 ŶC. This step can be ignored for low-alloy steels such as AISI 4140. At a new heating cycle, the material may have three conditions: if the material is heated more than A c3 , the EHSAN FOROOZMEHR, Ph.D. Candidate, and RADOVAN KOVACEVIC, Director, are with the Center for Laser Aided Manufacturing (CLAM), Southern Methodist University, Dallas, TX 75205. Contact e-mail: [email protected] Manuscript submitted October 13, 2008. Article published online June 24, 2009 METALLURGICAL AND MATERIALS TRANSACTIONS A VOLUME 40A, AUGUST 2009—1935
Transcript of Thermokinetic Modeling of Phase Transformation in the ...

Thermokinetic Modeling of Phase Transformationin the Laser Powder Deposition Process
EHSAN FOROOZMEHR and RADOVAN KOVACEVIC
A finite element model coupled with a thermokinetic model is developed to predict the phasetransformation of the laser deposition of AISI 4140 on a substrate with the same material.Four different deposition patterns, long-bead, short-bead, spiral-in, and spiral-out, are used tocover a similar area. Using a finite element model, the temperature history of the laser powderdeposition (LPD) process is determined. The martensite transformation as well as martensitetempering is considered to calculate the final fraction of martensite, ferrite, cementite, e-carbide,and retained austenite. Comparing the surface hardness topography of different patterns revealsthat path planning is a critical parameter in laser surface modification. The predicted results arein a close agreement with the experimental results.
DOI: 10.1007/s11661-009-9870-9� The Minerals, Metals & Materials Society and ASM International 2009
I. INTRODUCTION
LASER powder deposition (LPD) in the past twodecades has been one of the fastest growing manufac-turing processes. Various applications such as buildingcomponents with complex geometry, syntheses of func-tionally graded materials, surface coating, and alloying,and repairing valued components have made it a uniqueprocessing technique in manufacturing. Locally heatingand cooling the material during the process has seriouseffects on the quality of the deposited material. Kaplanand Groboth[1] analytically studied the effect of param-eters on clad layer formation and overlapping of tracks.Labudovic et al.[2] studied the effect of process param-eters on the formation of residual stress along the heightof a single wall deposition. Choi et al.[3,4] had anextensive experimental study on the effect of laserpower, laser scanning speed, and powder flow rate onthe geometry, microstructure, and defect formation inthe process. The studies of the process have shown thatthe microstructure depends not only on the alreadymentioned parameters, but also on any parameter thatcan change the temperature history of each locationthroughout the buildup. Costa et al. has studied theeffect of idle time between layers[5,6] and substratesize[6,7] on the final microstructure and hardness of thedeposition of a single wall. Similar work was performedby Wang et al.[8] to investigate the effect of laser powerand traverse speed on the phase transformation duringthe process. Kelly et al.[9] studied the effect of thenumber of layers in depositing a single wall of a type oftitanium alloy on the microstructure evolution. Moredetailed research has also been performed on definingthe effect of process parameters on phase transformation
during the heat treatment of materials.[10–12] Obviously,reaching a specific microstructure or hardness level inthe buildup requires understanding of the temperature-phase transformation relation.A wide range of metal alloys have been used in the
LPD process. Depending on the composition of thematerial, the microstructure transformation may havedifferent responses to the process parameters. In thecurrent work, a type of low-alloy steel, AISI 4140, isused to cover the surface of a substrate with differentdeposition patterns. Solid-state phase transformation isdefined by the temperature and heating or cooling rate.The molten deposited material after solidification atsolidus temperature consists of austenite (c). If thecooling rate is high enough, the martensite transforma-tion, which is a nondiffusive transformation, occurs. Theminimum required cooling rate for transforming aus-tenite to martensite for AISI 4140 is about 25 �C/s.[13]On the other side, the cooling rate in the LPD process isusually much higher than 25 �C/s (on the order of104 �C/s[11]) because of a relatively large cold substrate.Therefore, the austenite by crossing the martensite starttemperature (Ms) transforms to martensite until itreaches the martensite end temperature (Mf). If thecooling process stops, the martensite transformationalso stops and the martensite is transformed only if thetemperature continues to cool.[14] The multipass depo-sition process disturbs the normal cooling trend of thematerial and may temper the martensite. Tempering themartensite generally has three steps: generation oftransition carbides (100 �C to 250 �C), transformingretained austenite to ferrite and cementite (200 �C to300 �C), and replacing the transition carbides withcementite and ferrite (starting from 250 �C to 350 �C).There might be a forth step for high-alloy steels wherealloy carbides are generated at 500 �C to 650 �C. Thisstep can be ignored for low-alloy steels such as AISI4140.At a new heating cycle, the material may have three
conditions: if the material is heated more than Ac3, the
EHSAN FOROOZMEHR, Ph.D. Candidate, and RADOVANKOVACEVIC, Director, are with the Center for Laser AidedManufacturing (CLAM), Southern Methodist University, Dallas,TX 75205. Contact e-mail: [email protected]
Manuscript submitted October 13, 2008.Article published online June 24, 2009
METALLURGICAL AND MATERIALS TRANSACTIONS A VOLUME 40A, AUGUST 2009—1935
material is fully austenitized, and in the next coolingcycle can be transformed to martensite; for temperaturesbetween Ac1 and Ac3, partial austenite is generated sothat no austenization at Ac1 and full austenization at Ac3
are considered. For temperatures less than Ac1, noaustenization occurs and the material is tempered. Thefinal fraction of each phase of the material at anylocation defines the hardness at that location byconsidering the hardness of individual phases.
In the surface repairing processes, one of the keyparameters that affects the quality of the final partbesides the main process parameters is the path plan-ning.[15] Heating and cooling cycles can be changedsignificantly by changing the surface scanning path. Inthis study, the effect of four different patterns on thefinal surface hardness of the deposition of AISI 4140 ona substrate with the same material is studied. A coupledthermal and kinetic analysis is employed to calculate thethermal history and hardness throughout the part.
II. PHASE TRANSFORMATION ANALYSIS
Analyzing the phase transformation in the LPDprocess requires knowledge of the temperature historyat each point. The transient nature of the process, inaddition to the dependency of material properties ontemperature, makes solving the equations analyticallyimpossible. ANSYS finite element software is used tomodel the heat transfer during the LPD process. Theelement ‘‘birth and death’’ option in ANSYS is used tomodel the additive nature of the process. The temper-ature, as a function of location and time, for each pointis used in a subroutine developed in the MATLAB toanalyze the phase transformation and final microstruc-ture. A semiempirical model is used to identify thefraction of each phase at each point and its correspond-ing hardness.
A. Thermal Model
The finite element analysis of the temperature of theLPD process with respect to time and location requiresthe geometry of the part, which is defined by a mesh offinite elements that should be updated over time torepresent the additive nature of the process. Thecontinuous movement of the laser beam over thesubstrate is divided into small divisions of the staticthermal analysis, called time-steps.
1. Mathematical descriptionIn every time-step, the energy balance equation
(Eq. [1]) is solved using the finite element method, and
the results are used as the initial conditions for the nexttime-step:
qcp@T
@t¼ r� krTð Þ ½1�
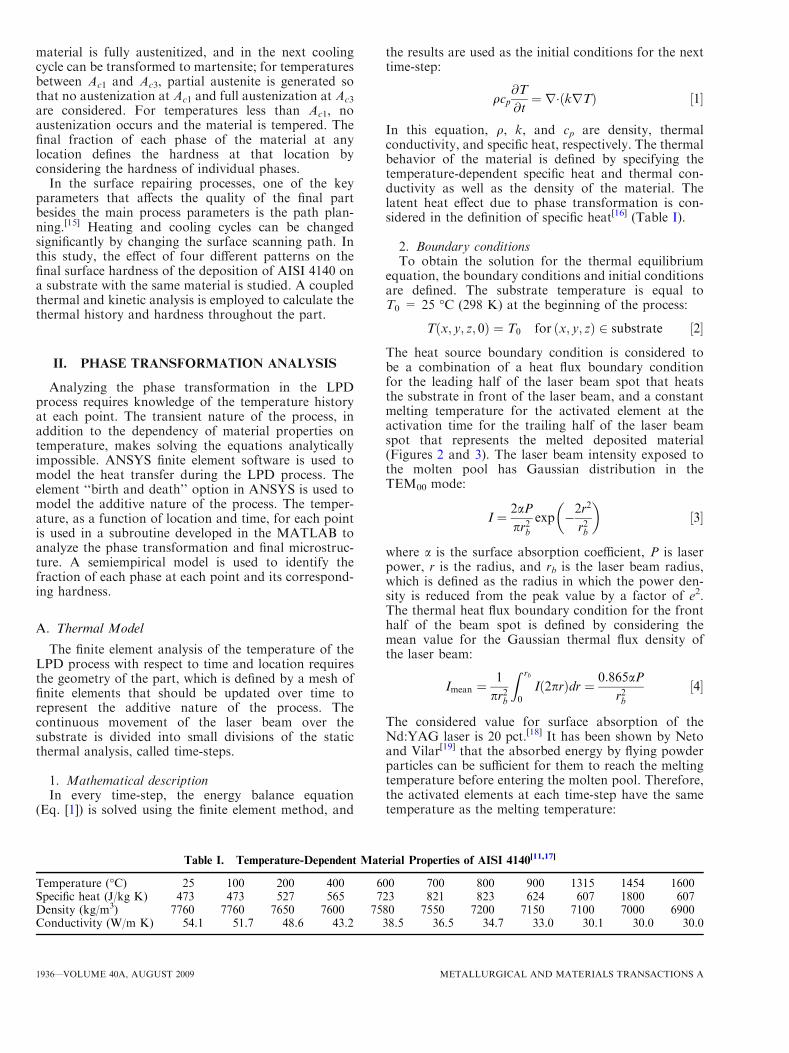
In this equation, q, k, and cp are density, thermalconductivity, and specific heat, respectively. The thermalbehavior of the material is defined by specifying thetemperature-dependent specific heat and thermal con-ductivity as well as the density of the material. Thelatent heat effect due to phase transformation is con-sidered in the definition of specific heat[16] (Table I).
2. Boundary conditionsTo obtain the solution for the thermal equilibrium
equation, the boundary conditions and initial conditionsare defined. The substrate temperature is equal toT0 = 25 �C (298 K) at the beginning of the process:
T x; y; z; 0ð Þ ¼ T0 for x; y; zð Þ 2 substrate ½2�
The heat source boundary condition is considered tobe a combination of a heat flux boundary conditionfor the leading half of the laser beam spot that heatsthe substrate in front of the laser beam, and a constantmelting temperature for the activated element at theactivation time for the trailing half of the laser beamspot that represents the melted deposited material(Figures 2 and 3). The laser beam intensity exposed tothe molten pool has Gaussian distribution in theTEM00 mode:
I ¼ 2aP
pr2bexp �2r
2
r2b
� �½3�
where a is the surface absorption coefficient, P is laserpower, r is the radius, and rb is the laser beam radius,which is defined as the radius in which the power den-sity is reduced from the peak value by a factor of e2.The thermal heat flux boundary condition for the fronthalf of the beam spot is defined by considering themean value for the Gaussian thermal flux density ofthe laser beam:
Imean ¼1
pr2b
Z rb
0
I 2prð Þdr ¼ 0:865aP
r2b½4�
The considered value for surface absorption of theNd:YAG laser is 20 pct.[18] It has been shown by Netoand Vilar[19] that the absorbed energy by flying powderparticles can be sufficient for them to reach the meltingtemperature before entering the molten pool. Therefore,the activated elements at each time-step have the sametemperature as the melting temperature:
Table I. Temperature-Dependent Material Properties of AISI 4140[11,17]
Temperature (�C) 25 100 200 400 600 700 800 900 1315 1454 1600Specific heat (J/kg K) 473 473 527 565 723 821 823 624 607 1800 607Density (kg/m3) 7760 7760 7650 7600 7580 7550 7200 7150 7100 7000 6900Conductivity (W/m K) 54.1 51.7 48.6 43.2 38.5 36.5 34.7 33.0 30.1 30.0 30.0
1936—VOLUME 40A, AUGUST 2009 METALLURGICAL AND MATERIALS TRANSACTIONS A
T x; y; z; tactivationð Þ¼ Tm for x; y; zð Þ 2 activated elements ½5�
The local surface heat-transfer condition consists ofconvection heat transfer and radiation:
q ¼ h Tw � T0ð Þ þ er T4W � T4
0
� �½6�
where h is the convection coefficient, e is the emissivitycoefficient, r is the Stefan–Boltzmann constant, and Tw
and T0 are the surface and ambient temperatures,respectively.
Because the radiation is most effective at hightemperatures, this boundary condition is defined onlyat the molten pool region. In order to reduce the orderof nonlinearity of the problem, the local surface heattransfer at the molten pool is estimated according toVinokurov:[20]
q ¼ hþ re T3 þ T0T2 þ T2
0Tþ T30
� �� �T� T0ð Þ
¼ Hlump T� T0ð Þ ½7�
where Hlump can be estimated as
Hlump ¼ 2:4� 10�3eT1:61m ½8�
The associated loss in accuracy using this relationship isestimated to be less than 5 pct.[2] The emissivity coef-ficient around the melting temperature is considered tobe 0.6.[16]
3. AssumptionsThe assumptions during the thermal modeling of the
LPD process are as follows.
(1) The substrate is initially at room temperature(25 �C). The boundary condition around the sub-strate is the convection heat transfer with a con-stant coefficient.
(2) The heat flux on the leading half (Figure 2) hasuniform distribution, based on Eq. [5].
(3) The latent heat is considered in the temperature-dependent definition of specific heat.
(4) The activated elements of the molten pool are atthe melting temperature. The convective redistribu-tion of heat in the molten pool is ignored.
B. Thermokinetic Model
Based on the results from the thermal model, thetemperature history of the nodes is used to predict thephase transformations during the heating and coolingcycles. The microstructure of the material after solidi-fication consists of austenite. Depending on the coolingrate of the process, different phases can be transformedfrom the austenite. However, in the LPD process, thehigh cooling rate due to a large low-temperature massof substrate results in only a martensite transforma-tion when the temperature drops below Ms.
[8] Theproportion of martensite in this transformation canbe obtained from an empirical relation proposed byKoistinen and Marburger:[21]
fm ¼ 1� fc exp �0:011 Ms � Tð Þð Þ Ms>T>Mf ½9�
where fc is the fraction of austenite and Mf is martensiteend-transformation temperature. The maximum mar-tensite can be achieved when the material cools to reachMf. In the multipass LPD process, the cooling cycle maybe disturbed by the next deposited bead that conse-quently stops the martensite transformation. Dependingon the temperature in the new heating cycle, themartensite may be decomposed to new phases. Thefollowing assumptions are used to quantify the temperedmicrostructure.
(1) The tempering process takes place if there existsany fraction of martensite and the temperature isbelow Ac1 and higher than 100 �C.
(2) Two steps are considered for the tempering:[11,22]
(a) formation of transition carbide (e-carbide) and fer-rite that occurs during tempering up to 250 �C;and
(b) formation of cementite and ferrite that occursfrom 250 �C up to Ac1.
(3) If the temperature goes higher than Ac1, the frac-tion of austenite linearly increases until it becomesequal to one at Ac3.
The fraction of tempered martensite can be calculatedwith the Johnson–Mehl–Avrami equation for solid-statetransformation:[23]
f ¼ 1� exp �bnð Þ ½10�
where, for the nonisothermal condition,
b ¼Z
kðTÞdt ¼Z
k0 exp �Q
RT
� �dt ½11�
where Q is the martensite tempering activation energy,R is the universal gas constant, and n and k0 areempirical constants. At any temperature, the fractionof tempered martensite is calculated. The considerabletempered phases are e-carbide (e), ferrite (a), cementite(c), and retained austenite (cR). As mentioned, mar-tensite transforms to e-carbide and ferrite at tempera-tures under 250 �C. The amount of untemperedmartensite (fmu) can be calculated from
fmu¼ fm 1� fð Þ ½12�
where fm is the initial fraction of martensite.The carbon mass balance for this situation can be
represented by
Cmaterial ¼ fmuCm þ faCa þ feCe þ fcRCcR ½13�
The carbon content of martensite up to 2 wt pctcarbon content is the same as the base material.[24]
Therefore,
Cmaterial ¼ Cm ¼ CcR ½14�
and
fm þ fcR ¼ 1 ½15�
METALLURGICAL AND MATERIALS TRANSACTIONS A VOLUME 40A, AUGUST 2009—1937

By substituting Eqs. [12], [14], and [15] into Eq. [13]and simplifying the relation, the fraction of ferrite ande-carbide is defined as
fe ¼ ffmcm � ca
ce � ca½16�
fa ¼ ffm � fe ½17�
For the temperature between 250 �C and Ac1, with asimilar calculation, the fraction of cementite and ferritecan be expressed as
fc ¼ ffmcm � ca
cc � ca½18�
fa ¼ ffm � fc ½19�
After the fraction of each phase in the material is cal-culated, the hardness of the material can be obtainedby considering the fraction of each phase multiplied byits corresponding hardness:
H ¼ fmuHm þ feHe þ faHa þ fcHc þ fcRHc ½20�
The assumed values for the parameters used in themodeling are summarized in Table II.
C. Material Properties
As mentioned, the fraction of each phase at any pointdepends on the temperature history with respect to thetransformation temperatures Ms, Mf, Ac1, and Ac3.Because the phase transformation is a diffusive process,
it requires enough time to be accomplished. In the LPDprocess, the heating and cooling rates are on the order of103 to 104 �C/s. Extensive research was performed byMiokovic et al.[12,25] on the effect of heating and coolingrates on transformation temperatures. Based on theirresults, the assumed values for Ac1 and Ac3 are 850 �Cand 925 �C, respectively. This effect, however, for Ms
and Mf is negligible, and the assumed values for themartensite start and end temperatures are 350 �C and150 �C, respectively.
III. MODEL APPLICATION
The mentioned coupled models of thermal andthermokinetic analysis are used to investigate the effectof path planning on the microstructure of the depositedmaterial in the LPD process. For this purpose, fourcases with the same deposition area are studied fordifferent deposition patterns, as shown in Figure 1.In the LPD process, as shown in Figure 2, the
deposition region can be divided into two regions: the‘‘leading half,’’ which moves in front of the laser beamand melts the substrate; and the ‘‘trailing half,’’ whichfollows the leading half and contains the moltenmaterial. This concept is used for modeling the depo-sition process by the finite element method, as shown inFigure 3. In this figure, four regions are distinguished:the white elements represent the substrate or the layerunderneath, the light-gray elements represent the depos-ited elements that were activated in the previous time-steps, the dark-gray elements are the activated elements
Table II. Assumed Parameters Values in the Modeling
Equations [11], [12], [14], [16], and [18]
Parameter Description Value
a surface absorption 0.2e surface emissivity 0.6Ac1 austenization start temperature (�C) 850Ac3 austenization end temperature (�C) 925Ca ferrite carbon content 0.015Ce e-carbide carbon content 8.23Cc austenite carbon content 0.4CC cementite carbon content 6.7Cm martensite carbon content 0.4Ha ferrite hardness (HV) 150He e-carbide hardness (HV) 600Hc austenite hardness (HV) 150HC cementite hardness (HV) 400Hm martensite hardness (HV) 700k0 empirical parameter (s�1) 5.11 9 109
Mf martensite transformationend temperature (�C)
150
Ms martensite transformationstart temperature (�C)
250
P laser power (W) 275Q activation energy (kJ/mol) 196.9R universal gas constant (J/mol K) 8.314rb laser beam radius (mm) 0.5T0 ambient temperature (�C) 25Tm melting temperature (�C) 1475
Fig. 1—Schematic presentation of deposition paths: (a) long-beads,(b) short-beads, (c) spiral-in, and (d) spiral-out.
Fig. 2—Schematic of LPD process, leading half and trailing half areshown in the molten region.
1938—VOLUME 40A, AUGUST 2009 METALLURGICAL AND MATERIALS TRANSACTIONS A

in the current time-step and have the boundary condi-tion melting temperature, and the dotted region repre-sents the leading half in which the heat flux is activatedon the substrate in the current time-step. Therefore, inevery time-step, the heat flux is activated on the elementof the substrate or previous layer followed by theactivation of the elements having the boundary condi-tion of melting temperature. The process continues untilthe total length of one bead is completed. Then, thebeam changes direction to follow the path, as shown inFigure 1. The coating is complete when the correspond-ing path is finished. The deposition process is followedby a cooling time until the part cools to room temper-ature.
In the present study, the laser scanning speed is10 mm/s, and the powder feeding rate is 3 g/min with apowder efficiency of 30 pct. The deposition area, asshown in Figure 4, is 15 9 5 mm, and the spacingbetween deposition tracks is 0.5 mm. With a time-stepof 25 ms, a set of four elements of 0.25 9 0.25 90.20 mm dimension is activated (Figure 4). The area onwhich the heat flux is activated is 0.25 9 0.50 mm2.
IV. RESULTS AND DISCUSSION
The obtained results from the model show that thedeposition pattern has a strong effect on the finalhardness of the surface. This effect is shown in Figures 5through 8 for the long-bead, short-bead, spiral-in, andspiral-out patterns, respectively. In each figure, the
corresponding deposition path is shown. For the long-bead pattern, as shown in Figure 5, the hardness has aminimum value at the starting bead and a maximumvalue at the last two beads. In between the startingand ending edges, the hardness has a fairly uniformdistribution with a smaller value than the maximumhardness, except at the end points of each bead. Theshort-bead pattern, however, has a significantly differenthardness distribution. Although the first bead shows a
Fig. 3—Finite element model for the LPD process.
Fig. 4—Finite element model of the substrate and deposition region for one-layer cladding; the first activated set of elements is shown in a highermagnification.
Fig. 5—Surface hardness topography of long-bead pattern.
Fig. 6—Surface hardness topography of short-bead pattern.
METALLURGICAL AND MATERIALS TRANSACTIONS A VOLUME 40A, AUGUST 2009—1939

relatively low hardness, the other beads up to the lastfew beads have fairly uniform and high hardness values.The last few beads have a maximum hardness.
The spiral-in and spiral-out patterns, as shown inFigures 7 and 8, have a symmetrical distribution ofhardness along the longitudinal and traversal mid-axes.Nonetheless, the spiral-in pattern has an increasingtrend from the outer edges to the center, while the spiral-out pattern has a decreasing trend from the outer edgesto the center. An overview of the four mentioned casesreveals that the starting region of the deposition pathhas the smallest hardness and the ending region ofdeposition has its maximum value. This result is inagreement with similar observations reported by Costaet al.,[5–7] Wang et al.,[8] and Kadiri et al.[26] in thedeposition of a single wall.
Referring back to Figure 5, three points (A, B, and C)at the center line of the length of the surface are locatedat the center of the first, middle, and last beads,respectively. The temperature, austenite fraction, andhardness vs time for these points are shown in Figure 9.For point A, the second peak temperature (marked witha in Figure 9(a)) does not cross the Ac1 line, and no newaustenite is generated (point a¢ in Figure 9(b)). How-ever, this high temperature tempers the material andcauses a reduction in the corresponding hardness(marked with a¢¢ in Figure 9(c)). The temperatureprofile for point B shows a high peak value for thesecond heating cycle (marked with b in Figure 9(a)) thatresults in full austenization of the material (point b¢ in
Figure 9(b)). Consequently, the hardness drops to theaustenite hardness level (point b¢¢ in Figure 9(c)). Thethird peak (c) results in tempering the material and areduction in the hardness profile (marked with c¢¢).Because the tempering temperature (point c inFigure 9(a)) for point B is less than the temperingtemperature (point a in Figure 9(a)) for point A, lessreduction in hardness is observed (point c¢¢ vs point a¢¢).Point C, however, does not experience any temperingcycle. Therefore, the maximum hardness is expected forthis point. The retained austenite fraction for points Aand B is negligible, as shown in Figure 9(a). However, atpoint C, the retained austenite fraction is about 11 pct.This prediction of the model about a higher value forretained austenite for untempered locations in the laserdeposition process is in agreement with the resultsreported in References 6, 8, 17, and 27.The center nodes of the experiments shown in
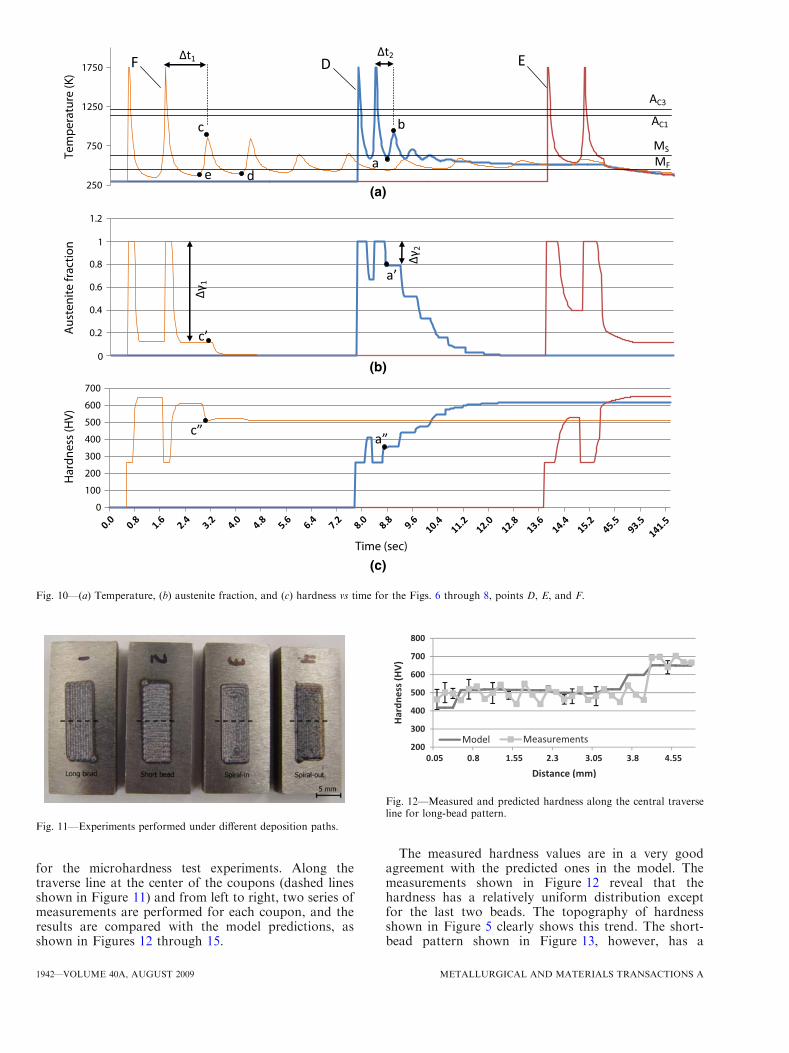
Figures 6 through 8 are marked with letters D, E, andF, respectively. The results of studying the effect of thedeposition pattern on the phase transformation duringthe LPD process are shown in Figure 10. Point D, asshown in Figure 10(a), has shorter heating cycles thanpoints E and F, due to the shorter traveling path of thelaser beam. After the second peak temperature inpoint D, a small amount of martensite is formed bydecreasing the temperature to a point marked with a inFigure 10(a). Consequently, an increase in the hardness(marked with a¢¢ in Figure 10(c)) and a decrease in theaustenite fraction (marked with a¢ in Figure 10(b)) occurat the corresponding time. The next peak temperature ismarked with b in Figure 10(a). Because the amount oftransformed martensite in the last cooling cycle is verysmall, this tempering cycle is not very effective inreducing the hardness at the corresponding time. Inaddition, the amount of retained austenite is highenough to be transformed to martensite in the nextcooling cycle that crosses Ms. The next peak tempera-tures coming after point b are relatively low and do nothave a noticeable effect on reducing hardness. There-fore, a progressive trend in the hardness of this point isobserved up to the end of the process.Point E in Figure 10 has a similar thermal history to
point C in Figure 9. Because point E is on the lastdeposition bead, there is no tempering cycle aftercooling the point under Ms. Therefore, the highestachievable hardness is expected at this point. Point F inFigure 10 is also similar to point B in Figure 9. The firstpeak temperature below the Ac1 (marked with c inFigure 10(a)) tempers the material and causes a reduc-tion in the corresponding hardness (marked with c¢¢ inFigure 10(c)). Because the retained austenite at thispoint (marked with c¢ in Figure 10(b)) is relatively small,cooling the material to the point marked with d slightlyincreases the hardness.Considering the fact that all process parameters are
kept constant during the experiments, the significance ofselecting the deposition pattern is obvious by comparingthe results shown in Figures 5 through 8. The fourdifferent deposition patterns have a different temperingeffect on the previously deposited beads. If the beadnumber is indicated by m, the deposition of the bead m
Fig. 7—Surface hardness topography of spiral-in pattern.
Fig. 8—Surface hardness topography for spiral-out pattern.
1940—VOLUME 40A, AUGUST 2009 METALLURGICAL AND MATERIALS TRANSACTIONS A

results in full austenization of bead m�1 and temperingbead m�2. The time interval between the deposition ofbeads m�1 and m is the result of choosing thedeposition path. As shown in Figure 10(a), the temper-ing time interval (Dt2) for the short-bead pattern at pointD (shown in Figure 6) is about one-third of the one (Dt1)for the spiral-out pattern at point F (shown in Figure 8).This larger time results in a larger decrease in thetemperature at point e, which is even less than Mf.Consequently, the austenite fraction drops equal to Dc1in Figure 10(b). However, the minimum temperaturemarked with a results in a reduction of austenite equalto Dc2 in Figure 10(b). A greater decrease in the beaddeposition interval can even eliminate any formation ofmartensite. Nonetheless, the deposition area could be alimitation in choosing the optimal deposition pattern.The obtained results show that the short-bead experi-ment has a higher average and reasonably uniformhardness. The spiral-out and long-bead patterns alsoshow a relatively uniform hardness distributionaway from the edges, although the average hardnessfor the mentioned patterns is noticeably less than the
short-bead pattern. The spiral-in pattern has the mostnonuniform hardness distribution.
V. MODEL VERIFICATION
In order to verify the validation of the model, a seriesof experiments are performed. The experimental setupcomprises a 1-kW continuous wave Nd:YAG lasersystem with a deposition head, a 5-axis CNC verticalmachining center, and a powder feeding system withargon carrying gas. Each coupon is clamped on theCNC table before performing the experiment. Eachdeposition path is defined in the CNC machine with thesame process parameters as the model (laser power, laserscanning speed, and spacing between tracks). Figure 11shows the coupons for different deposition patterns. Tocompare the surface hardness of the coupons with themodeled hardness values shown in Figures 5 through 8,the coupons are ground slightly and polished to becomesmooth enough for the microhardness test. A 200-g loadand 150-lm distance between indentations are chosen
(a)
(b)
(c)
Fig. 9—(a) Temperature, (b) austenite fraction, and (c) hardness vs time for Fig. 5, points A, B, and C.
METALLURGICAL AND MATERIALS TRANSACTIONS A VOLUME 40A, AUGUST 2009—1941
for the microhardness test experiments. Along thetraverse line at the center of the coupons (dashed linesshown in Figure 11) and from left to right, two series ofmeasurements are performed for each coupon, and theresults are compared with the model predictions, asshown in Figures 12 through 15.
The measured hardness values are in a very goodagreement with the predicted ones in the model. Themeasurements shown in Figure 12 reveal that thehardness has a relatively uniform distribution exceptfor the last two beads. The topography of hardnessshown in Figure 5 clearly shows this trend. The short-bead pattern shown in Figure 13, however, has a
(a)
(b)
(c)
Fig. 10—(a) Temperature, (b) austenite fraction, and (c) hardness vs time for the Figs. 6 through 8, points D, E, and F.
Fig. 11—Experiments performed under different deposition paths.
Fig. 12—Measured and predicted hardness along the central traverseline for long-bead pattern.
1942—VOLUME 40A, AUGUST 2009 METALLURGICAL AND MATERIALS TRANSACTIONS A

relatively smooth hardness variation with an averagevalue of about 60 to 80 HV higher than that of otherpatterns. The experimental results for the spiral-in andspiral-out patterns follow the expected variations, asshown in Figures 7 and 8.
VI. CONCLUSIONS
The thermokinetic model of the LPD process can beeffectively used to predict the effect of process param-eters on the final microstructure of the buildup. In thepresent work, this model is used to study the effect ofpath planning on the final hardness of the surface. It isshown that the deposition path can influence thetemperature history of different points and can affectthe final microstructure of the part. Among fourdifferent deposition patterns covering a similar area,
the short-bead pattern shows a higher average hardness.However, the spiral-in pattern has the most nonuniformhardness distribution. The long-bead and spiral-outpatterns end up with a relatively uniform hardnessdistribution but less hardness than the short-beadpattern. The experimental results show a very goodagreement with the predicted values of the model.
ACKNOWLEDGMENT
This project was financially supported by NSFGrant No. EEC-0541952.
REFERENCES1. A.F.H. Kaplan and G. Groboth: J. Manuf. Sci. Eng. Trans.
ASME, 2001, vol. 123, pp. 609–14.2. M. Labudovic, D. Hu, and R. Kovacevic: J. Mater. Sci., 2003,
vol. 38, pp. 35–49.3. J. Choi and Y. Chang: Int. J. Mach. Tools. Manuf., 2004, vol. 45,
pp. 597–607.4. J. Choi and Y. Hua: J. Laser Appl., 2004, vol. 16 (4), pp. 245–51.5. L. Costa, T. Reti, AM. Deus, and R. Vilar: Proc. Int. Conf. Metal
Powder Deposition for Rapid Manufacturing, Princeton, NJ, 2002,pp. 172–79.
6. L. Costa, R. Vilar, T. Reti, and A.M. Deus: Acta Mater., 2005,vol. 53, pp. 3987–99.
7. L. Costa, R. Vilar, T. Reti, R. Colaco, A.M. Deus, and I. Felde:Mater. Sci. Forum, 2005, vols. 437–474, pp. 315–20.
8. L. Wang and S. Felicelli: Manuf. Sci. Eng. Trans. ASME, 2007,vol. 129, pp. 1028–34.
9. S.M. Kelly, S.S. Babu, S.A. David, T. Zacharia, and S.L. Kampe:TMS 2004, Charlotte, NC, pp. 45–52.
10. C.C. Liu, X.J. Xu, and Z. Liu: Finite Elem. Anal. Des., 2003,vol. 39, pp. 1053–70.
11. R.S. Lakhkar, Y.C. Shin, and M.J.M. Krane: Mater. Sci. Eng. A,2008, vol. 480, pp. 209–17.
12. T. Miokovic, V. Schulze, O. Vohringer, and D. Lohe: Mater. Sci.Eng. A, 2006, vols. 435–436, pp. 547–55.
13. M. V. Li, D.V. Niebuhr, L.L. Meekisho, and D.G. Atteridge:Mater. Trans. B, Process Metall. Mater. Process Sci., 1998,vol. 29B, pp. 661–72.
14. M.A. Golozar: Principles and Applications of Heat Treatment ofSteels, Isfahan University of Technology Press, Isfahan, Iran, 2001.
15. G. Wang, Y. Chen, and H. Zhang: Thin Solid Films, 2003,vol. 435, pp. 124–30.
16. M. Labudovic, D. Hu, and R. Kovacevic: Proc. Inst. Mech. Eng.B: J. Eng. Manuf., 2000, vol. 214 (8), pp. 683–92.
17. L. Wang, H.E. Kadiri, S. Felicelli, M. Horstemeyer, and P. Wang:SPIE Defense and Security Symp., Orlando, FL, 2007.
18. L.R. Migliore: Adv. Mater. Processes, 1998, can be accessed athttp://www.laserk.com/newsletters/index.html, accessed Aug. 2008.
19. O.O.D. Neto and R. Vilar: J. Laser Appl., 2002, vol. 14 (1),pp. 46–51.
20. V.A. Vinokurov: Welding Stresses and Distortion: Determinationand Elimination, British Library Lending Division, Boston Spa,England, 1977, pp. 118–19.
21. D.P. Koistinen and R.E. Marburger: Acta Metall., 1959, vol. 7,p. 59.
22. K. Davut, C.H. Gur, and X. Kleber: ECNDT 2006, Poster 108.23. E.J. Mittermeijer: J. Mater. Sci., 1992, vol. 27, pp. 3977–87.24. G. Krauss: Steels: Heat Treatment and Processing Principles, ASM
INTERNATIONAL, Materials Park, OH, 1990.25. T. Miokovic, J. Schwarzer, V. Schulze, O. Vohringer, and
D. Lohe: J. Phys. IV JP., 2004, vol. 120, pp. 591–98.26. H.E. Kadiri, L. Wang, M.F. Horstemeyer, R.S. Yassar,
J.T. Berry, S. Felicelli, and P.T. Wang: Mater. Sci. Eng. A, 2008,vol. 494 (1–2), pp. 10–20.
27. R. Colaco and R. Vilar: J. Mater. Sci. Lett., 1998, vol. 17,pp. 563–67.
Fig. 13—Measured and predicted hardness along the central traverseline for short-bead pattern.
Fig. 15—Measured and predicted hardness along the central traverseline for spiral-out pattern.
Fig. 14—Measured and predicted hardness along the central traverseline for spiral-in pattern.
METALLURGICAL AND MATERIALS TRANSACTIONS A VOLUME 40A, AUGUST 2009—1943