Thermo mechanical fatigue: code of practice and ...ommi.co.uk/PDF/Articles/163.pdf · Thermo...
12
OMMI. 2008, Vol. 5., Issue 1, May ommi.co.uk Thermo mechanical fatigue: code of practice and development of mechanical models Jerzy OKRAJNI, Anżelina MAREK, Grzegorz JUNAK Silesian University of Technology, Department of Mechanics of Materials, ul. Krasińskiego 8, 40-019 Katowice Abstract The main problem addressed in the paper is the description of a deformation process under the conditions of mechanical and thermal interactions. An appropriate model description has been developed. The description of the deformation process is based on steady state characteristics for isothermal low-cycle fatigue. Validation of the model has been performed. So far, experimental verification of the model description to determine the stress-strain characteristics’ course for selected tests of thermo-mechanical fatigue has been made. Key words: thermo-mechanical fatigue, stress-strain characteristics, model approach 1. Introduction Thermo-mechanical fatigue is one of many important phenomena which determine the cracking processes of machine parts and equipment components subject to mechanical and thermal loadings in power engineering, chemical, metallurgical, aircraft and transport industries. Despite its fatigue-like nature, this type of material destruction is also connected with other processes stimulated by long-lasting exposure to elevated temperatures, such as aging, oxidation or creep. Most often, it is not possible to apply the characteristics determined in static tensile tests to describe the deformation process of a material in conditions where temperature and stresses change simultaneously. For practical applications characterization of thermo-mechanical fatigue in a given material consists of characteristics of cyclic stress, strain and strength taken as the number of cycles until failure in steady-state conditions of fatigue tests. Such data are necessary for designers to predict the behaviour and strength of components in case of the aforementioned types of materials’ application, and is as important as creep and low-cycle fatigue characteristics, which are commonly applied for the description of material cracking processes taking place at an increased temperature. Determining the characteristics of thermo-mechanical fatigue is frequently connected with a number of technical problems and until the present moment, no standard has been established to carry out this sort of fatigue tests. In the year 2000, the European Commission made a decision to finance a research project under the 5th Framework Programme (acronym: TMF – Standard), whose aim was to establish guidelines to codify the procedures of thermo- mechanical fatigue tests performance. The works were initiated by Johan Bressers and coordinated by Peter Hähner in the Joint Research Centre, Institute for Energy in Petten. The project involved 20 industrial, research and scientific centres. The project was completed in 2005 and its result at the current stage is a draft of a standard in the form of detailed procedure guidelines (Code-of-Practice) [1,2] referring to all practical aspects of the thermo-mechanical 1
Transcript of Thermo mechanical fatigue: code of practice and ...ommi.co.uk/PDF/Articles/163.pdf · Thermo...
OMMI. 2008, Vol. 5., Issue 1, May ommi.co.uk
Thermo mechanical fatigue: code of practice and development of mechanical models
Jerzy OKRAJNI, Anżelina MAREK, Grzegorz JUNAK
Silesian University of Technology, Department of Mechanics of Materials, ul. Krasińskiego 8, 40-019 Katowice
Abstract
The main problem addressed in the paper is the description of a deformation process under the conditions of mechanical and thermal interactions. An appropriate model description has been developed. The description of the deformation process is based on steady state characteristics for isothermal low-cycle fatigue. Validation of the model has been performed. So far, experimental verification of the model description to determine the stress-strain characteristics’ course for selected tests of thermo-mechanical fatigue has been made.
Key words: thermo-mechanical fatigue, stress-strain characteristics, model approach
1. Introduction
Thermo-mechanical fatigue is one of many important phenomena which determine the cracking processes of machine parts and equipment components subject to mechanical and thermal loadings in power engineering, chemical, metallurgical, aircraft and transport industries. Despite its fatigue-like nature, this type of material destruction is also connected with other processes stimulated by long-lasting exposure to elevated temperatures, such as aging, oxidation or creep. Most often, it is not possible to apply the characteristics determined in static tensile tests to describe the deformation process of a material in conditions where temperature and stresses change simultaneously.
For practical applications characterization of thermo-mechanical fatigue in a given material consists of characteristics of cyclic stress, strain and strength taken as the number of cycles until failure in steady-state conditions of fatigue tests. Such data are necessary for designers to predict the behaviour and strength of components in case of the aforementioned types of materials’ application, and is as important as creep and low-cycle fatigue characteristics, which are commonly applied for the description of material cracking processes taking place at an increased temperature.
Determining the characteristics of thermo-mechanical fatigue is frequently connected with a number of technical problems and until the present moment, no standard has been established to carry out this sort of fatigue tests. In the year 2000, the European Commission made a decision to finance a research project under the 5th Framework Programme (acronym: TMF – Standard), whose aim was to establish guidelines to codify the procedures of thermo-mechanical fatigue tests performance. The works were initiated by Johan Bressers and coordinated by Peter Hähner in the Joint Research Centre, Institute for Energy in Petten. The project involved 20 industrial, research and scientific centres. The project was completed in 2005 and its result at the current stage is a draft of a standard in the form of detailed procedure guidelines (Code-of-Practice) [1,2] referring to all practical aspects of the thermo-mechanical
1
OMMI. 2008, Vol. 5., Issue 1, May ommi.co.uk
fatigue research (TMF) under controlled strain, such as adequate dynamic methods of measurement and temperature control, the effects caused by deviation from the nominal temperature value, phase lag between the mechanical strain cycle and the temperature cycle (Fig. 1), methods of test initiation and its start after turning off, as well as admissible temperature gradients.
400
500
600
700
800
900
1000
5 55 105 155TIME, s
TEM
PER
ATU
RE,
K
-0,005
-0,004
-0,003
-0,002
-0,001
0
0,001
0,002
0,003
0,004
0,005
STR
AIN
TEMPERATURE MECHANICAL STRAIN TOTAL STRAIN
-400
-300
-200
-100
0
100
200
300
400
500
600
-0,006 -0,004 -0,002 0 0,002 0,004 0,006
MECHANICAL STRAIN
STR
ESS,
MPa
a) b)
Fig. 1. Characteristics of a thermo-mechanical fatigue test (P91 steel): (a) characteristics of command signals’ cycles – total strain and temperature, and their result -
mechanical strain cycle; (b) dependence of stress on mechanical strain for the test whose characteristics are presented in fig. 1a
– mechanical strain cycle is shifted in phase in relation to temperature by a 180º angle
Thermo-mechanical fatigue tests belong to the most complex mechanical tests [1-5]. Generally it can be said that they consist of simultaneous control of the temperature and total (geometrical) strains - ε (Fig. 1a). The effect of the two control signals is mechanical strain - εM (1) being the difference between total strain -ε and thermal strain -εT.
TM εεε −= (1)
Taking into account the number of parameters controlling material behaviour in practical applications, thermo-mechanical fatigue tests can show a large variety. Different sorts of temperature and strain cycles can be used – saw-toothed, sinusoidal, trapezoidal or rectangular for instance. Shifts in the strain cycle phase in relation to the temperature cycle are possible. The difference can also refer to the values of maximal and minimal test parameters and the cycle periods or its individual parts. Due to a variety of tests and their performance period in laboratory conditions, it is possible to carry out only selected types of tests, so that they would refer to the most frequent cases of fatigue in machine and equipment components [5-11]. Among commonly applied tests, there are those using saw-toothed cycles, at a constant heating and cooling rate, and a constant strain rate. The strain cycle can be shifted in phase in relation to the temperature cycle [1-4]. Most frequently, such shift amounts to 180o (cycles with opposite phases), 90o (-90o) (tests with rhomboidal – diamond characteristics) or 0o, where there is no shift in phase (cycles identical in phase).
Examples of results of tests carried out for the T/P91 and T/P92 steels commonly applied
in power engineering equipment operating in conditions, where mechanical and thermal interactions take place [12-15] have been shown in Fig. 2 and Fig. 3. Table 1 presents
2

OMMI. 2008, Vol. 5., Issue 1, May ommi.co.uk
chemical composition of the steels which were used in TMF tests in Silesian University of Technology, Department of Mechanics of Materials. Both steels were tested in state after normalizing and tempering. Fatigue tests were performed on the servo hydraulic system with the computer control and an induction system of heating. Hollow specimens were used which allow cooling by the air blown through the axial hole. The gage length was equal 11,8 mm. Fig. 2a presents dependence of maximum, minimum and mean stress on the number of loading cycles determined for T/P91 steel. Dependence between mechanical strain and stress is shown on the Fig. 2b for the test with a mechanical strain signal identical in phase with the temperature signal. Fig. 3a shows the examples of the relationship between the number of cycles maximum, minimum, mean stress and the range of changes in stress for T/P92 steel. The stress-strain behaviour in TMF OP (out of phase [1,2]) test of this steel is shown in form of hysteresis loops in the Fig. 3b.
Table 1. Chemical compositions of steels Chemical Composition (mass - %) Grade C Mn Si P S Cr Ni Mo V W Al Nb N B
T/P91 0,11 0,37 0,33 0,012 0,009 8,25 0,12 0,91 0,21 0,008 0,065 T/P92 0,09 0,48 0,19 0,015 0,001 9,36 0,25 0,49 0,19 1,73 0,008 0,07 0,049 0,002
-600
-400
-200
0
200
400
600
800
0 200 400 600 800 1000 1200 1400
NUMBER OF CYCLES
STR
ES
S, M
Pa
MAX MIN MEAN RANGE
-500
-400
-300
-200
-100
0
100
200
300
400
-0,005 -0,003 -0,001 0,001 0,003 0,005
MECHANICAL STRAIN
STR
ES
S, M
Pa
a) b) Fig. 2. Thermo-mechanical fatigue test results for steel T/P91:
(a) dependence of maximum, minimum, mean stress and stress range on the number of loading cycles; cycles with identical phases (IP);
(b) dependence between mechanical strain and stress; test with a mechanical strain signal identical in phase with the temperature signal.
3

OMMI. 2008, Vol. 5., Issue 1, May ommi.co.uk
-400
-200
0
200
400
600
800
1000
0 200 400 600 800 1000 1200 1400
NUMBER OF CYCLES
STR
ES
S, M
Pa
MAX MIN MEAN RANGE
-400
-300
-200
-100
0
100
200
300
400
500
600
-0,006 -0,004 -0,002 0 0,002 0,004 0,006
MECHANICAL STRAIN
STR
ES
S, M
Pa
a) b)
Fig. 3. Characteristics of a thermo-mechanical fatigue test (T/P92 steel): a) – maximal, minimal, mean stress and stress range as the function of the cycle number, b) – dependence of stress on mechanical stress – mechanical strain cycle is shifted in phase in relation to
temperature by a 180º angle
Taking into account a limited number of tests carried out in laboratory conditions, the problem to be solved is the description of material characteristics in other cases, based on selected test results. This paper focuses on the description of stress-strain characteristics in the form of a hysteresis loop, by building their mathematical model based on low-cycle fatigue studies.
2. Model description
One of the methods commonly applied in the analysis of a deformation process taking place in low-cycle fatigue conditions is an approach which refers to the steady state, which should be approximately characterized by stability of the characteristics in the form of a hysteresis loop for any selected strain range [3,4,6]. Such an approach is correct only in some cases. Most often, the characteristics of a state known as “steady" or "saturated" state depend on the load history and in a case where an assumption is made that a material shows the saturated state, what is left to be solved is the problem of evaluating the accuracy of the characteristics’ description, with the accuracy evaluation being most often based on laboratory research results. In the case of thermo-mechanical fatigue, the problem becomes much more complex due to the influence of temperature on the cyclic processes which strengthen or weaken the material and thus, on the saturated state characteristics. Taking into account the much higher degree of complexity of the description of material behaviour in thermo-mechanical fatigue conditions compared to the low-cycle fatigue at constant temperatures, at this stage of developing the basis for a model approach to the stress-strain characteristics in such conditions, it seems reasonable that an assumption is made about stability of the material characteristics.
A consequence of such an assumption is the possibility of presenting stress as a function of strain and temperature, without the necessity of taking into account the effects connected with the loading history. In this paper, the description of the deformation process, under thermo-mechanical fatigue, is based on the steady state characteristics for isothermal low-cycle fatigue. The method takes advantage of mathematical models of dependences describing the course of hysteresis loop branches, determined for individual constant temperatures of tests
4

OMMI. 2008, Vol. 5., Issue 1, May ommi.co.uk
[16]. The co-ordinate origin was assumed to be found at the peak of a hysteresis loop, at minimal strain. In such a case, the thicker line visible in Fig. 4a illustrates part of a hysteresis loop at a growing stress. In Fig. 5a it will be the section between points of coordinates (εR,σR) and (εC,σC).
T T T1 2 3> >T <T <T1 2 3
0
100
200
300
400
500
600
700
800
0 0,002 0,004 0,006 0,008
STRAIN - ε'
STR
ES
S -
σ',
MP
a
573 K 773 K 923 K
a) b)
Fig. 4. Deformation characteristics: half of a hysteresis loop under deformation in isothermal conditions – part of the cycle at increasing deformation a) sketch, b) experimentally determined curves (T/P91 steel)
In the proposed method a mathematical model of the characteristics shown in figure 4a was adopted, with its general form:
( ) ( )εεεσ Δ∈′′=′ ,0,,Tf (2)
By transforming the function (2) and taking into account initial conditions for the part of the hysteresis loop illustrating the course of deformation at increasing strain, the following dependency is obtained:
( )[ ] RR Tf σεεσ +−= , (3)
A similar transformation for a part of the cycle at decreasing strain yields:
[ ] CC Tf σεεσ +−−= , (4)
Equations (3) and (4) include values for the coordinates of the hysteresis loop peaks. These coordinates have constant values for stabilized hysteresis loops for fatigue in isothermal conditions. Thus, the problem of determining the hysteresis loop’s branches at an increasing and decreasing strain, assuming that the courses of both branches of the loop can be described with the same dependence (2), boils down to different transformations of the hysteresis loop.
Determination of the course of dependence between mechanical strain, stress and temperature under thermo-mechanical fatigue conditions is becoming a much more complex problem. The dependencies between stress and strain are influenced by the temperature which appears as an independent variable as a function of [ ]Tf ,ε ′ and determines the values of σR and σC. Thus, a problem of determining the values of (σR) and (σC) arises (Fig. 5). These
5

OMMI. 2008, Vol. 5., Issue 1, May ommi.co.uk
values cannot be determined from simple dependences of stress on strain and temperature for a maximum and minimum strain in a thermo-mechanical cycle.
-400
-300
-200
-100
0
100
200
300
400
-0,006 -0,004 -0,002 0 0,002 0,004 0,006
STRAIN
STR
ES
S,
MP
a
-400
-300
-200
-100
0
100
200
300
400
500
600
-0,006 -0,004 -0,002 0 0,002 0,004 0,006
MECHANICAL STRAINS
TRES
S, M
Pa
2 CYCLE 373 CYCLE
εC0,σC0εC,σC
εR0,σR0
εR,σR
a) b)
Fig. 5. Stress-strain characteristics: (a) hysteresis loop under low-cycle fatigue conditions, (b) selected hysteresis loops for thermo-mechanical fatigue
The influence of temperature on the values of σR and σC can be taken into account in equations (3) and (4) through introducing additional functions, ( )T,εϕ or ( T, )εϕ′ , which allow for the effect of remembering the value of initial strain by the material. In this way, for the part of the hysteresis loop corresponding to the growing strain, the following dependence is obtained:
( )TRR ,0 εϕσσ += (5)
For the part of the hysteresis loop corresponding to the decreasing strain, the following dependence is adopted:
( )TCC ,0 εϕσσ ′+= (6)
( T, )εϕ and ( T, )εϕ′ should be treated here as functions correcting the values of σR and σC
with reference to their initial values, σR0 and σC0 , for the actual temperature, which is variable during deformation. For a mechanical strain cycle characterized by a value of the load constancy ratio equal -1, the functions ( )T,εϕ and ( )T,εϕ′ can be expressed in a general form:
( ) ( )[ ] ( )[{ }TfTfT RRR ,,21, εεεεεϕ −−−= ] (7)
( ) [ ] [{ TfTfT CCC ,,21, εεεεεϕ −−−−=′ ]} (8)
Graphic interpretation of function ( )T,εϕ is presented in Fig. 6, showing how an abrupt temperature change influences the stress-strain curve in the hysteresis loop part referring to the growing strain.
6
OMMI. 2008, Vol. 5., Issue 1, May ommi.co.uk
T =TR 1
a) (b) Fig. 6. Graphic representation of the influence of an abrupt temperature change on the course of
deformation characteristics for a hysteresis loop branch at a growing deformation: (a) abrupt temperature fall, (b) abrupt temperature increase
Figure 6a presents the case T1<T2; Figure 6b shows a change in the stress-strain characteristics when T1>T2. Under thermo-mechanical fatigue conditions, σR and σC will be continuously changing in accordance with dependences (5) – (8).
3. Verification
Function ( )Tf ,ε ′ can be adopted in different forms, since it is a mathematical approximation of experimentally determined stress-strain characteristics in steady- state conditions, for fatigue in a range of a low cycle fatigue at constant temperatures. In the case of the first approximation, the following form has been proposed in the study for function
( )Tf ,ε ′ :
( ) )arctan()(, εε ′−=′ DCTATf n , (9)
where A, C, D and n are constants determined based on the studies, T is temperature in Kelvin degrees, ε’ is strain.
Constants A, C, D and n were determined, inter alia, for the steel T/P91. For this T/P91 steel the following values of constants has been used to describe stress-strain- temperature behaviour:
A=748 MPa, C= MPa, D = 400, n=3,6. 9
10168−
×,
Fig. 4b and 7 present curves illustrating the course of dependence of ( )εσ ′=′ f , which was experimentally determined for different temperatures. The modelling and experiment results are shown in Fig. 7. The curves in the Fig. 7 reflect the nature of changes, to which the stress values are subject, as a function of strain and temperature. Due to the simple form of function (9), the dependence can be easily used to analyze the course of the deformation process. Rεεε −=′ should be then substituted for the hysteresis loop branch at growing strain and Rεεε −=′ for the hysteresis loop branch at decreasing strain.
7

OMMI. 2008, Vol. 5., Issue 1, May ommi.co.uk
0
100
200
300
400
500
600
700
800
0 0,002 0,004 0,006 0,008
STRAIN -ε'
STR
ESS
- σ',
MPa
E - 773 K E - 923 K M - 773 K M - 923 K
Fig. 7. Curves illustrating the course of dependence ( )εσ ′=′ f , determined for different
temperatures. The grey points represent model, the white points were determined experimentally
Based on dependence (9), for which constants A, C, D and n have been determined; one can determine the hysteresis loops for different temperatures and ranges of strain in low-cycle fatigue conditions. It should be noted here that dependence (9) is only one of the possible representations of function f (ε',T). It also seems reasonable to seek its physical interpretation. At the present stage, the simplest possible form of function f(ε', T) has been adopted in an attempt to present the modelling procedure itself as well as to evaluate the ability of its application in practice.
The developed approach was then subject to validation, including a comparison of calculation results with the TMF test results. The first stage of the validation process consisted in the determination, based on the model approach, of deformation characteristics for different strain and temperature cycles. One of the cases investigated was a test with an abruptly changing temperature and a mechanical strain cycle conducted at a constant strain rate (Fig. 8).
-400
-300
-200
-100
-
100
200
300
400
500
-0,006 -0,004 -0,002 0 0,002 0,004 0,006
MECHANICAL STRAIN
STR
ESS,
MPa
-0,005
-0,004
-0,003
-0,002
-0,001
0
0,001
0,002
0,003
0,004
0,005
400 500 600 700 800 900
TEMPERATURE, K
ME
CH
AN
ICA
L S
TRA
IN
a) b)
Fig. 8. Courses of deformation characteristics in the form of a hysteresis loop – (a) for a case of an abrupt temperature change during one loading cycle - (b)
8
OMMI. 2008, Vol. 5., Issue 1, May ommi.co.uk
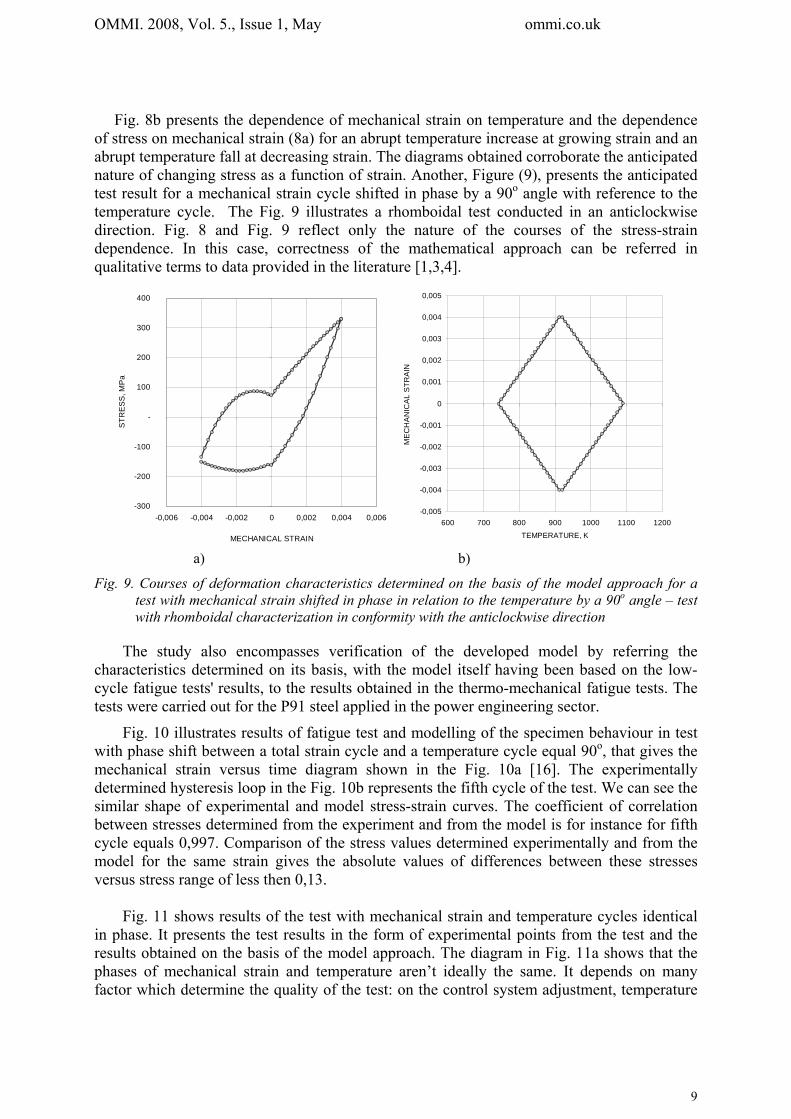
Fig. 8b presents the dependence of mechanical strain on temperature and the dependence of stress on mechanical strain (8a) for an abrupt temperature increase at growing strain and an abrupt temperature fall at decreasing strain. The diagrams obtained corroborate the anticipated nature of changing stress as a function of strain. Another, Figure (9), presents the anticipated test result for a mechanical strain cycle shifted in phase by a 90o angle with reference to the temperature cycle. The Fig. 9 illustrates a rhomboidal test conducted in an anticlockwise direction. Fig. 8 and Fig. 9 reflect only the nature of the courses of the stress-strain dependence. In this case, correctness of the mathematical approach can be referred in qualitative terms to data provided in the literature [1,3,4].
-300
-200
-100
-
100
200
300
400
-0,006 -0,004 -0,002 0 0,002 0,004 0,006
MECHANICAL STRAIN
STR
ES
S, M
Pa
-0,005
-0,004
-0,003
-0,002
-0,001
0
0,001
0,002
0,003
0,004
0,005
600 700 800 900 1000 1100 1200
TEMPERATURE, K
ME
CH
AN
ICA
L S
TRA
IN
a) b)
Fig. 9. Courses of deformation characteristics determined on the basis of the model approach for a test with mechanical strain shifted in phase in relation to the temperature by a 90o angle – test with rhomboidal characterization in conformity with the anticlockwise direction
The study also encompasses verification of the developed model by referring the
characteristics determined on its basis, with the model itself having been based on the low-cycle fatigue tests' results, to the results obtained in the thermo-mechanical fatigue tests. The tests were carried out for the P91 steel applied in the power engineering sector.
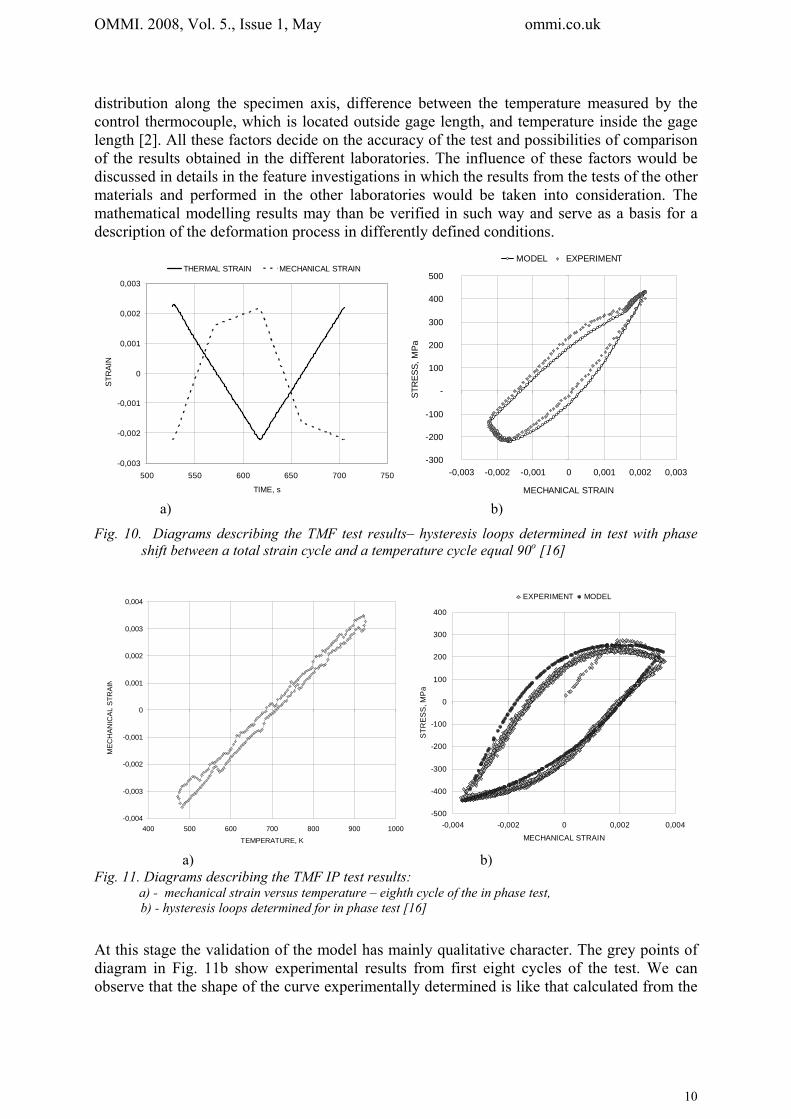
Fig. 10 illustrates results of fatigue test and modelling of the specimen behaviour in test with phase shift between a total strain cycle and a temperature cycle equal 90o, that gives the mechanical strain versus time diagram shown in the Fig. 10a [16]. The experimentally determined hysteresis loop in the Fig. 10b represents the fifth cycle of the test. We can see the similar shape of experimental and model stress-strain curves. The coefficient of correlation between stresses determined from the experiment and from the model is for instance for fifth cycle equals 0,997. Comparison of the stress values determined experimentally and from the model for the same strain gives the absolute values of differences between these stresses versus stress range of less then 0,13.
Fig. 11 shows results of the test with mechanical strain and temperature cycles identical
in phase. It presents the test results in the form of experimental points from the test and the results obtained on the basis of the model approach. The diagram in Fig. 11a shows that the phases of mechanical strain and temperature aren’t ideally the same. It depends on many factor which determine the quality of the test: on the control system adjustment, temperature
9
OMMI. 2008, Vol. 5., Issue 1, May ommi.co.uk
distribution along the specimen axis, difference between the temperature measured by the control thermocouple, which is located outside gage length, and temperature inside the gage length [2]. All these factors decide on the accuracy of the test and possibilities of comparison of the results obtained in the different laboratories. The influence of these factors would be discussed in details in the feature investigations in which the results from the tests of the other materials and performed in the other laboratories would be taken into consideration. The mathematical modelling results may than be verified in such way and serve as a basis for a description of the deformation process in differently defined conditions.
-0,003
-0,002
-0,001
0
0,001
0,002
0,003
500 550 600 650 700 750
TIME, s
STR
AIN
THERMAL STRAIN MECHANICAL STRAIN
-300
-200
-100
-
100
200
300
400
500
-0,003 -0,002 -0,001 0 0,001 0,002 0,003
MECHANICAL STRAIN
STR
ESS,
MPa
MODEL EXPERIMENT
a) b)
Fig. 10. Diagrams describing the TMF test results– hysteresis loops determined in test with phase shift between a total strain cycle and a temperature cycle equal 90o [16]
-0,004
-0,003
-0,002
-0,001
0
0,001
0,002
0,003
0,004
400 500 600 700 800 900 1000TEMPERATURE, K
MEC
HAN
ICAL
STR
AIN
-500
-400
-300
-200
-100
0
100
200
300
400
-0,004 -0,002 0 0,002 0,004
MECHANICAL STRAIN
STR
ES
S, M
Pa
EXPERIMENT MODEL
a) b) Fig. 11. Diagrams describing the TMF IP test results:
a) - mechanical strain versus temperature – eighth cycle of the in phase test, b) - hysteresis loops determined for in phase test [16]
At this stage the validation of the model has mainly qualitative character. The grey points of diagram in Fig. 11b show experimental results from first eight cycles of the test. We can observe that the shape of the curve experimentally determined is like that calculated from the
10

OMMI. 2008, Vol. 5., Issue 1, May ommi.co.uk
model. We can compare the values of stress for the same strain and observe that the absolute values of differences between the stresses for the curves shown in grey and black points versus stress range are less then 0,11. The similarity between the values of stress determined from experiments and modelling is worse for the hysteresis loops after bigger number of cycles. It depends inter alia on the constants in equation (9) which describes isothermal stress-strain curves. For these, which were used in the work, the model of isothermal stress-strain curves describes well the behaviour of the material at higher temperatures. The agreement between the experiments and the model isn’t as satisfactory for the lower levels of temperature. However the coefficient of correlation between the stress values from experiments and from the model is high and equals 0,996.
4. Conclusion
The presented approach to the cyclic deformation process is in the form of mathematical dependences describing the relations between stress, strain and temperature in an uniaxial state of stress. The approach was subjected to verification with reference to both the nature of the diagrams obtained based on the approach and with reference to a quantitative approach, by referring to the characteristics determined from mathematical models to the research results.
It has been found that the proposed model reflects the deformation process nature very well in variable temperature, strain and stress conditions. This statement refers to both the authors’ own research results and to literature data, which were taken into account when analyzing the courses of σ(ε, T) for different types of thermo-mechanical cycles. Therefore, a conclusion seems to be justified that the approach presented in the paper could constitute the right basis for appropriate constructive equations, which depict the material behaviour under thermo-mechanical conditions.
The dependences referred to in the paper are based on an assumption of cyclic stability of the material. Thus, the results obtained on their basis can be referred to the saturated state. For the investigated materials, the above assumption seems to be reasonable, since the period of a stabilized range of stress encompasses a prevailing part of their characteristics Δσ(N) (Fig. 2,3). The form of the mathematical dependences presented also ensures that the effects of cycling strengthening or weakening of a material can be allowed for in future research.
Constants of the mathematical model have been determined based on the results of low-cycle fatigue investigations at constant temperatures, by referring the obtained model to the research conducted at a variable temperature. Such procedure entails an implicit assumption that the saturated state, i.e. stabilization of the characteristics of Δσ(N), does not depend on the “path” we take to achieve such state. This assumption is fulfilled only in an approximation, with its correctness depending on the type of material.
Although the proposed approach reflects, the course of characteristics in both quantitative and qualitative terms, in a way satisfactory to engineering applications, the problems that remain unsolved are approximation of low-cycle test results by means of function f(ε', T) and physical interpretation of this function. With this respect, at the current stage, the presented approach constitutes a useful approximation which will be further developed so as to take account of a larger number of the phenomena that take place during cyclic elastic-plastic deformation.
11

OMMI. 2008, Vol. 5., Issue 1, May ommi.co.uk
5. References
[1] J. Bressers, L. Rémy (eds.) Fatigue under Thermal and Mechanical Loading, Kluwer Academic Publishers, Netherlands 1996.
[2] P. Hähner et al., Code-of-Practice for Thermo-Mechanical Fatigue Testing, Project funded by the EC under FP5 Growth Programme, GRD2-2000-30014, to be published in Int. J. Fatigue.
[3] H. Sehitoglu, Thermal and Thermo mechanical Fatigue of Structural Alloys, Fatigue and Fracture, Vol. 19, ASM Handbook, 527-556, 1996.
[4] H. Kuhn, D. Medlin, ASM Handbook, Mechanical Testing and Evaluation V 8, ASM International 2000.
[5] R. P. Skelton, Loop shape effects during thermo-mechanical fatigue of ferritic steels between 270oC and 570 oC. Proc CAMP 2002 – High Temperature Fatigue. Biallas G, Maier HJ, Hahn O, Hermann K, Vollersten F, editors (ISBN 3-00-009254-4). Paderborn: Bonifiatus GmbH Druck Buch Verlag, 2002, pp. 42-55.
[6] J. Okrajni, Low-cycle fatigue of creep resistant steels under mechanical and thermal loading, ZN Politechnika Śląska, Silesian University of Technology Publishing House, Hutnictwo z. 32/88, Gliwice 1988 (in Polish)
[7] J. Okrajni, K. Mutwil, M. Cieśla, Chemical pipelines material fatigue, Journal of Materials Processing Technology 164-165 (2005), ELSEVIER, 897-904.
[8] J. Okrajni, K. Mutwil, M. Cieśla, T. Skibiński, Durability of pipelines subjected to mechanical and thermal interactions, Energetic No. 7, 2003, 447-452 (in Polish).
[9] J. Okrajni, M. Plaza, Simulation of the fracture process of materials subjected to low-cycle fatigue of mechanical and thermach character, Journal of Material Processing Technology, vol.5, nr 1-2 (1995), ELSEVIER, Amsterdam, 309-318.
[10] Hernas, J. Dobrzański, Durability and fatigue of steam boiler and turbine parts., Gliwice, 2003 (in Polish).
[11] D. Renowicz, A. Hernas, M. Ciesla, K. Mutwil, Degradation of the cast steel parts working in power plant pipelines, Proceedings of the 15th Scientific International Conference “Achievements in Mechanical and Materials Engineering” AMME’2006, Gliwice-Wisła Vol. 18, Issue 1-2, 2006.
[12] G.A. Webster, R.A. Ainsworth, High Temperature Component Life Assessment, Chapman & Hall, London 1994.
[13] A.J. Fookes, D.J. Smith, Using a strain based failure assessment diagram for creep-brittle materials, in: Proceedings of the Second International HIDA Conference, Stuttgart 2000.
[14] D.W. Dean, R.A. Ainsworth, S.E. Booyh, Development and use of R5 procedures for the assessment of defects in high temperature plant, in: Proceedings of the Second International HIDA Conference, Stuttgart 2000.
[15] I.A. Shibli, Overview of HIDA Project in: Proceedings of the Second International HIDA Conference, Stuttgart 2000.
[16] Okrajni J., Marek A., Junak G.: Description of the deformation process under thermo-mechanical fatigue. Journal of Achievements in Materials and Manufacturing Engineering, vol. 21, issues 2, April 2007, pp. 15-23.
© The authors allow permission to the readers for use with the proviso that they clearly identify the source of the publication.
12