Thermal (TIR) Remote Sensing - International Institute of...
14
30-10-2012 1 Thermal (TIR) Remote Sensing 29 th Oct 2012 Emitted Energy • Optical remote sensing (visible and near-IR) – Examine abilities of objects to reflect solar radiation • Emissive remote sensing (mid-IR and microwave) – Examine abilities of objects to absorb shortwave visible and near-IR radiation and then to emit this energy at longer wavelengths Surface Properties • Albedo -- shortwave reflectance • Emissivity -- capability to emit longwave radiation (Wikipedia – Infrared) Infrared remote sensing, to measure … • Surface temperature, through the atmosphere • Atmospheric sounding – Temperature and humidity – Trace gas concentrations • Radiation balance • Emissivity 5 Thermal Infrared Spectrum Thermal IR Infrared (IR) waves: •Near IR:0.7 to 1.3 μm •Mid IR: 1.3 to 3 μm •Thermal IR: 3 to 14 μm
Transcript of Thermal (TIR) Remote Sensing - International Institute of...

30-10-2012
1
Thermal (TIR) Remote Sensing
29th Oct 2012
Emitted Energy
• Optical remote sensing (visible and near-IR)
– Examine abilities of objects to reflect solar
radiation
• Emissive remote sensing (mid-IR and
microwave)
– Examine abilities of objects to absorb shortwave
visible and near-IR radiation and then to emit this
energy at longer wavelengths
Surface Properties
• Albedo --
shortwave
reflectance
• Emissivity --
capability to emit
longwave radiation
(Wikipedia – Infrared)
Infrared remote sensing, to measure …
• Surface temperature, through the atmosphere
• Atmospheric sounding
– Temperature and humidity
– Trace gas concentrations
• Radiation balance
• Emissivity
5
Thermal Infrared Spectrum
Thermal IRInfrared (IR) waves:
•Near IR:0.7 to 1.3 μm
•Mid IR: 1.3 to 3 μm
•Thermal IR: 3 to 14 μm
30-10-2012
2
Thermal IR Remote Sensing
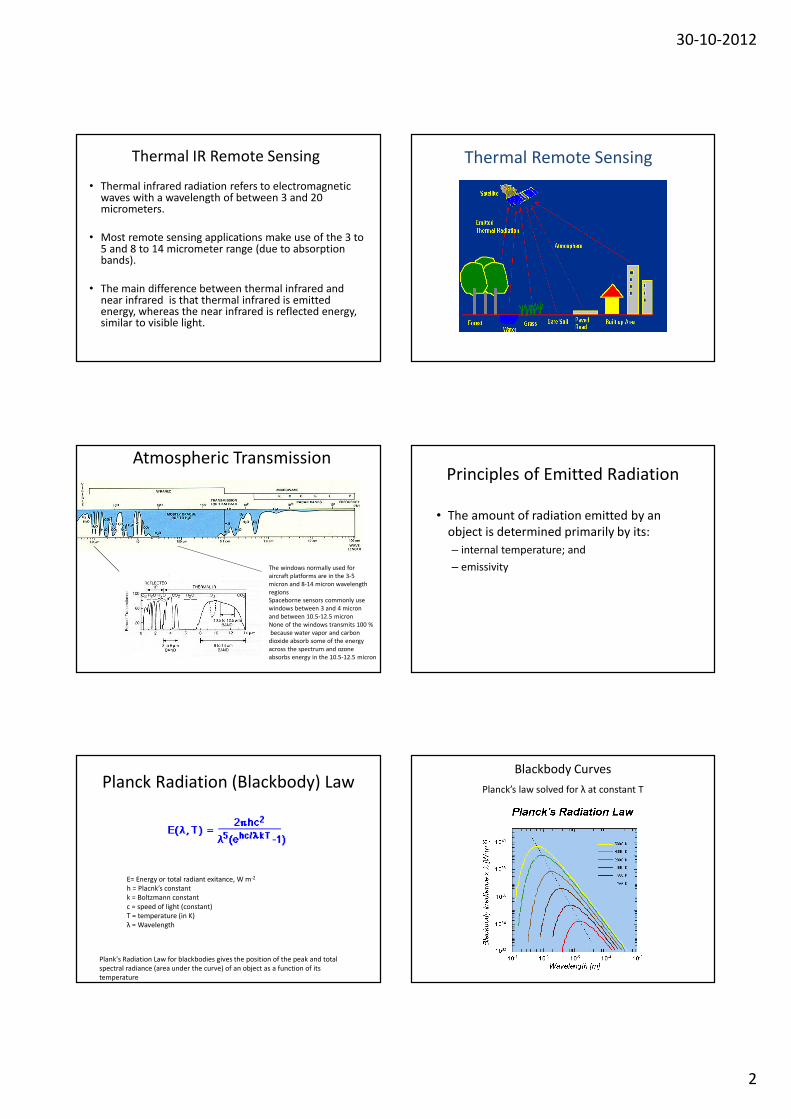
• Thermal infrared radiation refers to electromagnetic waves with a wavelength of between 3 and 20 micrometers.
• Most remote sensing applications make use of the 3 to 5 and 8 to 14 micrometer range (due to absorption bands).
• The main difference between thermal infrared and near infrared is that thermal infrared is emitted energy, whereas the near infrared is reflected energy, similar to visible light.
Thermal Remote Sensing
Atmospheric Transmission
The windows normally used for
aircraft platforms are in the 3-5
micron and 8-14 micron wavelength
regions
Spaceborne sensors commonly use
windows between 3 and 4 micron
and between 10.5-12.5 micron
None of the windows transmits 100 %
because water vapor and carbon
dioxide absorb some of the energy
across the spectrum and ozone
absorbs energy in the 10.5-12.5 micron
Principles of Emitted Radiation
• The amount of radiation emitted by an
object is determined primarily by its:
– internal temperature; and
– emissivity
Planck Radiation (Blackbody) Law
E= Energy or total radiant exitance, W m-2
h = Placnk’s constant
k = Boltzmann constant
c = speed of light (constant)
T = temperature (in K)
λ = Wavelength
Plank's Radiation Law for blackbodies gives the position of the peak and total
spectral radiance (area under the curve) of an object as a function of its
temperature
Blackbody Curves
Planck’s law solved for λ at constant T

30-10-2012
3
Developments from Planck’s LawWien’s Displacement Law
Notice that the peak of the
Blackbody curve shirts to shorter
wavelengths as
temperature increases
This peak represents the wavelength of
maximum emittance (λmax)
Wien’s Displacement Law
• As the temperature of an object increases, the total amount of radiant energy (area under the curve, in W/m2) increases and the wavelengths at which the objects emits the most energy decreases.
• To determine this peak wavelength (λmax) for a blackbody:
λmax = A/T
where A is a constant (2898 μm K) and T is the temperature in Kelvins.
• The 300 K Earth’s peak emmitance wavelength is: 2898 / 300 = 9.7 μm, in the thermal IR
• What wavelength is the Sun’s radiant energy peak (6000 K)?
Developments from Planck’s Law
Stefan-Boltzmann Law
The area under the Planck curve
represents the total energy emitted by
an object
at a given temperature
The Stefan-Boltzmann law
gives this energy for a blackbody
Developments from Planck’s Law
Stefan-Boltzmann Law
The Stefan-Boltzmann law is derived by integrating the
Planck function with respect to wavelength:
σ is called the Stefan-
Boltzmann constant.
σ = 5.667 x 10⁻⁸
Energy or the radiant flux (rate of flow of EM energy)
Stefan-Boltzmann Law: the amount of energy emitted from an object
is primarily a function of its temperature.
E = σT4
Interaction of Thermal Radiation with
Terrain Elements
E I = EA + ER + ET
E I
E I=EA
E I+ER
E I+ET
E I=1
α(λ) =EA
E I,ρ(λ) =
ER
E I,τ (λ) =
ET
E I
The energy radiated from an object usually is the result of energy
incident on the feature
The energy incident on
the surface of the terrain element
Absorptance of the terrain elementTransmittance of the terrain element
Reflectance of the terrain element
Interaction of Thermal Radiation with
Terrain Elements
Kirchhoff radiation law states that the spectral emissivity
of an object equals to its spectral absorbance
(Good absorbers are good emitters):
So:
Assuming opaque objects:
ε(λ) =α(λ)
ε(λ) + ρ(λ) + τ(λ) =1
ε(λ) + ρ(λ) =1
30-10-2012
4
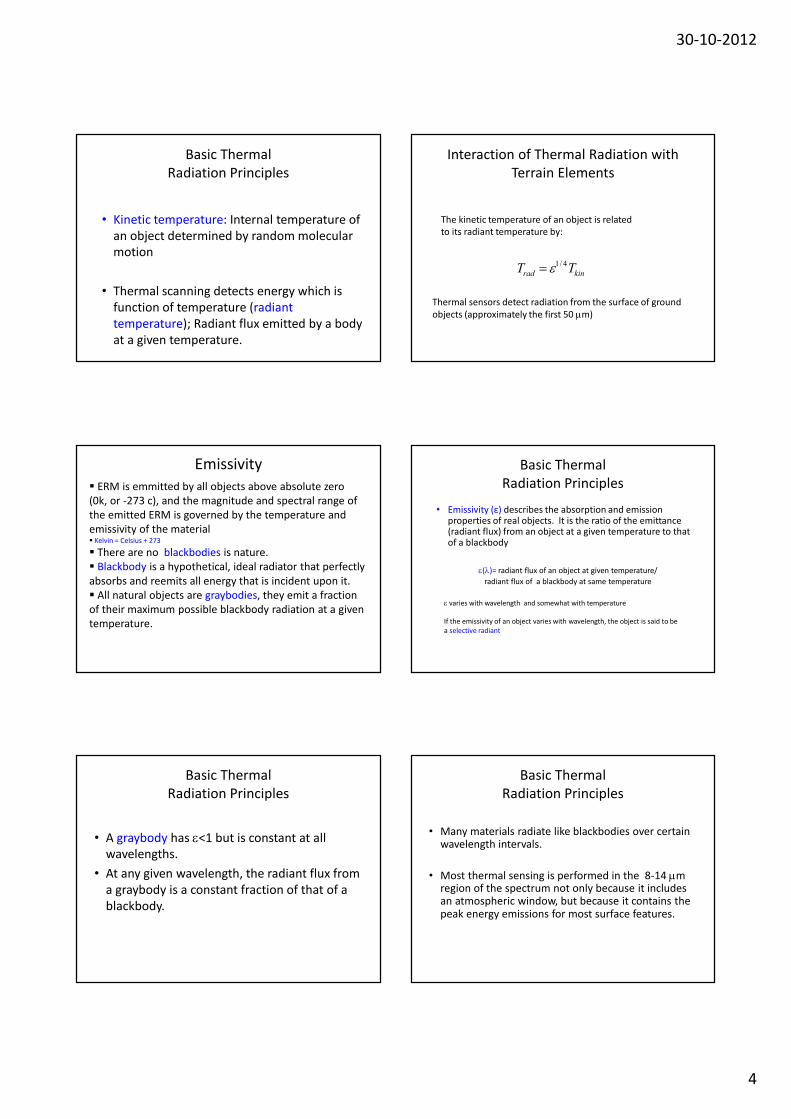
Basic Thermal
Radiation Principles
• Kinetic temperature: Internal temperature of
an object determined by random molecular
motion
• Thermal scanning detects energy which is
function of temperature (radiant
temperature); Radiant flux emitted by a body
at a given temperature.
Interaction of Thermal Radiation with
Terrain Elements
The kinetic temperature of an object is related
to its radiant temperature by:
Thermal sensors detect radiation from the surface of ground
objects (approximately the first 50 µm)
Trad = ε1/ 4Tkin
Emissivity
� ERM is emmitted by all objects above absolute zero
(0k, or -273 c), and the magnitude and spectral range of
the emitted ERM is governed by the temperature and
emissivity of the material� Kelvin = Celsius + 273
� There are no blackbodies is nature.
� Blackbody is a hypothetical, ideal radiator that perfectly
absorbs and reemits all energy that is incident upon it.
� All natural objects are graybodies, they emit a fraction
of their maximum possible blackbody radiation at a given
temperature.
Basic Thermal
Radiation Principles
• Emissivity (ε) describes the absorption and emission properties of real objects. It is the ratio of the emittance (radiant flux) from an object at a given temperature to that of a blackbody
ε(λ)= radiant flux of an object at given temperature/
radiant flux of a blackbody at same temperature
ε varies with wavelength and somewhat with temperature
If the emissivity of an object varies with wavelength, the object is said to be
a selective radiant
Basic Thermal
Radiation Principles
• A graybody has ε<1 but is constant at all
wavelengths.
• At any given wavelength, the radiant flux from
a graybody is a constant fraction of that of a
blackbody.
Basic Thermal
Radiation Principles
• Many materials radiate like blackbodies over certain wavelength intervals.
• Most thermal sensing is performed in the 8-14 µm region of the spectrum not only because it includes an atmospheric window, but because it contains the peak energy emissions for most surface features.

30-10-2012
5
Basic Thermal
Radiation Principles
• For any given material type, emissivity is often
considered constant in the 8-14 µm range
(graybodies)
BUT
• Values vary considerably with wavelength
• Value vary considerably with material condition
Blackbody/Graybody/Selective Radiator
Spectral emissivity of a
blackbody, a graybody,
and a hypothetical
selective radiator
Spectral radiant
exitance distribution of
the blackbody,
graybody, and
hypothetical selective
radiator
Emissivity vs. Wavelength Sand, Soil, Asphalt, Water

30-10-2012
6
Thermal Spectra of Minerals
•In an ideal situation, the
emissivity of an object -
especially if recorded over
several wavelength regions - may
be used to
uniquely identify that feature
Emissivity of Common Materials
Clear water 0.98-0.99
Wet snow 0.98-0.99
Human skin 0.97-0.99
Rough ice 0.97-0.98
Vegetation 0.96-0.99
Wet soil 0.95-0.98
Asphalt concrete 0.94-0.97
Brick 0.93-0.94
Wood 0.93-0.94
Basalt rock 0.92-0.96
Dry mineral soil 0.92-0.94
paint 0.90-0.96
Dry vegetation 0.88-0.94
Dry snow 0.85-0.90
Granite rock 0.83-0.87
Glass 0.77-0.81
Sheet iron (rusted) 0.63-0.70
Polished metals 0.16-0.21
Aluminum foil 0.03-0.07
Highly polished gold 0.02-0.03
The emissivity of an object may be influenced by a number factors, including:
• color -- darker colored objects are usually better absorbers and emitters (i.e. they
have a higher emissivity) than lighter colored objects which tend to reflect more of
the incident energy.
• surface roughness -- the greater the surface roughness of an object relative to the
size of the incident wavelength, the greater the surface area of the object and
potential for absorption and re-emission of energy.
• moisture content -- the more moisture an object contains, the greater its ability to
absorb energy and become a good emitter. Wet soil particles have a high emissivity
similar to water.
• compaction -- the degree of soil compaction can effect emissivity.
• field-of-view -- the emissivity of a single leaf measured with a very high
resolution thermal radiometer will have a different emissivity than an entire tree
crown viewed using a coarse spatial resolution radiometer.
• wavelength -- the emissivity of an object is generally considered to be
wavelength dependent. For example, while the emissivity of an object is often
considered to be constant throughout the 8 - 14 mm region, its emissivity in the 3 -5
mm region may be different.
Emissivity
44
Emissivity—objects are not
blackbodies
• Kirchhof’s Law: emissivity = absorptance
– Probability of emission of a photon at a given
frequency and angle is same as probability of
absorption at same frequency and angle
• Emissivity + Reflectance + Transmittance = 1
– (all functions of wavelength and angle)
45
Definition of brightness temperature
TB
( )( )
( )
( )
2 2
55
2 2
11
So 1
ln
Or ln 1
B
B
hc k T hc k T
B hc k T
hc k T
hc hc
ee
hcT
ek
hcT
k e
λλ λ
λ
λ
ε θλλ
ελ
ε
λ ε ε
=−−
= + −
=− +
46
Relationship between T and TB
-20
-18
-16
-14
-12
-10
-8
-6
-4
-2
0
0 2 4 6 8 10 12 14
wavelength, µm
TB-T
270, 0.9
270, 0.8
300, 0.9
300, 0.8

30-10-2012
7
47
“Split-window” methods—
atmospheric correction for surface
temperature measurement• Water-vapor absorption in 10-12 µm window is greater than in
3-5 µm window
– Greater difference between TB (3.8 µm) and TB (11 µm) implies
more water vapor
– Enables estimate of atmospheric contribution (and thereby
correction)
• Best developed for sea-surface temperatures
– Known emissivity
– Close coupling between atmospheric and surface temperatures
• Liquid water is opaque in thermal IR, hence instruments cannot
see through clouds
Sea-surface temperature, June 22,
2000
Thermal Properties of Materials
Thermal conductivity K (cal.cm-1 ּ◌sec-1 ּ◌oC-1) is a measure of the rate at which heat passes through
a material
• heat passes through metals much faster than through rocks
• Water has a higher K value than many other materials
• It takes a longer time for water to transfer heat over a given distance than many other materials
Thermal Properties of Materials
Thermal capacity C (cal/g-1oC-1) determines how well a material stores heat.
• Water has a high thermal capacity compared to other material types
• It takes more energy for water to warm up to the same temperature than many other materials do
• Rank of heat capacity
Water > forest > grass > land
• In other words, for a given amount of energy, water warms up slower than many other materials
Thermal Properties of Materials
• Thermal Inertia (P) -- Resistance of a material to
temperature change.
• It increases with an increase in material conductivity,
capacity, and density
• In general, materials with high thermal inertia have
more uniform surface temperatures throughout the
day and night than materials of low thermal inertia
Thermal Properties
Stainless steel shows the smallest temperature fluctuations during a
24-hr heating/cooling cycle
Sandy soil shows the largest temperature fluctuations
30-10-2012
8
Important Thermal IR Sensors
• TIROS (Television IR Operational Satellite), launched in 1960
• GOES (Geostationary Operational Environmental Satellite), TIR at 8 km spatial resolution, full-disk of Earth day and night
• HCMM (Heat Capacity Mapping Mission), launched in 1978- 600 m spatial resolution, 10.5 – 12.6 micron range
• CZCS (Coastal Zone Color Scanner) on Nimbus 7, launched in 1978, for SST
• AVHRR (Advanced Very High Resolution Radiometer), 1.1 and 4 km
• TIR bands TIMS (Thermal Infrared Multispectral Scanner), Airborne, 6 bands
• ATLAS (Airborne Terrestrial Applications Sensor)
• Landsat ETM+ Band 6- 10.4 – 12.5 micron range
• ASTER (Advanced Spaceborne Thermal Emmission and Reflection Radiometer) on Terra, 5 bands :8.125-11.65 micron range
54
Infrared spectral regions
attributes disadvantages
3.5–4.5 µµµµm (Mid IR)
Clearest atmospheric window and finest spatial resolution for measuring temper-ature.
Cloud cover. Less
energy than 8–12 µm. Mixed with solar radiation in daytime.
8–12 µµµµm (Thermal IR)
Atmospheric window. Peak of energy emitted from Earth. Most accurate temper-atures.
Cloud cover. Coarser spatial resolution than MWIR.
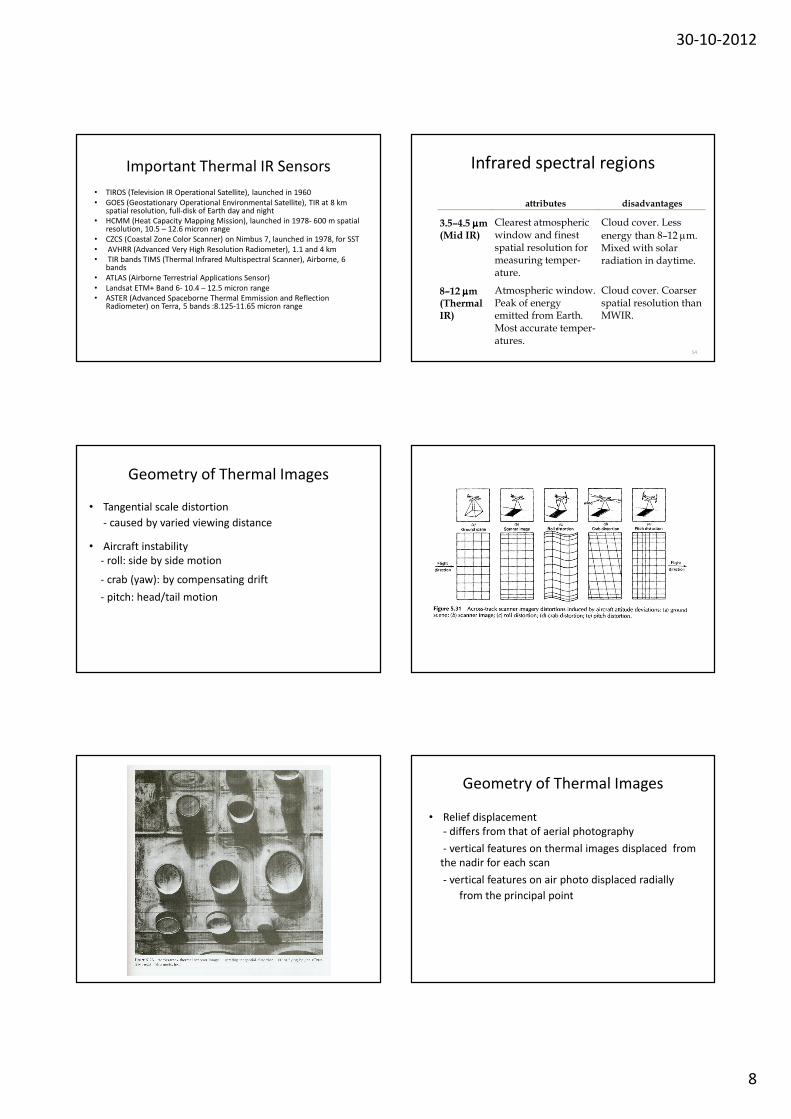
Geometry of Thermal Images
• Tangential scale distortion
- caused by varied viewing distance
• Aircraft instability
- roll: side by side motion
- crab (yaw): by compensating drift
- pitch: head/tail motion
Geometry of Thermal Images
• Relief displacement
- differs from that of aerial photography
- vertical features on thermal images displaced from
the nadir for each scan
- vertical features on air photo displaced radially
from the principal point

30-10-2012
9
Interpreting Thermal Scanner Imagery
• Application in:
– Determining rock types, structure
soil types, soil moisture
– Locating water springs
forest fires, subsurface fires
• Qualitative information collection:
relative differences in radiant temperatures
Interpreting Thermal Scanner Imagery
• Landscape factors - surface material: land vs. water
- topography: sunlit vs. shadowed
- vegetation cover: land, grass, forest, water
- moisture
• Quantitative data analysis
e.g. water temperatures
• Times of day (diurnal temperature variations)– Thermal images will vary in appearance depending on whether they are
acquired during the warm part of the day or after a night of absence of the sun and resultant cooling of the atmosphere as well as heat loss from the surface and shallow depths beneath
• Temperature extremes, heating & cooling rates
Interpreting Thermal Scanner Imagery
• Direct sunlight heats objects according to their thermal characteristics and sunlight absorption
• Predawn imagery: stable temperatures
• Darker tones: cooler temperatures
• BUT, Limitations
– thermal images contain noise and errors
– differences in emitted energy is not directly related to differences in temperature, must know emissivity of each material
– sensors only record the radiance at the surface
Changes in radiant temperatures of five surface-cover types
during a 24-hour thermal cycle
Day versus Night Image
Day Night
Day image: Contrasts between heated buildings and streets and areas in shadow create
a scene that resembles an aerial photo
Night image: Many streets are evident because, being asphalt paved, they absorp more
heat and remain warmer through the night

30-10-2012
10
Pre-dawn Thermal Infrared Image of Effluent Entering the Savannah River Swamp
System
March 31, 1981
4:28 am; 3 x 3 m
2x reduction
Savannah
River
Great Lakes -- Night
The land appears cool (darker tones) with little detail
TM band 6 on Landsat
Multispectral Thermal Spectroscopy
30-10-2012
11
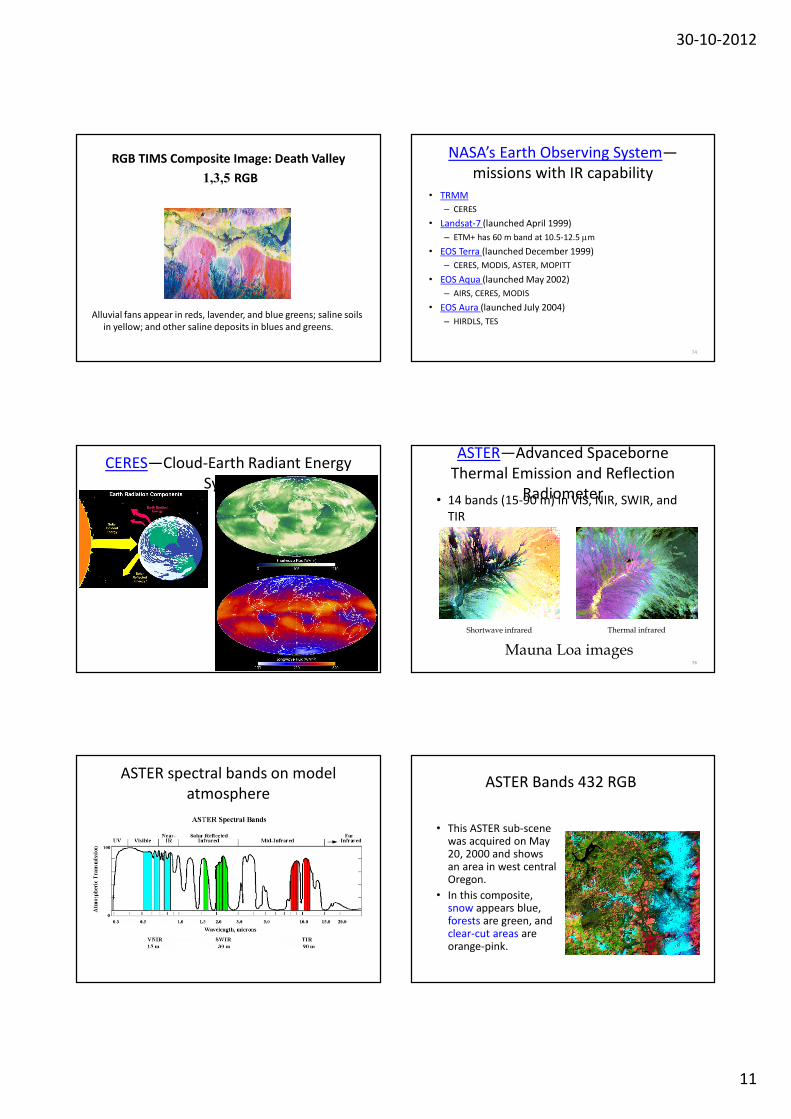
RGB TIMS Composite Image: Death Valley
1,3,5 RGB
Alluvial fans appear in reds, lavender, and blue greens; saline soils
in yellow; and other saline deposits in blues and greens.
74
NASA’s Earth Observing System—
missions with IR capability
• TRMM
– CERES
• Landsat-7 (launched April 1999)
– ETM+ has 60 m band at 10.5-12.5 µm
• EOS Terra (launched December 1999)
– CERES, MODIS, ASTER, MOPITT
• EOS Aqua (launched May 2002)
– AIRS, CERES, MODIS
• EOS Aura (launched July 2004)
– HIRDLS, TES
CERES—Cloud-Earth Radiant Energy
System
76
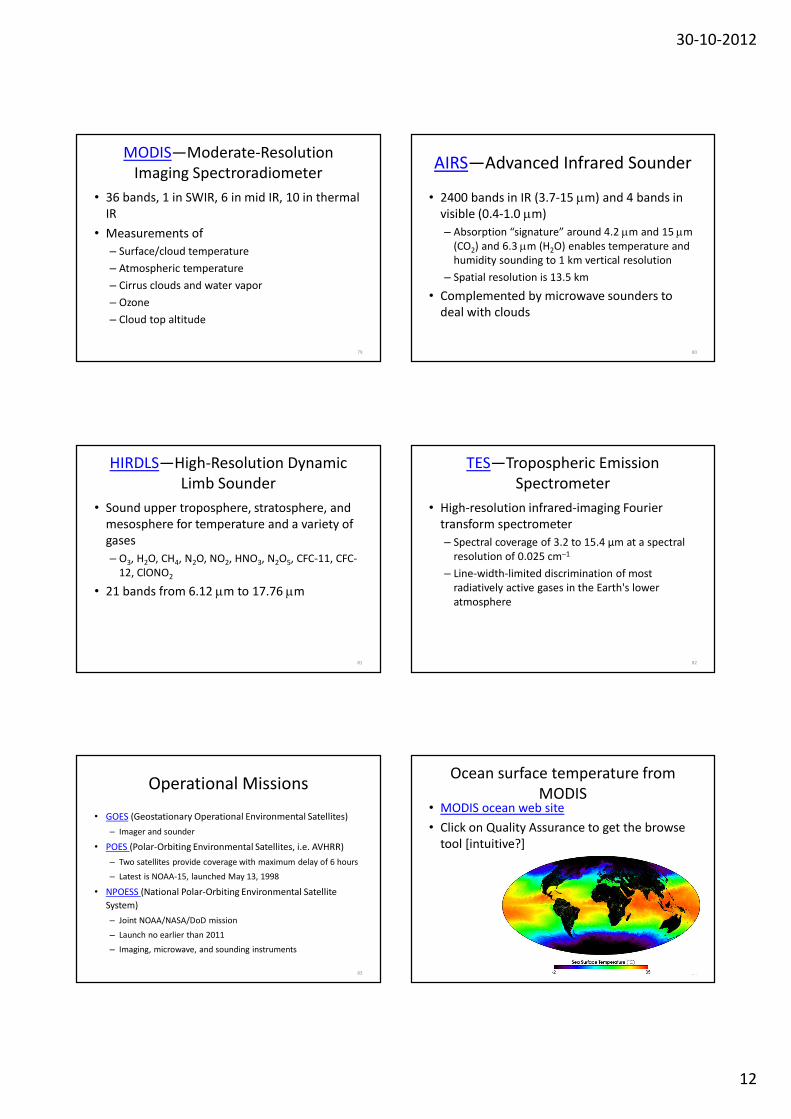
ASTER—Advanced Spaceborne
Thermal Emission and Reflection
Radiometer• 14 bands (15-90 m) in VIS, NIR, SWIR, and
TIR
Mauna Loa images
Shortwave infrared Thermal infrared
ASTER spectral bands on model
atmosphereASTER Bands 432 RGB
• This ASTER sub-scene was acquired on May 20, 2000 and shows an area in west central Oregon.
• In this composite, snow appears blue, forests are green, and clear-cut areas are orange-pink.
30-10-2012
12
79
MODIS—Moderate-Resolution
Imaging Spectroradiometer
• 36 bands, 1 in SWIR, 6 in mid IR, 10 in thermal
IR
• Measurements of
– Surface/cloud temperature
– Atmospheric temperature
– Cirrus clouds and water vapor
– Ozone
– Cloud top altitude
80
AIRS—Advanced Infrared Sounder
• 2400 bands in IR (3.7-15 µm) and 4 bands in
visible (0.4-1.0 µm)
– Absorption “signature” around 4.2 µm and 15 µm
(CO2) and 6.3 µm (H2O) enables temperature and
humidity sounding to 1 km vertical resolution
– Spatial resolution is 13.5 km
• Complemented by microwave sounders to
deal with clouds
81
HIRDLS—High-Resolution Dynamic
Limb Sounder
• Sound upper troposphere, stratosphere, and
mesosphere for temperature and a variety of
gases
– O3, H2O, CH4, N2O, NO2, HNO3, N2O5, CFC-11, CFC-
12, ClONO2
• 21 bands from 6.12 µm to 17.76 µm
82
TES—Tropospheric Emission
Spectrometer
• High-resolution infrared-imaging Fourier
transform spectrometer
– Spectral coverage of 3.2 to 15.4 µm at a spectral
resolution of 0.025 cm–1
– Line-width-limited discrimination of most
radiatively active gases in the Earth's lower
atmosphere
83
Operational Missions
• GOES (Geostationary Operational Environmental Satellites)
– Imager and sounder
• POES (Polar-Orbiting Environmental Satellites, i.e. AVHRR)
– Two satellites provide coverage with maximum delay of 6 hours
– Latest is NOAA-15, launched May 13, 1998
• NPOESS (National Polar-Orbiting Environmental Satellite
System)
– Joint NOAA/NASA/DoD mission
– Launch no earlier than 2011
– Imaging, microwave, and sounding instruments
84
Ocean surface temperature from
MODIS• MODIS ocean web site
• Click on Quality Assurance to get the browse
tool [intuitive?]

30-10-2012
13
85
Land surface temperature from MODIS
• Go to the MODIS Land Global Browse page
• Select the MOD11/MYD11 checkbox (Surface
Temperature)
• Enter date range
• Select satellite (Terra and/or Aqua)
• Select Collection (5 is most recent)
86
Active fire
detection
• MODIS
Fire and
Thermal
Anomaly
website
87
How does all this work?
• As noted in previous lecture, a great feature of
NASA’s EOS program is that the algorithms are
peer-reviewed and published in algorithm
theoretical basis documents
• Each instrument has a page with links to these
ATBDs, e.g. for MODIS, one can go to Zhengming
Wan’s ATBD for land surface temperature
– The algorithm uses MODIS bands 31 (10.78-11.28µm)
and 32 (11.77-12.27µm)
88
Dr. Wan’s equation is
31 321 2 3 2
31 321 2 3 2
31 32
31 3231 32
1
2
1
2
where
, brightness temperatures in bands 31,32
= and 2
, , coefficients given by multidimensional lookup
s
T TT C A A A
T TB B B
T T
A B C
ε εε ε
ε εε ε
ε εε ε ε ε
+− ∆ = + + +
−− ∆ + + +
+∆ = −
tables
(they depend on angle)
89
Spectral emissivity library
90
Fire detection
• Planck
equation is a
steeper
function of T
at shorter
wavelengths
1.0E-05
1.0E-04
1.0E-03
1.0E-02
1.0E-01
0 250 500 750 1000 1250 1500
Temperature, K
Planck radiance, W m
–2µµ µµm–1sr–1
3.75µ
11.03µ

30-10-2012
14
91
Consider a pixel with a small fire
( ) (1 ) ( )
fraction of pixel on fire
fire temperature
background temperature
Planck radiance in band
sensor radiance in band
j j f j b
f
b
j
j
L fB T f B T
f
T
T
B j
L j
= + −
92
Can solve for f, Tf, if Tb is known
1.0E-06
1.0E-05
1.0E-04
1.0E-03
1.0E-02
0 0.025 0.05 0.075 0.1
fire fraction
radiance
750,3.8
750,11
1000,3.8
1000,11
1250,3.8
1250,11