Thermal infrared imaging of crop canopies for the …plantstress.com/methods/IR Imaging...
12
Thermal infrared imaging of crop canopies for the remote diagnosis and quantification of plant responses to water stress in the field Hamlyn G. Jones A,G , Rachid Serraj B , Brian R. Loveys C , Lizhong Xiong D , Ashley Wheaton E and Adam H. Price F A Division of Plant Sciences, University of Dundee at SCRI, Invergowrie, Dundee DD2 5DA, Scotland. B International Rice Research Institute, DAPO Box 7777, Metro Manila, Philippines. C CSIRO Plant Industry, PO Box 350, Glen Osmond, SA 5064, Australia. D National Key Laboratory of Crop Genetic Improvement, Huazhong Agricultural University, Wuhan 430070, China. E Melbourne School of Land and Environment, Dookie Campus, The University of Melbourne, Dookie College, Vic. 3647, Australia. F Institute of Biological and Environmental Sciences, University of Aberdeen, Aberdeen AB24 3UU, UK. G Corresponding author. Email: [email protected] This paper originates from a presentation at the 1st International Plant Phenomics Symposium, Canberra, Australia, April 2009. Abstract. Thermal imaging using infrared (IR) is now an established technology for the study of stomatal responses and for phenotyping plants for differences in stomatal behaviour. This paper outlines the potential applications of IR sensing in drought phenotyping, with particular emphasis on a description of the problems with extrapolation of the technique from the study of single leaves in controlled environments to the study of plant canopies is field plots, with examples taken from studies on grapevine (Vitis vinifera L.) and rice (Oryza sativa L.). Particular problems include the sensitivity of leaf temperature (and potentially the temperature of reference surfaces) to both temporal and spatial variation in absorbed radiation, with leaf temperature varying by as much as 15 C between full sun and deep shade. Examples of application of the approach to phenotyping in the field and the steps in data analysis are outlined, demonstrating that clear genotypic variation may be detected despite substantial variation in soil moisture status or incident radiation by the use of appropriate normalisation techniques. Additional keywords: BRDF, drought, grapevine, IR thermography, Oryza sativa, phenotyping, rice, stress diagnosis, stress sensing, Vitis vinifera. Introduction: thermal sensing principles Leaf temperature measurement using thermal infrared (IR) sensing is primarily used to study plant water relations, and specifically stomatal conductance, because a major determinant of leaf temperature is the rate of evaporation or transpiration from the leaf. The cooling effect of transpiration arises because a substantial amount of energy (the latent heat of vaporisation, l; J mol –1 ) is required to convert each mole of liquid water to water vapour, and this energy is then taken away from the leaf in the evaporating water and, thus, cools it. In rare cases leaf temperature may be affected by other physiological processes: for example, the heat generated (the exotherm) as water in a leaf freezes can be readily imaged (e.g. Wisniewski et al. 1997), and in extreme cases of particularly high respiratory rates (e.g. as found in the Arum spadix) raised temperatures can be used as a measure of these increasedrespirationrates(Seymour1999).Inmostcases,however, the heat generated by respiration is too small to have a detectable effect on leaf temperature (Breidenbach et al. 1997). Thermal imaging is, therefore, particularly well suited for screening plants for differences in stomatal conductance, especially under laboratory conditions (e.g. Raskin and Ladyman 1988; Merlot et al. 2002) where the environmental conditions can be closely controlled. These and other uses of thermal imaging in plant science have been reviewed by Jones (2004). Because leaf temperature is dependent on environmental factors such as air temperature, humidity, wind speed and incident radiation, as well as stomatal aperture, many attempts have been made to normalise the data to account for environmental variation. The first normalisation for environmental variation was in terms of air temperature (T a ), achieved by accumulating CSIRO PUBLISHING www.publish.csiro.au/journals/fpb Functional Plant Biology, 2009, 36, 978–989 Ó CSIRO 2009 10.1071/FP09123 1445-4408/09/110978
Transcript of Thermal infrared imaging of crop canopies for the …plantstress.com/methods/IR Imaging...
Thermal infrared imaging of crop canopies for the remotediagnosis and quantification of plant responses to waterstress in the field
Hamlyn G. JonesA,G, Rachid SerrajB, Brian R. LoveysC, Lizhong XiongD,Ashley Wheaton E and Adam H. PriceF
ADivision of Plant Sciences, University of Dundee at SCRI, Invergowrie, Dundee DD2 5DA, Scotland.BInternational Rice Research Institute, DAPO Box 7777, Metro Manila, Philippines.CCSIRO Plant Industry, PO Box 350, Glen Osmond, SA 5064, Australia.DNational Key Laboratory of Crop Genetic Improvement, Huazhong Agricultural University,Wuhan 430070, China.
EMelbourne School of Land and Environment, Dookie Campus, The University of Melbourne,Dookie College, Vic. 3647, Australia.FInstitute of Biological and Environmental Sciences, University of Aberdeen, Aberdeen AB24 3UU, UK.GCorresponding author. Email: [email protected]
This paper originates from a presentation at the 1st International Plant Phenomics Symposium,Canberra, Australia, April 2009.
Abstract. Thermal imaging using infrared (IR) is now an established technology for the study of stomatal responses andfor phenotyping plants for differences in stomatal behaviour. This paper outlines the potential applications of IR sensingin drought phenotyping, with particular emphasis on a description of the problems with extrapolation of the technique fromthe study of single leaves in controlled environments to the study of plant canopies is field plots, with examples taken fromstudies on grapevine (Vitis vinifera L.) and rice (Oryza sativa L.). Particular problems include the sensitivity of leaftemperature (and potentially the temperature of reference surfaces) to both temporal and spatial variation in absorbedradiation, with leaf temperature varying by as much as 15�C between full sun and deep shade. Examples of application ofthe approach to phenotyping in the field and the steps in data analysis are outlined, demonstrating that clear genotypicvariation may be detected despite substantial variation in soil moisture status or incident radiation by the use of appropriatenormalisation techniques.
Additional keywords: BRDF, drought, grapevine, IR thermography, Oryza sativa, phenotyping, rice, stress diagnosis,stress sensing, Vitis vinifera.
Introduction: thermal sensing principles
Leaf temperature measurement using thermal infrared (IR)sensing is primarily used to study plant water relations, andspecifically stomatal conductance, because a major determinantof leaf temperature is the rate of evaporation or transpiration fromthe leaf. The cooling effect of transpiration arises because asubstantial amount of energy (the latent heat of vaporisation, l;Jmol–1) is required to convert each mole of liquid water to watervapour, and this energy is then taken away from the leaf in theevaporating water and, thus, cools it. In rare cases leaf temperaturemay be affected by other physiological processes: for example,the heat generated (the exotherm) as water in a leaf freezes can bereadily imaged (e.g.Wisniewski et al. 1997), and in extreme casesof particularly high respiratory rates (e.g. as found in the Arumspadix) raised temperatures can be used as a measure of these
increasedrespirationrates(Seymour1999).Inmostcases,however,the heat generated by respiration is too small to have a detectableeffect on leaf temperature (Breidenbach et al. 1997).
Thermal imaging is, therefore, particularly well suited forscreening plants for differences in stomatal conductance,especially under laboratory conditions (e.g. Raskin andLadyman 1988; Merlot et al. 2002) where the environmentalconditions can be closely controlled. These and other uses ofthermal imaging in plant science have been reviewed by Jones(2004). Because leaf temperature is dependent on environmentalfactors such as air temperature, humidity,wind speed and incidentradiation, as well as stomatal aperture, many attempts havebeen made to normalise the data to account for environmentalvariation. Thefirst normalisation for environmental variationwasin terms of air temperature (Ta), achieved by accumulating
CSIRO PUBLISHING
www.publish.csiro.au/journals/fpb Functional Plant Biology, 2009, 36, 978–989
� CSIRO 2009 10.1071/FP09123 1445-4408/09/110978
differences between leaf temperature (Tleaf) and Ta as a measureof plant stress (Jackson et al. 1977). Further normalisation wasachieved by Idso et al. (1981) who developed the ‘crop waterstress index’ (CWSI), which relates the observed temperature tothe temperature of non-stressed and non-transpiring crops underthe same environmental conditions; by noting the ambienthumidity at the same time, effects of humidity variation couldalso be corrected. Rather than using actual empirical croptemperatures as references for calculation of CWSI, Jones andothers have developed the approach of using physical wet anddry reference surfaces for application to field screening (Jones1999a, 1999b, 2002; Cohen et al. 2005). A particularly helpfulfeature of the use of wet and dry reference temperatures is thatthey can readily be used for the derivation of indices that donot require detailed environmental information. A useful indexfor screening purposes, and in other cases where absoluteestimates of stomatal conductance may not be required, is theindex of stomatal conductance (Ig) introduced by Jones (1999a),where the index is proportional to stomatal conductance (for aconstant boundary layer conductance) and is calculated as.
Ig ¼ ðTdry � T leaf Þ=ðT leaf � TwetÞ; ð1Þwhere Twet is the temperature of a wet surface and Tdry is thetemperature of a non-transpiring surface. This can be converted toa stomatal conductance (gl) using
gl ¼ Ig=ðraW þ ðs=gÞrHRÞ; ð2Þwhere raW is the boundary layer resistance to water vapour(sm–1), and rHR is the parallel resistance to heat and radiationtransfer by the leaf (see Jones 1992).
Theoretical analysis has shown that this approach may beextendedbeyond the calculation of a stress index to the estimationof an actual stomatal conductance (Leinonen et al. 2006), and thatas good resultsmaybeobtainedusing onlydry reference surfaces,or even, where full environmental measurements are available,calculation of the theoretical wet and dry reference temperatures.From an analysis of the full leaf energy balance, Leinonen et al.(2006) and Guilioni et al. (2008) showed that stomatal resistance(rs; the reciprocal of the conductance) may be estimated, withoutthe use of reference surfaces, from
rs ¼ �rcprHRðsðT leaf � T airÞ þ DÞ=ðgððT leaf � T airÞrcp � rHRRniÞÞ � raW;
ð3Þ
whereRni thenet isothermal radiation (the net radiation thatwouldbe absorbed by a leaf if it were at air temperature, Wm–2), r thedensity of air (kgm–3), cp the specific heat capacity of air(J kg–1 K–1), s the slope of the curve relating saturating watervapour pressure to temperature (Pa �C–1), g the psychrometricconstant (PaK–1) and D the air vapour pressure deficit (Pa).Where any of these key variables are unavailable, referencesurfaces may substitute, with suitable rearrangement of theequations (Leinonen et al. 2006).
Thermal imaging appears to have potential advantages overthe use of conventional porometry or gas-exchangemeasurementwhen screening for stomatal responses in phenotyping studies.This is because the ability to include large areas of crop, or largenumbers of individual plants or plots, in single imagesmeans that
comparisons can readily be made, even in rapidly changingenvironments that are common outdoors. In such cases itis not generally necessary to have fully calibrated absolutedata, as one is usually interested in the relative differencesin phenotypic responses of the different genotypes. Analternative approach to the collection of thermal data for largeareas of crop in the field, and one that has potential value forirrigation monitoring and control applications and that may evenbe of use for phenotyping is the use of a mobile IR thermometer(Loveys et al. 2008). In this paper we evaluate the potential andproblems of scaling up thermal remote sensing to the field.
Materials and methods
In all the studies discussed here, thermal images were obtainedusing a Thermacam P25 (FLIR Systems, Danderyd, Sweden),long-wave thermal imager with a sensitivity of 0.08�C andaccuracy of �2�C. Parallel visible images were obtained witheither the onboard digital imager or a normal digital camera.For phenotyping purposes, images can be obtained over a rangeof distances from the canopy of interest. In some studies thecamera may be held within a couple of metres of the canopy,but for most phenotyping applications, and for manyagronomic applications, it is necessary to view a larger area ofcanopy so that substantial numbers of genotypes can be comparedsimultaneously. As shown later, this minimises problems causedby any rapid changes in solar irradiance. Several options areavailable to expand the area of view; these include mountingthe camera on mobile platforms such as a ‘cherry picker’(Möller et al. 2007) or other mobile platforms. The camera canalso be elevated on a hand-held pole to ~5m above the ground,which, when combined with an oblique view, allows viewing ofa useful area of crop. For example, for a camera with a field ofview of 22�, this will allow viewing of an area of ~15m2 at 20m;wide angle lenses allow a larger field of view. Wider fields ofview may also be obtained by mounting the camera on a balloonor in an aircraft. Of course, as cameras have a limited numberof pixels (usually 240� 320 for the P25 or 480� 640) greaterviewing distances comewith less spatial resolution on the ground(larger pixels).
Where absolute estimates of stomatal conductance or of a‘stress index’ are required, it is usually necessary to have somewet and dry or dry reference surfaces in the image to allow forchanges in environmental conditions (Jones 1999a; Meron et al.2003; Leinonen et al. 2006), though in stable and consistentclimates such as in Arizona, the normalisation of canopytemperature to air temperature and the use of standard cropresponses may be adequate (Idso 1982). For crop phenotyping,however, the usual requirement is the comparison of genotypes,with absolute values of stomatal conductance or stress indexbeing of less interest. In such cases, inclusion of a substantialnumber of genotypes in each image (or the use of repeatedreference varieties) allows effective internal normalisation ofthe data to correct for changes in incident light or localvariation in soil. Unfortunately, in order to include thenecessary large numbers of genotypes in any image it isnecessary to view the canopy from substantial distances.Where this is not possible, the use of references (or preciseenvironmental measurement) becomes essential to allow
Remote sensing of plant responses to water deficit Functional Plant Biology 979
correction for any rapid changes in environmental conditions. Insuch cases it is critical that the thermal time response of thereference surfaces matches that of the canopy. Optimisation ofreferences will be discussed further in succeeding sections.
Difficulties of scaling up to the field: radiation variation
Of particular interest for the application of thermal imaging tophenotyping and irrigation studies is the sensitivity of Tleaf (or ofIg and other indices) to changes in stomatal conductance as afunction of the expected variation due to environmental variables.Here, the thermal approach will be of little value where theenvironmentally caused variation in temperature is greater thanthe ‘sensitivity’, that is the range in temperature caused by aspecified variation in conductance (Jones 1994).Nevertheless, byviewing an ensemble of leaves in a canopy, it may be possibleto obtain a more robust estimate of the mean temperature(Jones et al. 2002). Below we will consider some of thepossible errors, and some possible solutions. Simple analysesof the potential sensitivity of thermal sensing for the estimationof stomatal conductance have been provided by Jones (1994,1999a, 1999b) and Jones et al. (1997); these concluded that thesensitivity increases with temperature, vapour pressure deficit,radiation and generally decreases with increasing wind speed.
Several the problems involved in applying thermal sensingto field crops have been analysed (Jones et al. 2002), including(i) how one deals with the problem of variation in temperature ofboth references and crop leaves caused by varying incidentradiation, (ii) the choice of reference surface – these mayinclude leaves (Jones et al. 2002), models (Jones 1999a;Cohen et al. 2005; Loveys et al. 2008), or whole canopies(Grant et al. 2007), and (iii) the need to ensure that the datacollected are for crop leaves alone and are not biased by inclusionof woody parts or the background soil (Guiliani and Flore 2000;Leinonen and Jones 2004).
Leaf temperature variation as functionof absorbed radiation
A critical variable in Eqn 3 is the net radiation absorbed bythe leaf or canopy. This is because the leaf temperatureincreases linearly as absorbed radiant energy increases (otherfactors being constant). Several studies have demonstrated thatthe range of leaf temperatures for individual leaves in ahomogeneous grapevine canopy may easily vary by 10–15Kwhen comparing leaves directly illuminated normal to the solarbeam and those in shaded parts of the canopy (Jones et al. 2002;Leinonen and Jones 2004; Grant et al. 2007). Data collected ondifferent occasions on a grapevineVitis vinifera (L.) cv. CabernetSauvignon vineyard atWaikerie using amoving narrow-beam IRradiometer mounted on a quad-bike (according to the methodsdescribed by Loveys et al. 2008) gave the mean temperatureranges for any plot when viewed from the sunny side of the rowon sunny days (3 January 2008 and 9 January 2008) of5.3� 1.03K. This range is presumably smaller than theextreme values found by thermography because the field ofview of the IR thermometer used included several leaves at therange used (~1.5m).
For direct solar radiation, the radiation absorbed by a surfacewill increase proportionately to the solar absorption coefficient
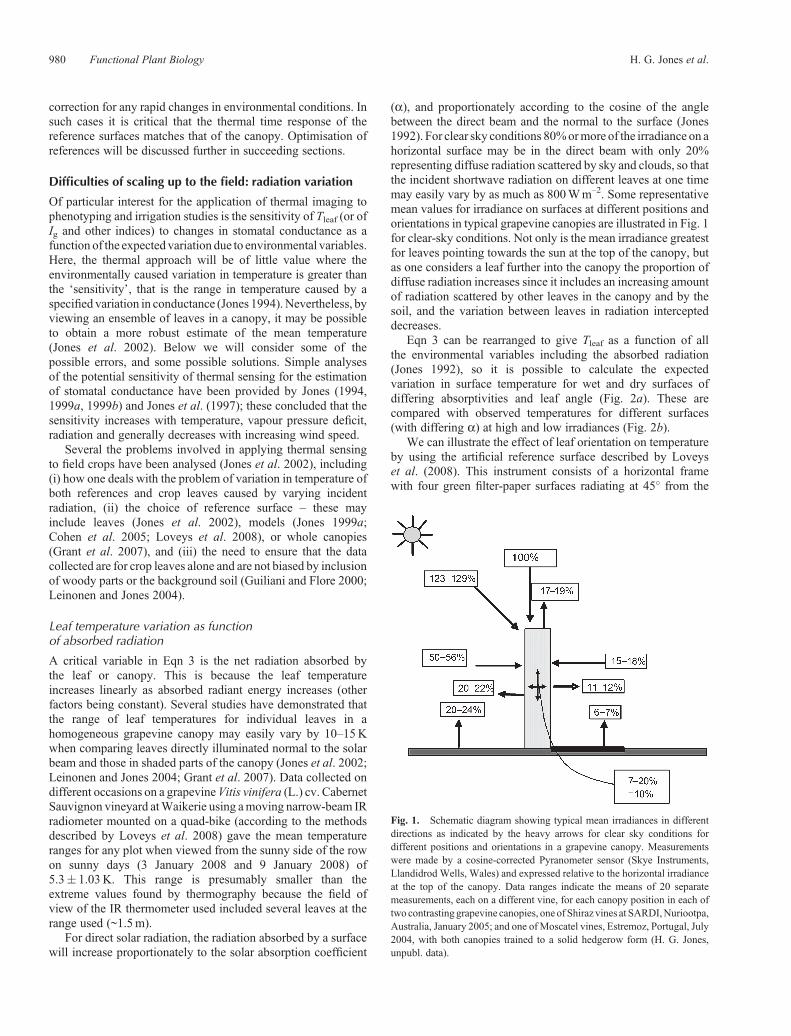
(a), and proportionately according to the cosine of the anglebetween the direct beam and the normal to the surface (Jones1992). For clear sky conditions 80%ormore of the irradiance on ahorizontal surface may be in the direct beam with only 20%representing diffuse radiation scattered by sky and clouds, so thatthe incident shortwave radiation on different leaves at one timemay easily vary by as much as 800Wm–2. Some representativemean values for irradiance on surfaces at different positions andorientations in typical grapevine canopies are illustrated in Fig. 1for clear-sky conditions. Not only is the mean irradiance greatestfor leaves pointing towards the sun at the top of the canopy, butas one considers a leaf further into the canopy the proportion ofdiffuse radiation increases since it includes an increasing amountof radiation scattered by other leaves in the canopy and by thesoil, and the variation between leaves in radiation intercepteddecreases.
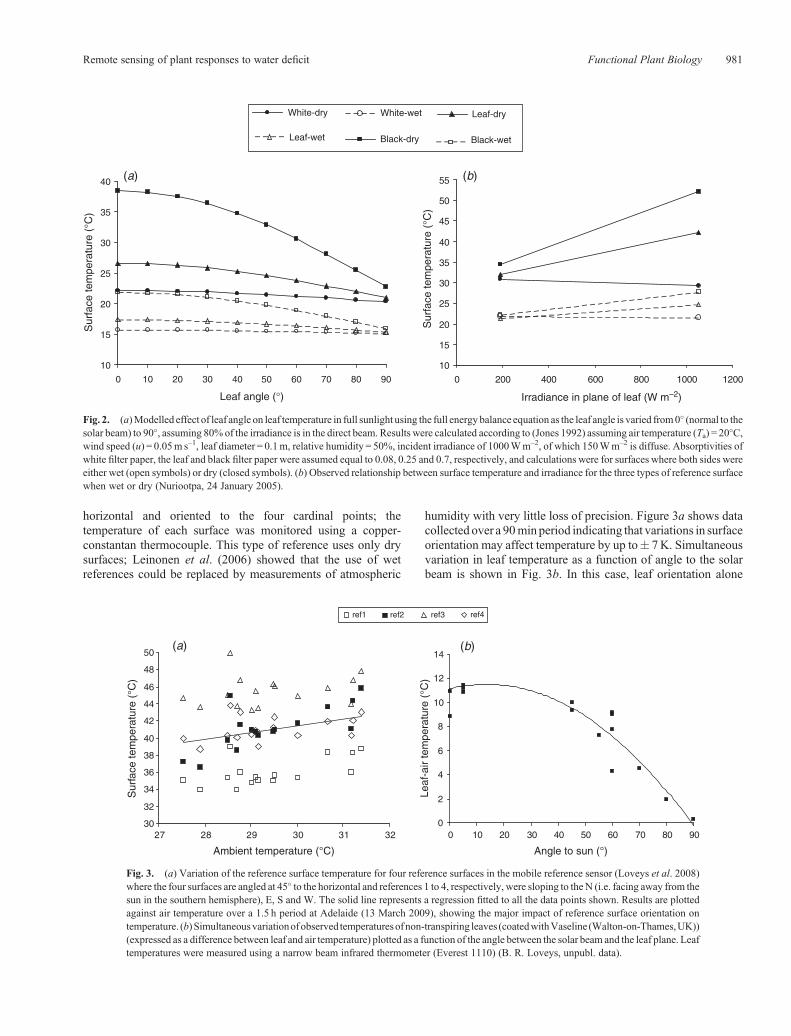
Eqn 3 can be rearranged to give Tleaf as a function of allthe environmental variables including the absorbed radiation(Jones 1992), so it is possible to calculate the expectedvariation in surface temperature for wet and dry surfaces ofdiffering absorptivities and leaf angle (Fig. 2a). These arecompared with observed temperatures for different surfaces(with differing a) at high and low irradiances (Fig. 2b).
We can illustrate the effect of leaf orientation on temperatureby using the artificial reference surface described by Loveyset al. (2008). This instrument consists of a horizontal framewith four green filter-paper surfaces radiating at 45� from the
Fig. 1. Schematic diagram showing typical mean irradiances in differentdirections as indicated by the heavy arrows for clear sky conditions fordifferent positions and orientations in a grapevine canopy. Measurementswere made by a cosine-corrected Pyranometer sensor (Skye Instruments,Llandidrod Wells, Wales) and expressed relative to the horizontal irradianceat the top of the canopy. Data ranges indicate the means of 20 separatemeasurements, each on a different vine, for each canopy position in each oftwo contrastinggrapevine canopies, one of Shiraz vines at SARDI,Nuriootpa,Australia, January 2005; and one of Moscatel vines, Estremoz, Portugal, July2004, with both canopies trained to a solid hedgerow form (H. G. Jones,unpubl. data).
980 Functional Plant Biology H. G. Jones et al.
horizontal and oriented to the four cardinal points; thetemperature of each surface was monitored using a copper-constantan thermocouple. This type of reference uses only drysurfaces; Leinonen et al. (2006) showed that the use of wetreferences could be replaced by measurements of atmospheric
humidity with very little loss of precision. Figure 3a shows datacollected over a 90minperiod indicating that variations in surfaceorientation may affect temperature by up to� 7K. Simultaneousvariation in leaf temperature as a function of angle to the solarbeam is shown in Fig. 3b. In this case, leaf orientation alone
10
15
20
25
30
35
40
0 10 20 30 40 50 60 70 80 90
Leaf angle (°)
Sur
face
tem
pera
ture
(°C
)
Sur
face
tem
pera
ture
(°C
)
10
15
20
25
30
35
40
45
50
55
0 200 400 600 800 1000 1200
Irradiance in plane of leaf (W m–2)
White-dry White-wet Leaf-dry
Leaf-wet Black-dry Black-wet
(a) (b)
Fig. 2. (a)Modelled effect of leaf angle on leaf temperature in full sunlight using the full energy balance equation as the leaf angle is varied from0� (normal to thesolar beam) to 90�, assuming 80% of the irradiance is in the direct beam. Results were calculated according to (Jones 1992) assuming air temperature (Ta) = 20�C,wind speed (u) = 0.05m s–1, leaf diameter = 0.1m, relative humidity = 50%, incident irradiance of 1000Wm–2, of which 150Wm–2 is diffuse. Absorptivities ofwhite filter paper, the leaf and black filter paper were assumed equal to 0.08, 0.25 and 0.7, respectively, and calculations were for surfaces where both sides wereeither wet (open symbols) or dry (closed symbols). (b) Observed relationship between surface temperature and irradiance for the three types of reference surfacewhen wet or dry (Nuriootpa, 24 January 2005).
30
32
34
36
38
40
42
44
46
48
50
27 28 29 30 31 32
Ambient temperature (°C) Angle to sun (°)
Sur
face
tem
pera
ture
(°C
)
Leaf
-air
tem
pera
ture
(°C
)
ref1 ref2 ref3 ref4
0
2
4
6
8
10
12
14
0 10 20 30 40 50 60 70 80 90
(a) (b)
Fig. 3. (a) Variation of the reference surface temperature for four reference surfaces in the mobile reference sensor (Loveys et al. 2008)where the four surfaces are angled at 45� to the horizontal and references 1 to 4, respectively, were sloping to the N (i.e. facing away from thesun in the southern hemisphere), E, S and W. The solid line represents a regression fitted to all the data points shown. Results are plottedagainst air temperature over a 1.5 h period at Adelaide (13 March 2009), showing the major impact of reference surface orientation ontemperature. (b) Simultaneousvariationofobserved temperaturesofnon-transpiring leaves (coatedwithVaseline (Walton-on-Thames,UK))(expressed as a difference between leaf and air temperature) plotted as a function of the angle between the solar beam and the leaf plane. Leaftemperatures were measured using a narrow beam infrared thermometer (Everest 1110) (B. R. Loveys, unpubl. data).
Remote sensing of plant responses to water deficit Functional Plant Biology 981
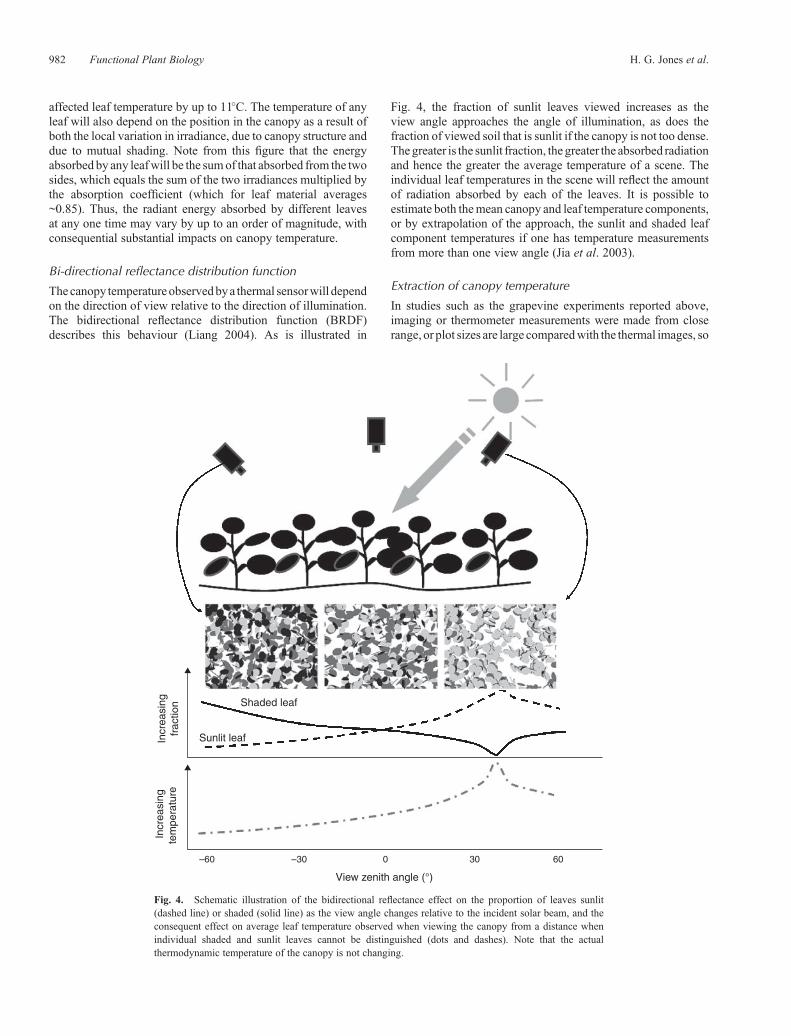
affected leaf temperature by up to 11�C. The temperature of anyleaf will also depend on the position in the canopy as a result ofboth the local variation in irradiance, due to canopy structure anddue to mutual shading. Note from this figure that the energyabsorbed by any leafwill be the sumof that absorbed from the twosides, which equals the sum of the two irradiances multiplied bythe absorption coefficient (which for leaf material averages~0.85). Thus, the radiant energy absorbed by different leavesat any one time may vary by up to an order of magnitude, withconsequential substantial impacts on canopy temperature.
Bi-directional reflectance distribution function
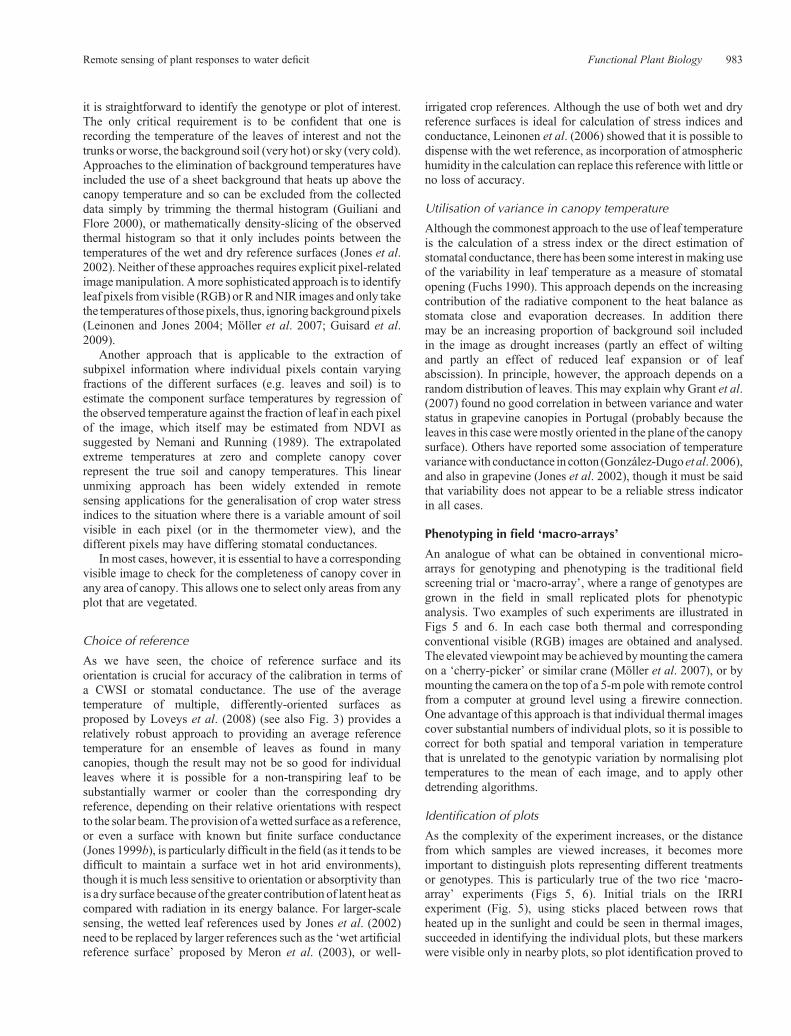
Thecanopy temperature observedbya thermal sensorwill dependon the direction of view relative to the direction of illumination.The bidirectional reflectance distribution function (BRDF)describes this behaviour (Liang 2004). As is illustrated in
Fig. 4, the fraction of sunlit leaves viewed increases as theview angle approaches the angle of illumination, as does thefraction of viewed soil that is sunlit if the canopy is not too dense.Thegreater is the sunlit fraction, the greater the absorbed radiationand hence the greater the average temperature of a scene. Theindividual leaf temperatures in the scene will reflect the amountof radiation absorbed by each of the leaves. It is possible toestimate both themean canopy and leaf temperature components,or by extrapolation of the approach, the sunlit and shaded leafcomponent temperatures if one has temperature measurementsfrom more than one view angle (Jia et al. 2003).
Extraction of canopy temperature
In studies such as the grapevine experiments reported above,imaging or thermometer measurements were made from closerange, or plot sizes are large comparedwith the thermal images, so
Shaded leaf
Sunlit leaf
–60
Incr
easi
ngte
mpe
ratu
re
Incr
easi
ngfr
actio
n
–30 0 30 60
View zenith angle (°)
Fig. 4. Schematic illustration of the bidirectional reflectance effect on the proportion of leaves sunlit(dashed line) or shaded (solid line) as the view angle changes relative to the incident solar beam, and theconsequent effect on average leaf temperature observed when viewing the canopy from a distance whenindividual shaded and sunlit leaves cannot be distinguished (dots and dashes). Note that the actualthermodynamic temperature of the canopy is not changing.
982 Functional Plant Biology H. G. Jones et al.
it is straightforward to identify the genotype or plot of interest.The only critical requirement is to be confident that one isrecording the temperature of the leaves of interest and not thetrunks orworse, the background soil (very hot) or sky (very cold).Approaches to the elimination of background temperatures haveincluded the use of a sheet background that heats up above thecanopy temperature and so can be excluded from the collecteddata simply by trimming the thermal histogram (Guiliani andFlore 2000), or mathematically density-slicing of the observedthermal histogram so that it only includes points between thetemperatures of the wet and dry reference surfaces (Jones et al.2002). Neither of these approaches requires explicit pixel-relatedimagemanipulation. Amore sophisticated approach is to identifyleaf pixels fromvisible (RGB) orR andNIR images and only takethe temperatures of those pixels, thus, ignoringbackgroundpixels(Leinonen and Jones 2004; Möller et al. 2007; Guisard et al.2009).
Another approach that is applicable to the extraction ofsubpixel information where individual pixels contain varyingfractions of the different surfaces (e.g. leaves and soil) is toestimate the component surface temperatures by regression ofthe observed temperature against the fraction of leaf in each pixelof the image, which itself may be estimated from NDVI assuggested by Nemani and Running (1989). The extrapolatedextreme temperatures at zero and complete canopy coverrepresent the true soil and canopy temperatures. This linearunmixing approach has been widely extended in remotesensing applications for the generalisation of crop water stressindices to the situation where there is a variable amount of soilvisible in each pixel (or in the thermometer view), and thedifferent pixels may have differing stomatal conductances.
In most cases, however, it is essential to have a correspondingvisible image to check for the completeness of canopy cover inany area of canopy. This allows one to select only areas from anyplot that are vegetated.
Choice of reference
As we have seen, the choice of reference surface and itsorientation is crucial for accuracy of the calibration in terms ofa CWSI or stomatal conductance. The use of the averagetemperature of multiple, differently-oriented surfaces asproposed by Loveys et al. (2008) (see also Fig. 3) provides arelatively robust approach to providing an average referencetemperature for an ensemble of leaves as found in manycanopies, though the result may not be so good for individualleaves where it is possible for a non-transpiring leaf to besubstantially warmer or cooler than the corresponding dryreference, depending on their relative orientations with respectto the solar beam.The provision of awetted surface as a reference,or even a surface with known but finite surface conductance(Jones 1999b), is particularly difficult in the field (as it tends to bedifficult to maintain a surface wet in hot arid environments),though it is much less sensitive to orientation or absorptivity thanis a dry surface because of the greater contribution of latent heat ascompared with radiation in its energy balance. For larger-scalesensing, the wetted leaf references used by Jones et al. (2002)need to be replaced by larger references such as the ‘wet artificialreference surface’ proposed by Meron et al. (2003), or well-
irrigated crop references. Although the use of both wet and dryreference surfaces is ideal for calculation of stress indices andconductance, Leinonen et al. (2006) showed that it is possible todispense with the wet reference, as incorporation of atmospherichumidity in the calculation can replace this reference with little orno loss of accuracy.
Utilisation of variance in canopy temperature
Although the commonest approach to the use of leaf temperatureis the calculation of a stress index or the direct estimation ofstomatal conductance, there has been some interest inmaking useof the variability in leaf temperature as a measure of stomatalopening (Fuchs 1990). This approach depends on the increasingcontribution of the radiative component to the heat balance asstomata close and evaporation decreases. In addition theremay be an increasing proportion of background soil includedin the image as drought increases (partly an effect of wiltingand partly an effect of reduced leaf expansion or of leafabscission). In principle, however, the approach depends on arandom distribution of leaves. This may explain why Grant et al.(2007) found no good correlation in between variance and waterstatus in grapevine canopies in Portugal (probably because theleaves in this case weremostly oriented in the plane of the canopysurface). Others have reported some association of temperaturevariancewith conductance in cotton (González-Dugo et al. 2006),and also in grapevine (Jones et al. 2002), though it must be saidthat variability does not appear to be a reliable stress indicatorin all cases.
Phenotyping in field ‘macro-arrays’
An analogue of what can be obtained in conventional micro-arrays for genotyping and phenotyping is the traditional fieldscreening trial or ‘macro-array’, where a range of genotypes aregrown in the field in small replicated plots for phenotypicanalysis. Two examples of such experiments are illustrated inFigs 5 and 6. In each case both thermal and correspondingconventional visible (RGB) images are obtained and analysed.The elevated viewpointmay be achieved bymounting the cameraon a ‘cherry-picker’ or similar crane (Möller et al. 2007), or bymounting the camera on the top of a 5-m polewith remote controlfrom a computer at ground level using a firewire connection.One advantage of this approach is that individual thermal imagescover substantial numbers of individual plots, so it is possible tocorrect for both spatial and temporal variation in temperaturethat is unrelated to the genotypic variation by normalising plottemperatures to the mean of each image, and to apply otherdetrending algorithms.
Identification of plots
As the complexity of the experiment increases, or the distancefrom which samples are viewed increases, it becomes moreimportant to distinguish plots representing different treatmentsor genotypes. This is particularly true of the two rice ‘macro-array’ experiments (Figs 5, 6). Initial trials on the IRRIexperiment (Fig. 5), using sticks placed between rows thatheated up in the sunlight and could be seen in thermal images,succeeded in identifying the individual plots, but these markerswere visible only in nearby plots, so plot identification proved to
Remote sensing of plant responses to water deficit Functional Plant Biology 983
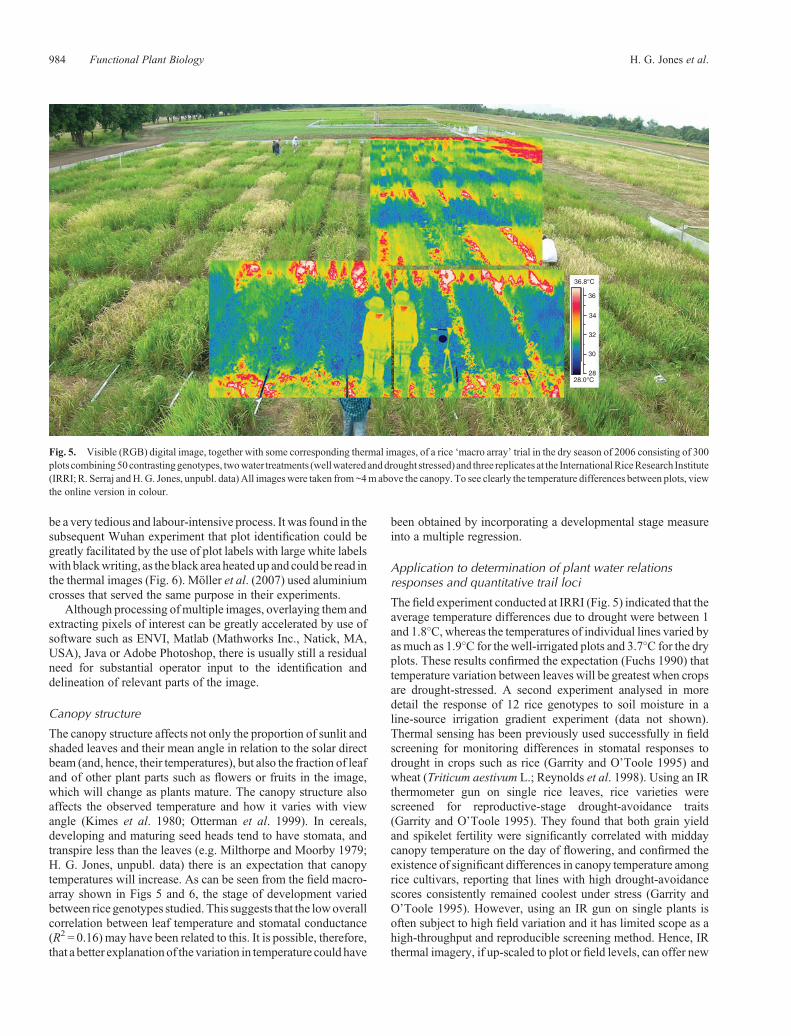
be a very tedious and labour-intensive process. It was found in thesubsequent Wuhan experiment that plot identification could begreatly facilitated by the use of plot labels with large white labelswith blackwriting, as the black area heated upandcould be read inthe thermal images (Fig. 6). Möller et al. (2007) used aluminiumcrosses that served the same purpose in their experiments.
Although processing ofmultiple images, overlaying them andextracting pixels of interest can be greatly accelerated by use ofsoftware such as ENVI, Matlab (Mathworks Inc., Natick, MA,USA), Java or Adobe Photoshop, there is usually still a residualneed for substantial operator input to the identification anddelineation of relevant parts of the image.
Canopy structure
The canopy structure affects not only the proportion of sunlit andshaded leaves and their mean angle in relation to the solar directbeam (and, hence, their temperatures), but also the fraction of leafand of other plant parts such as flowers or fruits in the image,which will change as plants mature. The canopy structure alsoaffects the observed temperature and how it varies with viewangle (Kimes et al. 1980; Otterman et al. 1999). In cereals,developing and maturing seed heads tend to have stomata, andtranspire less than the leaves (e.g. Milthorpe and Moorby 1979;H. G. Jones, unpubl. data) there is an expectation that canopytemperatures will increase. As can be seen from the field macro-array shown in Figs 5 and 6, the stage of development variedbetween rice genotypes studied. This suggests that the lowoverallcorrelation between leaf temperature and stomatal conductance(R2 = 0.16) may have been related to this. It is possible, therefore,that a better explanationof the variation in temperature could have
been obtained by incorporating a developmental stage measureinto a multiple regression.
Application to determination of plant water relationsresponses and quantitative trail loci
The field experiment conducted at IRRI (Fig. 5) indicated that theaverage temperature differences due to drought were between 1and 1.8�C, whereas the temperatures of individual lines varied byasmuch as 1.9�C for the well-irrigated plots and 3.7�C for the dryplots. These results confirmed the expectation (Fuchs 1990) thattemperature variation between leaves will be greatest when cropsare drought-stressed. A second experiment analysed in moredetail the response of 12 rice genotypes to soil moisture in aline-source irrigation gradient experiment (data not shown).Thermal sensing has been previously used successfully in fieldscreening for monitoring differences in stomatal responses todrought in crops such as rice (Garrity and O’Toole 1995) andwheat (Triticum aestivum L.; Reynolds et al. 1998). Using an IRthermometer gun on single rice leaves, rice varieties werescreened for reproductive-stage drought-avoidance traits(Garrity and O’Toole 1995). They found that both grain yieldand spikelet fertility were significantly correlated with middaycanopy temperature on the day of flowering, and confirmed theexistence of significant differences in canopy temperature amongrice cultivars, reporting that lines with high drought-avoidancescores consistently remained coolest under stress (Garrity andO’Toole 1995). However, using an IR gun on single plants isoften subject to high field variation and it has limited scope as ahigh-throughput and reproducible screening method. Hence, IRthermal imagery, if up-scaled to plot or field levels, can offer new
36.8°C
36
34
32
30
2828.0°C
Fig. 5. Visible (RGB) digital image, together with some corresponding thermal images, of a rice ‘macro array’ trial in the dry season of 2006 consisting of 300plots combining50contrastinggenotypes, twowater treatments (wellwateredanddrought stressed) and three replicates at the InternationalRiceResearch Institute(IRRI; R. Serraj andH.G. Jones, unpubl. data)All imageswere taken from~4mabove the canopy. To see clearly the temperature differences between plots, viewthe online version in colour.
984 Functional Plant Biology H. G. Jones et al.

screening tools for drought resistance research in rice (Serraj et al.2009).
The field experiment in Wuhan was based on a mappingpopulation involving 105 recombinant inbred lines and wasused to derive quantitative trail loci (QTL) relating to aspectsof plant water relations using the thermal data in combination
with a range of other physiological and structural data. Here weillustrate the viability of the thermal approach for derivation ofgenetic variation in stomatal conductance in a field experiment.Although there was substantial variation in underlying soilmoisture content over the trial, partly as a result of the need toapply supplementary hand-watering to prevent serious stress,
36.8°C
28.0°C
36
34
32
30
28
(a)
(b)
Fig. 6. Image of a sample area from a rice ‘macro array’ consisting of 105 recombinant inbred lines (Bala�Azucena population),Price et al. (2000) plus 15 others grown in rainout shelters at Huazhong Agricultural University, Wuhan (A. Price, L. Xiong andH.G. Jones, unpubl. data). Plot size is 1.6� 0.6mwith repeatedcontrols.This image shows theuseof plot labels to identifygenotypesin the thermal image. At the right-hand side of this image can be seen the wet and dry reference surfaces, which can be used tonormalise the data if required. To see clearly the temperature differences between plots, view the online version in colour.
Remote sensing of plant responses to water deficit Functional Plant Biology 985
analysis of the thermal data from measurements made over5 days during the drying cycle demonstrated good heritabilityand provide clear evidence for thermal QTLs (related to croptranspiration). Two temperature QTLs were identified with LODscores above 3.2 on chromosomes 2 and 11 (the 5%genomewidethreshold) (these will be reported elsewhere in more detail;A. H. Price, unpubl. data).
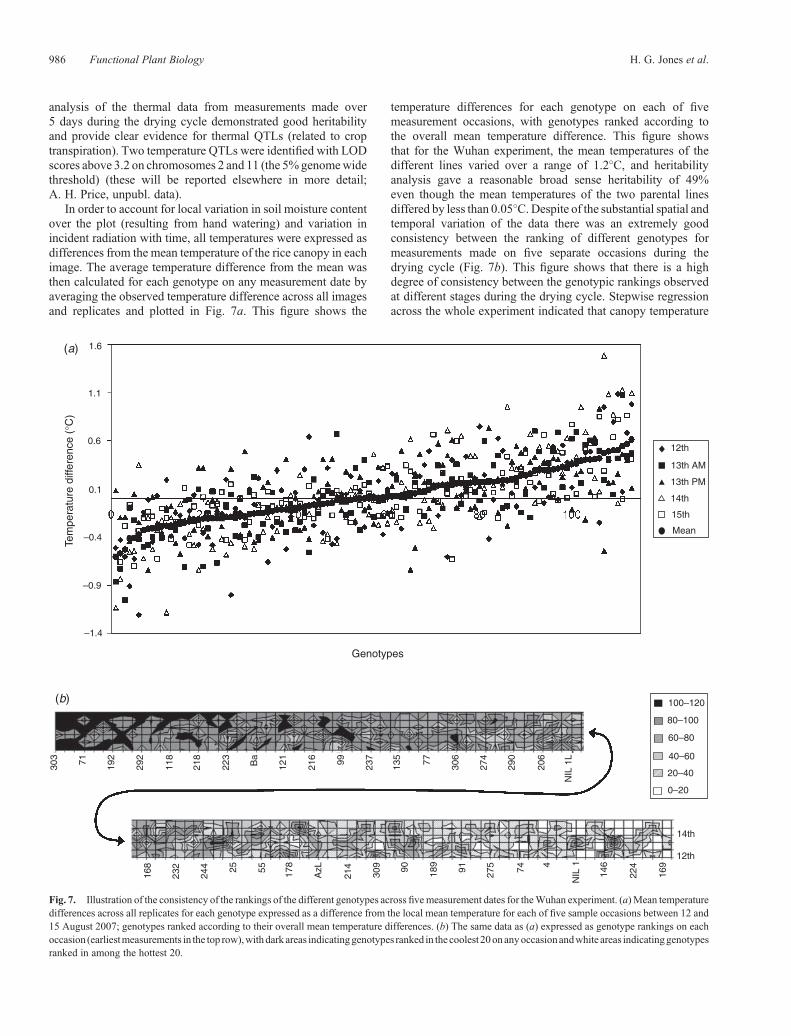
In order to account for local variation in soil moisture contentover the plot (resulting from hand watering) and variation inincident radiation with time, all temperatures were expressed asdifferences from the mean temperature of the rice canopy in eachimage. The average temperature difference from the mean wasthen calculated for each genotype on any measurement date byaveraging the observed temperature difference across all imagesand replicates and plotted in Fig. 7a. This figure shows the
temperature differences for each genotype on each of fivemeasurement occasions, with genotypes ranked according tothe overall mean temperature difference. This figure showsthat for the Wuhan experiment, the mean temperatures of thedifferent lines varied over a range of 1.2�C, and heritabilityanalysis gave a reasonable broad sense heritability of 49%even though the mean temperatures of the two parental linesdiffered by less than 0.05�C.Despite of the substantial spatial andtemporal variation of the data there was an extremely goodconsistency between the ranking of different genotypes formeasurements made on five separate occasions during thedrying cycle (Fig. 7b). This figure shows that there is a highdegree of consistency between the genotypic rankings observedat different stages during the drying cycle. Stepwise regressionacross the whole experiment indicated that canopy temperature
1.6
1.1
0.6
0.1
–0.4
–0.9
–1.4
Genotypes
Tem
pera
ture
diff
eren
ce (
°C)
303
168
232
244 25 55 178
AzL
214
309 90 189
91 275 74 4
NIL
1
146
224
169
71 192
292
118
218
223
Ba
121
216 99 237
135 77 306
274
290
206
NIL
1L
14th
12th
100–120
12th
13th AM
13th PM
14th
15th
Mean
80–100
60–80
40–60
20–40
0–20
(a)
(b)
Fig. 7. Illustration of the consistency of the rankings of the different genotypes across fivemeasurement dates for theWuhan experiment. (a)Mean temperaturedifferences across all replicates for each genotype expressed as a difference from the local mean temperature for each of five sample occasions between 12 and15 August 2007; genotypes ranked according to their overall mean temperature differences. (b) The same data as (a) expressed as genotype rankings on eachoccasion (earliestmeasurements in the top row),withdark areas indicatinggenotypes ranked in thecoolest20onanyoccasionandwhite areas indicatinggenotypesranked in among the hottest 20.
986 Functional Plant Biology H. G. Jones et al.
was best explained by variation in stomatal conductance with‘leaf firing’ score and d13C being the next most importantexplanatory variables (A. H. Price, unpubl. data).
Extrapolation to larger scales
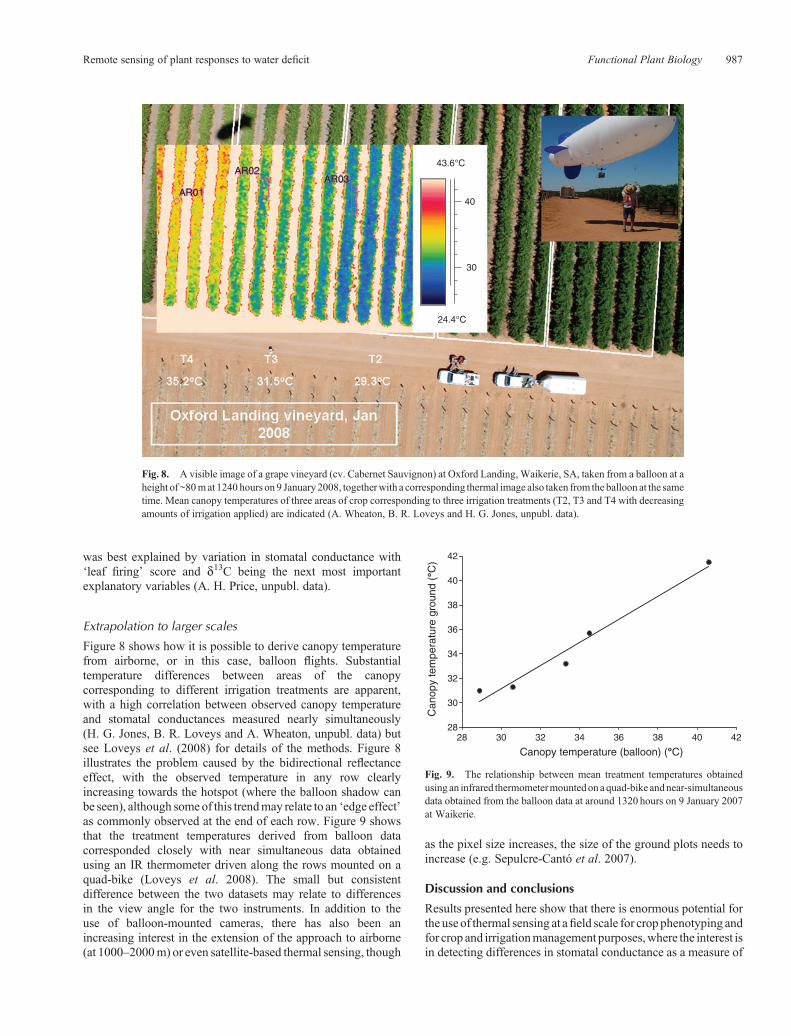
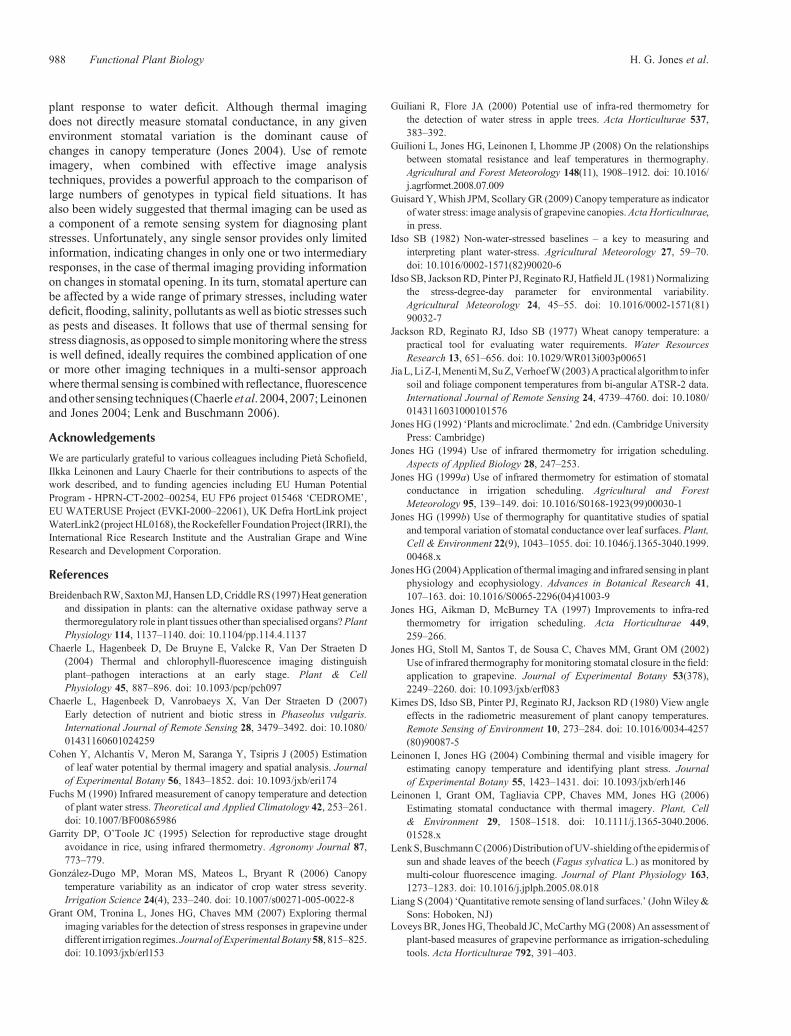
Figure 8 shows how it is possible to derive canopy temperaturefrom airborne, or in this case, balloon flights. Substantialtemperature differences between areas of the canopycorresponding to different irrigation treatments are apparent,with a high correlation between observed canopy temperatureand stomatal conductances measured nearly simultaneously(H. G. Jones, B. R. Loveys and A. Wheaton, unpubl. data) butsee Loveys et al. (2008) for details of the methods. Figure 8illustrates the problem caused by the bidirectional reflectanceeffect, with the observed temperature in any row clearlyincreasing towards the hotspot (where the balloon shadow canbe seen), although someof this trendmay relate to an ‘edge effect’as commonly observed at the end of each row. Figure 9 showsthat the treatment temperatures derived from balloon datacorresponded closely with near simultaneous data obtainedusing an IR thermometer driven along the rows mounted on aquad-bike (Loveys et al. 2008). The small but consistentdifference between the two datasets may relate to differencesin the view angle for the two instruments. In addition to theuse of balloon-mounted cameras, there has also been anincreasing interest in the extension of the approach to airborne(at 1000–2000m) or even satellite-based thermal sensing, though
as the pixel size increases, the size of the ground plots needs toincrease (e.g. Sepulcre-Cantó et al. 2007).
Discussion and conclusions
Results presented here show that there is enormous potential forthe useof thermal sensing at afield scale for crop phenotyping andfor crop and irrigationmanagement purposes,where the interest isin detecting differences in stomatal conductance as a measure of
43.6°C
24.4°C
40
30
AR01
AR02AR03
Fig. 8. A visible image of a grape vineyard (cv. Cabernet Sauvignon) at Oxford Landing, Waikerie, SA, taken from a balloon at aheight of ~80mat 1240 hours on9 January2008, togetherwith a corresponding thermal image also taken from the balloon at the sametime. Mean canopy temperatures of three areas of crop corresponding to three irrigation treatments (T2, T3 and T4 with decreasingamounts of irrigation applied) are indicated (A. Wheaton, B. R. Loveys and H. G. Jones, unpubl. data).
28
30
32
34
36
38
40
42
28 30 32 34 36 38 40 42
Canopy temperature (balloon) (°°C)
Can
opy
tem
pera
ture
gro
und
(°°C
)
Fig. 9. The relationship between mean treatment temperatures obtainedusing an infrared thermometermountedonaquad-bike andnear-simultaneousdata obtained from the balloon data at around 1320 hours on 9 January 2007at Waikerie.
Remote sensing of plant responses to water deficit Functional Plant Biology 987
plant response to water deficit. Although thermal imagingdoes not directly measure stomatal conductance, in any givenenvironment stomatal variation is the dominant cause ofchanges in canopy temperature (Jones 2004). Use of remoteimagery, when combined with effective image analysistechniques, provides a powerful approach to the comparison oflarge numbers of genotypes in typical field situations. It hasalso been widely suggested that thermal imaging can be used asa component of a remote sensing system for diagnosing plantstresses. Unfortunately, any single sensor provides only limitedinformation, indicating changes in only one or two intermediaryresponses, in the case of thermal imaging providing informationon changes in stomatal opening. In its turn, stomatal aperture canbe affected by a wide range of primary stresses, including waterdeficit, flooding, salinity, pollutants aswell as biotic stresses suchas pests and diseases. It follows that use of thermal sensing forstress diagnosis, as opposed to simplemonitoringwhere the stressis well defined, ideally requires the combined application of oneor more other imaging techniques in a multi-sensor approachwhere thermal sensing is combinedwith reflectance,fluorescenceandother sensing techniques (Chaerle et al. 2004,2007;Leinonenand Jones 2004; Lenk and Buschmann 2006).
Acknowledgements
We are particularly grateful to various colleagues including Pietà Schofield,Ilkka Leinonen and Laury Chaerle for their contributions to aspects of thework described, and to funding agencies including EU Human PotentialProgram - HPRN-CT-2002–00254, EU FP6 project 015468 ‘CEDROME’,EU WATERUSE Project (EVKI-2000–22061), UK Defra HortLink projectWaterLink2 (projectHL0168), theRockefeller FoundationProject (IRRI), theInternational Rice Research Institute and the Australian Grape and WineResearch and Development Corporation.
References
BreidenbachRW,SaxtonMJ,HansenLD,CriddleRS (1997)Heat generationand dissipation in plants: can the alternative oxidase pathway serve athermoregulatory role in plant tissues other than specialised organs?PlantPhysiology 114, 1137–1140. doi: 10.1104/pp.114.4.1137
Chaerle L, Hagenbeek D, De Bruyne E, Valcke R, Van Der Straeten D(2004) Thermal and chlorophyll-fluorescence imaging distinguishplant–pathogen interactions at an early stage. Plant & CellPhysiology 45, 887–896. doi: 10.1093/pcp/pch097
Chaerle L, Hagenbeek D, Vanrobaeys X, Van Der Straeten D (2007)Early detection of nutrient and biotic stress in Phaseolus vulgaris.International Journal of Remote Sensing 28, 3479–3492. doi: 10.1080/01431160601024259
Cohen Y, Alchantis V, Meron M, Saranga Y, Tsipris J (2005) Estimationof leaf water potential by thermal imagery and spatial analysis. Journalof Experimental Botany 56, 1843–1852. doi: 10.1093/jxb/eri174
Fuchs M (1990) Infrared measurement of canopy temperature and detectionof plant water stress. Theoretical and Applied Climatology 42, 253–261.doi: 10.1007/BF00865986
Garrity DP, O’Toole JC (1995) Selection for reproductive stage droughtavoidance in rice, using infrared thermometry. Agronomy Journal 87,773–779.
González-Dugo MP, Moran MS, Mateos L, Bryant R (2006) Canopytemperature variability as an indicator of crop water stress severity.Irrigation Science 24(4), 233–240. doi: 10.1007/s00271-005-0022-8
Grant OM, Tronina L, Jones HG, Chaves MM (2007) Exploring thermalimaging variables for the detection of stress responses in grapevine underdifferent irrigation regimes. Journal ofExperimentalBotany58, 815–825.doi: 10.1093/jxb/erl153
Guiliani R, Flore JA (2000) Potential use of infra-red thermometry forthe detection of water stress in apple trees. Acta Horticulturae 537,383–392.
Guilioni L, Jones HG, Leinonen I, Lhomme JP (2008) On the relationshipsbetween stomatal resistance and leaf temperatures in thermography.Agricultural and Forest Meteorology 148(11), 1908–1912. doi: 10.1016/j.agrformet.2008.07.009
Guisard Y,Whish JPM, Scollary GR (2009) Canopy temperature as indicatorof water stress: image analysis of grapevine canopies.ActaHorticulturae,in press.
Idso SB (1982) Non-water-stressed baselines – a key to measuring andinterpreting plant water-stress. Agricultural Meteorology 27, 59–70.doi: 10.1016/0002-1571(82)90020-6
Idso SB, JacksonRD, Pinter PJ, ReginatoRJ, Hatfield JL (1981)Normalizingthe stress-degree-day parameter for environmental variability.Agricultural Meteorology 24, 45–55. doi: 10.1016/0002-1571(81)90032-7
Jackson RD, Reginato RJ, Idso SB (1977) Wheat canopy temperature: apractical tool for evaluating water requirements. Water ResourcesResearch 13, 651–656. doi: 10.1029/WR013i003p00651
JiaL,LiZ-I,MenentiM,SuZ,VerhoefW(2003)Apractical algorithm to infersoil and foliage component temperatures from bi-angular ATSR-2 data.International Journal of Remote Sensing 24, 4739–4760. doi: 10.1080/0143116031000101576
Jones HG (1992) ‘Plants andmicroclimate.’ 2nd edn. (Cambridge UniversityPress: Cambridge)
Jones HG (1994) Use of infrared thermometry for irrigation scheduling.Aspects of Applied Biology 28, 247–253.
Jones HG (1999a) Use of infrared thermometry for estimation of stomatalconductance in irrigation scheduling. Agricultural and ForestMeteorology 95, 139–149. doi: 10.1016/S0168-1923(99)00030-1
Jones HG (1999b) Use of thermography for quantitative studies of spatialand temporal variation of stomatal conductance over leaf surfaces. Plant,Cell & Environment 22(9), 1043–1055. doi: 10.1046/j.1365-3040.1999.00468.x
JonesHG (2004)Application of thermal imaging and infrared sensing in plantphysiology and ecophysiology. Advances in Botanical Research 41,107–163. doi: 10.1016/S0065-2296(04)41003-9
Jones HG, Aikman D, McBurney TA (1997) Improvements to infra-redthermometry for irrigation scheduling. Acta Horticulturae 449,259–266.
Jones HG, Stoll M, Santos T, de Sousa C, Chaves MM, Grant OM (2002)Use of infrared thermography formonitoring stomatal closure in the field:application to grapevine. Journal of Experimental Botany 53(378),2249–2260. doi: 10.1093/jxb/erf083
Kimes DS, Idso SB, Pinter PJ, Reginato RJ, Jackson RD (1980) View angleeffects in the radiometric measurement of plant canopy temperatures.Remote Sensing of Environment 10, 273–284. doi: 10.1016/0034-4257(80)90087-5
Leinonen I, Jones HG (2004) Combining thermal and visible imagery forestimating canopy temperature and identifying plant stress. Journalof Experimental Botany 55, 1423–1431. doi: 10.1093/jxb/erh146
Leinonen I, Grant OM, Tagliavia CPP, Chaves MM, Jones HG (2006)Estimating stomatal conductance with thermal imagery. Plant, Cell& Environment 29, 1508–1518. doi: 10.1111/j.1365-3040.2006.01528.x
LenkS,BuschmannC(2006)DistributionofUV-shieldingof the epidermisofsun and shade leaves of the beech (Fagus sylvatica L.) as monitored bymulti-colour fluorescence imaging. Journal of Plant Physiology 163,1273–1283. doi: 10.1016/j.jplph.2005.08.018
Liang S (2004) ‘Quantitative remote sensing of land surfaces.’ (JohnWiley&Sons: Hoboken, NJ)
Loveys BR, Jones HG, Theobald JC,McCarthyMG (2008)An assessment ofplant-based measures of grapevine performance as irrigation-schedulingtools. Acta Horticulturae 792, 391–403.
988 Functional Plant Biology H. G. Jones et al.
Merlot S, Mustilli AC, Genty B, North H, Lefebvre V, Sotta B, Vavasseur A,Giraudat J (2002) Use of infrared thermal imaging to isolate Arabidopsismutants defective in stomatal regulation. The Plant Journal 30(5),601–609. doi: 10.1046/j.1365-313X.2002.01322.x
Meron M, Tsipris J, Charitt D (2003) Remote mapping of crop water statusto assess spatial variability of crop stress. In ‘4th European conferenceon precision agriculture’. (Eds J Stafford, A Wemer) pp. 405–410.(Wageningen Academic Publishers: Wageningen, The Netherlands)
Milthorpe FL, Moorby J (1979) ‘An introduction to crop physiology.’2nd edn. (Cambridge University Press: Cambridge)
Möller M, Alcanatis V, Cohen Y, Meron M, Tsipris J, Naor A, Ostrovsky V,Sprintsin M, Cohen S (2007) Use of thermal and visible imageryfor estimating crop water status of irrigated grapevine. Journal ofExperimental Botany 58, 827–838. doi: 10.1093/jxb/erl115
Nemani RR, Running SW (1989) Estimation of regional surface resistanceto evapotranspiration from NDVI and thermal-IR AVHRR data. Journalof Applied Meteorology 28, 276–284. doi: 10.1175/1520-0450(1989)028<0276:EORSRT>2.0.CO;2
Otterman J, Brakke TW, Fuchs M, Lakshmi V, Cadeddu M (1999)Long-wave emission from a plant/soil surface as a function of the viewdirection: dependence on the canopy architecture. International Journalof Remote Sensing 20, 2195–2201. doi: 10.1080/014311699212191
Price AH, Steele KA, Moore BJ, Barraclough PB, Clark LJ (2000)A combined RFLP and AFLP linkage map of upland rice (Oryzasativa L.) used to identify QTLs for root penetration ability.Theoretical and Applied Genetics 100, 49–56. doi: 10.1007/s001220050007
Raskin I, Ladyman JAR (1988) Isolation and characterisation of a barleymutant with abscisic-acid-insensitive stomata. Planta 173, 73–78.doi: 10.1007/BF00394490
Reynolds MP, Singh RP, Ibrahim A, Ageeb OA, Larqué-Saavedra A,Quick JS (1998) Evaluating physiological traits to complimentempirical selection for wheat in warm environments. Euphytica100, 85–94. doi: 10.1023/A:1018355906553
Sepulcre-Cantó G, Zarco-Tejada PJ, Jiménez-Muñoz JC, Sobrino JA,Spriano MA, Fereres E, Vega V, Pastor M (2007) Monitoring yieldand fruit quality parameters in open-canopy tree crops under waterstress. Implications for ASTER. Remote Sensing of Environment 107,455–470.doi:10.1016/j.rse.2006.09.014
Serraj R, Kumar A, McNally KL, Slamet-Loedin I, Bruskiewich R,Mauleon R, Cairns J, Hijmans R (2009) Improvement of droughtresistance in rice. Advances in Agronomy 103, 41–99. doi: 10.1016/S0065-2113(09)03002-8
Seymour RS (1999) Pattern of respiration by intact inflorescences of thethermogenic arum lily Philodendron selloum. Journal of ExperimentalBotany 50, 845–852. doi: 10.1093/jexbot/50.335.845
Wisniewski M, Lindow SE, Ashworth EN (1997) Observations of icenucleation and propagation in plants using infrared videothermography. Plant Physiology 113, 327–334.
Manuscript received 26 May 2009, accepted 15 September 2009
Remote sensing of plant responses to water deficit Functional Plant Biology 989
http://www.publish.csiro.au/journals/fpb