Thermal Infrared Characterization of Ground Targets and Backgrounds
10
Chapter 3 Introduction to Target Detection Figure 3.1 shows the scenario taken as the starting point for discussing the influence of the various components in the IR observation (detection) process, such as the IR system, type of target, weather and environmental parameters, and countermeasures such as camouflage and smokescreens. 3.1 IR Detection Process The detection process can be separated into four independent primary areas, which can be characterized as follows. 3.1.1 Target-to-background radiation contrast In any detection process, it is essential that at least one target feature be different from the same feature in the background. Since infrared systems use radiation Figure 3.1 Elements in the infrared observation process. 17
description
Thermal Infrared Characterization of Ground Targets and Backgrounds
Transcript of Thermal Infrared Characterization of Ground Targets and Backgrounds

Chapter 3
Introduction to TargetDetection
Figure 3.1 shows the scenario taken as the starting point for discussing theinfluence of the various components in the IR observation (detection) process,such as the IR system, type of target, weather and environmental parameters,and countermeasures such as camouflage and smokescreens.
3.1 IR Detection Process
The detection process can be separated into four independent primary areas, whichcan be characterized as follows.
3.1.1 Target-to-background radiation contrast
In any detection process, it is essential that at least one target feature be differentfrom the same feature in the background. Since infrared systems use radiation
Figure 3.1 Elements in the infrared observation process.
17

emitted by the target and background, the transmitted radiation contrast betweenthe target and its local background is the basic input parameter for detection.
As already mentioned, detection can occur only if a target feature can bediscriminated from the background. This requires that a minimum of two criteriabe fulfilled. First, the radiation contrast between target and background must gen-erate a detector output voltage exceeding the system noise level. This is basicallydetermined by system design and is dependent on (limited by) the performance ofoptical and electronic system components. Second, the radiation contrast must bediscernible from the total observed scene. In other words, if more similar radiationlevels exist in the observed scene (spatial radiation distribution, also called back-ground clutter), detection is not unique. In a highly cluttered background, targetdiscrimination is possible only if more target and/or background features aretaken into account.
3.1.2 Attenuation processes
In the optical path between the target and the IR system, the radiation contrast canbe influenced by environmental conditions. In the adopted scenario, the radiationcontrast is attenuated by passive countermeasures (camouflage, smoke) and byatmospheric effects, caused by molecular absorption and emission (mainly waterand carbon dioxide) and atmospheric scattering processes (aerosols). TheMODTRAN model is a commonly accepted model with which to perform suchatmospheric properties calculations.
3.1.3 IR systems
Next to a distinction between active and passive systems, as mentioned earlier,systems generally are differentiated as imaging and nonimaging. Active systemsobviously have the disadvantage of needing an artificial source to operate,which makes them vulnerable to enemy detection. On the other hand, the contrastbetween target and background may be greatly enhanced, which gives an advan-tage under reduced “visibility” conditions. Active systems recently have becomeinteresting again because of the development of new NIR eye-safe lasers. Thesesystems also can be used in a gated viewing mode, similar to the LIDAR proces-sing: the emitted laser pulses hit an object and are reflected back to the sensorsystem. By tuning the receiving detector electronics with the frequency of theemitted pulses, a range gate can be selected. Only the reflections that occur inthis range gate will reach the detector, eliminating much of the stray radiation.The very narrow spectral bands at which these lasers operate also lower the prob-ability of detection by enemy sensors. Either active or passive sensor systems mayalso use a series of narrow spectral bands (hyperspectral), especially in spectralbands where high radiation levels are expected and specific target features canbe determined.
18 Chapter 3

The heart of any IR system is the infrared detector. Because of the explosivedevelopment of modern electronics and developments in materials research, alarge variety of IR detectors have become available (Fig. 3.2). Moreover, thesingle IR detector has been replaced gradually by detector arrays, leading toimagery of much higher resolution.
In its simplest form, IR radiation is measured with a radiometer. Such a device, inessence, consists of a spectral bandfilter,lo, todetermine the spectral regionof interest,and a single IR detector. Figure 3.3 shows a modern background measurement setupwith a computer-controlled radiometer. Themeasured incoming radiation is converted
Figure 3.2 Overview of some relevant IR detector materials.
Figure 3.3 IR field radiometer.
Introduction to Target Detection 19

to a corresponding apparent temperature, using internal calibration sources, with
Eap ¼
ðlo
E(l, Tap)dl or Et ¼ 1t
ðlo
Ebb(l, Tt)dl,
where the known target emissivity, 1t, is set on the radiometer.Imaging systems produce an image of the target, that is, a two-dimensional (2D)
representation in some feature space of a three-dimensional (3D) object. For instance,a color photograph is a 2D representation of an object using color as a feature. Athermal image is a 2D representation of an object using thermal radiation as afeature. The quality of the image is determined by the geometrical detail (resolutionelements, pixels) and the feature detail (color resolution, thermal resolution).
As will be explained in Section 3.3, the size of a resolution element in the targetplane can be larger than the target size. In such a case, the target will only be rep-resented by one pixel and in fact represents the situation of a nonimaging system.Figure 3.4 schematically shows how an image is built up by a modern focal planearray (FPA) IR imager. The focal plane is projected in space by the front optics, creat-ing an imaginary 2D grid of detectors over the target. The size of the projected detec-tor area (pixel) in the target plane depends on the size of the FPA (number ofdetectors), the IFOV, and the range to the target. The radiation incident at each detec-tor depends on the irradiance of the projected detector area on the target, atmosphericattenuation (including countermeasures), and spectral filter and system optics.
The incident radiation on the detector is converted to a voltage output.The output of all detectors is connected to a display, which converts voltages togray levels as is schematically shown in Fig. 3.5. As shown before, a surfaceemits radiation proportional to T4. Consequently, a hot surface generates ahigher detector output voltage than a colder surface. Normally, a black-and-white image is created in which white corresponds to hot and black to cold.
In Chapter 6, a calibration procedure is outlined, using two blackbodies ofknown temperature within the image (generating two gray levels) to calibratethe entire image in terms of radiation or apparent temperatures.
Figure 3.4 Image formation using a focal plane array (FPA).
20 Chapter 3

Chapter 4
Theory of Heat andMass Transfer
This chapter is devoted to the physical characterization of the various processesthat determine the apparent emittance Eap of targets and backgrounds. For thispurpose, the problem is split into two parts:
(1) the conduction of heat within the target, and(2) the heat exchange in the surface atmospheric boundary layer.
It is emphasized that parameters will not be discussed at full length. Discussionwill be limited to the functional relations between parameters and the definitionof practical usable expressions. Therefore, the origin of these parameters areonly given limited attention. To be able to evaluate the behavior of DEap in atheoretical model for a given situation, it is necessary to determine:
(1) the physical processes involved in creating a radiation contrast;(2) the parameterization of these processes;(3) the relative importance of these parameters (sensitivity analysis); and(4) the availability and required accuracy of these parameters for model input.
The latter has no particular meaning in a theoretical survey as such, but in the end itdetermines the practical usefulness (and validation possibilities) of the model.
4.1 Surface-Atmospheric Boundary Layer
If a target is exposed to outdoor environmental conditions, a number of heat andmass transfer (transport) mechanisms, Q(i), take place inside the target and atthe target-surface-atmospheric boundary (Fig. 4.1).
The contribution of each process to the total heat budget depends on the pre-vailing meteorological conditions and physical properties of the target. Theexchange of energy can be broken down into the following processes:
Q(1): absorbed shortwave irradiance (l � 3 mm);Q(2): absorbed long wave irradiance (l . 3 mm);Q(3): convective heat exchange;
29
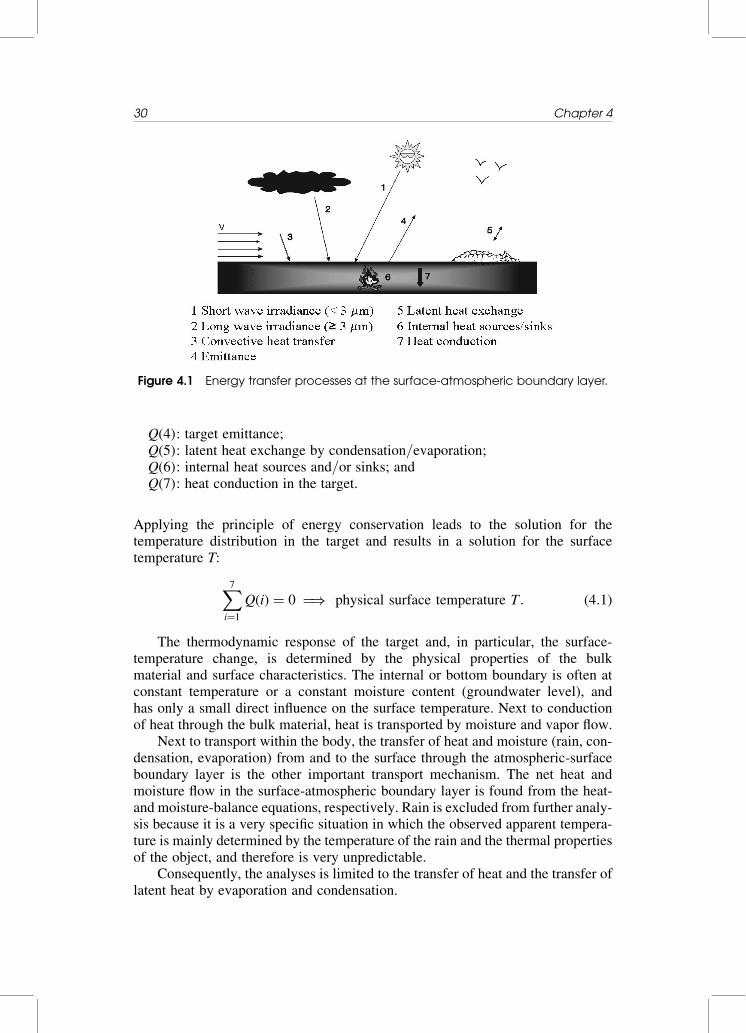
Q(4): target emittance;Q(5): latent heat exchange by condensation/evaporation;Q(6): internal heat sources and/or sinks; andQ(7): heat conduction in the target.
Applying the principle of energy conservation leads to the solution for thetemperature distribution in the target and results in a solution for the surfacetemperature T:
X7i¼1
Q(i) ¼ 0 ¼) physical surface temperature T: (4:1)
The thermodynamic response of the target and, in particular, the surface-temperature change, is determined by the physical properties of the bulkmaterial and surface characteristics. The internal or bottom boundary is often atconstant temperature or a constant moisture content (groundwater level), andhas only a small direct influence on the surface temperature. Next to conductionof heat through the bulk material, heat is transported by moisture and vapor flow.
Next to transport within the body, the transfer of heat and moisture (rain, con-densation, evaporation) from and to the surface through the atmospheric-surfaceboundary layer is the other important transport mechanism. The net heat andmoisture flow in the surface-atmospheric boundary layer is found from the heat-and moisture-balance equations, respectively. Rain is excluded from further analy-sis because it is a very specific situation in which the observed apparent tempera-ture is mainly determined by the temperature of the rain and the thermal propertiesof the object, and therefore is very unpredictable.
Consequently, the analyses is limited to the transfer of heat and the transfer oflatent heat by evaporation and condensation.
Figure 4.1 Energy transfer processes at the surface-atmospheric boundary layer.
30 Chapter 4

4.2 Heat and Mass Transfer
The transport of mass and heat within a body is given by the continuity equationand the energy equations, which can vary from quite simple for a solid material tovery complex for a porous material, including the flow of moisture and transport oflatent heat. In a mathematical model, the system of material and the atmosphereabove it is divided into layers. The surface temperature of the material (of maininterest in this context) is predicted by determining the transfer of energy andmass in, out, and through the body (considered to be a series of layers with constantproperties).
A basic assumption that is often made is that the layers are horizontallyuniform and the thickness of a layer is much smaller than its horizontal extent.These conditions imply that the most significant heat fluxes are vertical. Thus,the estimated temperature results from solving the one-dimensional (1D) equationsfor heat and mass transfer. For the heat flow in a solid material with constantproperties, no transport of mass takes place and the model equations take arather simple form that can be solved straightforwardly (numerically) withoutmuch difficulty.
The 1D equation for the transport of heat for this case is
@T(z, t)
@t¼ k
@2T(z, t)
@z2þ Qsource(z1 � z � z2), (4:2)
where k ¼lc
rC: the thermal diffusivity (m2 s21),
and lc: thermal conductivity (W m21 K21),r: specific mass (kg m23),C: specific heat (J kg21 K21),t: time (s),z: axis ? surface (m),
Qsource: internal heat source (K s21).
The boundary condition at the top (atmospheric side) of the solid, z ¼ z1, is givenby the net heat flow into or from the solid, which is a result of the heat-transferprocesses Q(t) in the atmospheric-surface boundary layer. These processes arebe discussed in more detail in Section 4.3.
The flow of heat at the top surface going into the solid (positive z-direction) is
�lc@T
@z
� �z¼z1
¼ Q(t) (W m�2):
The other boundary condition at z ¼ z2 is defined at some depth in the solid, atwhich the temperature or heat flow is known. For instance, the boundary tempe-rature To is constant in time. Another possibility is to assume a constant heatflux Fo over the boundary, for instance, an inside wall of a room kept at constant
Theory of Heat and Mass Transfer 31

temperature. In mathematical form,
T(z2, t) ¼ To or +lc ¼@T
@z
� �z¼z2
¼ Fo:
The initial (t � to) condition is a uniform, constant temperature distribution,Tc, in the system, that is
T(z, t) ¼ Tc (z1 � z � z2 ^ t � to):
For many materials with constant physical properties, values for lc, r and Ccan be found in literature.1 However, when consulting the literature, it is some-times discouraging to find many different values for the same type of material,implying that detailed information about material constituents and their propertiesis required.
Several computer models are available for solving the equations for variousgeometrical configurations and different weather conditions.2,3
For porous materials, like some soil types, insulatingmaterials (glass-wool), etc.,the transport of water and water vapor, associated with a transport of latent heat, mustbe considered. For such porous materials, the formulation of the mathematics in themodel becomes more complex, taking the form of a system of two combined differ-ential equations for moisture and heat flow with nonlinear coefficients.4 In this case,the equation for 1D moisture flow look like:
@Q
@t¼
@
@zDT
@T
@zþ DQ
@Q
@zþ kh
� �(z1 � z � z2),
and for heat flow,
Cv
@T
@t¼
@
@zKT
@T
@zþ KQ
@Q
@zþ khrmhm
� �(z1 � z � z2),
where Q: moisture content (cm3 cm23),rm : density of water (kg m23),hm : specific enthalpy of water (J kg21),Cv : volume-averaged heat capacity (J K21 m23),kh : hydraulic conductivity (m s21),DT, DQ and KT, KQ: nonlinear transport coefficients.
The boundary condition at the top surface at z ¼ z1 for heat flow is
Q(z1; t) ¼ KT
@T
@zþ KQ
@Q
@zþ khrmhm,
and for moisture flow is,
e(z1; t) ¼ DT
@T
@zþ DQ
@Q
@zþ kh:
32 Chapter 4

Chapter 6
Infrared Calibration Procedures
For many disciplines within the infrared region, such as sensor development andassessment, camouflage efficiency, or detection probability evaluation and model-ing, absolute radiance values (intrinsic apparent or radiometric temperatures) oftarget and background must be known. Figure 6.1 shows the detection chainagain, indicating various calibration steps.
The following calibration types can be distinguished.
(1) Calibration of the sensor system:(a) A first intermediate step is to relate target and background radiationcontrast DEap to the apparent radiation DEdet
ap , which is incident on thedetector. This relation is described by the function h as DEdet
ap � h(DEap).(b) In a second step, the detector output voltage, DVdet, is related to thedetector incident radiation by the function f, better known as the system-relative spectral response R(l), as DVdet � f (DEdet
ap ).(2) Calibration of the collected data:
(a) The final step in a data-acquisition process most frequently is animaging device (TV screen or computer monitor) in combination with arecording device (tape recorder and/or hard disk). This relationbetween detector output voltage and the display or recording device,the gray level (Gimage) is described by the function g asGimage � g(DVdet).
For infrared data to be called absolute or calibrated, at least two requirements haveto be fulfilled.
(1) The radiance L or the apparent temperature Tap of any given surface area onthe target in the real world must be retrievable from the collected data. So,the relation between a gray level in an image (or the detector voltage of aradiometer) and the intrinsic (i.e., in the target plane) radiation E of asurface area on the target must be known. The physical surface temperatureof the target area can be calculated if the emission coefficient is known.
(2) The geometry of the measurement setup must be known. In other words,the relation between the pixel size in the image or radiometer spot and theactual measurement area on the target, i.e., the projected detector area,must be known. Among others, this implies that accurate sensor-to-target range information is necessary.
79
Chapter 7
Infrared SignatureCharacterization
In the previous chapters, parameters related to targets, backgrounds, sensorsystems, and atmosphere have been discussed. Information on these parametersmust be obtained
. to validate model calculations,
. to determine detection and especially identification clues on the target,
. to train automatic target recognizers (ATR),
. to develop countermeasures,
. for design purposes, and
. as input for simulation models (operational research).
7.1 Target Signatures
Two types of signatures are of interest:
(1) Signatures taken from close rangeThis type of signature mainly is used to study the target signature as such,that is, to study the radiance distribution over the target. This type of sig-nature data generally is used to validate the predictions of theoreticalmodels or to develop target signature reduction methods (thermal camou-flage). To be able to retrieve intrinsic target data, calibrated images with ahigh spatial and temperature resolution are needed, preferably taken atclose range. Also, a recording of detailed weather information is required.
(2) Signatures taken from far rangeThis type of signature is used to study target signatures in relation to back-ground signatures, that is, to investigate the behavior of the target contrast.Signatures can be taken for targets in motion or in static positions. Dataoften are used in relation to target detection (recognition) and to studythe efficiency of thermal camouflage in relation to background clutter.This type of signature need not necessarily be calibrated, because thecontrast as such is of main importance.
99