
The$effect$of$DNAsupercoilingon$transcription$initiation ...
47
The effect of DNA supercoiling on transcription initiation at the glnAp2 promoter Honors Thesis Presented to Brandeis University Biological Physics Program Jeff Gelles, Advisor In Partial Fulfillment of the Requirements for the Degree Bachelors of Science in Biological Physics by Abby Knecht May 2015
Transcript of The$effect$of$DNAsupercoilingon$transcription$initiation ...
The effect of DNA supercoiling on transcription initiation at the glnAp2 promoter
Honors Thesis
Presented to
Brandeis University Biological Physics Program
Jeff Gelles, Advisor
In Partial Fulfillment of the Requirements for the Degree
Bachelors of Science
in Biological Physics
by
Abby Knecht
May 2015
1
Copyright by
Abigail Knecht
© 2015
2
Abstract: A quantitative kinetic mechanism for transcription initiation at the bacterial
promoter glnAp2 was previously determined using single molecule experiments
with relaxed DNA. DNA in E. Coli cells, however, is rarely relaxed but is instead
negatively supercoiled. Bulk experiments in the literature report a 10 to 60 times
increase in the overall rate of transcription initiation at the glnAp2 promoter with
negatively supercoiled DNA compared to relaxed DNA. To locate where in the
mechanism this increase in rate occurs, I created circular DNA that contained the
glnAp2 promoter, biotin for attachment to a microscope slide, and a dye for
visualization. Initiation was then measured using single molecule techniques on
both nicked and negatively supercoiled forms of this template. The overall rate of
transcription initiation was seven times faster on negatively supercoiled DNA
compared to on nicked DNA. The rate of RNA polymerase binding, however, was
only 1.5 times faster on supercoiled DNA, and the rate of open complex decay on the
supercoiled and nicked templates was not significantly different. Initial experiments
on the RNA polymerase closed complexes suggest that their stability on negatively
supercoiled and nicked templates is not very different. Based on those results, I
hypothesize that isomerization from closed to open complex is most likely the step
in the mechanism that accounts for the difference in overall rate of transcription
initiation between relaxed and supercoiled DNA.
3
Table of Contents:
Chapter 1 – Introduction
Supercoiling Theory
Transcription Initiation
TIRF Microscopy
Supercoiling and Transcription Initiation
Chapter 2 – Synthesis of Circular Transcription Templates
Results
Digesting pJES534
Assembling Dye/Biotin Fragment
First Ligation
Determining the Circular Template
Nicking and purification of the circular template
Second Ligation and Gyrase Reaction
No promoter Circular Templates
Calculations
Materials and Methods
DNA plasmids and oligonucleotides
Enzymes
Labeling the oligonucleotide
Chapter 3 – Transcription Initiation Mechanism
Results
Specificity of Initiation
4
Overall rate of initiation
Rate of first binding of RNAP
Closed Complexes
Open complex dissociation
Materials and Methods
TIRF Microscope and Slide Preparation
Solutions
Fit Equations
Chapter 4 – Discussion
References
5
List of Figures
Chapter 1 – Introduction
Figure 1.1: DNA Supercoiling – Linking Number, Twist, and Writhe
Figure 1.2: TIRF Microscope
Chapter 2 – Synthesis of the Circular Transcription Templates
Figure 2.1: Overall procedure for constructing the Nicked and Supercoiled
Templates
Figure 2.2: Restriction Fragment
Figure 2.3: Labeling and Annealing the Dye/Biotin Fragment
Figure 2.4: First Ligation
Figure 2.5: Testing for the circular template with Gyrase and Nt.AlwI
Figure 2.6: Nicking Digest and Gyrase Reaction
Figure 2.7: Circular Templates with and without a promoter
Chapter 3 – Transcription Initiation Mechanism
Figure 3.1: Testing transcription initiation using the circular templates
Figure 3.2: Tracing intensity of labeled probe
Figure 3.3: Transcription initiation fraction on different circular templates.
Figure 3.4: Rates of transcription initiation and 𝜎!"-‐RNAP binding
Figure 3.5: Closed Complex Dwell Times
Figure 3.6: Dissociation of the Open Complex
Chapter 4 – Discussion
Figure 4.1: Mechanism of Transcription Initiation for 𝜎!"-‐RNAP on Circular
DNA
6
Chapter 1: Introduction
Supercoiling Theory
DNA is commonly portrayed as a linear double helix, but DNA is not linear
and relaxed in the cell. DNA in cells is supercoiled, either in bacterial plasmids, or in
chromosomal DNA both in bacteria and eukaryotes (Mirikin 2002). Supercoiling
occurs when the DNA double helix is either tightened (known as positive
supercoiling) or loosened (known as negative supercoiling). In cells, chromosomal
DNA is negatively supercoiled both so it can fit into the cell and so that proteins can
more easily bind to the DNA and dehybridize the hydrogen bonds between base
pairs (Watson 2007).
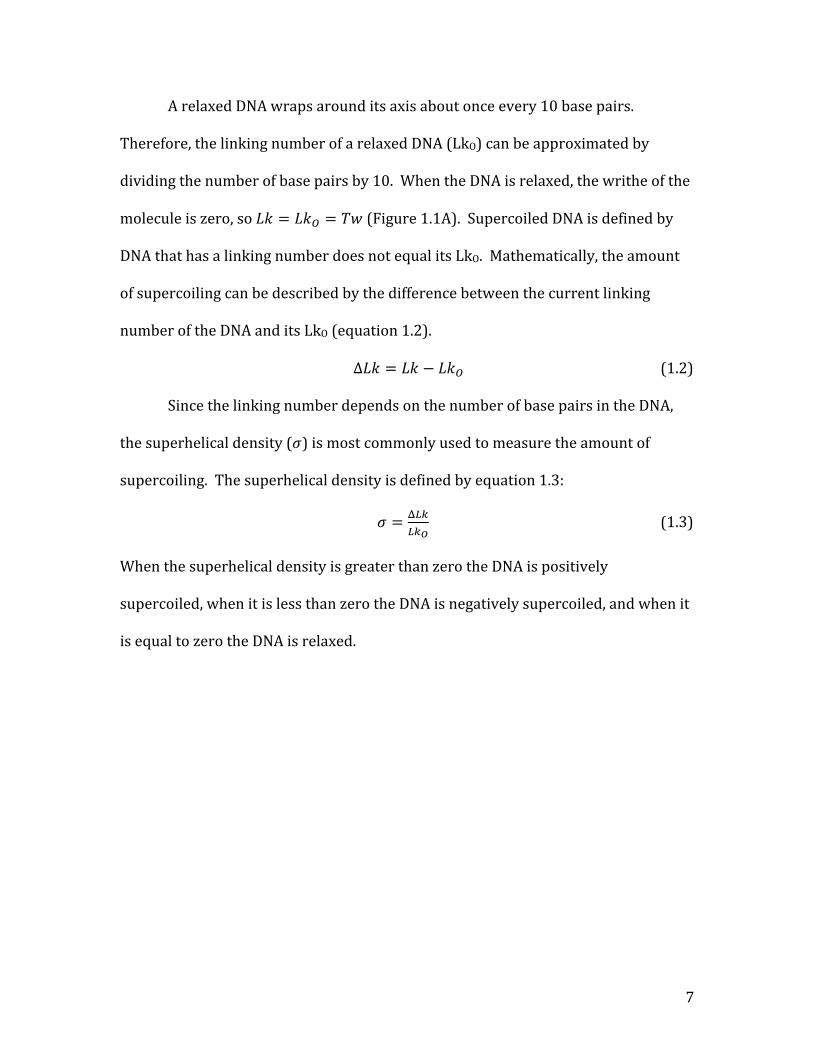
Supercoiling can mathematically be described with three variables: linking
number (Lk), twist (Tw), and writhe (Wr). When a closed circular piece of DNA is
flattened, as it is in Figure 1.1A, the linking number is defined by the number of
times one strand of the DNA crosses over the other strand (Mirkin 2002). As such,
the linking number is always an integer. The twist is defined as the total number of
helical turns in the circular DNA. The writhe describes the 3D shape of the DNA. It
is defined by the number of times the long axis of the DNA crosses over itself
(Watson 2007). Writhe presents itself as either a plectoneme (Figure 1.1B, the
figure eight shape in) or a toroid and can be either greater than, less than, or equal
to zero (Marko and Neukirch 2012). These quantities are related by the simple
equation:
𝐿𝑘 = 𝑇𝑤 +𝑊𝑟 (1.1)
7
A relaxed DNA wraps around its axis about once every 10 base pairs.
Therefore, the linking number of a relaxed DNA (LkO) can be approximated by
dividing the number of base pairs by 10. When the DNA is relaxed, the writhe of the
molecule is zero, so 𝐿𝑘 = 𝐿𝑘! = 𝑇𝑤 (Figure 1.1A). Supercoiled DNA is defined by
DNA that has a linking number does not equal its LkO. Mathematically, the amount
of supercoiling can be described by the difference between the current linking
number of the DNA and its LkO (equation 1.2).
Δ𝐿𝑘 = 𝐿𝑘 − 𝐿𝑘! (1.2)
Since the linking number depends on the number of base pairs in the DNA,
the superhelical density (𝜎) is most commonly used to measure the amount of
supercoiling. The superhelical density is defined by equation 1.3:
𝜎 = !!"!"! (1.3)
When the superhelical density is greater than zero the DNA is positively
supercoiled, when it is less than zero the DNA is negatively supercoiled, and when it
is equal to zero the DNA is relaxed.
8
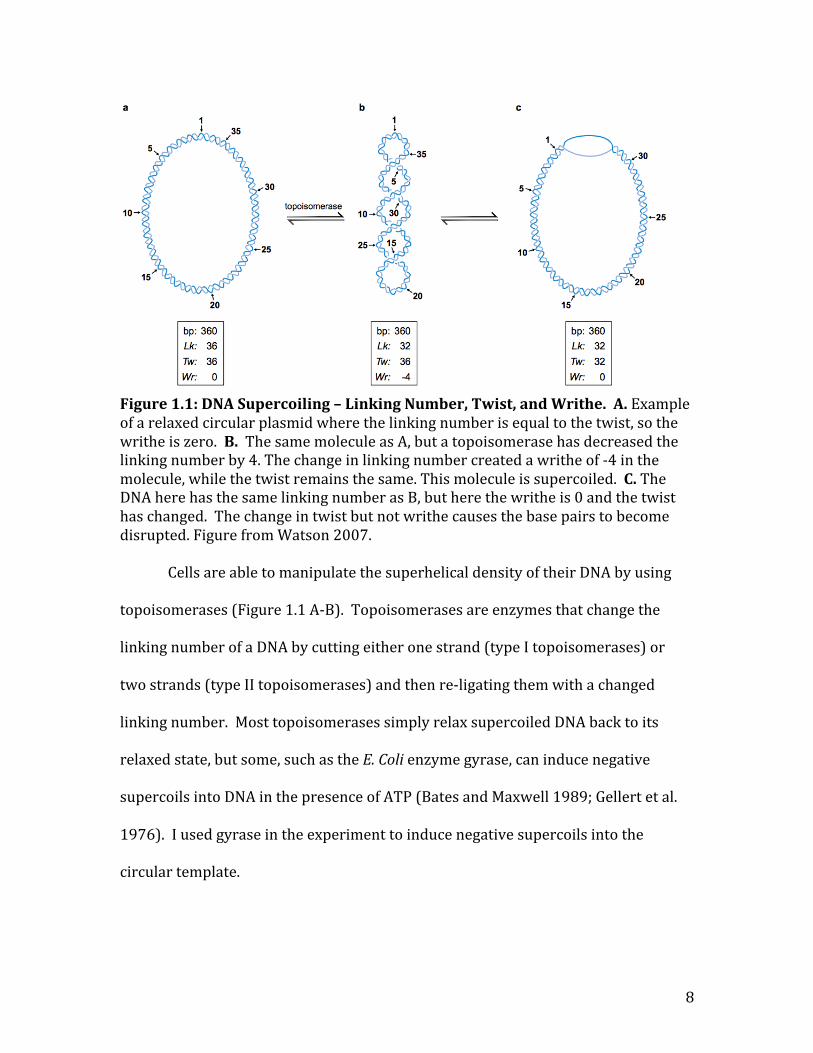
Figure 1.1: DNA Supercoiling – Linking Number, Twist, and Writhe. A. Example of a relaxed circular plasmid where the linking number is equal to the twist, so the writhe is zero. B. The same molecule as A, but a topoisomerase has decreased the linking number by 4. The change in linking number created a writhe of -‐4 in the molecule, while the twist remains the same. This molecule is supercoiled. C. The DNA here has the same linking number as B, but here the writhe is 0 and the twist has changed. The change in twist but not writhe causes the base pairs to become disrupted. Figure from Watson 2007. Cells are able to manipulate the superhelical density of their DNA by using
topoisomerases (Figure 1.1 A-‐B). Topoisomerases are enzymes that change the
linking number of a DNA by cutting either one strand (type I topoisomerases) or
two strands (type II topoisomerases) and then re-‐ligating them with a changed
linking number. Most topoisomerases simply relax supercoiled DNA back to its
relaxed state, but some, such as the E. Coli enzyme gyrase, can induce negative
supercoils into DNA in the presence of ATP (Bates and Maxwell 1989; Gellert et al.
1976). I used gyrase in the experiment to induce negative supercoils into the
circular template.

9
Transcription Initiation
Transcription is the process by which a gene is copied by the enzyme RNA
polymerase (RNAP) into a single strand of RNA. Transcription consists of three
main parts: initiation, elongation, and termination (Weaver 2012). Transcription
initiation is where an RNAP finds a certain sequence in the DNA before the
beginning of the gene, known as the promoter, and opens the DNA to form an open
complex. Elongation occurs just after initiation when the RNAP creates the RNA by
hybridizing nucleotides to the DNA. When the RNA polymerase has finished
transcribing the gene, it dissociates from the DNA in a process known as
termination.
Here I studied transcription initiation in vitro using proteins from E. Coli. The
RNA polymerase holoenzyme in bacteria consists of the RNA polymerase core and a
specificity subunit called a sigma (𝜎) factor. Depending on the promoter involved, a
specific 𝜎 factor is needed for the RNAP to begin transcribing. The 𝜎!" factor that I
study here is responsible for activating transcription on genes that are needed for
Nitrogen metabolism in E. Coli as well as other functions (Mauri and Klumpp 2014,
Weaver 2012). Unlike some other sigma factors in E. Coli, the 𝜎!" RNAP
holoenzyme is unable to initiate transcription on its own and is in need of an
activator (Wedel and Kustu 1995). The well-‐established activator for the glnAp2
promoter is NtrC (nitrogen regulating protein C). NtrC hydrolyzes ATP or GTP to
couple the energy involved in hydrolyzation to open the DNA at the promoter
forming the open complex (Wedel and Kustu 1995).
10
TIRF Microscopy
Transcription is a very dynamic process with proteins binding quickly and
then dissociating. While bulk experiments can be elusive in determining overall
rates, single molecule experiments are more useful in determining the
heterogeneity of the dynamic process. The single molecule experiments I use here
are with total internal reflection fluorescence (TIRF) microscopy. TIRF microscopy
reduces background fluorescence by only exciting approximately 100-‐nm above the
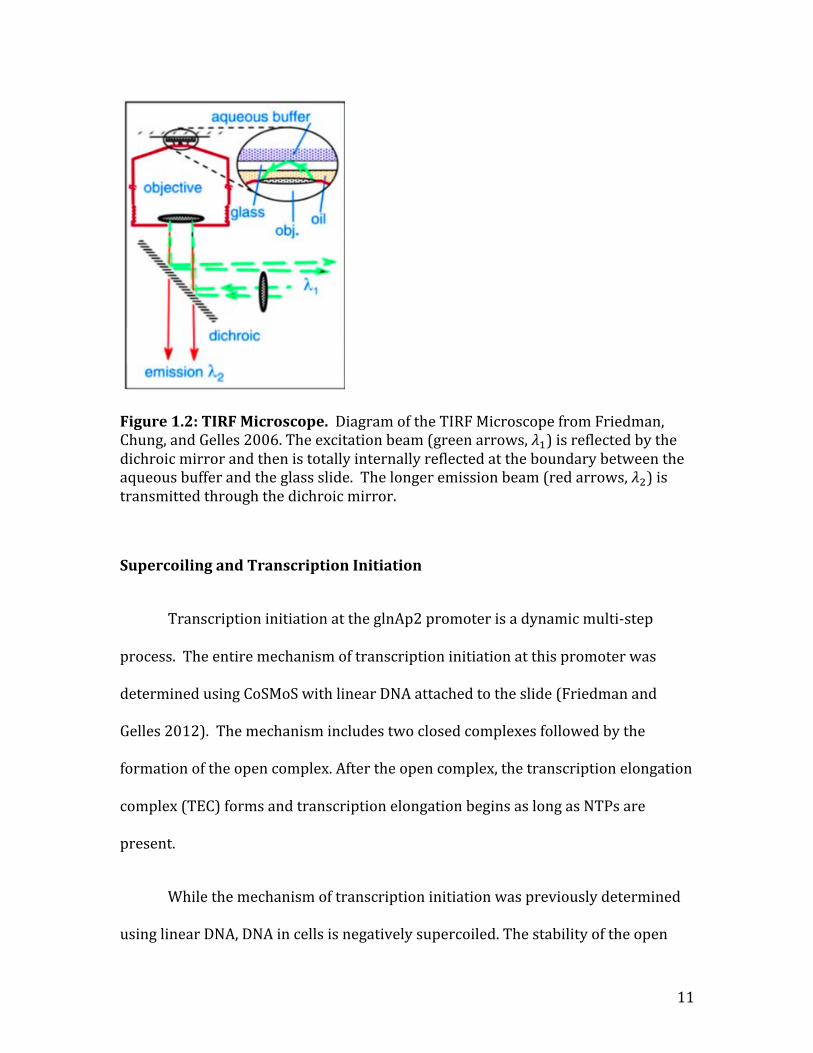
surface of the glass slide (Friedman, Chung, and Gelles 2006). The TIRF microscope
used in my project can simultaneously excite the sample at multiple wavelengths by
spatially separating the excitation and emission beams (Figure 1.2, Friedman,
Chung, and Gelles 2006). With the ability to simultaneously excite multiple
wavelengths, the TIRF microscope can be used to study single molecules interacting
using CoSMoS (Co-‐localization single-‐molecule spectroscopy) (Friedman and Gelles
2012).
11
Figure 1.2: TIRF Microscope. Diagram of the TIRF Microscope from Friedman, Chung, and Gelles 2006. The excitation beam (green arrows, 𝜆!) is reflected by the dichroic mirror and then is totally internally reflected at the boundary between the aqueous buffer and the glass slide. The longer emission beam (red arrows, 𝜆!) is transmitted through the dichroic mirror.
Supercoiling and Transcription Initiation
Transcription initiation at the glnAp2 promoter is a dynamic multi-‐step
process. The entire mechanism of transcription initiation at this promoter was
determined using CoSMoS with linear DNA attached to the slide (Friedman and
Gelles 2012). The mechanism includes two closed complexes followed by the
formation of the open complex. After the open complex, the transcription elongation
complex (TEC) forms and transcription elongation begins as long as NTPs are
present.
While the mechanism of transcription initiation was previously determined
using linear DNA, DNA in cells is negatively supercoiled. The stability of the open
12
complex for the 𝜎!" RNAP changes depending on whether it forms on negatively
versus positively supercoiled DNA (Revyakin, Ebright, and Strick 2004). There is
also evidence that the formation of the 𝜎!" RNAP open complex peaks at a
superhelical density of -‐0.024, while the 𝜎!" RNAP peaks at -‐0.067, showing that
transcription initiation depends on supercoiling for both RNA polymerases
(Whitehall, Austin, and Dixon 1992). Bulk experiments similarly determined that
the overall rate of initiation at the glnAp2 promoter is 10 to 60 times faster on
negatively supercoiled DNA compared to relaxed DNA (Schulz, Langowski, and
Rippe 2000). However they give no indication of where this increase in rate occurs
in the multi-‐step process of transcription initiation.
The goal of my experiments was to determine the mechanism of
transcription initiation on supercoiled DNA at the glnAp2 promoter. There were
two main parts of my project. I first created a circular, supercoiled piece of DNA
that could be attached the microscope slide using biotin, had a fluorescent dye
attached, and had the sequences necessary for transcription initiation and
elongation. After the circular template was completed, I performed single molecule
TIRF microscope experiments to determine the mechanism of transcription
initiation using the supercoiled DNA.
13
Chapter 2: Synthesis of Circular Transcription Templates
Results
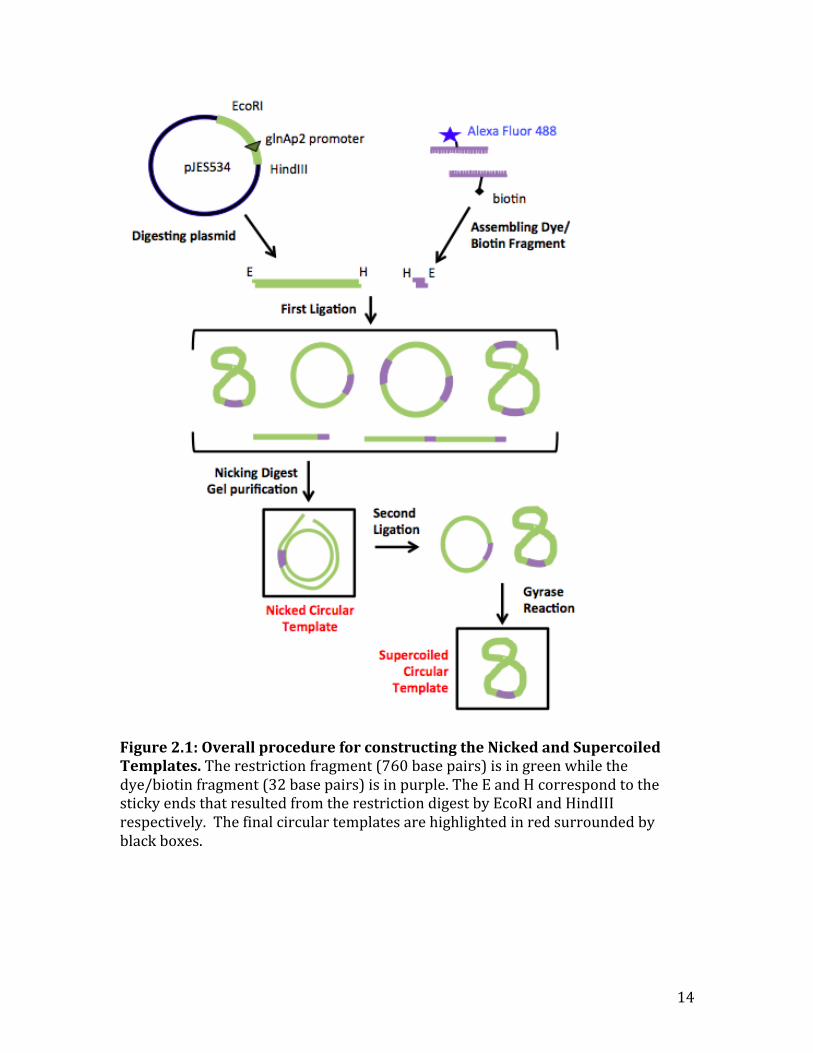
In order to perform TIRF experiments to determine where in the mechanism
supercoiled DNA transcribed faster, I had to first construct a supercoiled circular
template. The template needed to have the necessary sequences for transcription
initiation and elongation for a 𝜎!" RNAP, a fluorescent dye to be visualized in the
microscope, and a biotin moiety to attach the template to a streptavidin-‐coated
microscope slide. The construction of the circular template was similar to that of
Kalkbrenner et al. (Kalkbrenner, Arnold, and Tans 2009). In summary (Figure 2.1),
the sequences for transcription initiation were isolated as a restriction fragment of a
stock plasmid and then ligated with a synthesized oligonucleotide containing the
biotin and fluorescent dye (dye/biotin fragment). The correct circular template
was then purified from the ligation reaction. After purification, the circular template
was supercoiled using the enzyme gyrase.
14
Figure 2.1: Overall procedure for constructing the Nicked and Supercoiled Templates. The restriction fragment (760 base pairs) is in green while the dye/biotin fragment (32 base pairs) is in purple. The E and H correspond to the sticky ends that resulted from the restriction digest by EcoRI and HindIII respectively. The final circular templates are highlighted in red surrounded by black boxes.
15
Digesting pJES534
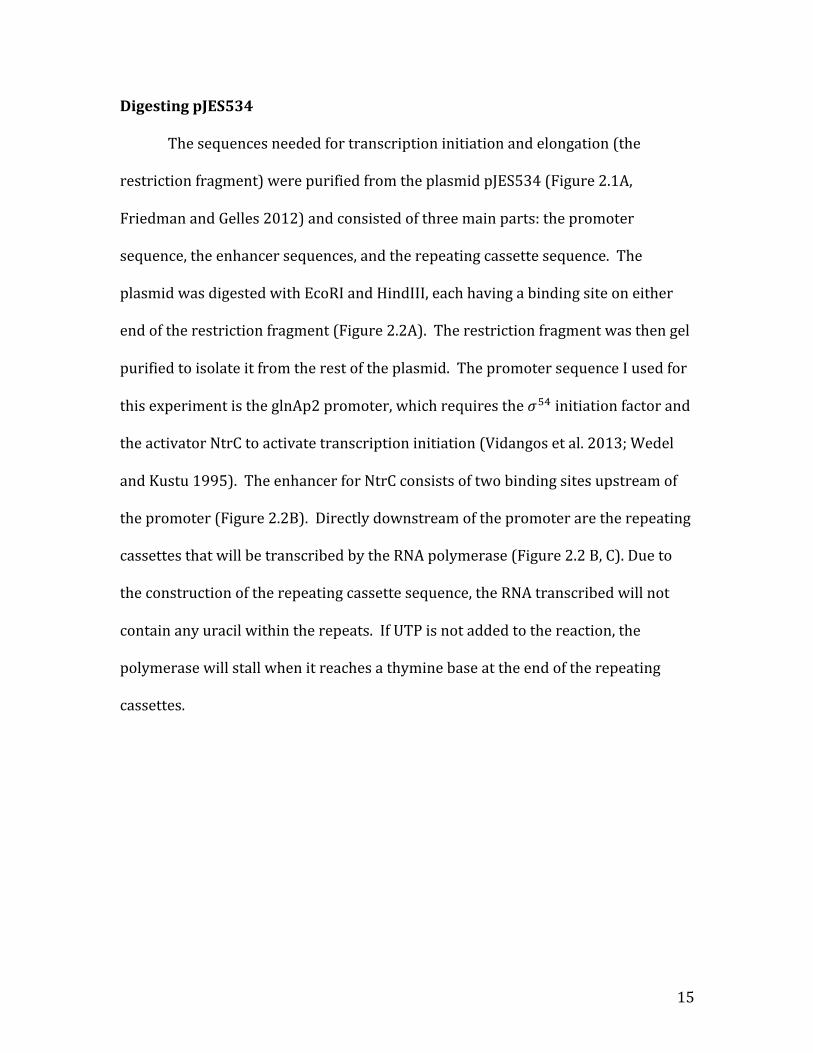
The sequences needed for transcription initiation and elongation (the
restriction fragment) were purified from the plasmid pJES534 (Figure 2.1A,
Friedman and Gelles 2012) and consisted of three main parts: the promoter
sequence, the enhancer sequences, and the repeating cassette sequence. The
plasmid was digested with EcoRI and HindIII, each having a binding site on either
end of the restriction fragment (Figure 2.2A). The restriction fragment was then gel
purified to isolate it from the rest of the plasmid. The promoter sequence I used for
this experiment is the glnAp2 promoter, which requires the 𝜎!" initiation factor and
the activator NtrC to activate transcription initiation (Vidangos et al. 2013; Wedel
and Kustu 1995). The enhancer for NtrC consists of two binding sites upstream of
the promoter (Figure 2.2B). Directly downstream of the promoter are the repeating
cassettes that will be transcribed by the RNA polymerase (Figure 2.2 B, C). Due to
the construction of the repeating cassette sequence, the RNA transcribed will not
contain any uracil within the repeats. If UTP is not added to the reaction, the
polymerase will stall when it reaches a thymine base at the end of the repeating
cassettes.
16
Figure 2.2 Restriction Fragment. A. Plasmid pJES534 with the EcoRI and HindIII restriction sites labeled. The green segment is the restriction fragment that is gel purified. B. The restriction fragment after it is purified. The locations of the enhancer sequences, promoter sequence, and repeating cassette sequence are shown in their respective locations. C. The sequence of a single cassette. The repeating cassettes consisted only of A, C, and G NTPs.
Assembling Dye/Biotin Fragment
To create the dye/biotin fragment, two different synthetic oligonucleotides
were annealed together (Figure 2.3A). Initially, one of the oligonucleotides
contained biotin and the other that had an amine attached. Since I wanted to create
a circular template, the biotin and the fluorescent dye had to be attached in the
middle of the oligonucleotide, as attaching it at the ends would make it impossible to
close the circle. In addition, I was worried that kinks in the circular template from a
missing base that would interfere with the supercoiling of the circular templates.
Instead the oligonucleotides were ordered with the dye and biotin attached to a
thymine base so that none of the base pairs would be disrupted in the final circular
17
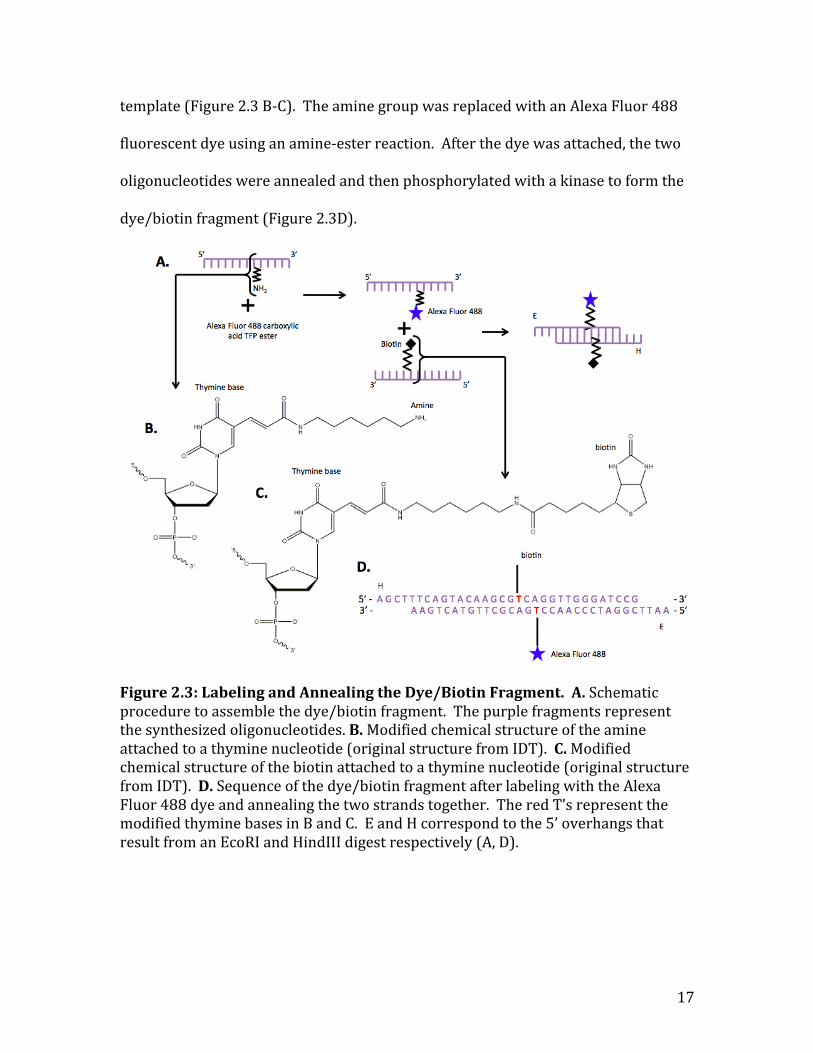
template (Figure 2.3 B-‐C). The amine group was replaced with an Alexa Fluor 488
fluorescent dye using an amine-‐ester reaction. After the dye was attached, the two
oligonucleotides were annealed and then phosphorylated with a kinase to form the
dye/biotin fragment (Figure 2.3D).
Figure 2.3: Labeling and Annealing the Dye/Biotin Fragment. A. Schematic procedure to assemble the dye/biotin fragment. The purple fragments represent the synthesized oligonucleotides. B. Modified chemical structure of the amine attached to a thymine nucleotide (original structure from IDT). C. Modified chemical structure of the biotin attached to a thymine nucleotide (original structure from IDT). D. Sequence of the dye/biotin fragment after labeling with the Alexa Fluor 488 dye and annealing the two strands together. The red T’s represent the modified thymine bases in B and C. E and H correspond to the 5’ overhangs that result from an EcoRI and HindIII digest respectively (A, D).

18
First Ligation
To create the circular template, one restriction fragment had to be attached
to one dye/biotin fragment. The dye/biotin fragment had complementary sticky
ends to the restriction fragment, which facilitated ligation of the two pieces (Figure
2.4A). As expected, the ligation did not only produce the circular template with one
restriction fragment and one dye/biotin fragment. Instead, the ligation produced
many products (some possible products are depicted in Figure 2.4B-‐G). Figure 2.4H
shows the products of the first ligation.
Figure 2.4: First Ligation. A. Cartoon of the two reactants in the first ligation. The restriction fragment (in green) and the dye/biotin fragment (in purple) were ligated together in a 1:1.5 ratio. B -‐ G. Products that could have been formed during the first ligation. Products B-‐D contain two restriction fragments. I hypothesize that they should run in the 1.5-‐2 kb range on an agarose gel. Products E-‐G contain only one restriction fragment. Theoretically they should run around the 1 kb range on an agarose gel. H. Agarose gel electrophoresis of the first ligation (imaged by Alexa Fluor 488 fluorescence). Bands 1-‐5 were excised for subsequent use. The numbers to the left of the gel represent the positions of the 1kb ladder for this gel.
19
Determining the Circular Template
By utilizing how topoisomers run on an agarose gel, the identity of the bands
in Figure 2.4H could be determined. On an agarose gel, an open circle, a linear DNA,
and a highly supercoiled circle of the same length will run differently. A nicked or
open circle runs the slowest, while a highly supercoiled circle will run the fastest.
The linear DNA as well as the other topoisomers of the same length will run
somewhere between the open circle and the highly supercoiled circle (Keller 1975).
As such, the circular template (Figure 2.4F) and its topoisomers (Figure 2.4G)
should run close to the position of the linear template (Figure 2.4E) on the gel.
In Figure 2.4 H there are 4 bands that are close to the position of the linear
template on the gel (at 800 base pairs). To determine if these were topoisomers of
the circular template (Figure 2.4G) or whether they were other linear templates
(Figure 2.4E), each band was gel extracted (Figure 2.4H, bands 1-‐4) as well as the
next highest in the gel for a control (Figure 2.4H, band 5). The extracted DNA was
tested with gyrase and the nicking enzyme Nt.AlwI to see whether they were
topoisomers of the circular template (Figure 2.4G) or linear templates (2.4E). If they
were all different linear templates, then neither the gyrase nor the nicking enzyme
would have an effect on the migration of the bands. If they were topoisomers of the
circular template on the other hand, then they would all shift to the same position
with the addition of either gyrase or Nt.AlwI.
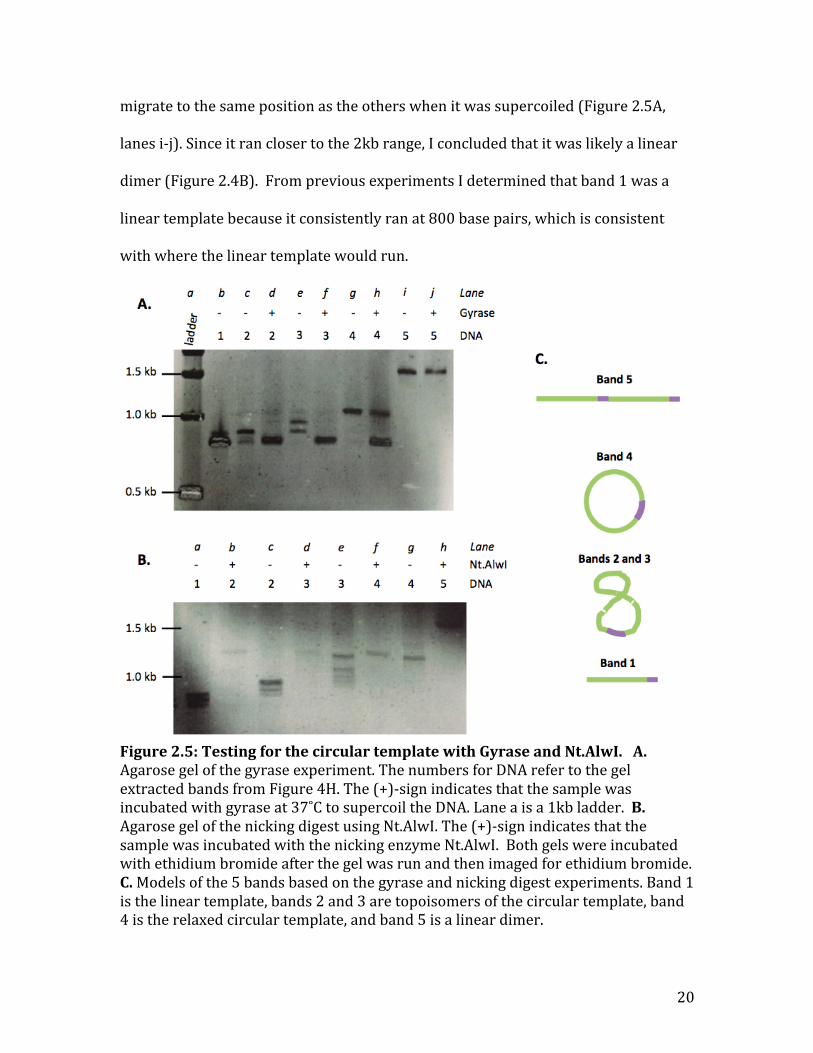
When incubated with gyrase, bands 2-‐4 migrated to the same position
(Figure 2.5A, lanes d, f, and h). This is consistent with the hypothesis that bands 2-‐4
are topoisomers of the circular template. The control, band 5, however did not
20
migrate to the same position as the others when it was supercoiled (Figure 2.5A,
lanes i-‐j). Since it ran closer to the 2kb range, I concluded that it was likely a linear
dimer (Figure 2.4B). From previous experiments I determined that band 1 was a
linear template because it consistently ran at 800 base pairs, which is consistent
with where the linear template would run.
Figure 2.5: Testing for the circular template with Gyrase and Nt.AlwI. A. Agarose gel of the gyrase experiment. The numbers for DNA refer to the gel extracted bands from Figure 4H. The (+)-‐sign indicates that the sample was incubated with gyrase at 37˚C to supercoil the DNA. Lane a is a 1kb ladder. B. Agarose gel of the nicking digest using Nt.AlwI. The (+)-‐sign indicates that the sample was incubated with the nicking enzyme Nt.AlwI. Both gels were incubated with ethidium bromide after the gel was run and then imaged for ethidium bromide. C. Models of the 5 bands based on the gyrase and nicking digest experiments. Band 1 is the linear template, bands 2 and 3 are topoisomers of the circular template, band 4 is the relaxed circular template, and band 5 is a linear dimer.
21
To confirm that bands 2-‐4 were all topoisomers of the same circular
template, I did the same experiment but incubated the extracts with the nicking
enzyme Nt.AlwI (Figure 2.5B). After the incubation with Nt.AlwI, bands 2-‐4
migrated to the same position on the agarose gel (Figure 2.5B, lanes b, d, and f).
These results confirm those from the gyrase experiment, that bands 2-‐4 are all
topoisomers of the circular template. Just as it did in the gyrase experiment, there
was no difference in the migration of band 5 with or without the nicking enzyme; it
still ran at 1.5kb (Figure 2.5B, lane h). The gyrase supercoiling experiment
combined with the nicking digest confirms that the four products near 1 kb in the
first ligation are topoisomers of the circular template (Figure 2.4G). Figure 2.5 C
gives a summary of what each of the five bands are based on the gyrase and nicking
enzyme tests.
Nicking and purification of the circular template
The next step was to purify the circular template from the first ligation
reaction. To do so, the first ligation was nicked using the Nt.AlwI enzyme and run on
a gel (Figure 2.6A, lane: First Ligation Nicked), and then the relaxed circular
template was gel purified (Figure 2.6A, lane: Nicked Circular Template). Some of the
purified nicked circular template (Figure 2.6B) was stored for a comparison to the
supercoiled DNA during the TIRF experiments, while the rest was used to make the
supercoiled circular template.
22
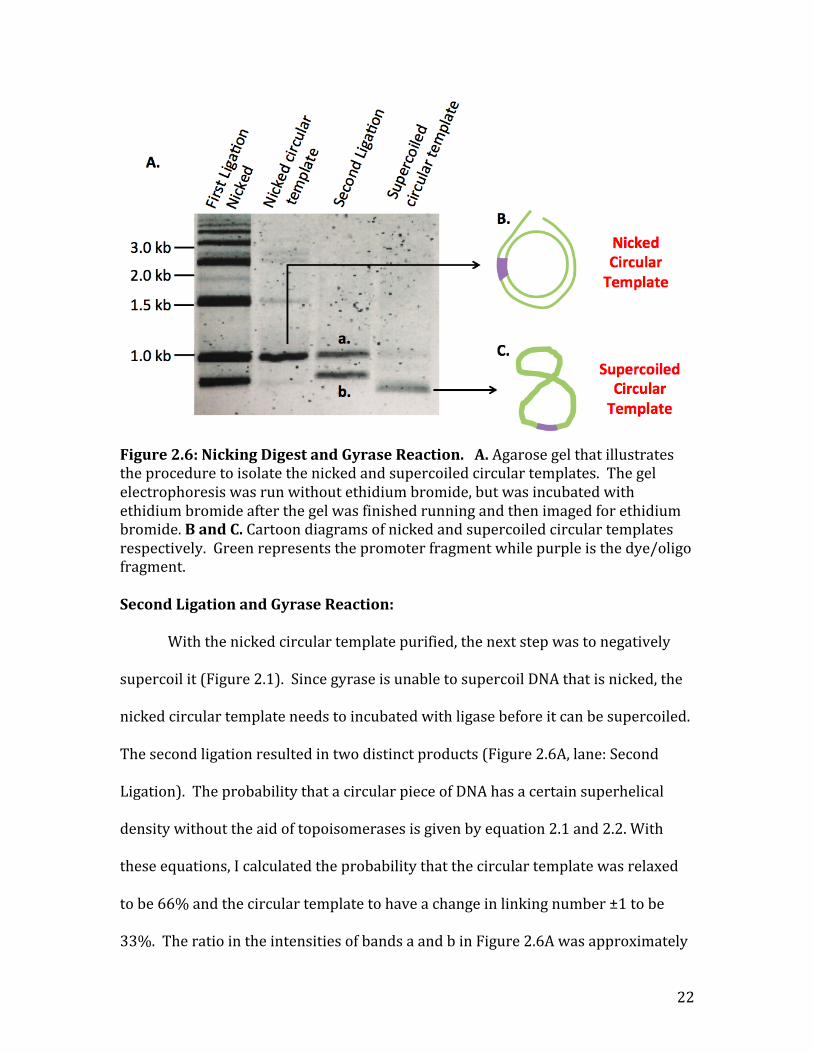
Figure 2.6: Nicking Digest and Gyrase Reaction. A. Agarose gel that illustrates the procedure to isolate the nicked and supercoiled circular templates. The gel electrophoresis was run without ethidium bromide, but was incubated with ethidium bromide after the gel was finished running and then imaged for ethidium bromide. B and C. Cartoon diagrams of nicked and supercoiled circular templates respectively. Green represents the promoter fragment while purple is the dye/oligo fragment. Second Ligation and Gyrase Reaction:
With the nicked circular template purified, the next step was to negatively
supercoil it (Figure 2.1). Since gyrase is unable to supercoil DNA that is nicked, the
nicked circular template needs to incubated with ligase before it can be supercoiled.
The second ligation resulted in two distinct products (Figure 2.6A, lane: Second
Ligation). The probability that a circular piece of DNA has a certain superhelical
density without the aid of topoisomerases is given by equation 2.1 and 2.2. With
these equations, I calculated the probability that the circular template was relaxed
to be 66% and the circular template to have a change in linking number ±1 to be
33%. The ratio in the intensities of bands a and b in Figure 2.6A was approximately

23
50:50. Despite the difference between theoretical ratio and the measured one, it is
probable that band a is the relaxed circular template and band b is the topoisomers
with a ±1 change in the linking number. Once the nicks had been removed from the
circular template by the second ligation, the circular template was incubated with
gyrase to form a negatively supercoiled circular template (Figure 2.6A, lane:
Supercoiled circular template, and 2.6C).
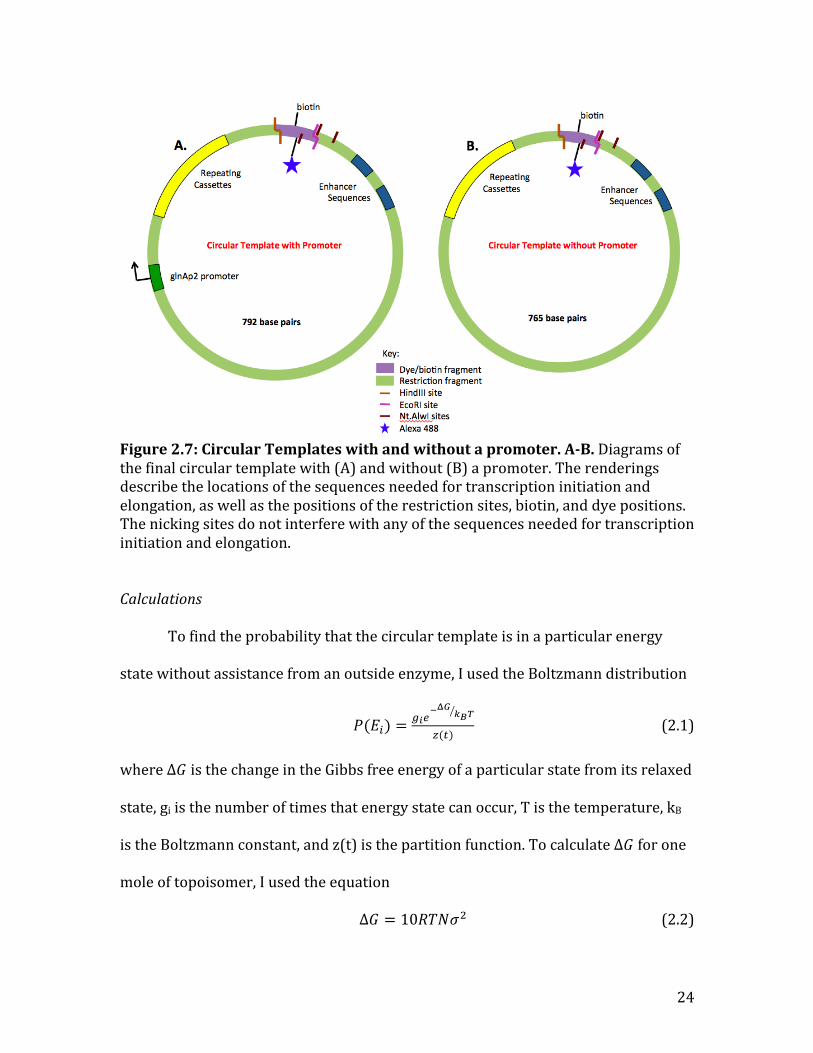
No Promoter Circular Templates
A circular template without a promoter was also prepared using the method
described above (Figure 2.1). The restriction fragment for the no promoter circular
template was isolated from a plasmid that was the same as pJES534, but it had the
glnAp2 promoter sequence (-‐1 to -‐27 with respect to the transcription start site)
removed. Otherwise, all the reactants that were used to assemble the circular
template with a promoter were used for the synthesis of the circular template
without the promoter. Figure 2.7 shows the final circular template both with the
glnAp2 promoter (A) and without the promoter (B). It also describes the locations
of the sites where Nt.AlwI nicks the DNA and the restriction digest sites for EcoRI
and HindIII.
24
Figure 2.7: Circular Templates with and without a promoter. A-‐B. Diagrams of the final circular template with (A) and without (B) a promoter. The renderings describe the locations of the sequences needed for transcription initiation and elongation, as well as the positions of the restriction sites, biotin, and dye positions. The nicking sites do not interfere with any of the sequences needed for transcription initiation and elongation. Calculations
To find the probability that the circular template is in a particular energy
state without assistance from an outside enzyme, I used the Boltzmann distribution
𝑃(𝐸!) =!!!
!!! !!!
!(!) (2.1)
where Δ𝐺 is the change in the Gibbs free energy of a particular state from its relaxed
state, gi is the number of times that energy state can occur, T is the temperature, kB
is the Boltzmann constant, and z(t) is the partition function. To calculate Δ𝐺 for one
mole of topoisomer, I used the equation
Δ𝐺 = 10𝑅𝑇𝑁𝜎! (2.2)
25
where R is the gas constant, N is the number of base pairs, and 𝜎 is the superhelical
density (Seidl and Hinz 1984). The relaxed state occurs when the superhelical
density is zero and the circular DNA is relaxed. As explained in equation 1.3, 𝜎 is
defined by Δ𝐿𝑘 𝐿𝑘!. In my experiment, the circular template is 792 base pairs (N).
For a relaxed topoisomer (Δ𝐿𝑘 = 0), Δ𝐺 = 0, and the probability that it will
occur is 66%. For a topoisomer where Δ𝐿𝑘 = ±1, Δ𝐺 = 𝑒!!.!" ≈ 0.25. In this case
since both the positive and negative supercoiled topoisomers have the same energy,
gi = 2. Therefore, the probability that the topoisomer will be supercoiled by one
turn in either the positive or negative direction is 33%. Applying the same principle
but with a Δ𝐿𝑘 = ±2, the probability is only 0.56%. Therefore it is unlikely that a
Δ𝐿𝑘 = ±2 or higher would occur without assistance from an outside source (such as
a topoisomerase).
Materials and Methods
DNA plasmids and oligonucleotides
The plasmids used to isolate the restriction fragments were pJES534 that
either contained the glnAp2 promoter or did not contain the promoter (Friedman
and Gelles 2012). The plasmids were purified using a Qiagen miniprep kit as per the
manufacturer’s instructions. The oligonucleotides were purchased from IDT with
the biotin and amine already attached as previously described (Figure 2.3 B, C).
Enzymes
The restriction endonuclease HindIII, the nicking enzyme Nt.AlwI, T4 DNA
ligase, and DNA gyrase (E. Coli) were all bought from New England Biolabs (NEB),
26
while the restriction endonuclease EcoRI was bought from Promega. During the
digest of the plasmid pJES534, EcoRI and HindIII were incubated together in the
NEB Buffer 2 at 37˚C for 1 hour as per NEB instructions. The ligation reactions were
performed using T4 DNA ligase and the DNA ligase buffer provided per the
manufacturer’s instructions. The nicking reactions using Nt.AlwI were performed
using NEB’s cutsmart buffer and the instructions provided by NEB. The gyrase
reactions were executed per the manufacturer’s instructions using the gyrase buffer
provided.
Labeling the oligonucleotide
The dye used to label the oligonucleotide was an Alexa Fluor 488 carboxylic
acid, 2,3,5,6-‐tetrafluorophenyl ester ~*5-‐isomer, and was purchased from Life
Technologies. The procedure to label was adapted from Life Technologies’s “Amine-‐
Reactive Probe Labeling Protocol”. The reaction buffer used had a final
concentration of 0.33 g/L of amine labeled oligonucleotide, 1.2 g/L of dye, and 0.066
M sodium tetraborate buffer. The reaction was mixed per the manufacturer’s
instructions for the first 2 hours and then left to sit overnight at room temperature.
An ethanol precipitation was performed the next day to remove some of the excess
free dye.
27
Chapter 3 – Transcription Initiation Mechanism Results
With the purification of the nicked and supercoiled circular templates, I next
measured the mechanism of transcription initiation at the glnAp2 promoter using
single molecule TIRF microscopy. From the literature, I know that the process of
transcription initiation at this promoter on linear DNA (Friedman and Gelles 2012)
is
𝑅 + 𝑃 ⇄ 𝑅𝑃!! ⇄ 𝑅𝑃!! ⇄ 𝑅𝑃! ⟶ 𝑇𝐸𝐶 + 𝜎!"
where R is the DNA and P is the RNA polymerase. In the mechanism, there are two
closed complexes (𝑅𝑃!! and 𝑅𝑃!!) before the formation of the open complex (𝑅𝑃!).
Compared to the first three forward rate constants, the rate constant from open
complex to the transcription elongation complex (TEC) is much faster. Here I
determined where in the mechanism transcription initiation on the supercoiled
template transcribes faster than on the nicked template.
Specificity of Initiation
To make sure that the circular templates could be used in place of linear
DNA, I tested transcription initiation using the supercoiled and nicked circular
templates. The circular DNA templates were attached to the microscope slide and
then imaged with a blue laser to determine their locations (Figure 3.1 A, B). The
open complex-‐forming solution, consisting of the cy3-‐𝜎!" RNAP holoenzyme, NtrC,
and ATP, was then added to the slide (Figure 3.1 A). I allowed open complexes to
form for 45 minutes, at the end of which the locations of the cy3-‐𝜎!" RNA
polymerases were imaged with a green laser (Figure 3.1C). Finally I added the ATP,
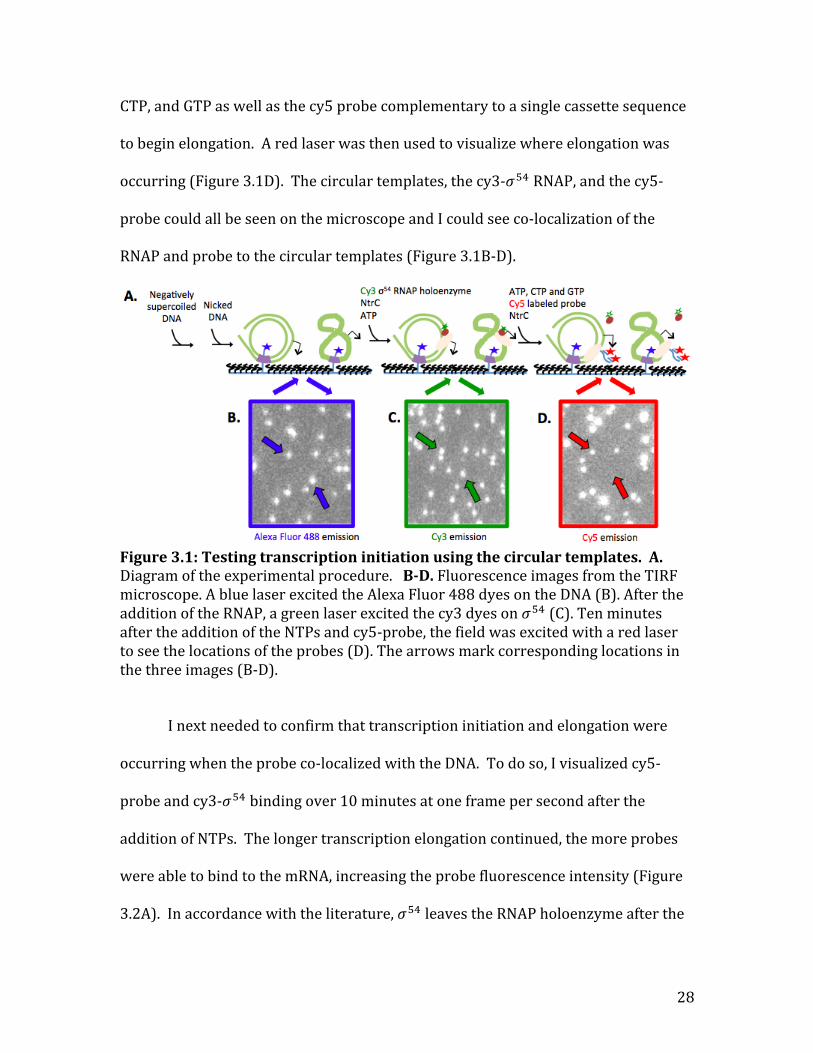
28
CTP, and GTP as well as the cy5 probe complementary to a single cassette sequence
to begin elongation. A red laser was then used to visualize where elongation was
occurring (Figure 3.1D). The circular templates, the cy3-‐𝜎!" RNAP, and the cy5-‐
probe could all be seen on the microscope and I could see co-‐localization of the
RNAP and probe to the circular templates (Figure 3.1B-‐D).
Figure 3.1: Testing transcription initiation using the circular templates. A. Diagram of the experimental procedure. B-‐D. Fluorescence images from the TIRF microscope. A blue laser excited the Alexa Fluor 488 dyes on the DNA (B). After the addition of the RNAP, a green laser excited the cy3 dyes on 𝜎!" (C). Ten minutes after the addition of the NTPs and cy5-‐probe, the field was excited with a red laser to see the locations of the probes (D). The arrows mark corresponding locations in the three images (B-‐D).
I next needed to confirm that transcription initiation and elongation were
occurring when the probe co-‐localized with the DNA. To do so, I visualized cy5-‐
probe and cy3-‐𝜎!" binding over 10 minutes at one frame per second after the
addition of NTPs. The longer transcription elongation continued, the more probes
were able to bind to the mRNA, increasing the probe fluorescence intensity (Figure
3.2A). In accordance with the literature, 𝜎!" leaves the RNAP holoenzyme after the
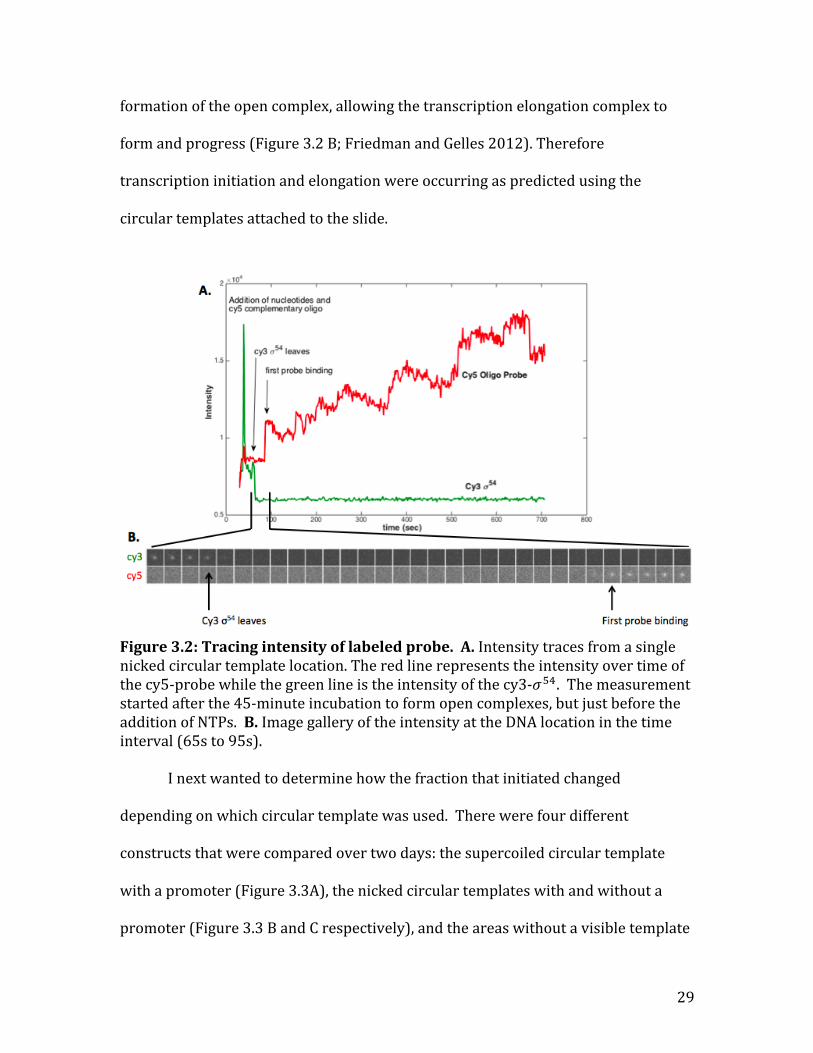
29
formation of the open complex, allowing the transcription elongation complex to
form and progress (Figure 3.2 B; Friedman and Gelles 2012). Therefore
transcription initiation and elongation were occurring as predicted using the
circular templates attached to the slide.
Figure 3.2: Tracing intensity of labeled probe. A. Intensity traces from a single nicked circular template location. The red line represents the intensity over time of the cy5-‐probe while the green line is the intensity of the cy3-‐𝜎!". The measurement started after the 45-‐minute incubation to form open complexes, but just before the addition of NTPs. B. Image gallery of the intensity at the DNA location in the time interval (65s to 95s).
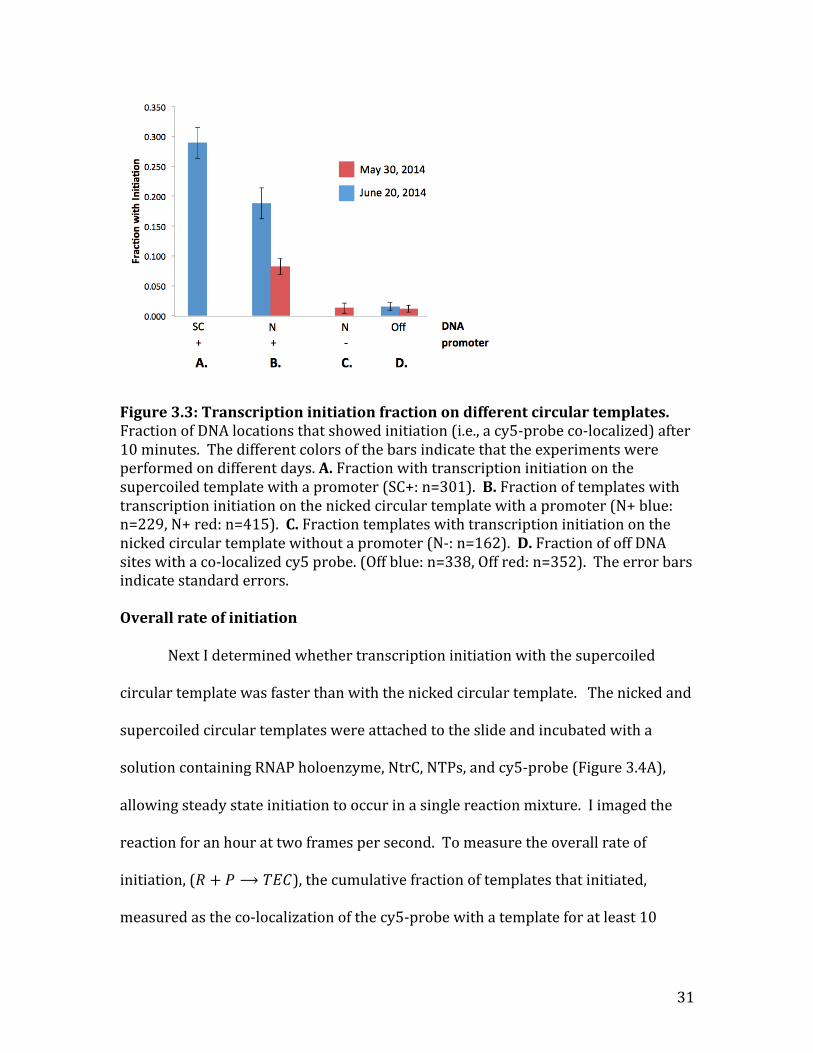
I next wanted to determine how the fraction that initiated changed
depending on which circular template was used. There were four different
constructs that were compared over two days: the supercoiled circular template
with a promoter (Figure 3.3A), the nicked circular templates with and without a
promoter (Figure 3.3 B and C respectively), and the areas without a visible template
30
(off DNA) (Figure 3.3D). The fraction that initiated was calculated as the number of
DNA locations that had a co-‐localized cy5-‐probe after 10 minutes divided by the
total number of DNA locations for that particular template. The off DNA locations
were used to measure the amount of nonspecific binding to the surface of the slide
(the background signal). As expected, the fraction that initiated at the nicked and
supercoiled circular templates that contained the promoter (Figure 3.3 A, B) was
significantly higher than the background signal (Figure 3.3D), indicating that
transcription did occur on those circular templates. The nicked template without a
promoter (Figure 3.3C), however, had an initiation fraction comparable to the
background signal (Figure 3.3D), suggesting that it did not initiate. Therefore,
transcription initiation only occurred on circular templates that contained the
promoter, and could occur on both the supercoiled and nicked templates.
The cause of the discrepancy in the fraction that initiated on the nicked
templates on the two days is unclear. It is possible that the difference was caused by
the fact that the first day had CTP and GTP concentrations of 0.5mM each, while the
second day they had concentrations of 1mM each. The higher concentration of CTP
and GTP on the second day may have allowed for faster elongation and therefore an
increased probability that a probe would bind by the end of the ten minutes.
31
Figure 3.3: Transcription initiation fraction on different circular templates. Fraction of DNA locations that showed initiation (i.e., a cy5-‐probe co-‐localized) after 10 minutes. The different colors of the bars indicate that the experiments were performed on different days. A. Fraction with transcription initiation on the supercoiled template with a promoter (SC+: n=301). B. Fraction of templates with transcription initiation on the nicked circular template with a promoter (N+ blue: n=229, N+ red: n=415). C. Fraction templates with transcription initiation on the nicked circular template without a promoter (N-‐: n=162). D. Fraction of off DNA sites with a co-‐localized cy5 probe. (Off blue: n=338, Off red: n=352). The error bars indicate standard errors. Overall rate of initiation
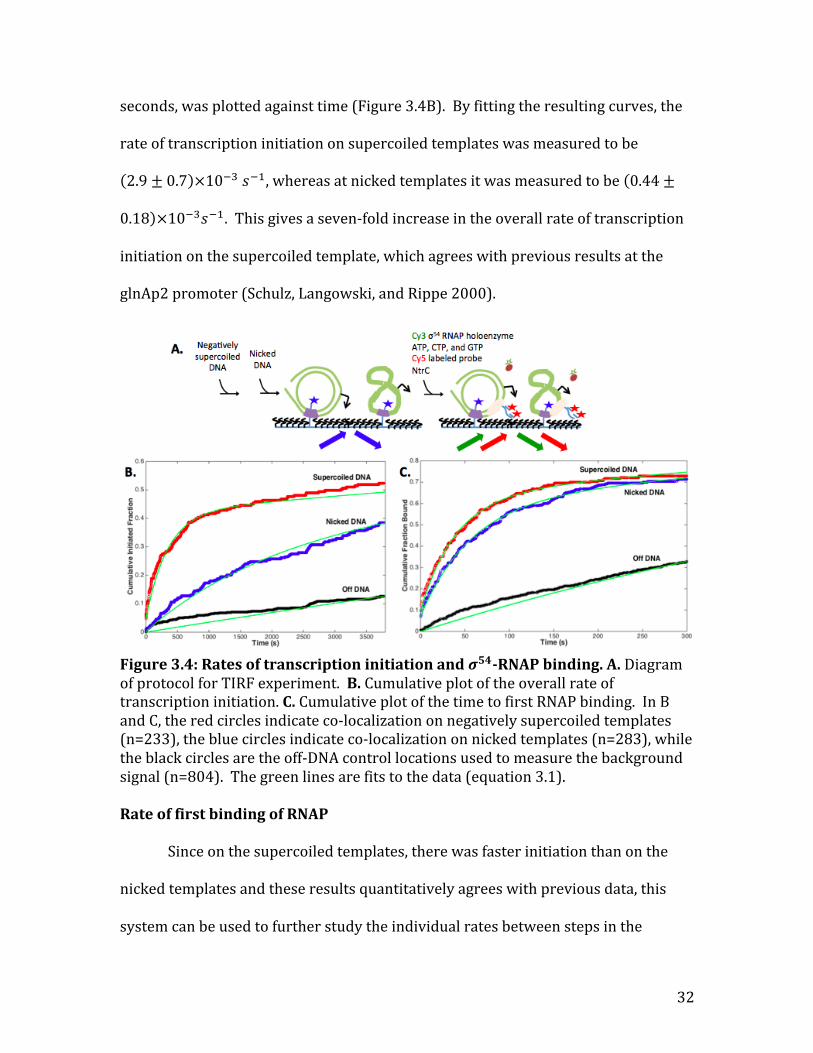
Next I determined whether transcription initiation with the supercoiled
circular template was faster than with the nicked circular template. The nicked and
supercoiled circular templates were attached to the slide and incubated with a
solution containing RNAP holoenzyme, NtrC, NTPs, and cy5-‐probe (Figure 3.4A),
allowing steady state initiation to occur in a single reaction mixture. I imaged the
reaction for an hour at two frames per second. To measure the overall rate of
initiation, (𝑅 + 𝑃⟶ 𝑇𝐸𝐶), the cumulative fraction of templates that initiated,
measured as the co-‐localization of the cy5-‐probe with a template for at least 10
32
seconds, was plotted against time (Figure 3.4B). By fitting the resulting curves, the
rate of transcription initiation on supercoiled templates was measured to be
2.9± 0.7 ×10!! 𝑠!!, whereas at nicked templates it was measured to be 0.44±
0.18 ×10!!𝑠!!. This gives a seven-‐fold increase in the overall rate of transcription
initiation on the supercoiled template, which agrees with previous results at the
glnAp2 promoter (Schulz, Langowski, and Rippe 2000).
Figure 3.4: Rates of transcription initiation and 𝝈𝟓𝟒-‐RNAP binding. A. Diagram of protocol for TIRF experiment. B. Cumulative plot of the overall rate of transcription initiation. C. Cumulative plot of the time to first RNAP binding. In B and C, the red circles indicate co-‐localization on negatively supercoiled templates (n=233), the blue circles indicate co-‐localization on nicked templates (n=283), while the black circles are the off-‐DNA control locations used to measure the background signal (n=804). The green lines are fits to the data (equation 3.1). Rate of first binding of RNAP
Since on the supercoiled templates, there was faster initiation than on the
nicked templates and these results quantitatively agrees with previous data, this
system can be used to further study the individual rates between steps in the
33
mechanism of transcription initiation. The first step in the mechanism I studied was
the rate of binding of the RNAP to the template, (𝑅 + 𝑃⟶ 𝑅𝑃!!). Using data from
the initiation and elongation experiments (Figure 3.4A), I made a cumulative plot of
the fraction of circular templates with a co-‐localized cy3-‐𝜎!" RNAP versus the time
of its first binding (Figure 3.4C). The rate constant for RNAP binding to the
supercoiled template was measured to be 3.0± 0.4 ×10!𝑀!!𝑠!! and the rate
constant for the RNAP binding to the nicked template was 2.1± 0.3 ×10!𝑀!!𝑠!!.
The ratio between these two rate constants is approximately 1.5, which does not
account for the seven-‐fold ratio of the overall rates of initiation. In addition, the first
RNAP binding rate constant on the nicked template matches the linear result,
2.1×10!𝑀!!𝑠!!, in the previous TIRF experiments (Friedman and Gelles 2012),
which is to be expected since they are both relaxed constructs. The rate of binding
the RNAP to the supercoiled versus nicked circular templates does not account for
the increase in overall rate of transcription initiation.
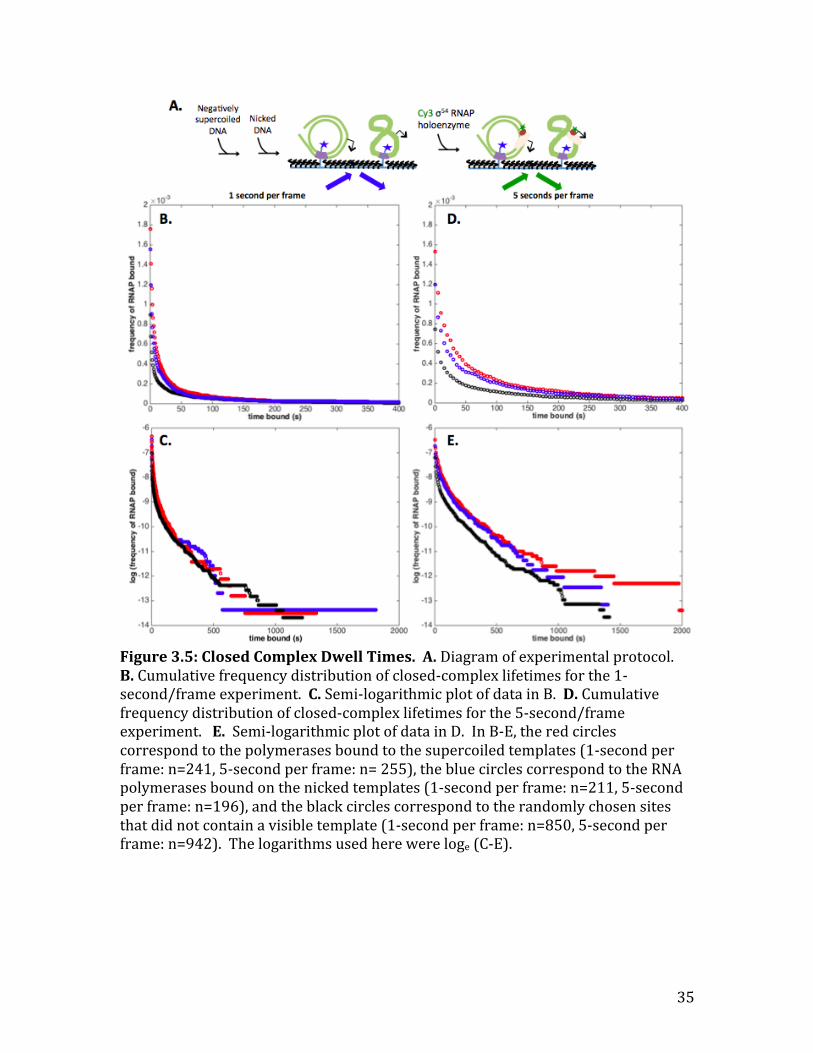
Closed Complexes
The next forward rate constant in the mechanism I wanted to determine was
the rate constant between the two closed complexes (𝑅𝑃!! ⟶ 𝑅𝑃!!). Since closed
complex formation does not require NtrC or ATP (Friedman and Gelles 2012), I
incubated the circular templates attached to the slide surface with 0.15nM of cy3-‐
𝜎!" RNAP alone (Figure 3.5A). The first experiment I performed to test the rate
constants of the closed complexes, was to measure the length of time the RNAP
stayed bound to the circular templates at 1-‐second per frame (Figure 3.5 B, C).
Since there are two closed complexes in the mechanism of transcription initiation,
34
the dwell times of the RNAP are expected to be a bi-‐exponential function (Friedman
and Gelles 2012). While the background signal interfered with the experimental
data, there was not much qualitative difference between the dwell times of the RNA
polymerases on supercoiled versus nicked templates.
Using the same experimental procedure as before (Figure 3.5A), the longer
dwell times were measured by increasing the time between frames to 5 seconds
(Figure 3.5 D, E). Unlike the 1-‐second per frame experiment, the background signal
in the 5-‐second per frame experiment did not interfere with the experimental data
from the nicked and supercoiled templates. Unfortunately, the bi-‐exponential fit did
not agree with the data and there was no reason that it should be fit to a tri-‐
exponential curve with three closed complexes. Qualitatively, however, the dwell
times on the supercoiled and nicked templates for the five-‐second per frame are
similar, agreeing with the data from the 1-‐second per frame experiment. Taken
together, the data from the 1-‐second and 5-‐second per frame experiments were not
strong enough to reach a conclusion on determining the rate constants between the
two closed complexes. To determine the rate constants involved in closed complex
formation, these experiments should be repeated with a different slide or re-‐labeled
circular templates to reduce the level of the background signal.
35
Figure 3.5: Closed Complex Dwell Times. A. Diagram of experimental protocol. B. Cumulative frequency distribution of closed-‐complex lifetimes for the 1-‐second/frame experiment. C. Semi-‐logarithmic plot of data in B. D. Cumulative frequency distribution of closed-‐complex lifetimes for the 5-‐second/frame experiment. E. Semi-‐logarithmic plot of data in D. In B-‐E, the red circles correspond to the polymerases bound to the supercoiled templates (1-‐second per frame: n=241, 5-‐second per frame: n= 255), the blue circles correspond to the RNA polymerases bound on the nicked templates (1-‐second per frame: n=211, 5-‐second per frame: n=196), and the black circles correspond to the randomly chosen sites that did not contain a visible template (1-‐second per frame: n=850, 5-‐second per frame: n=942). The logarithms used here were loge (C-‐E).
36
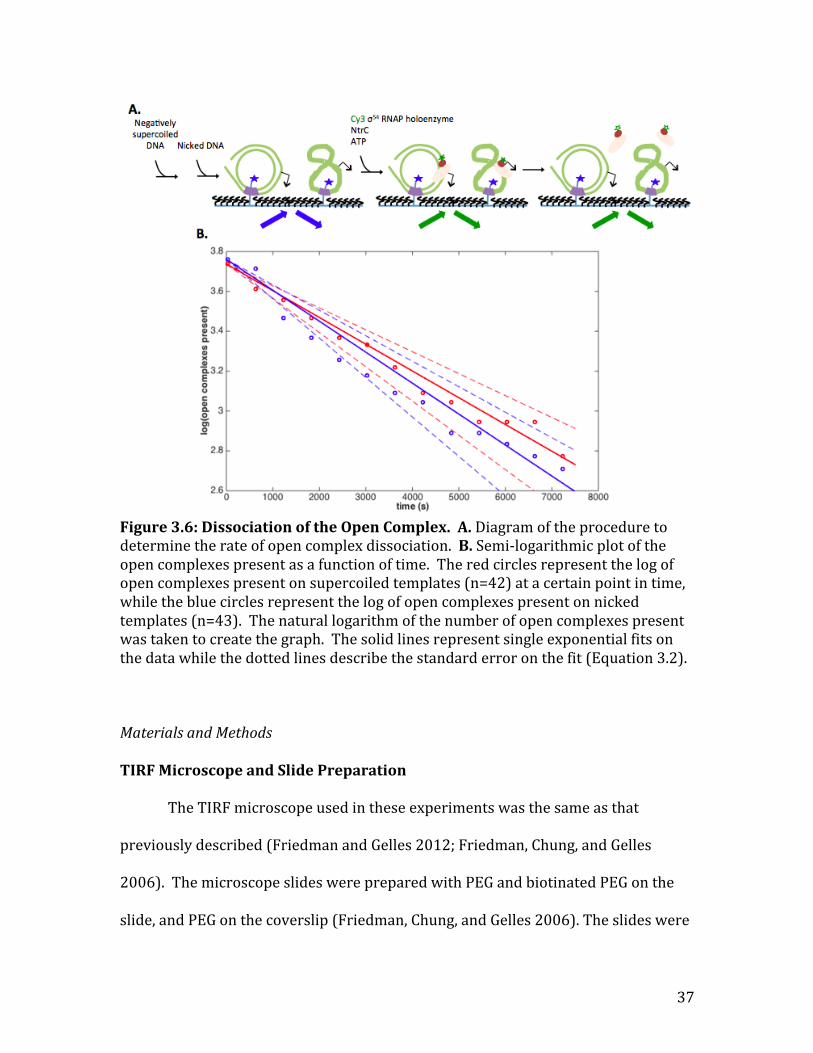
Open complex dissociation
In addition to measuring the rates of the forward reaction for transcription
initiation, I also wanted to determine the rate of open complex dissociation on the
supercoiled and nicked circular templates (𝑅𝑃! → 𝑅 + 𝑃). Open complexes were
formed in the same way as they were for the initial experiments on transcription
initiation (Figure 3.1A), except that instead of adding the NTPs after 45 minutes, the
lane was washed with buffer and oxygen scavengers (Figure 3.6A) to remove free
RNAP and allow the open complexes formed to dissociate. The positions of the open
complexes were viewed only once every 10 minutes to minimize photo bleaching.
At the first frame, I found all of the open complexes that were co-‐localized with
either the supercoiled templates or the nicked templates. The rate of open complex
dissociation on the supercoiled template was 1.3± 0.2 ×10!!𝑠!! and on the
nicked template was 1.6± 0.3 ×10!!𝑠!! (Figure 3.6B). Unlike the 𝜎!" results
(Revyakin, Ebright, and Strick 2004), these rates are not statistically different, which
indicates that there is no evidence that the 𝜎!" RNAP dissociates differently on the
supercoiled template compared to the nicked template.
37
Figure 3.6: Dissociation of the Open Complex. A. Diagram of the procedure to determine the rate of open complex dissociation. B. Semi-‐logarithmic plot of the open complexes present as a function of time. The red circles represent the log of open complexes present on supercoiled templates (n=42) at a certain point in time, while the blue circles represent the log of open complexes present on nicked templates (n=43). The natural logarithm of the number of open complexes present was taken to create the graph. The solid lines represent single exponential fits on the data while the dotted lines describe the standard error on the fit (Equation 3.2).
Materials and Methods
TIRF Microscope and Slide Preparation
The TIRF microscope used in these experiments was the same as that
previously described (Friedman and Gelles 2012; Friedman, Chung, and Gelles
2006). The microscope slides were prepared with PEG and biotinated PEG on the
slide, and PEG on the coverslip (Friedman, Chung, and Gelles 2006). The slides were
38
stored in a -‐80˚C freezer for up to two years after the PEG was added. They were
then cleaned with a Tris-‐Acetate (pH 8) buffer on the day of the experiment and four
lanes were created on the slide using grease. Both the supercoiled and nicked
circular templates were attached to the surface of the microscope slide using
streptavidin.
Solutions
All buffers containing a molecule attached to a fluorescent dye contained
oxygen scavengers (Friedman, Chung, and Gelles 2006). The buffer for the circular
templates, cy3-‐𝜎!" RNA polymerases, and probes were the same as previous
experiments (Friedman and Gelles 2012). The cy3-‐𝜎!" was stored separately from
the RNA polymerase core, both in a -‐80˚C freezer, and then combined in a 1.5:1 ratio
of Cy3-‐𝜎!": core, along with 0.28 mg/ml BSA, and 0.9 mM DTT just before adding to
the reaction mixture. Unless otherwise stated, the concentration of RNAP was
0.8nM, of NtrC was 14nM, of ATP was 2mM, of CTP and GTP was 0.5mM, and of the
cy5-‐probe was 10nM.
Fit Equations
The equation used to fit the cumulative plot of overall initiation and the time
until first RNAP binding (Figure 3.4 B, C) was
𝑓 𝑡 = (!"×!!!")×(!!!!!× !!!!"" !!"!!×(!!!")×(!!!!!×!!"")!
(3.1)
where Af is the fraction of the templates that were able to initiate (the active
fraction), n is the total number of templates present, Nz is the number of templates
with a co-‐localized probe at frame one, t is the time, R is the rate constant on either
the supercoiled or nicked template, and ROFF is the rate constant on the off DNA
39
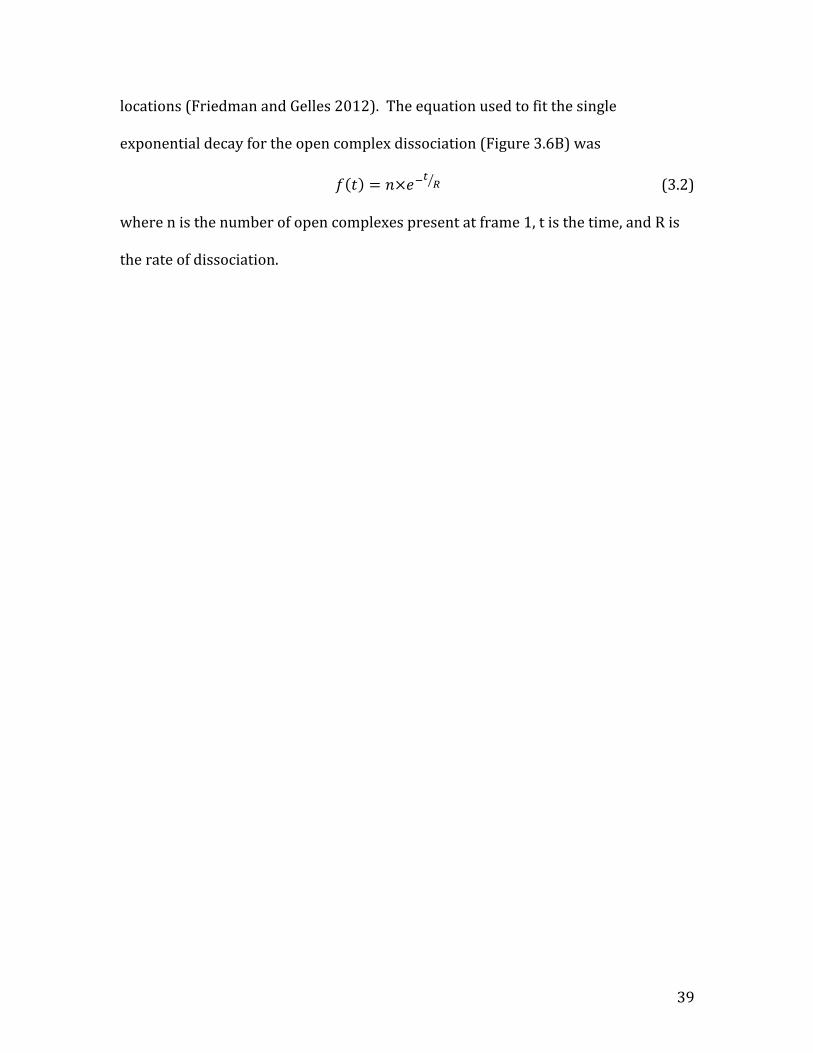
locations (Friedman and Gelles 2012). The equation used to fit the single
exponential decay for the open complex dissociation (Figure 3.6B) was
𝑓 𝑡 = 𝑛×𝑒!! ! (3.2)
where n is the number of open complexes present at frame 1, t is the time, and R is
the rate of dissociation.
40
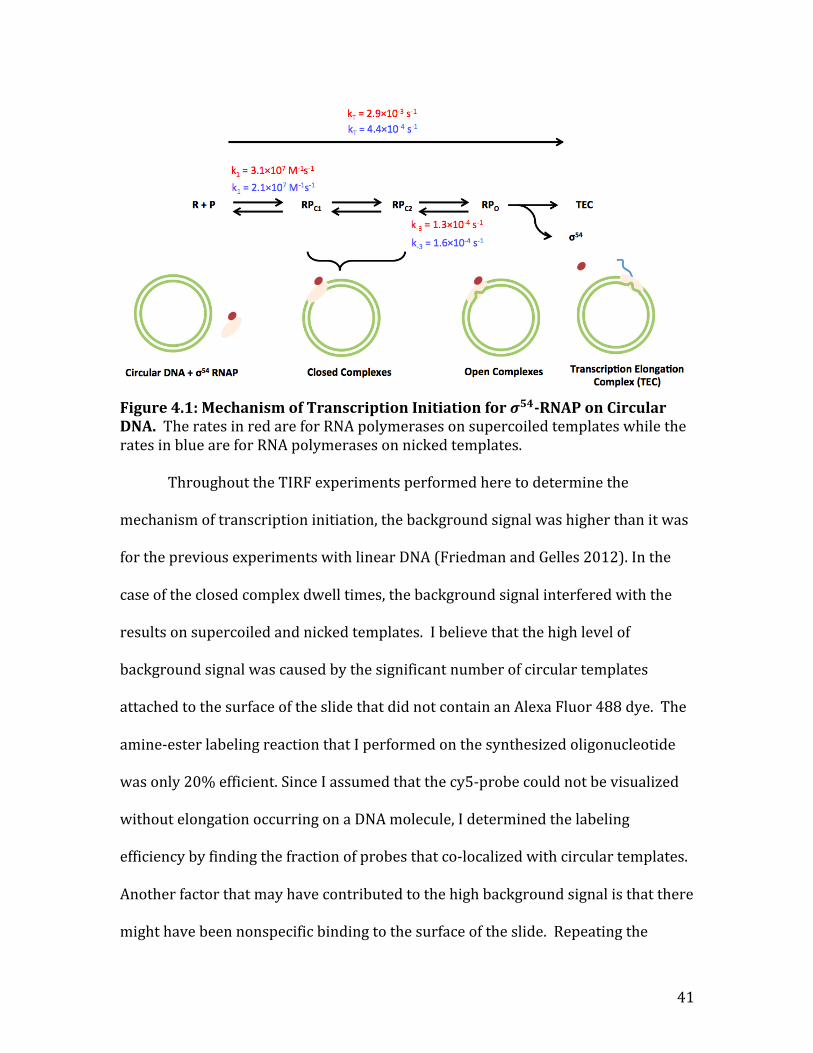
Chapter 4 – Discussion
Rather than using linear DNA to measure the mechanism of transcription
initiation at the glnAp2 promoter, I created a circular template that could be used in
place of the linear DNA. The circular template was labeled with an Alexa Fluor 488
dye and biotin such that it could be seen by the microscope and attached to a
microscope slide. It also contained the necessary sequences for transcription
initiation and elongation for a 𝜎!" RNAP and had the ability to be negatively
supercoiled by the enzyme gyrase or relaxed by the enzyme Nt.AlwI. Using two
topoisomers of the circular template, the negatively supercoiled and the nicked
templates, I performed a series of single molecule TIRF experiments to determine
the mechanism for transcription initiation at the glnAp2 promoter. The rate
constants that I was able to determine are summarized in Figure 4.1. I found that
the overall rate of initiation on negatively supercoiled DNA is seven times faster
than on relaxed DNA, but not because of the first few forward rate constants in the
mechanism.
41
Figure 4.1: Mechanism of Transcription Initiation for 𝝈𝟓𝟒-‐RNAP on Circular DNA. The rates in red are for RNA polymerases on supercoiled templates while the rates in blue are for RNA polymerases on nicked templates.
Throughout the TIRF experiments performed here to determine the
mechanism of transcription initiation, the background signal was higher than it was
for the previous experiments with linear DNA (Friedman and Gelles 2012). In the
case of the closed complex dwell times, the background signal interfered with the
results on supercoiled and nicked templates. I believe that the high level of
background signal was caused by the significant number of circular templates
attached to the surface of the slide that did not contain an Alexa Fluor 488 dye. The
amine-‐ester labeling reaction that I performed on the synthesized oligonucleotide
was only 20% efficient. Since I assumed that the cy5-‐probe could not be visualized
without elongation occurring on a DNA molecule, I determined the labeling
efficiency by finding the fraction of probes that co-‐localized with circular templates.
Another factor that may have contributed to the high background signal is that there
might have been nonspecific binding to the surface of the slide. Repeating the
42
experiment to determine the dwell times of the closed complexes with a slide
prepared with an alternative method or using newly labeled oligonucleotide during
the creation of the circular templates may reduce the background signal.
While I was unable to determine all the rate constants in the mechanism of
transcription initiation for the circular templates, the preliminary data for the
𝑅𝑃!! ⟶ 𝑅𝑃!! step suggests that there is little difference between the rates on
negatively supercoiled and nicked templates. Therefore, the step that accounts for
the most difference between the rate constants of transcription initiation on
negatively supercoiled and nicked circular templates is the formation of the open
complex (𝑅𝑃!! → 𝑅𝑃!), which is also the rate limiting step in the reaction with
linear DNA (Friedman and Gelles 2012). If this is the case, then the rate of open
complex formation could be affected by negative supercoiling in two ways. First, the
negative supercoiling may reduce the force needed for the 𝜎!"-‐RNA polymerase to
open the DNA. The second is that the plectonemes formed in the negatively
supercoiled DNA may make it easier for the NtrC to interact with the 𝜎!"-‐RNA
polymerase thereby opening the double helix faster (Schulz, Langowski, and Rippe
2000). Finally it could also be a combination of both of these factors. To test how
supercoiling effects the rate limiting step in transcription initiation, I could use the
circular template described in chapter two, but rather than negatively supercoil it
with gyrase in the last step, I could positively supercoil the template with a reverse
gyrase. I could then compare the overall rate of transcription initiation on positively
supercoiled, negatively supercoiled, and nicked templates. Both the positively and
negatively supercoiled templates create plectonemes in the DNA, but unlike the
43
negatively supercoiled template, the positively supercoiled template will make the
force to open the DNA greater rather than less than it would for the relaxed
template. Therefore, if the overall rate of transcription initiation on the positively
supercoiled template is the same as that on the negatively supercoiled template,
then the proximity of the NtrC to the 𝜎!"-‐RNAP accounts for the change in rate, not
the force needed to open the double helix. If however, the overall rate on the
positively supercoiled template is slower than it is on the nicked template, then the
reduced force needed to open the double helix explains the faster rate on the
negatively supercoiled template, not the accessibility of the 𝜎!"-‐RNAP to NtrC.
Finally, if the overall rate on the positively supercoiled templates is somewhere
between that on nicked and negatively supercoiled templates, then both the
proximity of the NtrC and the force needed to open the DNA account for the
increased speed of transcription initiation on the negatively supercoiled templates.
I found that the rate constants of 𝜎!"-‐RNAP open complex dissociation on
negatively supercoiled and nicked templates were the same within error. While
open complexes attached to negatively supercoiled DNA are expected to be more
thermodynamically stable, it apparently does not affect the dissociation rate of the
𝜎!"-‐RNAP. My finding contrasts with open complex dissociation of the 𝜎!"-‐RNAP on
supercoiled DNA, where the kinetic stability of the open complex does depend on
the superhelical density of the DNA (Revyakin, Ebright, and Strick 2004). However
in those results, the authors compared open complexes on positively supercoiled
DNA with those on negatively supercoiled DNA when performing their experiments,
rather than comparing the stability on negatively supercoiled and relaxed DNA that
44
I use here. It would be interesting to determine if in my system the 𝜎!" RNAP has
similar open complex dissociation rates on relaxed and negatively supercoiled
templates like its 𝜎!" RNAP counterpart, or as the literature suggests, a differing
stability.
Using circular templates and single molecule TIRF microscopy, I have
described here the beginnings of the mechanism of transcription initiation using a
𝜎!" RNAP on negatively supercoiled DNA. More work needs to be done to
determine which is the step in the mechanism that accounts for the dramatic change
in overall rate between transcription initiation on the negatively supercoiled
templates compared to nicked templates, but preliminary data suggests that it is the
isomerization of the second closed complex to the open complex.
45
References Bates, A D, and A Maxwell. 1989. “DNA Gyrase Can Supercoil DNA Circles as Small as
174 Base Pairs.” The EMBO Journal 8 (6): 1861–66. Friedman, Larry J., Johnson Chung, and Jeff Gelles. 2006. “Viewing Dynamic
Assembly of Molecular Complexes by Multi-‐Wavelength Single-‐Molecule Fluorescence.” Biophysical Journal 91 (3): 1023–31. doi:10.1529/biophysj.106.084004.
Friedman, Larry J., and Jeff Gelles. 2012. “Mechanism of Transcription Initiation at an Activator-‐Dependent Promoter Defined by Single-‐Molecule Observation.” Cell 148 (4): 679–89. doi:10.1016/j.cell.2012.01.018.
Gellert, M, K Mizuuchi, M H O’Dea, and H A Nash. 1976. “DNA Gyrase: An Enzyme That Introduces Superhelical Turns into DNA.” Proceedings of the National Academy of Sciences of the United States of America 73 (11): 3872–76.
Kalkbrenner, Thomas, Axel Arnold, and Sander J. Tans. 2009. “Internal Dynamics of Supercoiled DNA Molecules.” Biophysical Journal 96 (12): 4951–55. doi:10.1016/j.bpj.2009.03.056.
Keller, W. 1975. “Determination of the Number of Superhelical Turns in Simian Virus 40 DNA by Gel Electrophoresis.” Proceedings of the National Academy of Sciences of the United States of America 72 (12): 4876–80.
Marko, John F., and Sébastien Neukirch. 2012. “Competition between Curls and Plectonemes near the Buckling Transition of Stretched Supercoiled DNA.” Physical Review. E, Statistical, Nonlinear, and Soft Matter Physics 85 (1 0 1): 011908.
Mauri, Marco, and Stefan Klumpp. 2014. “A Model for Sigma Factor Competition in Bacterial Cells.” PLoS Comput Biol 10 (10): e1003845. doi:10.1371/journal.pcbi.1003845.
Mirkin, Sergei M. 2002. "DNA Topology: Fundamentals." Encyclopedia of Life Sciences. pp. 1-‐11. London: Nature.
Revyakin, Andrey, Richard H. Ebright, and Terence R. Strick. 2004. “Promoter Unwinding and Promoter Clearance by RNA Polymerase: Detection by Single-‐Molecule DNA Nanomanipulation.” Proceedings of the National Academy of Sciences of the United States of America 101 (14): 4776–80. doi:10.1073/pnas.0307241101.
Schulz, Alexandra, Jörg Langowski, and Karsten Rippe. 2000. “The Effect of the DNA Conformation on the Rate of NtrC Activated Transcription of Escherichia Coli RNA Polymerase·σ54 Holoenzyme.” Journal of Molecular Biology 300 (4): 709–25. doi:10.1006/jmbi.2000.3921.
Seidl, A, and H J Hinz. 1984. “The Free Energy of DNA Supercoiling Is Enthalpy-‐Determined.” Proceedings of the National Academy of Sciences of the United States of America 81 (5): 1312–16.
Vidangos, Natasha, Ann E. Maris, Anisa Young, Eunmi Hong, Jeffrey G. Pelton, Joseph D. Batchelor, and David E. Wemmer. 2013. “Structure, Function, and Tethering of DNA-‐Binding Domains in σ54 Transcriptional Activators.” Biopolymers 99 (12): 1082–96. doi:10.1002/bip.22333.
46
Watson, James D. 2007. "The Structures of DNA and RNA." Molecular Biology of the Gene. 6th ed. Menlo Park, Calif.: Benjamin/Cummings.
Weaver, Robert F. 2012. "Transcription in Bacteria." Molecular Biology. 5th ed. New York, NY: The McGraw-‐Hill companies.
Wedel, A., and S. Kustu. 1995. “The Bacterial Enhancer-‐Binding Protein NTRC Is a Molecular Machine: ATP Hydrolysis Is Coupled to Transcriptional Activation.” Genes & Development 9 (16): 2042–52. doi:10.1101/gad.9.16.2042.
Whitehall, S., S. Austin, and R. Dixon. 1992. “DNA Supercoiling Response of the Sigma 54-‐Dependent Klebsiella Pneumoniae nifL Promoter in Vitro.” Journal of Molecular Biology 225 (3): 591–607.


![[V]. Process of Transcription and Transcriptional Control of Gene Expression 1 RNA polymerases and Initiation of transcription Transcriptional elongation.](https://static.fdocuments.net/doc/165x107/56649e595503460f94b52b31/v-process-of-transcription-and-transcriptional-control-of-gene-expression.jpg)


