THEBARTON ASSESSMENT AREA - epa.sa.gov.au
106
THEBARTON ASSESSMENT AREA STAGE 1 ENVIRONMENTAL ASSESSMENT FINAL REPORT | EPA REF 05/24111 ENVIRONMENT PROTECTION AUTHORITY, SOUTH AUSTRALIA 30 OCTOBER 2017 VOLUME 1: REPORT
Transcript of THEBARTON ASSESSMENT AREA - epa.sa.gov.au

THEBARTON ASSESSMENT AREA STAGE 1 ENVIRONMENTAL ASSESSMENT
FINAL REPORT | EPA REF 0524111 ENVIRONMENT PROTECTION AUTHORITY
SOUTH AUSTRALIA
30 OCTOBER 2017 VOLUME 1 REPORT
THEBARTON ASSESSMENT AREA
STAGE 1 ENVIRONMENTAL ASSESSMENT
FINAL REPORT
EPA REF 0524111
PREPARED FOR Environment Protection Authority South Australia
PREPARED BY Fyfe Pty Ltd
ABN 57 008 116 130
ADDRESS L1 124 South Terrace Adelaide SA 5000
CONTACT Mr Marc Andrews Division Manager - Environment
TELEPHONE direct 08 8201 9794 mobile 0408 805 264
FACSIMILE 61 8 8201 9650
EMAIL marcandrewsfyfecomau
DATE 30102017
REFERENCE 80607-1 REV1
copyFyfe Pty Ltd 2017
Proprietary Information Statement
The information contained in this document produced by Fyfe Pty Ltd is solely for the use of the Client identified on the cover sheet for the purpose for which it has been prepared and Fyfe Pty Ltd undertakes no duty to or accepts any responsibility to any third party who may rely upon this document
All rights reserved No section or element of this document may be removed from this document reproduced electronically stored or transmitted in any form without the written permission of Fyfe Pty Ltd
Document Information
Report prepared by Dr Ruth Keogh Principal Environmental Scientist Fyfe Pty Ltd Date 27 October 2017
Report reviewed and approved by Division Manager - Environment Fyfe Pty Ltd Date 30 October 2017 Marc Andrews
Client receipt by Shannon Thompson Advisor Site Contamination SA EPA Date 30 October 2017
Revision History
Revision Revision Status Date of Issue Prepared Reviewed Approved
REV 0 Draft 6 October 2017 RK MJA MJA
REV 1 Final 30 October 2017 RK MJA MJA
Please note that when viewed electronically this document may contain pages that have been intentionally left blank These blank pages may occur because in consideration of the environment and for your convenience this document has been set up so that it can be printed correctly in double-sided format
EPA REF 0524111 FINAL REPORT STAGE 1 ENVIRONMENTAL ASSESSMENT THEBARTON ASSESSMENT AREA
CONTENTS
Page
VOLUME 1 REPORT
LIST OF ACRONYMS V
EXECUTIVE SUMMARY VIII
1 INTRODUCTION 1
11 Purpose 1
12 General background information 1
13 Definition of the assessment area 2
14 Identification of contaminants of potential concern 2
15 Objectives 3
2 CHARACTERISATION OF THE ASSESSMENT AREA 5
21 Site identification 5
22 Regional geology and hydrogeology 5
23 Data quality objectives 7
3 SCOPE OF WORK 11
31 Preliminary work 12
32 Field investigation and laboratory analysis program 12
33 Data interpretation 14
4 METHODOLOGY 15
41 Field methodologies 15
42 Laboratory analysis 19
5 QUALITY ASSURANCE AND QUALITY CONTROL 21
51 Field QAQC 21
52 Laboratory QAQC 24
53 QAQC summary 26
80607-1 REV1 30102017 PAGE I
EPA REF 0524111 FINAL REPORT STAGE 1 ENVIRONMENTAL ASSESSMENT THEBARTON ASSESSMENT AREA
6 ASSESSMENT CRITERIA 27
61 Groundwater 27
62 Soil vapour 29
7 RESULTS 31
71 Surface and sub surface soil conditions 31
72 Waterloo Membrane Samplerstrade 32
73 Groundwater 34
74 Soil vapour bores 40
8 GROUNDWATER FATE AND TRANSPORT MODELLING 43
81 Groundwater flow modelling 43
82 Solute transport modelling 43
9 VAPOUR INTRUSION RISK ASSESSMENT 47
91 Objective 47
92 Areas of interest 47
93 Risk assessment approach 47
94 Tier 1 assessment 48
95 Tier 2 assessment 49
96 Conclusions 59
10 CONCEPTUAL SITE MODEL 61
11 CONCLUSIONS 67
12 DATA GAPS 71
13 REFERENCES 73
14 STATEMENT OF LIMITATIONS 77
PAGE II 80607-1 REV1 30102017
EPA REF 0524111 FINAL REPORT STAGE 1 ENVIRONMENTAL ASSESSMENT THEBARTON ASSESSMENT AREA
LIST OF TABLES
Table 21 Information regarding registered groundwater bores located within the Thebarton EPA Assessment Area 7
Table 22 Data Quality Objectives 8 Table 31 Scope of field investigation program ndash May to August 2017 12 Table 32 Scope of laboratory testing program 13 Table 41 Summary of field methodologies 15 Table 51 Field QAQC procedures ndash Groundwater 22 Table 52 Field QAQC procedures ndash Soil vapour 23 Table 53 Laboratory QAQC procedures 25 Table 61 Assessment of groundwater beneficial uses for Thebarton EPA Assessment Area 28 Table 62 Sources of adopted groundwater assessment criteria 29 Table 71 Detectable Waterloo Membrane Samplertrade CHC results 32 Table 72 Comparison of CHC data for Round 1 and 2 WMStrade units 33 Table 73 Hydraulic conductivities (rising and falling head tests) 35 Table 74 Detectable groundwater CHC results 37 Table 75 Detectable soil vapour bore CHC results for Thebarton EPA Assessment Area 41 Table 76 Comparison of CHC data for Round 2 WMStrade units and closest soil vapour bores 42 Table 91 Tier 1 assessment ndash ASC NEPM (1999) and modified residential soil vapour HILs 49 Table 92 Tier 2 vapour intrusion modelling ndash building input parameters 51 Table 93 Tier 2 vapour intrusion modelling ndash soil input parameters 52 Table 94 Adopted attenuation factors for TCE in soil vapour to indoor air 52 Table 95 Summary of chemical parameters adopted for vapour intrusion modelling 52 Table 96 Comparison of predicted residential indoor air concentrations with SA EPA
response levels 54 Table 97 Summary of model input parameters subjected to sensitivity analysis 55 Table 98 Exposure parameters ndash Commercialindustrial workers 58 Table 99 Adopted inhalation toxicity reference values 58 Table 910 Summary of properties with predicted indoor air concentrations
(residential crawl space) above adopted EPA response levels 59 Table 101 Summary of existing information for the Thebarton EPA Assessment Area 61
LIST OF FIGURES (in text)
Figure 71 Piper diagram 39 Figure 81 Predictive TCE (1 microgL) plume extent after 100 years (ie shown in green)
relative to the boundary of the Thebarton EPA Assessment Area (red) and the extent of the modelling area (purple) 46
Figure 91 TCE indoor air screening criteria and the corresponding site-specific response levels 50
80607-1 REV1 30102017 PAGE III
EPA REF 0524111 FINAL REPORT STAGE 1 ENVIRONMENTAL ASSESSMENT THEBARTON ASSESSMENT AREA
FIGURES follow page 79
Figure 1 Site Location and Assessment Area Figure 2 Assessment Point Locations Figure 3 Waterloo Membrane Samplertrade TCE Concentration Plan Figure 4 Groundwater Elevation Contour Plan Figure 5 Groundwater Concentration Plan Figure 6 Soil Vapour Concentration Plan (10 m) Figure 7 Soil Vapour Concentration Plan (30 m)
VOLUME 2 APPENDICES
APPENDICES
Appendix A Historical Report Summary Appendix B Historical Information Supplied by the EPA Appendix C DEWNR Registered Groundwater Database Search Results Appendix D Groundwater Well Permits Appendix E Field Sampling Sheets ndash Groundwater Appendix F Survey Data Appendix G Certified Laboratory Certificates and Chain of Custody Documentation Appendix H Groundwater Well Log Reports Appendix I WMStrade Borehole Log Reports Appendix J Soil Vapour Borehole Log Reports Appendix K Waste Transport Certificates Appendix L Tabulated Results ndash Soil Vapour Geotechnical and Groundwater Appendix M Equipment Calibration Records Appendix N Drill Core Photographs Appendix O Arcadis Groundwater Fate and Transport Modelling Report Appendix P Arcadis Vapour Intrusion Risk Assessment Report
PAGE IV 80607-1 REV1 30102017
EPA REF 0524111 FINAL REPORT STAGE 1 ENVIRONMENTAL ASSESSMENT THEBARTON ASSESSMENT AREA
LIST OF ACRONYMS
AER Air Exchange Rate
AF Attenuation Factor
AHD Australian Height Datum
ANZECC Australian and New Zealand Environment and Conservation Council
ARMCANZ Agriculture and Resource Management Council of Australia and New Zealand
ASC Assessment of Site Contamination
ASTM American Standard Testing Material
AT Averaging Time
ATSDR Agency for Toxic Substances and Disease Registry
AWQC Australian Water Quality Centre
BGL Below Ground Level
BTEX Benzene Toluene Ethylbenzene Xylenes
BTOC Below Top of Casing
BUA Beneficial Use Assessment
CBD Central Business District
CHC Chlorinated Hydrocarbon Compound
COC Chain of Custody
COPC Contaminants of Potential Concern
CRC CARE Cooperative Research Centre for Contamination Assessment and Remediation of the Environment
CSM Conceptual Site Model
11-DCA 11-dichloroethane
11-DCE 11-dichloroethene
12-DCE 12-dichloroethene
DCE Dichloroethene
DEC Department of Environment and Conservation
DEWNR Department of Environment Water and Natural Resources
DNAPL Dense Non-Aqueous Phase Liquid
DO Dissolved Oxygen
DQI Data Quality Indicator
DQO Data Quality Objective
EC Electrical Conductivity
ED Exposure Duration
80607-1 REV1 30102017 PAGE V
EPA REF 0524111 FINAL REPORT STAGE 1 ENVIRONMENTAL ASSESSMENT THEBARTON ASSESSMENT AREA
EF Exposure Frequency
EMP Environmental Management Plan
EPA Environment Protection Authority
EPC Exposure Point Concentration
EPP Environment Protection Policy
ET Exposure Time
GPA Groundwater Prohibition Area
GPR Ground Penetrating Radar
GPS Global Positioning System
HHRA Human Health Risk Assessment
HIL Health Investigation Level
HSP Health and safety Plan
IPA Isopropyl Alcohol (isopropanol or 2-propanol)
IRIS Integrated Risk Information System
ITRC Interstate Technology and Regulatory Council
JampE Johnson and Ettinger
JHA Job Hazard Analysis
LNAPL Light Non-Aqueous Phase Liquid
LOR Limit of Reporting
MGA Map Grid of Australia
MQO Measuring Quality Objectives
MTC Mass Transfer Co-efficient
NA Not Applicable
NAPL Non-Aqueous Phase Liquid
NATA National Association of Testing Authorities
ND Non Detect
NEPM National Environment Protection Measure
NHMRC National Health and Medical Research Council
NJDEP New Jersey Department of Environmental Protection
NRMMC National Resource Management Ministerial Council
PAH Polycyclic Aromatic Hydrocarbons
PCE Tetrachloroethene (perchloroethylene)
PID Photoionisation Detector
PQL Practical Quantification Limit
PSD Particle Size Distribution
QA Quality Assurance
80607-1 REV1 30102017 PAGE VI
EPA REF 0524111 FINAL REPORT STAGE 1 ENVIRONMENTAL ASSESSMENT THEBARTON ASSESSMENT AREA
QC Quality Control
RAIS Risk Assessment Information System
RFQ Request for Quote
REM Resource and Environmental Management
RPD Relative Percentage Difference
RSL Regional Screening Level
SA EPA South Australian Environment Protection Authority
SAQP Sampling and Analysis Quality Plan
SOP Standard Operating Procedure
SVOC Semi-Volatile Organic Compound
SWL Standing Water Level
SWMS Safe Work Method Statement
111-TCA 111-trichloroethane
TCE Trichloroethene
TDS Total Dissolved Solids
TRH Total Recoverable Hydrocarbons1
TRV Toxicity Reference Value
US EPA United Stated Environment Protection Agency
USGS United States Geological Survey
VC Vinyl Chloride
VIRA Vapour Intrusion Risk Assessment
VOC Volatile Organic Compound
VOCC Volatile Organic Chlorinated Compound
WHO World Health Organisation
WMStrade Waterloo Membrane Samplertrade
TRH = measurable amount of petroleum-based hydrocarbon (ie complex mixture of crude oil and natural gas (gt 250 compounds) including aromatics aliphatics paraffins unsaturated alkanes and naphthalenes) plus various other compounds including fatty acids esters humic acids phthalates and sterols
80607-1 REV1 30102017 PAGE VII
1
EPA REF 0524111 FINAL REPORT STAGE 1 ENVIRONMENTAL ASSESSMENT THEBARTON ASSESSMENT AREA
EXECUTIVE SUMMARY
Background information
An approximate 27 hectare mixed use area of Thebarton has been designated by the South Australian Environment Protection Authority (EPA) as the Thebarton EPA Assessment Area
The former Austral sheet metal works (Austral) property located over multiple allotments between George and Maria Streets from the 1920s until the 1960s-1970s has been identified as a possible source of dissolved phase groundwater chlorinated hydrocarbon (CHC) contamination Groundwater CHC impacts within the uppermost (Quaternary ndash Q1) aquifer were identified as extending in a general north-westerly direction (consistent with regional groundwater flow direction) from the south-eastern portion of the Thebarton EPA Assessment Area and having resulted in the generation of soil vapour containing elevated concentrations of CHC
The boundaries of the Thebarton EPA Assessment Area were established on the basis of the following
the previous identification of groundwater CHC contamination associated with properties located at 31-37 George Street (part of the former Austral property) and 39 Smith Street (hydraulically down-gradient of the former Austral property) in Thebarton
the fact that although the George Street property (andor the broader Austral facility of which it formed a part) was suspected to be located in the vicinity of the source the specific source site had not yet been confirmed and
the identification of an inferred (general) north-westerly groundwater flow direction within the Q1 aquifer
Key objectives
The results of the recent investigations undertaken by Fyfe have been used to assess potential vapour intrusion to indoor air risks within residential and commercialindustrial properties within the Thebarton EPA Assessment Area
The key objectives detailed by the EPA were to
further delineate the chlorinated hydrocarbon contamination in groundwater
further delineate the chlorinated hydrocarbon contamination in soil vapour initially using Waterloo Membrane Samplers (WMStrade) and
undertake a Human Health Risk Assessment Vapour Intrusion Risk Assessment (HHRAVIRA) based on the data collected
80607-1 REV1 30102017 PAGE VIII
EPA REF 0524111 FINAL REPORT STAGE 1 ENVIRONMENTAL ASSESSMENT THEBARTON ASSESSMENT AREA
With respect to the VIRA the EPA requested that there be specific consideration of
residential properties (slab on grade)
residential properties (crawl space)
residential properties (with basement) and
trenchmaintenanceutility workers that may be working in the vicinity of the contamination
Site conditions
Subsurface geological conditions are generally consistent across the Thebarton EPA Assessment Area and are dominated by the sediments (ie low to medium plasticity silty or sandy clays with variable gravel contents) of the Pooraka and Hindmarsh Clay formations While there is some potential for structural defects and coarser horizons to act as preferential pathways (lateral and vertical) for soil vapour movement no significant spatially-consistent features were identified during the recent soil drillinglogging work ndash although thin gravel lenses were identified within the subsurface at some locations and a 15 m thick layer of gravel was encountered at 12 to 135 m below ground level (BGL) during the drilling of groundwater well MW17 the latter consistent with the depth of groundwater within the Q1 aquifer
Soil
Groundwater within the Q1 aquifer is located at a depth of approximately 123 to Groundwater 159 m BGL and flows in a general north-westerly direction The closest surface water receptor is the River Torrens located approximately 03 km to the east and 07 km to the north and north-west A groundwater flow velocity range of approximately 44 to 23 myear has been inferred and the groundwater gradient is relatively flat (ie 000062 to 00012)
Beneficial uses for groundwater within the Q1 aquifer beneath the Thebarton EPA Assessment Area have been identified (based on factors such a groundwater salinity registered bore use and the locations of potential sensitive receptors) as including domestic irrigation primary contact recreationaesthetics human health in non-use scenarios (ie vapour flux) and possibly also potable
Contaminants of Potential Concern (COPC)
The contaminants of potential concern (COPC) for the Thebarton EPA Assessment Area comprise a number of CHC The main COPC has been identified as trichloroethene (TCE) a solvent historically used for metal cleaningdegreasing activities in various manufacturing industries Additional COPC identified for the assessment area include the breakdown products of TCE namely 12-dichloroethene (12-DCE cis- and trans-) and vinyl chloride (VC) as well as other solvents such as tetrachloroethene (PCE) and 11-dichloroethene (11-DCE)
80607-1 REV1 30102017 PAGE IX
EPA REF 0524111 FINAL REPORT STAGE 1 ENVIRONMENTAL ASSESSMENT THEBARTON ASSESSMENT AREA
Scope of work
A groundwater and soil vapour monitoring program was undertaken by Fyfe across the Thebarton EPA Assessment Area between May and August 2017 It involved the following scope of work
installation of a total of 41 WMStrade units to 1 m BGL in an approximate grid-pattern across the entire assessment area (Round 1) and at specific targeted locations (Round 2) followed by laboratory analysis of retrieved sample units for specific CHC
drilling and installation of 25 groundwater wells to depths of between 15 and 19 m BGL including a background well to the east of the southern portion of the assessment area
testing of 30 selected groundwater well drill core samples for geotechnical parameters
gauging and sampling of the 25 newly installed groundwater wells as well as an existing well located in Admella Street followed by laboratory analysis of all samples for specific CHC and 10 selected samples for major cationsanions natural attenuation parameters and additional nutrients
aquifer permeability (rising and falling head ldquoslugrdquo) testing of 10 groundwater wells
drilling and installation of 13 soil vapour bores including 11 nested bores (ie to 1 and 3 m BGL) and two bores to 1 m BGL and
sampling of all soil vapour bores followed by laboratory analysis of samples for specific CHC and general gases
The soil vapour data were used to undertake a VIRA aimed at predicting indoor air concentrations of TCE under various land use and building construction scenarios In order to validate the results of the modelling which includes a number of conservative assumptions and is therefore expected to over-estimate potential risk the EPA has commissioned indoor air monitoring in a number of residential properties within the Thebarton EPA Assessment Area ndash the indoor air monitoring results will be reported under separate cover
Groundwater fate and transport modelling was undertaken to provide a preliminary estimate of the future extent of CHC impacted groundwater within the Thebarton EPA Assessment Area The provision of this information is aimed at supporting the definition (extent and geometry) of a potential future Groundwater Prohibition Area (GPA) to be designated by the EPA in accordance with the provisions of Section S103S of the Environment Protection Act 1993
80607-1 REV1 30102017 PAGE X
EPA REF 0524111 FINAL REPORT STAGE 1 ENVIRONMENTAL ASSESSMENT THEBARTON ASSESSMENT AREA
Identified impacts
Contaminants identified in the Q1 aquifer beneath the Thebarton EPA Assessment Area include TCE PCE 12-DCE (cis- and trans-) and 11-DCE Although TCE PCE and 11-DCE are all considered to represent primary contaminants TCE is considered to be the main COPC (ie with the highest concentrations and greatest distribution) By comparison cis- and trans-12-DCE which are considered to represent break-down
Groundwater
(ie daughter) products of TCE andor PCE occur at relatively minor concentrations at scattered locations and were not considered indicative of significant TCE breakdown (ie via dechlorination) Although VC represents another (expected) daughter product of TCE it was not detected in any of the groundwater wells tested
The groundwater TCE plume is considered to have migrated in a north-westerly direction from the suspected (Austral) source site in accordance with the predominant flow direction associated with the Q1 aquifer The plume has been traced as far west and north as Dew Street and Smith Street respectively within the Thebarton EPA Assessment Area (ie the extent of the monitoring well network installed by Fyfe) ndash whereas its north-western extent has not yet been determined the groundwater CHC plume has been delineated in all other directions
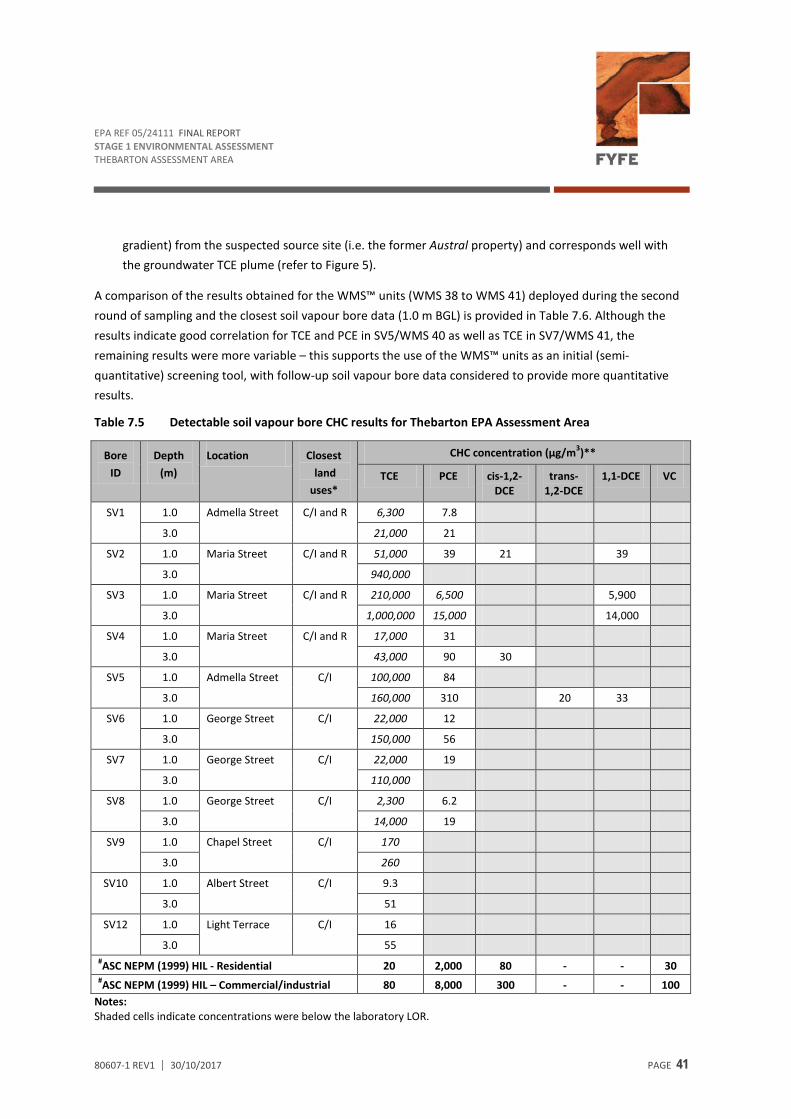
Contaminants identified in soil vapour beneath the Thebarton EPA Assessment Area include TCE PCE 12-DCE (cis- and trans-) and 11-DCE The distribution of TCE in soil vapour at 1 and 3 m BGL generally correlates with the north-westerly groundwater flow direction and is therefore considered to be a product of volatilisation from the groundwater CHC plume ndash the consistent decrease in soil vapour concentrations with decreasing depth also supports this conclusion
Soil vapour
The soil vapour samples with the maximum TCE concentrations also had the highest PCE and 11-DCE concentrations (or elevated laboratory limits of reporting (LOR)) thereby suggesting that they could represent co-contaminants (ie from a similar source areaactivity) These samples also had elevated LOR for 12-DCE (cis- and trans-)
Although VC was not detected in any of the soil vapour samples the laboratory LOR for VC in most of the samples with the highest concentrations of TCE exceeded the adopted health investigation levels (HILs) for residential andor commercialindustrial land use Although the absence of VC in soil vapour cannot therefore be confirmed its absence at detectable levels in groundwater suggests that (limited) TCE degradation has not yet resulted in its production
Although the extent of the soil vapour TCE plume has not yet been determined (ie in any direction) it is expected to have a similar extent to that of the identified groundwater plume (ie as the groundwater CHC impacts represent the source of the measured soil vapour CHC concentrations)
80607-1 REV1 30102017 PAGE XI
EPA REF 0524111 FINAL REPORT STAGE 1 ENVIRONMENTAL ASSESSMENT THEBARTON ASSESSMENT AREA
Assessment of risk
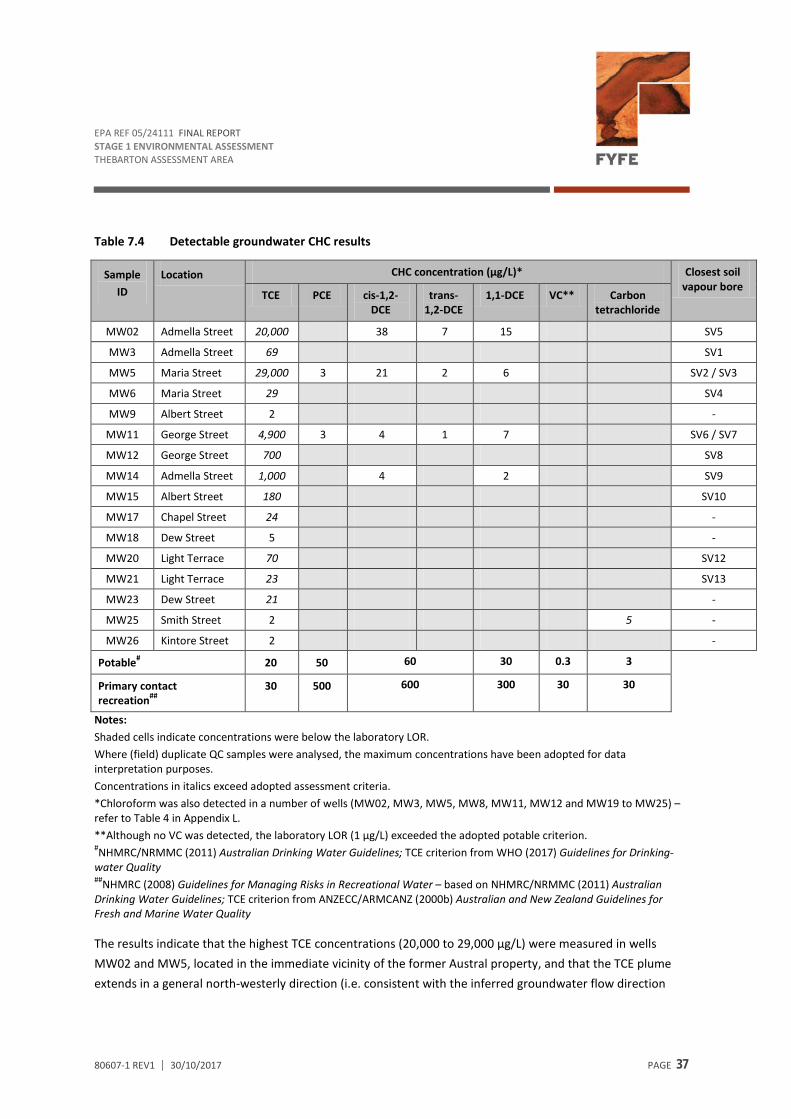
Measured concentrations of TCE exceeded the adopted assessment criteria for potable use andor primary contact recreation in wells located on Admella Maria George Albert Chapel and Dew Streets as well as Light Terrace ndash with the highest concentrations corresponding to the ldquocorerdquo area of the plume One well on Albert Street also contained a concentration of carbon tetrachloride that exceeded the respective potable criterion
Groundwater risks
Although groundwater vapour flux has mainly been addressed by the VIRA it could also occur during the extraction of groundwater for domestic use and in terms of aesthetic considerations the CHC impacted groundwater could be odorous
Additional parameters measured for the purpose of establishing general aquifer conditions (including whether conditions may be amenable to the breakdown of CHC) have also been reported ndash no clear secondary lines of evidence for the occurrence of natural attenuation have been identified
The groundwater modelling undertaken by Arcadis involved the development of an Groundwater fate and transport initial groundwater flow model using MODFLOW followed by the development of a modelling site-specific (three-dimensional) solute transport model using the MT3DMS transport
code
The results of this modelling were interpreted to indicate the following
although scattered detectable concentrations of 12-DCE have been measured in groundwater across the Thebarton EPA Assessment Area the absence of significant and ubiquitous TCE daughter products indicate that substantial dechlorination is not occurring and
the dissolved phase groundwater TCE plume is predicted to extend by another 500 m (ie beyond the boundaries of the current Thebarton EPA Assessment Area) over the next 100 years whereas no significant lateral plume expansion is expected
The VIRA undertaken by Arcadis involved a two-tier assessment approach Whereas Vapour intrusion the Tier 1 screening risk assessment compared the measured soil vapour CHC concentrations to (modified) guideline values the Tier 2 risk assessment involved the application of the Johnson and Ettinger vapour intrusion model to predict indoor air CHC concentrations for residential (slab on grade crawl space and basement construction) and commercialindustrial (slab on grade construction) properties across the assessment area Site-specific geotechnical parameters and soil vapour data collected from 1 and 3 m BGL throughout the Thebarton EPA Assessment Area were used in the modelling It should be noted that overall the vapour modelling
risks
80607-1 REV1 30102017 PAGE XII
EPA REF 0524111 FINAL REPORT STAGE 1 ENVIRONMENTAL ASSESSMENT THEBARTON ASSESSMENT AREA
undertaken is expected to provide an over-estimation of the actual vapour exposure concentrations
The results of the VIRA with respect to the predicted indoor air concentrations of TCE within residential properties (assuming crawl space construction) versus adopted EPA response levels indicated that 21 (ie of approximately 130 residential properties) were predicted to have detectable levels of TCE in indoor air that require further action as follows
10 properties within the investigation range (2 to lt20 microgm3)
eight properties within the intervention range (20 to lt200 microgm3) and
three properties within accelerated intervention range (ge200 microgm3)
All remaining residential properties in the Thebarton EPA Assessment Area are considered to be safe from soil vapour intrusion with predicted indoor air concentrations of TCE below 2 microgm3 (assuming crawl space construction) Based on the results of the VIRA however substantially increased risks are likely to exist should cellarsbasements be present whereas risks may be lower for slab on grade construction premises
Where permission has been granted by the ownersoccupiers indoor air monitoring of properties within the 20 to lt200 microgm3 and ge200 microgm3 response level ranges as well as selected adjoining properties has been commissioned by the EPA to validate the results of the VIRA modelling (ie which is expected to be overly-conservative) ndash these results will be documented in a subsequent report
Calculated vapour intrusion risks to workers within commercialindustrial properties (slab on grade construction) across at least part of the Thebarton EPA Assessment Area (ie as determined for the maximum soil vapour CHC concentrations in soil vapour bore SV3 located on Maria Street) are considered to be unacceptable Although a basementcellar is known to be present at one commercial property on George Street vapour intrusion risks to subsurface structures associated with commercialindustrial properties have not yet been assessed
A qualitative assessment of potential risks to subsurface trenchmaintenanceutility workers indicated that exposure management may be required in areas where TCE concentrations at 1 m BGL are above 100 microgm3 (ie corresponding to 50 times the acceptable concentration for indoor air) Exposure management should involve the development of a site-specific health and safety plan (prior to the commencement of work in the affected area) that details measures such as restricting personnel exposure times monitoring volatile compounds using a photoionisation detector (PID) unit providing increased ventilation and using appropriate personal protective equipment (eg gas masks) as required
80607-1 REV1 30102017 PAGE XIII
EPA REF 0524111 FINAL REPORT STAGE 1 ENVIRONMENTAL ASSESSMENT THEBARTON ASSESSMENT AREA
Data gaps
Based on the results obtained during the recent Fyfe investigations as well as available historical information the following data gaps have been identified for the Thebarton EPA Assessment Area
property information assumed for the vapour intrusion modelling has not been confirmed (ie current land use (residential versus commercial) building construction type (slab crawl space presence of basements and cellars including cellarsbasements for commercial properties)
groundwater uses considered for the beneficial use assessment have not been confirmed (whether bores are registered or not)
the conclusions are based on a single sampling event meaning the understanding of temporal and spatial variation is limited for both groundwater and soil vapour and
the groundwater contamination has not been fully delineated in the hydraulically down-gradient direction (north-west) and hence the groundwater fate and transport modelling is not validated
Notes ie the interim soil vapour HILs adopted from the National Environment (Assessment of Site Contamination) Measure 1999 (as revised in 2013 ndash ie the ASC NEPM (1999)) but assuming a sub-slab to indoor air attenuation factor of 003 as compared to the value of 01 adopted by the ASC NEPM (1999)
80607-1 REV1 30102017 PAGE XIV
EPA REF 0524111 FINAL REPORT STAGE 1 ENVIRONMENTAL ASSESSMENT THEBARTON ASSESSMENT AREA
1 INTRODUCTION
11 Purpose
Fyfe Pty Ltd (Fyfe) was commissioned by the South Australian Environment Protection Authority (SA EPA referred to herein as the EPA) to undertake Stage 1 groundwater and soil vapour investigation works groundwater fate and transport modelling and a human health vapour intrusion risk assessment (VIRA) within an EPA designated assessment area located within Thebarton South Australia (herein referred to as the Thebarton EPA Assessment Area) The location and extent of the Thebarton EPA Assessment Area referenced within this document is identified on Figure 1
12 General background information
Previous environmental assessment work undertaken since 1994 (as summarised in Appendix A) combined with historical information provided by the EPA (as included in Appendix B) indicates that the Thebarton EPA Assessment Area has been used for mixed residential and commercialindustrial purposes over time
Groundwater impacts2 identified within the uppermost (Quaternary ndash Q1) aquifer in the vicinity of the former Austral sheet metal works (Austral) on George Street included both petroleum hydrocarbons (ie diesel fuel) as well as chlorinated hydrocarbon compounds (CHC) such as trichloroethene (TCE) and were first notified to the EPA in 2006
Available historical information for the Austral property (ie the suspected source site) indicates that it operated from the 1920s until the 1960s-1970s and occupied an extensive area of Thebarton including
part of the southern side of George Street extending from about half way between East Terrace3 and Admella Street (ie 11-25 George Street) to the west of Admella Street (ie 31-35 George Street)
the entire northern side of Maria Street from East Terrace to the west of Admella Street
part of the southern side of Maria Street (ie from 21 Maria Street) to Admella Street and
25-27 East Terrace
2 Note that the term ldquoimpactrdquo has been used by Fyfe to indicate identified concentrations of compounds (specifically chlorinated hydrocarbons) that are not naturally occurring (ie concentrations above background that have resulted from anthropogenic activities) The use of this term does not denote that the presence of these compounds represents a risk to either human health or the environment and the term ldquoimpactrdquo is therefore not directly interchangeable with the term ldquoSite Contaminationrdquo the latter defined under the Environment Protection Act 1993 to include actual or potential harm to human health andor the environment
3 now James Congdon Drive
80607-1 REV1 30102017 PAGE 1
EPA REF 0524111 FINAL REPORT STAGE 1 ENVIRONMENTAL ASSESSMENT THEBARTON ASSESSMENT AREA
Historical newspaper articles described the Austral property as hosting a factory that extended over more than three acres and included an electroplating facility In 1938 it was described as the largest aluminium utensil manufacturing company in the southern hemisphere
Other potential sources of groundwater contamination4 identified within the Thebarton EPA Assessment Area include a former gas works (ie located to the south and south-east of the Austral property and including the current Ice Arena property) a mechanicrsquos workshop another sheet metal working facility and a farm machinery manufacturer
The Stage 1 assessment work described herein was commissioned by the EPA to determine whether historical contamination in the vicinity of George Street was presenting a risk to human health or the environment
13 Definition of the assessment area
As detailed on Figure 1 the current EPA Assessment Area covers an area of approximately 27 ha within the suburb of Thebarton located approximately 2 km north-west of the Adelaide central business district (CBD)
The boundaries of the Thebarton EPA Assessment Area were established by the EPA on the basis of the following
the previous identification of groundwater CHC contamination associated with properties located at 31-37 George Street and 39 Smith Street in Thebarton (refer to Appendix A)
the fact that although the George Street property (andor the broader Austral facility of which it formed a part) was suspected to be located in the vicinity of the source the specific source site had not yet been confirmed and
the identification of an inferred (general) north-westerly groundwater flow direction within the Q1 aquifer
14 Identification of contaminants of potential concern
The contaminants of potential concern (COPC) for the Thebarton EPA Assessment Area comprise a number of CHC The main COPC has been identified as trichloroethene (TCE) a solvent historically used for metal cleaningdegreasing activities in various manufacturing industries Additional COPC identified for the assessment area include the breakdown products of TCE namely 12-dichloroethene (12-DCE cis- and trans) and vinyl chloride (VC) as well as other solvents such as tetrachloroethene (PCE) and 11-dichloroethene (11-DCE)
Site Contamination is defined by the Environment Protection Act 1993 as existing if chemical substances are present on or below the surface of a site in concentrations above background the contaminants are there as a result of activity at the site or elsewhere and their presence has resulted in actual or potential harm (that is not trivial) to the health and safety of human beings taking into account current and proposed land uses or water or the environment
PAGE 2 80607-1 REV1 30102017
4
EPA REF 0524111 FINAL REPORT STAGE 1 ENVIRONMENTAL ASSESSMENT THEBARTON ASSESSMENT AREA
15 Objectives
As defined by the EPA the key objectives of the recent Stage 1 environmental assessment program undertaken within the Thebarton EPA Assessment Area (refer to Figure 1) were to
further delineate the chlorinated hydrocarbon contamination in groundwater
further delineate the chlorinated hydrocarbon contamination in soil vapour initially using Waterloo Membrane Samplers (WMStrade) and
undertake a Human Health Risk Assessment Vapour Intrusion Risk Assessment (HHRAVIRA) based on the data collected
With respect to the VIRA the EPA requested that there be specific consideration of
residential properties (slab on grade)
residential properties (crawl space)
residential properties (with basement) and
trenchmaintenanceutility workers that may be working in the vicinity of the contamination
80607-1 REV1 30102017 PAGE 3
EPA REF 0524111 FINAL REPORT STAGE 1 ENVIRONMENTAL ASSESSMENT THEBARTON ASSESSMENT AREA
2 CHARACTERISATION OF THE ASSESSMENT AREA
21 Site identification
For the purpose of this investigation program the Thebarton EPA Assessment Area (as delineated in Figure 1) has been defined by the following roadways
North northern verge of Smith Street
South Maria Street (between Dew Street and Albert Street) portion of Parker Street (between Maria Street and Goodenough Street) and Goodenough Street (between Parker Street and James Congdon Drive)
East western verge of Port Road and James Congdon Drive and
West western verge of Dew Street
22 Regional geology and hydrogeology
221 Geology
The Thebarton area is located within the Adelaide Plains approximately 8 km to the east of Gulf St Vincent and to the west of the Para Fault It lies within the Golden Grove ndash Adelaide Embayment area of the St Vincent Basin which consists of a succession of Tertiary and Quaternary age sediments (with thicknesses of up to 600 m) overlying basement rocks
The 1250000 Adelaide geological map (SA Department of Mines and Energy 1969) indicates that the near-surface geology of the area consists primarily of Quaternary aged soils and sediments including the Pooraka and Hindmarsh Clay formations The Pleistocene aged Pooraka Formation generally comprises a thickness of approximately 10 m and is of alluvial origin comprising sandy clays and clayey to sandy silts interbedded with layers of clay sand andor gravel The underlying Pleistocene aged Hindmarsh Clay Formation represents the basal unit of the Adelaide Plains and has a maximum general thickness of more than 100 m It generally comprises a basal gravel layer a middle layer of mottled medium to high plasticity (red-brown yellow brown greygreen to orange) often stiff to hard clays and an upper layer of fluvial and alluvial red-brown silty sand Gerges (1999) describes Hindmarsh Clay as comprising a mottled brown to pale olive grey predominantly clay formation that becomes green grey towards the basal section (approximately 16 to 20 m below ground level (BGL)) and is characterised by an increasing gravel content with depth
Underlying the Hindmarsh Clay are sands and limestone of Tertiary age which are in turn underlain by metamorphosed basement rock of the Proterozoic Umberatana Group
80607-1 REV1 30102017 PAGE 5
EPA REF 0524111 FINAL REPORT STAGE 1 ENVIRONMENTAL ASSESSMENT THEBARTON ASSESSMENT AREA
222 Hydrogeology
According to Gerges (2006) the aquifers identified within the Quaternary aged sediments of the Adelaide Plains are typically found within the coarser interbedded silt sand and gravel layers of the Hindmarsh Clay Formation and vary greatly in thickness (typically from 1 to 18 m) lithology and hydraulic conductivity Confining beds between the Quaternary aquifers consist of clay and silt layers and range in thickness from 1 to 20 m These confining beds vary in terms of the amount of coarser grained material they contain their bulk hydraulic conductivity andor the presence and density of fractures In addition their absence in some areas allows direct hydraulic connection between the aquifers
The Thebarton area is located within Hydrogeological Zone 3 (Subzone 3E) of Gerges (2006) This zone contains five to six Quaternary aquifers and three to four almost flat-lying Tertiary aquifers The first Tertiary aquifer estimated by Gerges (2006) to be intersected at a depth of approximately 130 m BGL near the Para Fault is most frequently accessed for industrial and recreational groundwater use
The Q1 aquifer assessed as part of the current investigations is typically located at depths of between 3 and 10 m BGL beneath the Adelaide Plains with an average thickness of 2 m The Q1 aquifer contains water of variable salinity with Subzone 3E including a range of 500 to 3500 mgL total dissolved solids (TDS) The gradient of the Q1 aquifer is generally flat (particularly to the west of the Para Fault) and flow direction is typically towards the north-west
A search of the registered bore database maintained by the Department of Environment Water and Natural Resources (DEWNR (2017) WaterConnect database) identified 59 bores within the general Thebarton area of which 18 are located in the Thebarton EPA Assessment Area Although eight bores were installed for monitoring purposes on or immediately adjacent to the property located at 31-37 George Street (ie part of the former Austral facility) it is understood that only one bore (6628-21951 ndash located within the Admella Street roadway intersecting the Q1 aquifer and identified as MW01 in Appendix A but MW02 by Fyfe5) remains in situ
In addition to numerous monitoringinvestigationobservation bores the Q1 aquifer within the general (ie broader) Thebarton area is recorded in the DEWNR (2017) database as being accessed for drainage domestic and industrial purposes
DEWNR (2017) information for registered bores located within the general Thebarton area is included in Appendix C whereas information for bores located within the Thebarton EPA Assessment Area (excluding those associated with the property at 31-37 George Street and installed solely for monitoring purposes6) is summarised in Table 21
5 This existing groundwater well was identified as MW02 by Fyfe in accordance with the markings on the gatic cover and the DEWNR (2017) WaterConnect bore identification details although it was originally installed as MW01 by REM (refer to discussion of previous reports in Appendix A)
6 ie 6628-21951 6628-21952 6628-22229 to 6628-22233 and 6628-22236
PAGE 6 80607-1 REV1 30102017
EPA REF 0524111 FINAL REPORT STAGE 1 ENVIRONMENTAL ASSESSMENT THEBARTON ASSESSMENT AREA
Table 21 Information regarding registered groundwater bores located within the Thebarton EPA Assessment Area
Bore ID Location Purpose Status Maximu SWL Salinity Yield Aquifer m well (m (mgL (Lsec
Tertiary (T1)
depth BGL) TDS) ) (m BGL)
125 6628-516 Coca Cola plant Rehabilitated 138 1963 794
6628-1435 Coca Cola plant Backfilled 184 212 921 392 Tertiary (T1)
6628-4576 Corner of Admella amp Chapel Streets
125 1454 445 Tertiary (T1)
6628-7724 Coca Cola plant Observation 155 2017 1272 1516 Tertiary (T1)
6628-7725 Coca Cola plant Observation 127 3016 1100 1005 Tertiary (T1)
6628-12516 Coca Cola plant Industrial Backfilled 210 212 1300 1875 Tertiary (T1)
6628-20663 39 Smith Street Irrigation 121 1105 50 Tertiary (T1)
6628-20969 39 Smith Street Industrial 30 14 1535 25 Quaternary (Q1)
6628shy21951
Admella Street 20 Quaternary (Q1)
6628-22395 21 James Congdon Drive
20 157 1541 05 Quaternary
6628-23525 41 Maria Street 206 273 1078 10 Tertiary (T1)
Notes Shading indicates that information was not recorded in the database as interpreted from information provided in the database ndash approximate only in some instances
ie MW02 as included in the groundwater monitoring program of Fyfe ndash refer to Table 31 Abbreviations BGL = below ground level SWL = standing water level TDS = total dissolved solids
23 Data quality objectives
The Data Quality Objective (DQO) process as described in Australian Standard AS44821-2005 and the National Environment Protection (Assessment of Site Contamination) Measure (ASC NEPM 1999)7
Schedule B2 Guideline on Data Collection Sample Design and Reporting and more fully documented in the NSW DEC (2006) Guidelines for the NSW Site Auditor Scheme involves a seven-step iterative approach that was initially developed by the United States Environment Protection Agency (US EPA) to facilitate the systematic planning and verification of contaminated sites assessment projects
As stated in Schedule B2 of the ASC NEPM (1999) the first six steps of the DQO process comprise the development of qualitative and quantitative statements that define the objectives of the site assessment program and the quantity and quality of data needed to inform risk-based decisions These steps enable the
All references to the ASC NEPM (1999) refer to the version amended on 16 May 2013
80607-1 REV1 30102017 PAGE 7
7
EPA REF 0524111 FINAL REPORT STAGE 1 ENVIRONMENTAL ASSESSMENT THEBARTON ASSESSMENT AREA
project team to communicate the goals decisions constraints (eg time budget) and uncertainties associated with the project and detail how they are to be addressed The seventh step comprises the development of a Sampling and Analysis Quality Plan (SAQP) to generate the data required to adequately characterise site contamination issues and assess their associated potential environmental and human health risks under the proposed land use scenario
The DQOs defined for the Thebarton EPA Assessment Area are summarised in Table 22
Table 22 Data Quality Objectives
Objective Comment
Step 1 ndash Statement of the Problem According to information provided to Fyfe by the EPA (as summarised in Appendix A) a property located at 31-37 George Street (immediately west of Admella Street) in Thebarton and historically occupied by part of the Austral facility had been found to be underlain by groundwater CHC (primarily TCE) impacts More recent reporting to the EPA for a property at 39 Smith Street located approximately 350 m north-west (and hydraulically down-gradient) of the George Street property indicated that detectable CHC (predominantly TCE) were also present within groundwater Since this area of Thebarton is occupied by a mixture of commercialindustrial and residential properties and the source and extent of the CHC impacts within the Q1 aquifer had not yet been determined potential risks to human health andor the environment had yet to be assessed
Step 2 ndash The Decision that Needs The assessment works commissioned by the EPA were necessitated to to Result from the Investigation investigate the source extent and magnitude of the groundwater CHC
contamination beneath a designated area of Thebarton (ie that included both the George Street and Smith Street properties) and to understand the possible risk to public health from potential vapour generation Fyfe have therefore undertaken vapour modelling and intrusion risk assessment works aimed at evaluating whether concentrations of identified groundwater andor soil vapour contaminants pose an unacceptable risk to human health In addition groundwater fate and transport modelling has been undertaken to predict the extent of the plume This will assist the EPA to determine a potential future Groundwater Prohibition Area (GPA) in accordance with the provisions of Section 103S of the Environment Protection Act 1993
Step 3 ndash Inputs to the Decision The information that was required to resolve the decision statement included the collection of physical and chemical data from across the Thebarton EPA Assessment Area The collected data as well as physical observations regarding the geology of the area and possible preferential contaminant pathways was used to determine potential risks to human health via groundwater fate and transport and vapour intrusion modelling
Step 4 ndash Boundaries of the Investigation
The lateral boundaries of the Thebarton EPA Assessment Area are as defined in Sections 13 and 21 as depicted on Figure 1 Vertically the investigations extended as far as the maximum drilled depth (19 m BGL)
Step 5 ndash Decision Rules The decision rule will be based upon the identification of predicted indoor air concentrations of CHC compounds associated with groundwater andor soil vapour impacts which exceed adopted response levels
PAGE 8 80607-1 REV1 30102017
EPA REF 0524111 FINAL REPORT STAGE 1 ENVIRONMENTAL ASSESSMENT THEBARTON ASSESSMENT AREA
Objective Comment
Step 6 ndash Decision Error Tolerances The purpose of establishing decision error tolerance is to control the acceptable degree of uncertainty upon which decisions are made in order to avoid the making of an incorrect decision and to enable identification of additional investigation monitoring or remediation activities required on the basis of accurate data for the protection of human health and the environment The Measuring Quality Objectives (MQO) include the quality assurance (QA) activities that were conducted during the assessment the quality control (QC) acceptance criteria applicable to the assessment and the adopted Data Quality Indicators (DQIs) as follows (and further discussed in Section 5) completeness ndash a measure of the amount of useable data from a data
collection activity comparability ndash the confidence (expressed qualitatively) that data may be
considered to be equivalent for each sampling and analytical event representativeness ndash the confidence (expressed qualitatively) that data
are representative of each media present on the site precision ndash a quantitative measure of the variability (or reproducibility) of
data and accuracy (bias) ndash a quantitative measure of the closeness of reported data
to the true value
Step 7 ndash Optimisation of the Data collection was undertaken in general accordance with the Sample Collection Design methodologies outlined in the relevant documentsguidelines referenced
throughout this report As determined by the EPA the data collection design included targeted sampling to investigate and delineate areas of potential groundwater and soil vapour contamination and to assess potential associated human health risks
80607-1 REV1 30102017 PAGE 9
EPA REF 0524111 FINAL REPORT STAGE 1 ENVIRONMENTAL ASSESSMENT THEBARTON ASSESSMENT AREA
3 SCOPE OF WORK
The scope of work undertaken by Fyfe was generally consistent with that requested within the original EPA request for quote (RFQ) dated 27 March 2017 Some modifications to the original workscope occurred based on site findings and additional site information was collected where required and as agreed with the EPA in order to achieve the EPArsquos project objectives outlined in Section 15
As identified in the RFQ the scope of work was designed to
provide an initial delineation of CHC impacts in soil vapour through the deployment of Waterloo Membrane Samplers (WMStrade) as a screening tool
further delineate the previously identified CHC impacts in groundwater
decide based on the results of the WMStrade and groundwater results the need for the number of and the locations of permanent soil vapour monitoring bores
identify the nature extent and potential source area(s) of the identified CHC impacts in groundwater andor soil vapour
determine the likely fate and transport of the groundwater CHC plume to support the establishment of a potential future GPA
determine the potential human health (including vapour intrusion) risk(s) on the basis of the data collected and
ascertain whether or not a public health risk exists within the Thebarton EPA Assessment Area
The scope of work is further detailed in Section 32 Variations from the scope of work originally requested in the EPA RFQ were agreed with the EPA during the course of the project and included the following
deployment of an additional four WMStrade units ndash ie 41 in total as compared to the original allowance of 37
installation (and sampling) of an additional six nested soil vapour bores (to depths of 1 and 3 m BGL) ndash ie 11 in total as compared to the original allowance of five
installation (and sampling) two individually located (ie as opposed to the nested locations) soil vapour bores to a depth of 1 m BGL ndash ie as compared to the original allowance of 10
installation (and sampling) of 25 groundwater monitoring wells ndash ie as compared to the original allowance of 20 and
sampling of an existing well in Admella Street (MW02) ndash ie not included in the original EPA scope
80607-1 REV1 30102017 PAGE 11
EPA REF 0524111 FINAL REPORT STAGE 1 ENVIRONMENTAL ASSESSMENT THEBARTON ASSESSMENT AREA
31 Preliminary work
Preliminary work involved the following
review and summation of all available historical reports (as supplied by the EPA) ndash refer to Appendix A
development of a preliminary (working) conceptual site model (CSM) based on a review of the historical data
preparation of a detailed health and safety plan covering all aspects and stages of the work and
detailed planning with key stakeholders prior to the execution of the field investigation program
32 Field investigation and laboratory analysis program
The scope of the field investigation program undertaken by Fyfe between 31 May and 28 August 2017 is summarised in Table 31 whereas the scope of the laboratory testing program is summarised in Table 32
A plan showing the various assessment point locations is included as Figure 2
Table 31 Scope of field investigation program ndash May to August 2017
Scope Item Description of works Date of works
Passive soil vapour sampling ndash Round 1
Thirty-seven WMStrade units identified as WMS 1 to WMS 37 were installed within the soil profile to 1 m BGL at scattered (approximately grid-like) locations across the Thebarton EPA Assessment Area
31 May and 1 to 2 June
The WMStrade units were extracted and forwarded to the analytical laboratory 7 June
Soil bores were located using a hand-held global positioning system (GPS) unit before being backfilled with (drillerrsquos) sand
7 August
Monitoring well drilling and installation
Individual groundwater well permits were obtained from DEWNR prior to well installation ndash copies of the well permits are included in Appendix D Groundwater monitoring wells (MW1 MW3 and MW5 to MW26) were installed to depths of between 15 and 19 m BGL at 24 locations across the Thebarton EPA Assessment Area Background well MW4 was installed to 19 m BGL within a public recreational area located across James Congdon Drive to the east (ie near the south-eastern corner of the Thebarton EPA Assessment Area) All 25 newly installed wells were developed following installation
28 to 30 June 3 to 7 July and 10 to 14 July
Geotechnical soil testing
Intact soil cores collected during the drilling of 10 groundwater wells (MW3 MW5 MW7 MW11 MW12 MW17 MW19 MW21 MW22 and MW25) were forwarded to the analytical laboratory for geotechnical testing
Groundwater gauging
All 25 newly installed monitoring wells (MW1 and MW3 to MW26) as well as the existing Admella Street well (MW02) were gauged to assess total well depth standing water level (SWL) and the presenceabsence of non aqueous phase liquid (NAPL) This was undertaken as a discrete event prior to the commencement of groundwater sampling
18 July
PAGE 12 80607-1 REV1 30102017
EPA REF 0524111 FINAL REPORT STAGE 1 ENVIRONMENTAL ASSESSMENT THEBARTON ASSESSMENT AREA
Scope Item Description of works Date of works
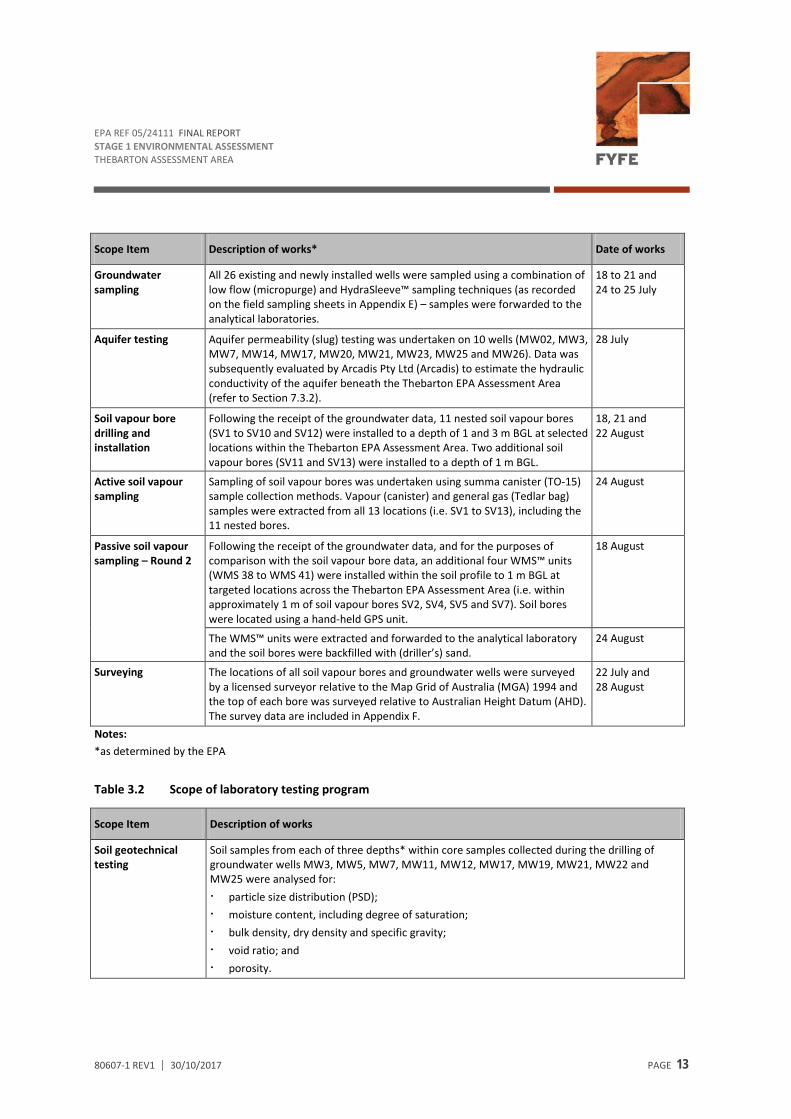
Groundwater sampling
All 26 existing and newly installed wells were sampled using a combination of low flow (micropurge) and HydraSleevetrade sampling techniques (as recorded on the field sampling sheets in Appendix E) ndash samples were forwarded to the analytical laboratories
18 to 21 and 24 to 25 July
Aquifer testing Aquifer permeability (slug) testing was undertaken on 10 wells (MW02 MW3 MW7 MW14 MW17 MW20 MW21 MW23 MW25 and MW26) Data was subsequently evaluated by Arcadis Pty Ltd (Arcadis) to estimate the hydraulic conductivity of the aquifer beneath the Thebarton EPA Assessment Area (refer to Section 732)
28 July
Soil vapour bore drilling and installation
Following the receipt of the groundwater data 11 nested soil vapour bores (SV1 to SV10 and SV12) were installed to a depth of 1 and 3 m BGL at selected locations within the Thebarton EPA Assessment Area Two additional soil vapour bores (SV11 and SV13) were installed to a depth of 1 m BGL
18 21 and 22 August
Active soil vapour sampling
Sampling of soil vapour bores was undertaken using summa canister (TO-15) sample collection methods Vapour (canister) and general gas (Tedlar bag) samples were extracted from all 13 locations (ie SV1 to SV13) including the 11 nested bores
24 August
Passive soil vapour sampling ndash Round 2
Following the receipt of the groundwater data and for the purposes of comparison with the soil vapour bore data an additional four WMStrade units (WMS 38 to WMS 41) were installed within the soil profile to 1 m BGL at targeted locations across the Thebarton EPA Assessment Area (ie within approximately 1 m of soil vapour bores SV2 SV4 SV5 and SV7) Soil bores were located using a hand-held GPS unit
18 August
The WMStrade units were extracted and forwarded to the analytical laboratory and the soil bores were backfilled with (drillerrsquos) sand
24 August
Surveying The locations of all soil vapour bores and groundwater wells were surveyed by a licensed surveyor relative to the Map Grid of Australia (MGA) 1994 and the top of each bore was surveyed relative to Australian Height Datum (AHD) The survey data are included in Appendix F
22 July and 28 August
Notes as determined by the EPA
Table 32 Scope of laboratory testing program
Scope Item Description of works
Soil geotechnical testing
Soil samples from each of three depths within core samples collected during the drilling of groundwater wells MW3 MW5 MW7 MW11 MW12 MW17 MW19 MW21 MW22 and MW25 were analysed for particle size distribution (PSD) moisture content including degree of saturation bulk density dry density and specific gravity void ratio and porosity
80607-1 REV1 30102017 PAGE 13
EPA REF 0524111 FINAL REPORT STAGE 1 ENVIRONMENTAL ASSESSMENT THEBARTON ASSESSMENT AREA
Scope Item Description of works
Groundwater testing Groundwater samples from all 26 wells were analysed for the COPC detailed in Section 14 As requested by the EPA groundwater samples from selected wells (MW02 MW5 MW8 MW9 MW12 MW17 MW21 MW22 MW23 and MW26) were also analysed for the following major cations and anions (calcium magnesium sodium potassium chloride and alkalinity)
and natural attenuation parameters (carbon dioxide (CO2) sulfate iron manganese nitrate) Additional components reported by the analytical laboratory included nitrite and nitrate + nitrite
Soil vapour testing The WMStrade units deployed during each of Rounds 1 and 2 were analysed for the COPC detailed in Section 14 The soil vapour (summa canister) samples were analysed for the COPC detailed in Section 14 as well as 2-propanol and general gases (helium hydrogen oxygen nitrogen methane carbon dioxide ethane propane butane iso-butane pentane iso-pentane hexane argon carbon monoxide and ethylene)
Notes Specific sample depths are detailed in the relevant laboratory reports in Appendix G also known as isopropyl alcohol isopropanol or IPA
33 Data interpretation
Following the receipt and collation of the field and laboratory data hydrogeological (fate and transport) and VIRA modelling (refer to Sections 8 and 9 respectively) were undertaken to enable an assessment of risk and to refine the CSM (Section 10)
PAGE 14 80607-1 REV1 30102017
EPA REF 0524111 FINAL REPORT STAGE 1 ENVIRONMENTAL ASSESSMENT THEBARTON ASSESSMENT AREA
4 METHODOLOGY
41 Field methodologies
Prior to the commencement of the field investigations a site specific Health and Safety Plan (HSP) including Safe Work Method Statements (SWMS) and a Job Hazard Analysis (JHA) was prepared ndash all personnel working at the site were required to read understand sign and conform to the HSP
Each proposed drilling location was cleared of underground services by a professional service location company (Pipeline Technologies) using conventional (electronic) service detection methods as well as ground penetrating radar (GPR) Where underground or overhead services were present andor deemed to be a potential safety risk during drilling activities the drill location was moved to an area considered by the Fyfe representative and service locator to be safe All changes to drilling locations were notified to EPA and recorded on a site plan for future reference
Given that works were undertaken within suburban streets Fyfe employed the services of a qualified traffic management company (Altus Traffic) during drilling activities in order to ensure safety for pedestrians and road users minimal disruption to traffic flow and the provision of a safe working environment
Field methodologies as detailed in Table 41 were undertaken in accordance with Fyfersquos standard operating procedures (SOPs) Relevant field sampling sheets are included in Appendices F (groundwater) and G (soil vapour ndash combined field sampling sheets and chain of custody (COC) documents) and borehole log reports are presented in Appendices H (groundwater) I (WMStrade) and J (soil vapour)
Table 41 Summary of field methodologies
Activity Details
Passive soil bore sampling The soil bores used to deploy the WMStrade units were hand augered by personnel from Fyfe and Aussie Probe to a depth of 1 m BGL SGS Australia (SGS) personnel suspended each WMStrade unit into its respective borehole from a string The hole was then sealed with an expandable foam plug inside a polyethylene sleeve and the string suspending the sampler was connected to a temporary plastic cap at the ground surface The Round 1 WMStrade units were deployed for periods of between six and seven days whereas the Round 2 WMStrade units were all deployed for six days Following retrieval by SGS each WMStrade unit was placed into a sealed glass vial and a labelled foil bag The WMStrade units did not require chilling during transport to the analytical laboratory Borehole log reports are included in Appendix I whereas combined field sampling sheets and COC documents are presented in Appendix G
80607-1 REV1 30102017 PAGE 15
EPA REF 0524111 FINAL REPORT STAGE 1 ENVIRONMENTAL ASSESSMENT THEBARTON ASSESSMENT AREA
Activity Details
Groundwater well Groundwater wells were drilled by WB Drilling using a combination of hand augering installation mechanical pushtube and solid auger techniques
Following the completion of drilling each borehole was fitted with 50 mm class 18 uPVC casing with a basal 6 m long section of slotted well screen A filter pack comprising clean graded sands of suitable size to provide sufficient inflow of groundwater was installed within the annular space between the borehole and the well casing and extended from the base of the screened interval to approximately 1 m above the termination of the slotted casing A 1 m long bentonite collar comprising pelleted or granulated bentonite was placed above the filter pack to prevent water seepage downward along the well casing or borehole from ground surface Each well was grouted up to surface level and fitted with a (lockable) steel gatic cover the latter flush mounted to prevent tripping andor other hazards Groundwater well log reports are included in Appendix H
Soil logging and Soil logging was undertaken in general accordance with the ASC NEPM (1999) which geotechnical sampling endorses AS1726-1993 In addition to the requirements of AS1726-1993 particular
attention was paid during logging to any lithological variations such as sandgravel lenses or secondary porosity (such as clay fracturing) which may act as potential preferential pathways for contaminant vapourgroundwater migration through the sub-surface as well as the presence of fill material andor any olfactory or visual evidence of contamination Soil descriptions have been included on the logs in Appendices H to J Cores for geotechnical analysis were collected using push tube sampling methodologies to obtain undisturbed samples Section(s) of core to be tested were retained (intact) within the pushtube liners and capped at each end for storage and transport to the analytical laboratory
Field screening of soils Field screening of individual soil layers was undertaken at the majority of the drilling locations and involved the use of a photoionisation (PID) unit fitted with an 117 eV lamp (ie as considered suitable for the detection of CHC) The PID unit was calibrated by the hire company prior to delivery and was checked on a daily basis against an isobutylene calibration gas of known concentration Field screen samples were collected with care to ensure that each sample was representative of the soil stratum from which it was collected and experienced minimal loss of volatile compounds The soil material was placed immediately into a zip lock bag and sealed ensuring the bag was half filled (ie such that the volume ratio of soil to air was equal) Soil clumps within the bag were manually broken up and the bag was left to rest for a minimum of five minutes but no longer than 20 minutes Prior to testing the bag was shaken vigorously to release any vapours within the soil To test the tip of the PID probe was inserted into the bag and the maximum volatile organic compound (VOC) reading recorded after a nominal 10 second period or when the reading had peaked Results were recorded on the appropriate bore log sheets presented in Appendices H to J
Groundwater well Following installation the wells were developed by purging a minimum of four well development volumes (ie until stable parameters were obtained andor until the well purged dry) from
the casing with a steel bailer andor twister pump to ensure hydraulic connectivity with the aquifer formation
Groundwater gauging Groundwater levels in the newly installed and existing monitoring wells located across the Thebarton EPA Assessment Area were gauged using an interface probe prior to the commencement of the groundwater sampling program All monitoring wells were gauged for SWL the potential presence of NAPL and the total well depth Groundwater field gauging results are presented in Appendix E
PAGE 16 80607-1 REV1 30102017
EPA REF 0524111 FINAL REPORT STAGE 1 ENVIRONMENTAL ASSESSMENT THEBARTON ASSESSMENT AREA
Activity Details
Groundwater sampling The majority of the wells were sampled using low flow (micropurge) techniques Where recovery was particularly low (ie MW4 MW8 MW15 MW18 MW19 and MW24) and unsuitable for low flow (micropurge) sampling the original sampling technique was abandoned and a HydraSleeveTM (no purge) methodology was used instead Groundwater samples were collected in laboratory-supplied screw top bottles containing appropriate preservative (if required) with no headspace allowed Samples were chilled during storage and transport to the analytical laboratory Disposable nitrile gloves worn by field personnel were changed prior to the collection of each sample Samples for metals (ie iron manganese) analysis were filtered in the field using 045 microm filters Groundwater field sampling sheets are presented in Appendix E
Low Flow Methodology The low flow sampling technique involved the following the pump was placed close to the bottom of the screened interval the flow rate (up to 05 Lmin) was regulated to maintain an acceptable level of
drawdown with minimal fluctuation of the dynamic water level during pumping and sampling
groundwater drawdown was monitored constantly during purging and sampling using an interface probe
water quality parameters were considered to have stabilised when the following ranges were recorded over three consecutive readings ndash electrical conductivity plusmn 5 ndash pH plusmn 01 ndash temperature plusmn 02degC ndash dissolved oxygen plusmn 10 ndash redox potential plusmn 10 mV
the stabilisation parameters were recorded on field logging sheets after every one litre of groundwater purged using a calibrated water quality meter and a flow cell suspended in a bucket with litre intervals marked and
samples were collected once three consecutive stabilisation parameters were recorded and a volume of between 28 and 6 litres was purged prior to sampling
HydraSleeveTM Methodology The HydraSleeveTM sampling technique involved attaching a stainless steel weight to the bottom and a wire tether clip to the throat of the HydraSleeveTM before lowering it into the water column to the desired depth and allowing it to fill with groundwater After a minimum period of 24 hours the HydraSleeveTM was quickly and smoothly withdrawn from the well and the contents were transferred into the sample containers Water quality parameters were measured after samples were decanted ndash either within the water remaining in the HydraSleeveTM or within a grab sample collected using a disposable bailer
Hydraulic testing Rising and falling head permeability (ldquoslugrdquo) tests were undertaken to estimate the hydraulic conductivity (K) of the aquifer within various parts of the Thebarton EPA Assessment Area The falling-head tests were initiated by quickly inserting a 1285 m long and 36 mm diameter solid PVC cylinder (slug) into the water column at each well to produce a sufficient sudden rise in the water level The subsequent ldquofallrdquo back to the static water level (recovery) was measured and recorded automatically and in real-time using a
80607-1 REV1 30102017 PAGE 17
EPA REF 0524111 FINAL REPORT STAGE 1 ENVIRONMENTAL ASSESSMENT THEBARTON ASSESSMENT AREA
Activity Details
pressure transducerdata logger programmed to record water levels at a one second interval After static water level conditions returned in the well the rising-head test was initiated by quickly removing the slug from the well to create a sudden drop in the water column height As with the falling-head test the rise of the water level back to a static condition (recovery) was automatically recorded
Soil vapour bore Soil vapour bores were drilled by Aussie Probe using a combination of hand augering and installation mechanical pushtube techniques
Within each 3 m deep soil vapour bore teflon tubing attached to a soil vapour probe was inserted to the base of the hole which had been prefilled with approximately 005 m of clean filter pack sand An additional 045 m of sand (ie approximately 05 m in total) was then added to the hole and topped by a bentonite plug seal of approximately 05 m thickness A second soil vapour probe was installed at a depth of about 1 m within a 05 m sand pack which was overlain by bentonite to a depth of about 02 to 03 m BGL The two 1 m deep soil vapour bores were installed in a similar manner with a sand pack extending from the base to about 05 to 06 m BGL overlain by a bentonite plug to 03 m BGL Each installation was completed with grout to surface and topped with a standard flush-mounted gatic cover Soil vapour bore log reports are included in Appendix J
Soil vapour sampling All soil vapour sampling works were undertaken by SGS using suitably trained and experienced personnel ndash SGS holds National Association of Testing Authorities (NATA) accreditation for all soil vapour sampling and laboratory analytical works Combined field sampling sheets and COC documents are presented in Appendix G Soil vapour samples were collected using summa canisters and analysed using the US EPA (1999) TO-15 method Sampling involved the connection of a passivated 1 L stainless steel canister to the teflon tubing extending from the soil vapour probe and the use of a soil gas sampling train to restrict flow to a maximum rate of 200 mLmin Canister vacuum pressure was monitored during sampling to enable calculation of the volume of sample drawn into the canister ndash the small amount of vacuum left in the canister at the end of the sampling procedure was measured in the laboratory to check if any leaks occurred during transit (refer to further discussion in Table 52) A shroud was set up around the sampling point and tracer chemicals were introduced at high concentrations by flooding the shroud with helium and placing a cloth soaked with IPA into the shroud Each canister was cleaned and certified by SGS prior to use (refer to Appendix G) and backshyup coconut shell carbon sorbent tube samples were also collected (but not analysed) Summa canisters did not require chilling during transport to the analytical laboratory
Waste disposal Waste water and surplus soil corescuttings were stored together within 205 litre drums in the rear car park of a commercialindustrial property at 19-21 James Congdon Drive (as organised by the EPA) prior to removaldisposal by a licensed waste removal company (Cleanaway) Analytical results pertaining to the soils were forwarded to the licensed receiving facility and all of the soil was classified as lsquoWaste Fillrsquo in accordance with the Environment Protection Regulations 2009 The waste transport certificates are included in Appendix K
PAGE 18 80607-1 REV1 30102017
EPA REF 0524111 FINAL REPORT STAGE 1 ENVIRONMENTAL ASSESSMENT THEBARTON ASSESSMENT AREA
42 Laboratory analysis
The following laboratories were used for the analysis of the environmental samples
complete soil cores for geotechnical sample analysis were forwarded to SMS Geotechnical
primary groundwater samples collected by Fyfe were analysed at the SGS laboratory whereas secondary groundwater samples were forwarded to EurofinsMGT and
soil vapour (including WMStrade) samples collected by SGS were analysed at their laboratory
80607-1 REV1 30102017 PAGE 19
EPA REF 0524111 FINAL REPORT STAGE 1 ENVIRONMENTAL ASSESSMENT THEBARTON ASSESSMENT AREA
5 QUALITY ASSURANCE AND QUALITY CONTROL
Data quality is typically discussed in terms of the DQIs presented in Table 22 ndash ie completeness comparability representativeness precision and accuracy In order to assess the quality of the data collected during the Fyfe investigation program against these DQIs specific QAQC procedures were implemented during both the field sampling and laboratory analysis programs as detailed in the following sections
51 Field QAQC
Field QA procedures undertaken during the recent investigations included the collection of the following QC samples aimed at assessing possible errors associated with cross contamination as well as inconsistencies in sampling andor laboratory analytical techniques
intra-laboratory duplicate (duplicate) samples submitted to the same (primary laboratory) to assess variation in analyte concentrations between samples collected from the same sampling point andor the repeatability (precision) of the analytical procedures
inter-laboratory duplicate (split or triplicate) samples submitted to a second laboratory to check on the analytical proficiency (accuracy) of the results produced by the primary laboratory
equipment rinsate blank samples collected during groundwater sampling only and used to assess cross-contamination that may have occurred from sampling equipment during sampling and
trip blank samples used to assess whether cross-contamination may have occurred between samples during transport
Whereas analyte concentrations within the rinsate and trip blank samples should be below the laboratory limit of reporting (LOR) the inter- and intra-laboratory duplicate sample results are assessed via the calculation of a relative percentage difference (RPD) as follows
(Concentration 1 minus Concentration 2) x 100RPD = (Concentration 1 + Concentration 2) 2
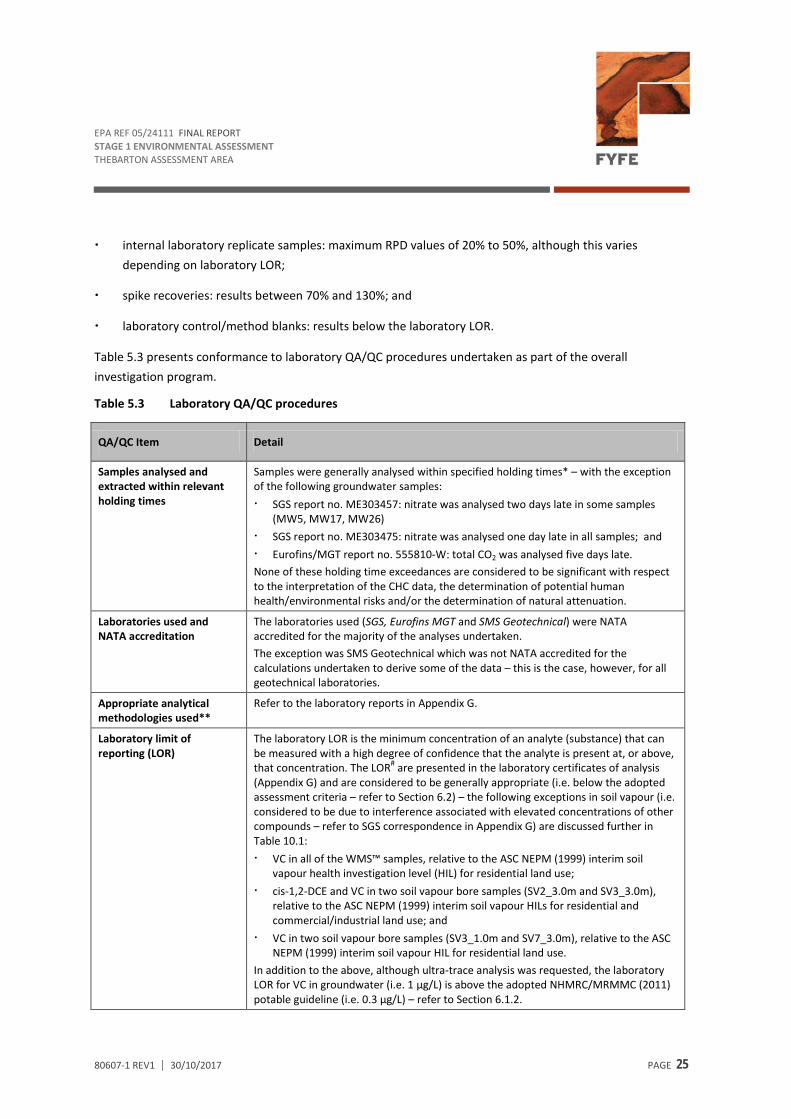
Maximum RPDs of 30 (inorganics) and 50 (organics) are generally considered acceptable with higher RPD values often recorded where concentrations of an analyte approach the laboratory LOR
All field QC sample results are included in the summary data tables in Appendix L
511 Groundwater
Table 51 presents conformance to field QAQC procedures undertaken as part of the groundwater investigations
80607-1 REV1 30102017 PAGE 21
EPA REF 0524111 FINAL REPORT STAGE 1 ENVIRONMENTAL ASSESSMENT THEBARTON ASSESSMENT AREA
Table 51 Field QAQC procedures ndash Groundwater
QAQC Item Detail
Field procedures Field procedures were undertaken in accordance with the ASC NEPM (1999) AustralianNew Zealand standards ASNZS 566711998 and ASNZS 5667111998 SA EPA (2007) and Fyfe SOPs Details are provided in Table 41
Calibration of field equipment
Documentation regarding the calibration of field equipment is included in Appendix M
Decontamination of All disposable equipment (tubing pump bladders plastic bailers bailer cord and equipment HydraSleeveTM units) were replaced between wells Re-usable equipment (micropurge pump
interface probe and HydraSleeveTM weights) was decontaminated between sampling locations using potable water and Decon 90trade phosphate free detergent
Sample preservation and storage
Samples were kept in laboratory supplied containers in a portable chilled insulated box (esky) prior to and during transport to the laboratory
Sample tracking COC documentation was used for the transport of all samples to the laboratory and is included in Appendix G
Duplicate samples Two intra-laboratory and two inter-laboratory duplicate samples were analysed for CHC with respect to 26 primary groundwater samples ndash thereby constituting an overall ratio of approximately one duplicate per 65 primary samples (or 15) compared to a generally acceptable ratio of 110 samples (or 10) One intra-laboratory and one inter-laboratory duplicate sample were analysed for the remaining parameters with respect to 10 primary groundwater samples ndash thereby constituting an overall ratio of one duplicate per five primary samples (or 20) compared to a generally acceptable ratio of 110 samples (or 10) Intra- and inter-laboratory duplicate sample RPDs were calculated where both data sets had a reported concentration above the specific analyte laboratory LOR All calculated RPDs for CHC were within the acceptable range with the exception of the following intra-laboratory duplicate sample pair MW9QW1 TCE (67) nitrate (147) and inter-laboratory duplicate sample pair MW9QW2 total CO2 (59) iron (190)
manganese (183) potassium (64) nitrate (194) The elevated RPD for TCE in the intra-laboratory duplicate sample pair is considered to be related to the low concentration detected and does not alter the interpretation of the data The other RPD exceedances are not considered significant (ie in terms of overall data interpretation) as they were not obtained for identified COPC (as defined in Section 14)
Rinsate blank samples Six equipment rinsate blank samples (one for each day of sampling) were collected from either the pump housing or a new HydraSleevetrade (final day of sampling only) and analysed for CHC to confirm the effectiveness of the decontamination procedures and the cleanliness of disposable equipment The analytical results obtained for the rinsate blank samples were all below the laboratory LOR thereby indicating that decontamination practices during the groundwater sampling program were acceptable and that no contamination was introduced by the use of the HydraSleevestrade
Trip blank samples Six trip blank samples were included within containers (eskies) of sample bottles provided by the analytical laboratory and returned to the analytical laboratory All of the trip blank samples were analysed for CHC With the exception of TB187 which contained 1 microgL TCE the analytical results obtained for the trip blank samples were all below the laboratory LOR thereby indicating that there was limited impact on sample quality during storage or transport of the samples to the analytical laboratory
PAGE 22 80607-1 REV1 30102017
EPA REF 0524111 FINAL REPORT STAGE 1 ENVIRONMENTAL ASSESSMENT THEBARTON ASSESSMENT AREA
Notes No duplicate QC samples were collected during the use of the HydraSleeveTM sampling technique as detailed in ANZECCARMCANZ (2000a) at least 5 (ie 120) duplicate samples should be analysed ndash the generally accepted industry standard however is 10 (110) including 5 intra-laboratory and 5 inter-laboratory duplicates
512 Soil vapour
Tables 52 presents conformance to field QAQC procedures undertaken as part of the soil vapour (passive and active) investigations
Table 52 Field QAQC procedures ndash Soil vapour
QAQC Item Detail
Field procedures Field procedures were undertaken in accordance with the ASC NEPM (1999) as well as ASTM (2001 2006) ITRC (2007) CRC CARE (2013) guidance and Fyfe SOPs Details are included in Table 41 and Appendix G (ie SGS sampling methodology sheet) During the use of summa canisters to sample the soil vapour bores leak testing was undertaken (as described in Table 41) Although small leaks or ambient drawdown appear to have occurred with respect to samples SV11_10m (003 helium) SV13_10m (003 helium) and SV1_10m (360 microgm3 IPA) ITRC (2007) and NJDEP (2013) state that ge 5 helium andor gt10 mgm3 IPA are required to be indicative of a significant leak or substantial ambient drawdown Given that the leaks were relatively small (ie 06 (helium) and 36 (IPA) of the levels considered indicative of a significant leak) the data from these bores were still considered to be valid ndash refer to SGS correspondence in Appendix G As detailed in Table 41 a small amount of vacuum was generally left in each summa canister at the end of the sampling procedure and was measured in the laboratory to check if any leaks had occurred during transit However samples SV11_10m SV12_30m as well as the helium blank were recorded as having zero vacuum upon receipt at the analytical laboratory A query lodged with SGS regarding this issue indicated that whereas the helium blank comprised a grab sample collected into a Tedlar bag directly from the helium cylinder (ie without the use of a gauge) the canisters used for samples SV11_10m and SV12_30 were filled during sampling so that there was no remaining vacuum ndash refer to field sampling documentation in Appendix G SGS stated that although it is good practice to have a small amount of vacuum remaining in a canister at the completion of sampling appropriate additional QC measures were employed and the absence of other common background VOCs (eg petroleum hydrocarbons) upon sample testing indicated that leakage had not occurred during transit In addition all canisters are fitted with quick connect one-way valves that are closed upon removal from the sampling train and canistersfittings are leak checked prior to leaving the laboratory and again in the field to ensure that they are leak free Refer to SGS correspondence in Appendix G The presence of detectable IPA (120 microgm3) and TCE (48 microgm3) in the helium blank was also queried with SGS who stated that this (ie variability in the quality of the high purity helium gas used) is not an uncommon occurrence The reason for collecting a helium blank sample is to identify any impurities present in the helium gas so that if a leak does occur during sampling it is possible to determine whether any target compounds could be introduced into the sample train Although a target compound (ie TCE) was detected in the blank the concentration is minor and even if a leak had occurred during sampling (of which there was no evidence) it would not have affected the overall results and data interpretation The presence of IPA in the helium blank is
80607-1 REV1 30102017 PAGE 23
EPA REF 0524111 FINAL REPORT STAGE 1 ENVIRONMENTAL ASSESSMENT THEBARTON ASSESSMENT AREA
QAQC Item Detail
suspected by SGS of having resulted from a handling issue in the field ndash ie sub-sampling from the helium cylinder (ie into a summa canister via a flex foil bag) in the vicinity of the high concentrations of IPA being used for leak detection Refer to SGS correspondence in Appendix G
Sample preservation and storage
Following collection the WMStrade units were placed into individual glass vials which were sealed and placed into foil bags for transport to the analytical laboratory at ambient temperature Summa canisters were stored in specially constructed cases during transport to the analytical laboratory at ambient temperature
Sample tracking COC documentation was used for the transport of all samples to the laboratory and is included in Appendix G
QC samples ndash WMStrade sampling
During the first round of passive soil vapour sampling three additional WMStrade units were deployed in soil bores drilled adjacent to WMS 22 WMS 25 and WMS 28 to act as duplicate QC samples ndash thereby constituting a ratio of approximately one duplicate per 12 primary samples (or 8) Two trip blank samples were also included with samples transported from and to the analytical laboratory All of the QC samples were analysed by the primary laboratory Intra-duplicate sample RPDs were calculated where both data sets had a reported concentration above the specific analyte laboratory LOR All calculated RPDs for CHC were within an acceptable range (ie lt30) The analytical results obtained for the trip blank samples were all below the laboratory LOR thereby indicating that there was negligible impact on sample quality during storage or transport of the samples to the analytical laboratory
QC samples ndash soil vapour bore sampling
Two intra-laboratory duplicate QC samples were analysed for CHC and general gases with respect to 24 primary soil vapour samples ndash thereby constituting a ratio of approximately one duplicate per 12 primary samples (or 83) compared to an acceptable ratio of 110 samples (or 10) Intra-laboratory duplicate RPDs were calculated where both samples had a reported concentration above the laboratory LOR All calculated RPDs for CHC and general gases were within an acceptable range (ie lt30) The analytical results obtained for the helium shroud (Tedlar bags) helium blank and IPA shroud (carbon tube) samples were all considered to be satisfactory
Notes The American Society for Testing and Materials (ASTM) is an internationally recognised source of testing methods Although Appendix J of CRC CARE (2013) stipulates a 110 duplicate sampling ratio for active vapour sampling a specific ratio is not stipulated for passive vapour sampling
52 Laboratory QAQC
Laboratory QA procedures generally include the performance of a number of internal checks of data precision and accuracy that are aimed at assessing possible errors associated with sample preparation and analytical techniques Specific types of QC samples analysed by laboratories and the relevant acceptance criteria are as follows
PAGE 24 80607-1 REV1 30102017
EPA REF 0524111 FINAL REPORT STAGE 1 ENVIRONMENTAL ASSESSMENT THEBARTON ASSESSMENT AREA
internal laboratory replicate samples maximum RPD values of 20 to 50 although this varies depending on laboratory LOR
spike recoveries results between 70 and 130 and
laboratory controlmethod blanks results below the laboratory LOR
Table 53 presents conformance to laboratory QAQC procedures undertaken as part of the overall investigation program
Table 53 Laboratory QAQC procedures
QAQC Item Detail
Samples analysed and Samples were generally analysed within specified holding times ndash with the exception extracted within relevant of the following groundwater samples holding times SGS report no ME303457 nitrate was analysed two days late in some samples
(MW5 MW17 MW26) SGS report no ME303475 nitrate was analysed one day late in all samples and EurofinsMGT report no 555810-W total CO2 was analysed five days late None of these holding time exceedances are considered to be significant with respect to the interpretation of the CHC data the determination of potential human healthenvironmental risks andor the determination of natural attenuation
Laboratories used and The laboratories used (SGS Eurofins MGT and SMS Geotechnical) were NATA NATA accreditation accredited for the majority of the analyses undertaken
The exception was SMS Geotechnical which was not NATA accredited for the calculations undertaken to derive some of the data ndash this is the case however for all geotechnical laboratories
Appropriate analytical methodologies used
Refer to the laboratory reports in Appendix G
Laboratory limit of The laboratory LOR is the minimum concentration of an analyte (substance) that can reporting (LOR) be measured with a high degree of confidence that the analyte is present at or above
that concentration The LOR are presented in the laboratory certificates of analysis (Appendix G) and are considered to be generally appropriate (ie below the adopted assessment criteria ndash refer to Section 62) ndash the following exceptions in soil vapour (ie considered to be due to interference associated with elevated concentrations of other compounds ndash refer to SGS correspondence in Appendix G) are discussed further in Table 101 VC in all of the WMStrade samples relative to the ASC NEPM (1999) interim soil
vapour health investigation level (HIL) for residential land use cis-12-DCE and VC in two soil vapour bore samples (SV2_30m and SV3_30m)
relative to the ASC NEPM (1999) interim soil vapour HILs for residential and commercialindustrial land use and
VC in two soil vapour bore samples (SV3_10m and SV7_30m) relative to the ASC NEPM (1999) interim soil vapour HIL for residential land use
In addition to the above although ultra-trace analysis was requested the laboratory LOR for VC in groundwater (ie 1 microgL) is above the adopted NHMRCMRMMC (2011) potable guideline (ie 03 microgL) ndash refer to Section 612
80607-1 REV1 30102017 PAGE 25
EPA REF 0524111 FINAL REPORT STAGE 1 ENVIRONMENTAL ASSESSMENT THEBARTON ASSESSMENT AREA
QAQC Item Detail
Laboratory internal QC analyses
Results obtained for the laboratory internal QC samples were generally within the acceptable limits of repeatability chemical extraction and detection with the exception of the following SGS report ME303457 matrix spike results for iron were outside normal tolerances
due to the high concentrations of iron in the spiked sample ndash matrix spike results for iron could therefore not be calculated This is not considered to be a significant issue
Full details regarding laboratory QAQC procedures and results are presented in the certified laboratory certificates contained in Appendix G
Notes Since holding times were not specified in the SGS groundwater reports Fyfersquos assessment of holding times has been based on those adopted by EurofinsMGT (ie the secondary laboratory used for groundwater analysis) ie in accordance with Schedule B3 of the ASC NEPM (1999) also referred to as practical quantification limits (PQL)
53 QAQC summary
In summary it is considered that
the field QAQC programs were generally undertaken with regard to relevant legislation standards andor guidelines and were sufficient for obtaining samples that are representative of site conditions and
the overall laboratory QAQC procedures and results were adequate such that the laboratory analytical results obtained are of acceptable quality for addressing the key objectives outlined in Section 15
PAGE 26 80607-1 REV1 30102017
EPA REF 0524111 FINAL REPORT STAGE 1 ENVIRONMENTAL ASSESSMENT THEBARTON ASSESSMENT AREA
6 ASSESSMENT CRITERIA
61 Groundwater
611 Beneficial Use Assessment
In accordance with Schedule B6 of the ASC NEPM (1999) and SA EPA (2009) a Beneficial Use Assessment (BUA) was undertaken to assess both the current and realistic future uses of groundwater within the Q1 aquifer beneath the Thebarton EPA Assessment Area
This was aimed at determining what groundwater uses need to be protected and assessing the risk(s) that groundwater may pose to human health and the environment (refer also to the VIRA in Section 9)
As summarised in Table 61 the potential beneficial uses for groundwater within the Q1 aquifer that have been considered are as follows ndash taking into account the salinity of the groundwater the Environment Protection (Water Quality) Policy 2015 (Water Quality EPP 2015) the DEWNR (2017) WaterConnect database information presented in Section 222 and possible sensitive receptors located within andor within the vicinity of the Thebarton EPA Assessment Area
The salinity of groundwater has been calculated to approximate 1230 to 3620 mgL TDS (refer to Section 7312) According to the Water Quality EPP 2015 the applicable environmental values for groundwater with salinity above 1200 mgL TDS but less than 3000 mgL TDS are irrigation livestock and aquaculture whereas the salinity is considered to be too high for potable use ndash although domestic irrigation is considered to be a potentially realistic use for this area (see below) livestock watering is considered unlikely to be undertaken in such an urban setting and no local water bodies (ie surface or groundwater) have been identified as being used for commercial aquaculture purposes
The DEWNR (2017) WaterConnect database indicates that groundwater within the Q1 aquifer in the Thebarton area is accessed for drainage domestic and industrial purposes ndash domestic groundwater use could include garden irrigation plumbing water andor the filling of swimming pools (ie primary contact recreation) Although domestic groundwater extraction is considered unlikely to include potable use (ie due to its salinity and the availability of a reticulated mains water supply) potential mixing with rain watermains water could render it suitable (ie from a salinity perspective) for drinking
As the closest freshwater surface water body the River Torrens is located approximately 03 km to the east and 07 km to the north and north-west of the northern portion of this area groundwater discharge from the Thebarton EPA Assessment Area into a freshwater aquatic ecosystem is considered possible However as the River Torrens is considered to be either a recharge boundary (ie discharging to local groundwater) or not actually hydraulically connected to the Q1 aquifer in this area the potential for impact on a freshwater aquatic environment has not been confirmed
80607-1 REV1 30102017 PAGE 27
EPA REF 0524111 FINAL REPORT STAGE 1 ENVIRONMENTAL ASSESSMENT THEBARTON ASSESSMENT AREA
Since the closest marine surface water body Gulf St Vincent is located approximately 8 km to the west groundwater discharge from the Thebarton EPA Assessment Area into a marine aquatic ecosystem is not considered to be realistic
Since volatile contaminants have been detected within the Q1 aquifer (refer to Section 7331) a potential vapour flux risk to future site users must be considered
Given the measured depth of the Q1 aquifer beneath the site (ie approximately 1232 to 1585 m BGL ndash refer to Section 7311) it is considered unlikely that direct contact could occur between groundwater and building footingsunderground services
Table 61 Assessment of groundwater beneficial uses for Thebarton EPA Assessment Area
Environmental Values Beneficial Uses
Water Quality EPP 2015
environmental value
SA EPA (2009) Potential
Beneficial Uses
Beneficial Use Assessment
Considered Applicable
Aquatic Ecosystem
Marine Yes No
Fresh Yes Possibly
Potable - Yes Possibly
Agriculture Irrigation - Yes Yes
Livestock - Yes No
Aquaculture - Yes No
Recreation amp Aesthetics
Primary contact Yes Possibly
Aesthetics Yes Possibly
Industrial - Yes Yes
Human health in non-use scenarios
Vapour flux -
Yes Yes
Buildings and structures
Contact - Yes No
Notes ie for underground waters with a background TDS level of between 1200 and 3000 mgL ndash note that although they are not listed as environmental values of groundwater in Schedule 1(3) of the Water Quality EPP 2015 aquatic ecosystems as well as recreation amp aesthetics are included as environmental values for waters in general in Part 1(6) of the document ie domestic irrigation only
612 Groundwater beneficial use criteria
The health and ecological criteria used for the assessment of the COPC (refer to Section 14) in groundwater have been based on the results of the BUA (Section 611) A summary of the references used to source the groundwater assessment criteria is provided in Table 62
PAGE 28 80607-1 REV1 30102017
EPA REF 0524111 FINAL REPORT STAGE 1 ENVIRONMENTAL ASSESSMENT THEBARTON ASSESSMENT AREA
Table 62 Sources of adopted groundwater assessment criteria
Beneficial Use Reference
Freshwater Ecosystems No criteria available for COPC
Potable NHMRCNRMMC (2011) Australian Drinking Water Guidelines
WHO (2017) Guidelines for Drinking-water Quality ndash TCE only
Irrigation No criteria available for COPC
Primary contact recreation (including aesthetics)
NHMRC (2008) Guidelines for Managing Risks in Recreational Water ndash based on NHMRCNRMMC (2011) Australian Drinking Water Guidelines but (with the exception of aesthetic guidelines) multiplied by a factor of 10 to take account of accidental ingestion rates as opposed to deliberate ingestion
ANZECCARMCANZ (2000b) Australian and New Zealand Guidelines for Fresh and Marine Water Quality ndash recreational values (TCE only)
Human health in non-use scenarios ndash vapour flux Refer to the VIRA in Section 9
Notes As there are no specific guidelines for industrial water these values are considered likely to be protective of this additional beneficial use The NHMRC (2008) guidelines are based on drinking water levels and assume a consumption factor of 2 L per day Therefore as recommended in the NHMRC (2008) document potable criteria (ie with the exception of aesthetic criteria) need to be adjusted by a factor of 10 to account for an accidental consumption rate of 100 to 200 ml per day As noted in ANZECCARMCANZ (2000b) although recreational guidelines are protective of ingestion recreational waters should also not contain any chemicals that can cause skin irritation likewise although not specifically addressed by recreational water criteria inhalation may also represent a source of exposure with respect to some (ie volatile) contaminants In the absence of a NHMRCNRMMC (2011) drinking water guideline for TCE the ANZECCARMCANZ (2000b) recreational criterion (30 microgL) has been adopted However if the NHMRC (2008) rule of multiplying potable (healthshybased) guidelines by 10 is applied to the WHO (2017) drinking water guideline of 20 microgL a recreational guideline of 200 microgL would be more applicable
62 Soil vapour
The ASC NEPM (1999) interim soil vapour health investigation levels (HILs) for volatile organic chlorinated compounds (VOCCs) have been adopted (ie in the first instance ndash refer to Section 7331) as Tier 1 soil vapour assessment criteria ndash relevant land use scenarios within the Thebarton EPA Assessment Area include residential (HIL AB) and commercialindustrial (HIL D)
These criteria have been further adjustedappended for the purposes of the VIRA Tier 1 assessment ndash refer to Section 94
80607-1 REV1 30102017 PAGE 29
EPA REF 0524111 FINAL REPORT STAGE 1 ENVIRONMENTAL ASSESSMENT THEBARTON ASSESSMENT AREA
7 RESULTS
71 Surface and sub surface soil conditions
711 Field observations
Groundwater well and soil vapour borehole log reports are included in Appendices H to J and provide details of the soil profile encountered at each sampling location
Where encountered fill materials extended to depths of between 01 and 09 m BGL and included a range of different soil types (sand gravelcrushed rock silt) with only minimal waste inclusions (ie asphalt glass andor metal fragments) identified at some locations
The underlying natural soil profile (encountered to the maximum drill depth of 19 m BGL) was dominated by low to medium plasticity brown to red-brown silty clays and sand claysclayey sands some of which contained sub-angular to rounded gravels that included river pebbles andor comprised fine distinct lenses in places Groundwater well MW17 also included a 15 m thick layer of gravel at depth (ie 12 to 135 m BGL) ndash ie consistent with the depth of groundwater within the Q1 aquifer
During the course of the drilling works no odours or visual indicators of contamination were detected and measured PID readings ranged up to 6 ppm but were generally lt3 ppm
712 Soil geotechnical testing
A table of geotechnical testing results is presented in Appendix L (Table 1) and a copy of the certified laboratory report is included in Appendix G Photographs of soil cores are included in Appendix N
The results were interpreted to indicate the following
The soil core samples submitted for PSD analysis were dominated by clay with lesser amounts of fine to medium gravel andor fine to coarse-grained sand ndash all samples analysed were classified as either CLAY or Sandy CLAY with one sample classified as Clayey SAND The classifications obtained from the laboratory were deemed to be generally consistent with the descriptions on the groundwater well log reports (Appendix H) although the PSD results did not specify silt as a significant secondary component
The moisture content of the analysed soil core samples ranged from 65 to 231 Moisture content with respect to soil type depth and location has been considered in more detail for the purposes of the VIRA (Section 9) The degree of saturation for the analysed soil cores samples ranged from 218 to 964
Measured bulk density ranged from 160 to 212 tm3 specimen dry density from 141 to 184 tm3 and specific gravity from 255 to 281 tm3
The measured void ratio ranged from 043 to 088 whereas porosity ranged from 032 to 047
80607-1 REV1 30102017 PAGE 31
EPA REF 0524111 FINAL REPORT STAGE 1 ENVIRONMENTAL ASSESSMENT THEBARTON ASSESSMENT AREA
72 Waterloo Membrane Samplerstrade A table of WMStrade analytical results (ie from both rounds of sampling) is presented in Appendix L (Table 2) and copies of certified laboratory reports are included in Appendix G8
Of the 41 WMStrade units deployed across the Thebarton EPA Assessment Area during the two sampling rounds 20 returned measurable concentrations of CHC including TCE PCE cis-12-DCE trans-12-DCE andor 11-DCE Although no VC was detected the laboratory LOR in all samples (ie 35 to 50 microgm3) was above the ASC NEPM (1999) soil vapour interim HIL for residential land use (30 microgm3) ndash refer also to Table 53
Detectable COPC concentrations are summarised in Table 71 relative to the ASC NEPM (1999) soil vapour interim HILs along with the closest soil vapour bore andor groundwater monitoring well locations Measured TCE concentrations are detailed on Figure 3
A comparison of the Round 1 and 2 WMStrade results (ie for closely located units9) is presented in Table 72 ndash the results indicate a general order of magnitude correlation of the results for most COPC with the exception of PCE for which lower concentrations were obtained during Round 2 As the Round 1 and 2 WMStrade units were located within different soil bores and deployed at different times some variability in the results is to be expected In addition and as discussed in Section 74 the WMStrade units have been used during this assessment as a (semi-quantitative) screening tool (ie to assist with the siting of the permanent soil vapour bores) with the results obtained from the soil vapour bores considered more representative of actual subsurface conditions
Table 71 Detectable Waterloo Membrane Samplertrade CHC results
Sample ID
Location Closest land uses
CHC concentration (microgm3) Closest soil vapour bore
andor groundwater
well
TCE PCE cis-12shyDCE
trans-12shyDCE
11shyDCE
VC
WMS 1 Goodenough Street CI 35 -
WMS 6 Maria Street CI 32 -
WMS 7 Maria Street CI and R 1900 45 SV2 MW5
WMS 8 Maria Street CI and R 12000 37 SV4
WMS 11 Admella Street CI 71000 260 19 20 36 SV5 MW02
WMS 14 George Street CI 46000 45 SV6 MW11
WMS 18 Admella Street CI 4200 34 MW14
WMS 19 Albert Street CI 11000 42 SV10MW15
WMS 21 Chapel Street CI 10 -
WMS 22 Admella Street CI 38 SV9
WMS 24 Chapel Street CI 230 62 10 11 48 MW17
8 Note that the original laboratory report for the Round 1 WMStrade samples was found to be incorrect (ie following receipt of the soil vapour bore and Round 2 WMStrade sample results) and was subsequently re-issued by SGS
9 only two of which were sufficiently co-located for comparative purposes ndash Round 2 locations WMS 39 and WMS 41 were not within the immediate vicinity of Round 1 WMStrade bores (ie the closest Round 1 bores were approximately 30 m away)
PAGE 32 80607-1 REV1 30102017
EPA REF 0524111 FINAL REPORT STAGE 1 ENVIRONMENTAL ASSESSMENT THEBARTON ASSESSMENT AREA
Sample ID
Location Closest land uses
CHC concentration (microgm3) Closest soil vapour bore
andor groundwater
well
TCE PCE cis-12shyDCE
trans-12shyDCE
11shyDCE
VC
WMS 25 Albert Street CI and R 1400 20 MW17
WMS 27 Light Terrace CI 64 62 SV11 MW19
WMS 32 Holland Street R 16 -
WMS 34 James Street R 11 -
WMS 37 Dew Street R 44 -
WMS 38 Maria Street CI and R 13000 56 SV2 MW5
WMS 39 Maria Street CI and R 1300 SV4
WMS 40 Admella Street CI 110000 97 SV5 MW02
WMS 41 George Street CI 18000 10 SV7 ASC NEPM (1999) HIL - Residential 20 2000 80 - - 30 ASC NEPM (1999) HIL ndash Commercialindustrial 80 8000 300 - - 100
Notes Shaded cells indicate concentrations were below the laboratory LOR Where (field) duplicate QC samples were analysed the maximum concentrations have been adopted for data interpretation purposes Concentrations in italics exceed adopted assessment criteria Closest land uses CI = commercialindustrial R = residential Chloroform (up to 530 microgm3) was also detected in WMS 8 WMS 11 WMS 14 WMS 16 WMS 18 WMS 19 WM 25 WMS 33 WMS 40 and WMS 41 interim soil vapour health investigation level (HIL)
Table 72 Comparison of CHC data for Round 1 and 2 WMStrade units
Bore ID
Depth (m)
Location CHC concentration (microgm3)
TCE PCE cis-12-DCE trans-12-DCE 11-DCE VC
WMS 8 10 Maria Street 12000 37 lt95 lt99 lt22 lt36
WMS 38 13000 56 lt11 lt11 lt25 lt41
Relative percentage difference 8 147 - - - -
WMS 11 10 Admella Street 71000 260 19 20 36 lt37
WMS 40 110000 97 lt11 lt11 lt25 lt41
Relative percentage difference 43 91 - - - -Notes Shaded cells indicate concentrations were below the laboratory LOR
80607-1 REV1 30102017 PAGE 33
EPA REF 0524111 FINAL REPORT STAGE 1 ENVIRONMENTAL ASSESSMENT THEBARTON ASSESSMENT AREA
73 Groundwater
731 Field measurements
A table of groundwater field parameters is presented in Appendix L (Table 3) and groundwater field sampling sheets are included in Appendix E
7311 Groundwater elevation and flow direction
The depth to water within the Q1 aquifer beneath the Thebarton EPA Assessment Area on 18 July 2017 ranged from 12323 to 15854 m below top of casing (BTOC)10 and 4469 to 5070 m AHD
Groundwater elevation contours constructed from the July 2017 gauging data indicated that the overall groundwater flow direction within the Q1 aquifer was north-westerly consistent with expected regional groundwater flow The groundwater contours and inferred flow direction are shown on Figure 4
7312 Field parameters
As detailed in Table 51 field measurements were recorded during low flow purging (ie prior to micropurge sampling) of monitoring wells and immediately following the collection of HydraSleeveTM samples
The field parameter readings recorded for the monitoring wells immediately prior to (low flow micropurge) and after (HydraSleeveTM) sampling indicated the following (as summarised in Table 3 Appendix L)
groundwater pH ranged from 6 8 to 79 thereby indicating neutral conditions
electrical conductivity (EC) measurements ranged from 189 to 556 mScm and were found to be reasonably consistent across the area thereby indicating that it is underlain by moderately saline water (ie approximating 1230 to 3620 mgL TDS11)
redox concentrations ranged from -20 to 624 mV thereby indicating slightly reducing to strongly oxygenating conditions
measured dissolved oxygen (DO) concentrations ranged from 04 to 78 ppm indicating slightly to highly oxygenated water and
temperature ranged from 173 to 224oC
Observations recorded during sampling indicated that the groundwater was clear to brown and only slightly to moderately turbid at most locations ndash the higher turbidity at MW18 and MW19 (combined with poor recharge) contributed towards the decision to use a HydraSleeveTM sampling method No odours or sheen were observed in any of the wells during gauging or sampling
10 ie approximating m BGL 11 ie calculated by multiplying the field EC data by 065
PAGE 34 80607-1 REV1 30102017
EPA REF 0524111 FINAL REPORT STAGE 1 ENVIRONMENTAL ASSESSMENT THEBARTON ASSESSMENT AREA
732 Hydraulic conductivity
Rising and falling head aquifer permeability (ldquoslugrdquo) tests were conducted on 10 groundwater wells (refer to Table 31 and Figure 2) to assess the hydraulic conductivity (K) of the Q1 aquifer
To obtain estimates of near-well horizontal hydraulic conductivity for each well tested the slug test data were analysed by Arcadis using AQTESOLV for Windowstrade (Duffield 2007) following the guidelines presented in Butler (1998) ndash normalised displacement data collected from each test are plotted against time in Appendix A of the Arcadis report (refer to Appendix O) Since only one set of tests were performed at each well the reproducibility of the results as well as the dependence of the results on the initial displacement could not be verified or demonstrated As such multiple relevant and applicable solutions were applied to each test to account for that uncertainty (ie to ensure consistency of normalised response at each well regardless of initial displacement)
Table 73 presents a summary of the range and average estimated hydraulic conductivity values (and corresponding analytical solutions used) for each well tested The results indicate that hydraulic conductivities ranged from approximately 0073 to 37 mday with an overall average of approximately 1 mday
Table 73 Hydraulic conductivities (rising and falling head tests)
Groundwater Test Type Range of Estimated Applied Analytical Average Well Hydraulic Conductivity Solution Estimated
(mday) Hydraulic Conductivity
(mday)
MW02 Falling head 011 to 014 DA CBP HV
012 Rising head 0073 to 015 BR DA
MW3 Falling head 034 to 062 BR DA
047 Rising head 030 to 062 BR DA
MW7 Falling head 075 to 25 BR DA
139 Rising head 055 to 175 BR DA
MW14 Falling head 011 to 021 BR DA
014 Rising head 009 to 015 BR DA
MW17 Falling head 21 to 22 DA KGS
220 Rising head 225 to 244 DA KGS
MW20 Falling head 22 to 37 BR DA HV
256 Rising head 06 to 32 BR DA
MW21 Falling head 073 to 123 BR DA
084 Rising head 054 to 084 BR DA
MW23 Falling head 088 to 162 BR DA
101 Rising head 031 to 122 BR DA
80607-1 REV1 30102017 PAGE 35
EPA REF 0524111 FINAL REPORT STAGE 1 ENVIRONMENTAL ASSESSMENT THEBARTON ASSESSMENT AREA
Groundwater Test Type Range of Estimated Applied Analytical Average Well Hydraulic Conductivity Solution Estimated
(mday) Hydraulic Conductivity
(mday)
MW25 Falling head 10 to 18 BR DA CBP HV
132 Rising head 049 to 17 BR DA
MW26 Falling head 019 to 036 BR DA
023 Rising head 010 to 029 BR DA
Overall average K (mday) 1028 Notes References BR = Bouwer and Rice (1976) CBP = Cooper et al (1967) DA = Dagan (1978) HV = Hvorslev (1951) KGS = Hyder et al (1994)
The monitoring wells that exhibited lower permeabilities (ie MW02 MW3 MW14 and MW26) were noted to be generally located in the up-gradient (south-eastern) portion of the Thebarton EPA Assessment Area whereas monitoring wells showing relatively higher permeabilities (ie MW7 MW17 MW20 MW21 MW23 and MW25) are generally located in the down-gradient (north-western) portion These results were considered by Arcadis to suggest a possible hydrogeologic transition from the south-east to the north-west AQTESOLV solution plots for each analysis are provided as Appendix A of the Arcadis report (Appendix O)
As slug test results can be influenced by a number of factors which are difficult to avoid when performing and analysing slug test results hydraulic conductivity estimates derived from slug tests should be considered to be the lower bound of the hydraulic conductivity of the formation in the vicinity of the well (Butler 1998) However Arcadis also noted that the results obtained for the Thebarton EPA Assessment Area were similar to those reported for other areas of Adelaide with average values of 1 and 27 mday (refer to Appendix O)
The slug test results were used by Arcadis in their groundwater fate and transport model (refer to Section 8)
733 Analytical results
Tables of groundwater analytical results are presented in Appendix L (Tables 4 and 5) and copies of certified laboratory reports are included in Appendix G
7331 Chlorinated hydrocarbon compounds
A table of CHC results is included in Appendix L (Table 4) and a plan showing their distribution in groundwater beneath the Thebarton EPA Assessment Area is included as Figure 5 Detectable CHC concentrations are summarised in Table 74 relative to the adopted potable and primary contact recreation criteria ndash the closest soil vapour bore locations are also detailed
PAGE 36 80607-1 REV1 30102017
EPA REF 0524111 FINAL REPORT STAGE 1 ENVIRONMENTAL ASSESSMENT THEBARTON ASSESSMENT AREA
Table 74 Detectable groundwater CHC results
Sample ID
Location CHC concentration (microgL) Closest soil vapour bore
TCE PCE cis-12shyDCE
trans-12-DCE
11-DCE VC Carbon tetrachloride
MW02 Admella Street 20000 38 7 15 SV5
MW3 Admella Street 69 SV1
MW5 Maria Street 29000 3 21 2 6 SV2 SV3
MW6 Maria Street 29 SV4
MW9 Albert Street 2 -
MW11 George Street 4900 3 4 1 7 SV6 SV7
MW12 George Street 700 SV8
MW14 Admella Street 1000 4 2 SV9
MW15 Albert Street 180 SV10
MW17 Chapel Street 24 -
MW18 Dew Street 5 -
MW20 Light Terrace 70 SV12
MW21 Light Terrace 23 SV13
MW23 Dew Street 21 -
MW25 Smith Street 2 5 -
MW26 Kintore Street 2 -
Potable 20 50 60 30 03 3
Primary contact recreation
30 500 600 300 30 30
Notes Shaded cells indicate concentrations were below the laboratory LOR Where (field) duplicate QC samples were analysed the maximum concentrations have been adopted for data interpretation purposes Concentrations in italics exceed adopted assessment criteria Chloroform was also detected in a number of wells (MW02 MW3 MW5 MW8 MW11 MW12 and MW19 to MW25) ndash refer to Table 4 in Appendix L Although no VC was detected the laboratory LOR (1 microgL) exceeded the adopted potable criterion NHMRCNRMMC (2011) Australian Drinking Water Guidelines TCE criterion from WHO (2017) Guidelines for Drinking-water Quality NHMRC (2008) Guidelines for Managing Risks in Recreational Water ndash based on NHMRCNRMMC (2011) Australian Drinking Water Guidelines TCE criterion from ANZECCARMCANZ (2000b) Australian and New Zealand Guidelines for Fresh and Marine Water Quality
The results indicate that the highest TCE concentrations (20000 to 29000 microgL) were measured in wells MW02 and MW5 located in the immediate vicinity of the former Austral property and that the TCE plume extends in a general north-westerly direction (ie consistent with the inferred groundwater flow direction
80607-1 REV1 30102017 PAGE 37
EPA REF 0524111 FINAL REPORT STAGE 1 ENVIRONMENTAL ASSESSMENT THEBARTON ASSESSMENT AREA
within the Q1 aquifer) Although lesser concentrations of PCE 12-DCE (cis- andor trans) andor 11-DCE were present in some wells no VC was detected and the main COPC was identified as TCE
A number of wells within the Thebarton EPA Assessment Area contained TCE concentrations that exceeded the adopted potable andor primary contact recreation criteria Although the extent of the TCE plume was not delineated to the north-west (but was delineated in all other directions) with detectable TCE concentrations (ie up to 21 microgL) identified beneath both Smith Street and Dew Street these concentrations were below the adopted primary contact recreation criterion (but not necessarily the adopted potable value ndash ie MW23)
The background well (MW4) located across James Congdon Drive (to the east of the southern portion of the Thebarton EPA Assessment Area) did not contain any measurable CHC concentrations
7332 Other measured groundwater parameters
Major cations and anions
The laboratory results obtained for the remaining groundwater analytes are summarised in Appendix L (Table 5)
The groundwater ionic data obtained from selected wells across the Thebarton EPA Assessment Area are graphically represented on a Piper diagram in Figure 71 The results indicate a relatively consistent groundwater composition across the area thereby indicating that the groundwater sampled from these wells is derived from a single aquifer Ionic charge balance ranged from 32 to 22 with the highest value (22) calculated for MW12 indicating that additional anions (ie not measured as part of this study) could be present
PAGE 38 80607-1 REV1 30102017
EPA REF 0524111 FINAL REPORT STAGE 1 ENVIRONMENTAL ASSESSMENT THEBARTON ASSESSMENT AREA
Figure 71 Piper diagram
Natural attenuation parameters
With respect to the measured natural attenuation parameters (ie DO nitrate iron sulfate CO2 and manganese) the following wells were selected based on their locations relative to the inferred extent of the CHC plume
MW26 located on Kintore Street to the south (and hydraulically up-gradient) of the former Austral property (ie the suspected source site)
MW02 and MW5 located within the immediate vicinity of the former Austral property and the area of maximum CHC contamination
MW9 MW12 and MW17 located on Albert Street George Street and Chapel Street respectively to the north-west (and hydraulically down-gradient) of the former Austral property
80607-1 REV1 30102017 PAGE 39
EPA REF 0524111 FINAL REPORT STAGE 1 ENVIRONMENTAL ASSESSMENT THEBARTON ASSESSMENT AREA
MW21 and MW22 located on Light Terrace and Cawthorne Street respectively to the northshywestnorth-north-west (and further hydraulically down-gradient) of the former Austral property and
MW8 and MW23 located on Smith Street and Dew Street respectively representing the furthest wells to the northnorth-west of the former Austral property
According to Wiedemeier et al (1998) the most important process in the degradation of CHC is the process of reductive dechlorination Although daughter products of TCE (ie 12-DCE) are present in groundwater (and soil vapour) at scattered locations within the Thebarton EPA Assessment Area they are not considered indicative of substantial breakdown of TCE ndash refer also to the Arcadis report in Appendix O as summarised in Section 8 In addition the analysis of the natural attenuation parameters data constituting physical and chemical indicators of biodegradation processes has not provided a definitive secondary line of evidence
74 Soil vapour bores A table of soil vapour bore analytical results is presented in Appendix L (Table 6) and a copy of the certified laboratory report is included in Appendix G
Of the soil vapour bores installed to 10 andor 30 m BGL within the Thebarton EPA Assessment Area the majority (ie with the exception of the 10 m deep bores installed as SV11 and SV13 and located on Light Terrace) returned measurable concentrations of CHC dominated by TCE and to a lesser extent (and only at some locations) PCE Detectable soil vapour CHC concentrations are summarised in Table 75 whereas CHC concentrations and inferred soil vapour TCE concentration contours are detailed on Figures 6 (1 m BGL) and 7 (3 m BGL)
The TCE results which have been used to predict indoor air concentrations as part of the VIRA (refer to Section 9) suggest the following
the highest concentration (1000000 microgL) was detected at 3 m BGL in soil vapour bore SV3 located in the vicinity of residential and commercialindustrial properties (including the former Austral property) on Maria Street
where nested wells were tested soil vapour CHC concentrations were higher at depth consistent with a groundwater source
TCE PCE and 11-DCE are all assumed to represent primary contaminants with 12-DCE representing a break-down product of TCE andor PCE
although no VC was detected the laboratory LOR in some samples (ie up to 490 microgm3 in samples with the highest measured TCE concentrations) was above the ASC NEPM (1999) interim soil vapour HIL for residential land use (30 microgm3) ndash refer to Table 53 and
although the extent of the soil vapour plume has apparently not been delineated (ie in any direction) by the existing soil vapour bores it extends in a north-westerly direction (and hydraulically down-
PAGE 40 80607-1 REV1 30102017
EPA REF 0524111 FINAL REPORT STAGE 1 ENVIRONMENTAL ASSESSMENT THEBARTON ASSESSMENT AREA
gradient) from the suspected source site (ie the former Austral property) and corresponds well with the groundwater TCE plume (refer to Figure 5)
A comparison of the results obtained for the WMStrade units (WMS 38 to WMS 41) deployed during the second round of sampling and the closest soil vapour bore data (10 m BGL) is provided in Table 76 Although the results indicate good correlation for TCE and PCE in SV5WMS 40 as well as TCE in SV7WMS 41 the remaining results were more variable ndash this supports the use of the WMStrade units as an initial (semishyquantitative) screening tool with follow-up soil vapour bore data considered to provide more quantitative results
Table 75 Detectable soil vapour bore CHC results for Thebarton EPA Assessment Area
Bore ID
Depth (m)
Location Closest land
uses
CHC concentration (microgm3)
TCE PCE cis-12shyDCE
trans-12-DCE
11-DCE VC
SV1 10 Admella Street CI and R 6300 78
30 21000 21
SV2 10 Maria Street CI and R 51000 39 21 39
30 940000
SV3 10 Maria Street CI and R 210000 6500 5900
30 1000000 15000 14000
SV4 10 Maria Street CI and R 17000 31
30 43000 90 30
SV5 10 Admella Street CI 100000 84
30 160000 310 20 33
SV6 10 George Street CI 22000 12
30 150000 56
SV7 10 George Street CI 22000 19
30 110000
SV8 10 George Street CI 2300 62
30 14000 19
SV9 10 Chapel Street CI 170
30 260
SV10 10 Albert Street CI 93
30 51
SV12 10 Light Terrace CI 16
30 55 ASC NEPM (1999) HIL - Residential 20 2000 80 - - 30 ASC NEPM (1999) HIL ndash Commercialindustrial 80 8000 300 - - 100
Notes Shaded cells indicate concentrations were below the laboratory LOR
80607-1 REV1 30102017 PAGE 41
EPA REF 0524111 FINAL REPORT STAGE 1 ENVIRONMENTAL ASSESSMENT THEBARTON ASSESSMENT AREA
Where (field andor laboratory) duplicate QC samples were analysed the maximum concentrations have been adopted for data interpretation purposes Concentrations in italics exceed adopted assessment criteria Closest land uses CI = commercialindustrial R = residential Chloroform was also detected in a number of samplesinterim soil vapour health investigation level (HIL)
Table 76 Comparison of CHC data for Round 2 WMStrade units and closest soil vapour bores
Bore ID
Depth (m)
Location CHC concentration (microgm3)
TCE PCE cis-12-DCE trans-12-DCE 11-DCE VC
SV2 10 Maria Street 51000 39 21 lt13 39 lt89
WMS 38 13000 56 lt11 lt11 lt25 lt41
Relative percentage difference 119 150 - - - -
SV4 10 Maria Street 17000 31 lt18 lt14 lt14 lt92
WMS 39 1300 lt52 lt11 lt11 lt25 lt41
Relative percentage difference 172 - - - - -
SV5 10 Admella Street 100000 84 lt44 lt33 lt33 lt22
WMS 40 110000 97 lt11 lt11 lt25 lt41
Relative percentage difference 95 14 - - - -
SV7 10 George Street 22000 19 lt37 lt27 lt27 lt18
WMS 41 18000 10 lt11 lt11 lt25 lt41
Relative percentage difference 20 62 - - - -Notes Shaded cells indicate concentrations were below the laboratory LOR
PAGE 42 80607-1 REV1 30102017
EPA REF 0524111 FINAL REPORT STAGE 1 ENVIRONMENTAL ASSESSMENT THEBARTON ASSESSMENT AREA
8 GROUNDWATER FATE AND TRANSPORT MODELLING
Arcadis were commissioned by Fyfe to undertake preliminary fate and transport modelling of the groundwater CHC impacts detected within the Thebarton EPA Assessment Area based on the recently obtained groundwater data The Arcadis report is included as Appendix O
The aim of the modelling was to provide a preliminary estimate of the future extent of CHC impacted groundwater within the Thebarton area in order that potential future groundwater restrictions could be applied by the EPA (ie via the potential future definition of a GPA) to protect human health
81 Groundwater flow modelling
The MODFLOW code a publicly-available groundwater flow simulation program developed by the United States Geological Survey (USGS) as described by McDonald and Harbaugh (1988) was used to construct a groundwater flow model It was developed for a horizontal area of approximately 25 km2 (ie to minimise possible boundary effects within the assessment area itself12) and was rotated 45deg counter-clockwise to align with the prevailing (north-westerly) groundwater flow direction The model extended approximately 23 km in a south-east to north-west direction and approximately 11 km in a south-west to north-east direction (ie perpendicular to groundwater flow) Whereas a 4 m grid spacing was used within the area of the plume and its migration pathway (ie to enhance model accuracy and precision) a broader 15 m grid was adopted outside the specific area of interest Vertically the model adopted a single 20 m thick layer as representative of the hydrostratigraphy of the Q1 aquifer sediments beneath the area but it was noted that only the bottom portion (ie few metres) of this model layer are actually saturated and therefore active in the model
An informal sensitivity analysis performed as part of the model calibration process indicated that the model was most sensitive to changes in hydraulic conductivity and recharge ndash this was not unexpected given the relatively flat hydraulic gradient and relatively narrow range of estimated values for both model parameters (ie based on reasonably low uncertainty) The final calibrated value for aquifer recharge adopted in the model was 295 mmyear consistent with results reported for nearby sites as well as regional estimates Likewise the final calibrated hydraulic conductivity values for the up-gradient (06 mday) and down-gradient (2 mday) zones were consistent with both the site-specific slug test data and results obtained for other nearby EPA assessment areas The final calibrated down-gradient constant head elevation was 15 m AHD It was concluded by Arcadis that the groundwater flow model was well calibrated and could therefore serve as an appropriate basis for the development of a site-specific solute transport model
82 Solute transport modelling
A site-specific (three-dimensional) solute transport model using the MT3DMS transport code of Zheng (1990) was developed by Arcadis to predict the fate and transport of groundwater contaminants (specifically
12 Further information regarding boundary effects is provided in the Arcadis report (Appendix O)
80607-1 REV1 30102017 PAGE 43
EPA REF 0524111 FINAL REPORT STAGE 1 ENVIRONMENTAL ASSESSMENT THEBARTON ASSESSMENT AREA
CHC) under current conditions over a period of 100 years This dual-domain mass transport model was used in conjunction with the groundwater flow model developed through the use of MODFLOW (as detailed above) assuming the following
The primary COPC is TCE ndash the initial concentration distribution of TCE in groundwater was based on the recent (July 2017) monitoring data
The age of the groundwater TCE plume was assumed to be up to about 90 years ndash ie based on the history of industrial land use (specifically the former Austral facility) in the area
Although lesser amounts of other CHC are present in groundwater the lack of significant daughter products of TCE has been interpreted to indicate that substantial biodegradation is not occurring (ie as a conservative approach)
Although a CHC source was not explicitly incorporated into the solute transport model the MT3DMS transport code indirectly accounts for on-going contaminant mass contribution to the dissolved-phase plume
The fate and transport of TCE within the area of interest involves the processes of advection adsorption dilution and diffusion ndash however given that recharge via the infiltration of precipitation was considered to be insignificant dilution effects were assumed to be minimal
Two porosity values (ie dual domain) are relevant to the movement of contaminants in the subshysurface with adopted values based on site-specific geology and Payne et al (2008) ndash whereby the two domains are in equilibrium
― mobile porosity that portion of the formation with the highest permeability where advective transport dominates ndash assumed to be 5 (high) 10 (intermediate) or 15 (low) for different mobility transport conditions and
― immobile porosity lower permeability portions of the formation where diffusion is dominant ndash assumed to be 15
As discussed in Section 732 hydraulic conductivity values of 06 mday (south-eastern approximate quarter of the modelling area) and 2 mday (northern approximate three-quarters of the modelling area) were adopted to reflect the hydrogeologic transition (ie from the south-east to the north-west) interpreted from the slug test data
The adopted TCE retardation factor of 147 for intermediate mobility transport conditions was based on the following
― an assumed organic carbon fraction of 01 (US EPA 1996 amp 2009) ndash this was varied to 005 and 2 to assess alternate (ie high versus low) mobility transport conditions
― an assumed organic carbon adsorption co-efficient of 61 Lkg (US EPA 2017a)
PAGE 44 80607-1 REV1 30102017
EPA REF 0524111 FINAL REPORT STAGE 1 ENVIRONMENTAL ASSESSMENT THEBARTON ASSESSMENT AREA
― a calculated partition co-efficient of 0061 Lkg ndash this was varied to 129 and 178 Lkg to assess alternate (ie high versus low) mobility transport conditions and
― an average soil bulk density of 192 gcm3 (based on measured geochemical data ndash refer to Table 1 Appendix L)
An optimum mass transfer co-efficient (MTC) was based on simulated flux distribution in the groundwater flow model whereby
― the calculated MTC in the model ranged from approximately 38E-08day-1 to 37E-05 day-1 and
― the average MTC was 185E-05day-1
The site-specific solute transport model was used in predictive mode to assess the long-term (eg 100 year) potential migration of the groundwater TCE plume and to support the EPA in the potential future definition of an appropriate GPA The model was calibrated against the current extent (ie concentrations of TCE above 1 microgL have migrated approximately 500 m from the suspected source site13) and expected age (ie up to about 90 years) of the plume The results indicate that the leading edge of the TCE (ie the 1 microgL contour) is estimated to migrate between approximately 400 and 620 m over a period of 100 years under low to high mobility transport conditions14 with intermediate transport conditions resulting in an estimated migration of 500 m By comparison no significant lateral plume expansion would be expected to occur Figures 5 to 17 of the Arcadis report (Appendix O) show the predicted extent of the TCE plume at 5 10 50 and 100 years under low to high mobility transport conditions
Figure 81 shows the predicted extent of the 1 microgL TCE boundary in 100 years under intermediate transport conditions ndash it is recommended that this information be used to support the EPA in establishing a potential future GPA
The Arcadis report notes that given the available site information (site history potential source area(s) and uncertainty associated with the current plume extent) and degree of model calibration (flow model parameter values are consistent with site-specific data as well as regionalnearby studies while transport parameter values are consistent with literatureindustry standards) the model-predicted migration of approximately 500 m over 100 years is considered to be a reasonable representation of future conditions
Key uncertainties associated with the modelling were identified as including the following
current plume extents (ie down-gradient delineation)
site-specific fraction organic values (or site-specific partition coefficient estimates) and
site-specific porosity estimates
13 although it was noted that there is uncertainty with respect to the current extent of the TCE plume since all three down-gradient monitoring wells (MW18 MW23 and MW25) have TCE concentrations above 1 μgL
14 ie assuming different values for mobileimmobile porosity the TCE distribution (sorption) coefficient and the TCE retardation factor
80607-1 REV1 30102017 PAGE 45
EPA REF 0524111 FINAL REPORT STAGE 1 ENVIRONMENTAL ASSESSMENT THEBARTON ASSESSMENT AREA
Lesser uncertainties were considered to include site-specific bulk hydraulic conductivity estimates and determination of the presence or absence of naturally-occurring TCE degradation
Additional site investigation and data collection (eg multi-well pumping tests for bulk hydraulic conductivity estimates site-specific fraction organic carbon andor distribution (sorption) coefficient additional down-gradient plume delineation) would help to further refine the model and increase confidence in the predictive results
Figure 81 Predictive TCE (1 microgL) plume extent after 100 years (ie shown in green) relative to the boundary of the Thebarton EPA Assessment Area (red) and the extent of the modelling area (purple)
PAGE 46 80607-1 REV1 30102017
EPA REF 0524111 FINAL REPORT STAGE 1 ENVIRONMENTAL ASSESSMENT THEBARTON ASSESSMENT AREA
9 VAPOUR INTRUSION RISK ASSESSMENT
Arcadis were commissioned by Fyfe to undertake a Vapour Intrusion Risk Assessment (VIRA) of the soil vapour CHC impacts detected within the Thebarton EPA Assessment Area based on the recently obtained (ie August 2017) permanent soil vapour bore data The Arcadis report is included as Appendix P
91 Objective
The main objective of the VIRA was to evaluate the potential risk to human health from vapour intrusion related to the concentrations of CHC identified in soil vapour within the Thebarton EPA Assessment Area
92 Areas of interest
The following areas of specific interest (ie located within the Thebarton EPA Assessment Area) were identified for the purpose of this VIRA
commercialindustrial properties (assumed slab on grade construction) including the former Austral property (ie the suspected source site) and
residential properties (slab on grade crawl space and basement constructions)
Potential exposure by trenchmaintenanceutility workers has also been considered (qualitatively)
93 Risk assessment approach
The VIRA was conducted in accordance with the ASC NEPM (1999) enHealth (2012a) and other relevant Australian guidance documents as well as guidance documents issued by the US EPA and other international regulatory agencies (where applicable)
The conduct of the risk assessment was based on a multiple lines of evidence approach using the available site-specific information collected as part of the scope of works detailed in Section 32
The following information was used as a basis for the VIRA
CHC including TCE PCE and DCE (11- cis-12- and trans-12-) have been identified within soil vapour andor groundwater within the Thebarton EPA Assessment Area ndash the analytical data indicate that TCE constitutes between about 95 and 100 of the CHC identified in groundwater and soil vapour
TCE has been considered as the risk driver for the VIRA (ie based on its toxicity and concentrations in soil vapour and groundwater) ndash although TCE PCE 12-DCE 11-DCE and VC have all been included as COPC for the Tier 1 screening assessment (Section 94) the Tier 2 assessment (Section 95) has
80607-1 REV1 30102017 PAGE 47
EPA REF 0524111 FINAL REPORT STAGE 1 ENVIRONMENTAL ASSESSMENT THEBARTON ASSESSMENT AREA
concentrated on TCE PCE and 11-DCE (ie due to their presence at concentrations that exceeded the adopted Tier 1 screening criteria)
The CHC identified within the Thebarton EPA Assessment Area are volatile chemicals and could potentially pose a risk to human health via the vapour intrusion pathway Although the source area has yet to be confirmed the CHC concentrations observed in groundwater and soil vapour are considered likely to have originated from the former Austral property (as discussed in Section 12)
The natural soils underlying the fill material (where present) in the Thebarton EPA Assessment Area are typified by the Quaternary age soils and sediments of the Adelaide Plains with the Pooraka Formation and Hindmarsh Clay units considered to dominate the upper soil profile
The soil geotechnical data and soil vapour results collected by Fyfe (as discussed in Sections 712 and 74 respectively) have been used for the VIRA
A two-tier approach was adopted for the VIRA The first tier (herein referred to as the Tier 1 assessment) was conducted by comparing the measured soil vapour TCE concentrations to published guideline values adjusted (conservatively) to account for attenuation from sub-slab soil into indoor air The second tier (herein referred to as the Tier 2 assessment) involved the comparison of predicted indoor air TCE concentrations to adopted indoor air criteria or response levels
94 Tier 1 assessment
As detailed in Section 74 the initial Tier 1 (screening risk) assessment involved comparing measured soil vapour COPC concentrations with the ASC NEPM (1999) interim soil vapour HILs for residential and commercialindustrial land uses (refer to Table 74) Given that the development of the interim soil vapour HILs was based on very conservative assumptions the initial Tier 1 assessment provided only a first-pass screening assessment of the data to determine if further risk assessment would be required
The interim soil vapour HILs are applicable for the assessment of soil vapour at 0 to 1 m beneath the floor of a building They were based on adopted toxicity reference values (TRV) and relevant exposure parameters (ie adjusted for different land uses) as well as an assumed soil vapour to indoor air attenuation factor of 01
The soil vapour to indoor air attenuation factor (01) was based on the US EPA (2002) recommended default attenuation factors for the generic screening step of a tiered vapour intrusion assessment process As discussed in the US EPA (2002) document the default attenuation factor of 01 for sub-slab soil vapour was based on a US EPA database of empirical attenuation factors calculated using measurements of indoor air and soil vapours from different sites In 2012 the US EPA provided an updated database which was accompanied by an evaluation and statistical analysis of attenuation factors for volatile CHC in residential buildings US EPA (2012) found the sub-slab to indoor air attenuation factor of 003 to be the 95th percentile In 2015 the revised sub-slab attenuation factor (003) was adopted by the US EPA
PAGE 48 80607-1 REV1 30102017
EPA REF 0524111 FINAL REPORT STAGE 1 ENVIRONMENTAL ASSESSMENT THEBARTON ASSESSMENT AREA
The revised sub-slab to indoor air attenuation factor of 003 was adopted to derive modified residential and commercialindustrial soil vapour HILs for the Tier 1 assessment The modified residential soil vapour HILs are presented in Table 91 relative to the maximum CHC concentrations obtained for soil vapour within the Thebarton EPA Assessment Area
The Tier 1 assessment based on a comparison of the COPC concentrations measured in soil vapour at various locations within the Thebarton EPA Assessment Area with the modified residential soil vapour HILs detailed in Table 91 indicated the following
TCE concentrations exceeded the adopted criterion in SV1 to SV9 whereas
the concentrations of PCE and 11-DCE exceeded the adopted criteria in SV3 only
These locations were identified as requiring further assessment (ie Tier 2 VIRA ndash refer to Section 95)15
Table 91 Tier 1 assessment ndash ASC NEPM (1999) and modified residential soil vapour HILs
Compound ASC NEPM (1999) HIL
(microgm3)
Modified Tier 1 HIL (microgm3)
(AF = 003)
Maximum measured soil vapour concentration (microgm3)
Acceptable
Location 1 m BGL Location 3 m BGL
11-DCE 7000 SV3 5900 SV3 14000 No ndash Tier 2 required
cis-12-DCE 80 265 SV2 21 SV4 30 Yes
trans-12-DCE 80 265 - ND SV5 20 Yes
PCE 2000 6650 SV3 6500 SV3 15000 No ndash Tier 2 required
TCE 20 65 SV3 210000 SV3 100000 0
No ndash Tier 2 required
VC 30 100 - ND - ND Yes Notes Values in bold exceed the modified residential soil vapour HILs cis-12-DCE HIL adopted as surrogate screening criterion based on US EPA (2017b) regional screening level for residential air elevated laboratory LOR (ie above modified Tier 1 HIL) also reported Abbreviations AF = attenuation factor HIL = health investigation level ND = non detect
95 Tier 2 assessment
951 Tier 2 assessment criteria
The Tier 2 VIRA criteria for the residential zone comprise HIL-based residential indoor air criteria for the COPC (refer to Section 94) along with the residential indoor air level response ranges for TCE that were
15 Note that all locations were subjected to the Tier 2 VIRA in this assessment
80607-1 REV1 30102017 PAGE 49
EPA REF 0524111 FINAL REPORT
STAGE 1 ENVIRONMENTAL ASSESSMENT
THEBARTON ASSESSMENT AREA
initially developed by the EPA and SA Health for the EPA Assessment Area at Clovelly Park and Mitchell
Park These screening criteria and indoor air response ranges as detailed in SA EPA (2014) and
reproduced in Figure 91 are now widely adopted in South Australia for the assessment of TCE relating
to indoor air exposure
Figure 91 TCE indoor air screening criteria and the corresponding site-specific response levels
Note The no action response level is applicable where a soil vapour concentration is below the laboratory LOR (ie ND or ldquonon-
detectrdquo assumed to be lt01 microgm3)
PAGE 50 80607-1 REV1 | 30102017
EPA REF 0524111 FINAL REPORT STAGE 1 ENVIRONMENTAL ASSESSMENT THEBARTON ASSESSMENT AREA
952 Vapour intrusion modelling
For this VIRA exposure point concentrations (EPCs) of COPC in the indoor air of buildings with a slab on grade crawl space or basement construction were estimated using conservative screening assumptions and the Johnson and Ettinger (1991) vapour transport and mixing model (ie the JampE model)
The algorithms applied in the JampE (1991) model are detailed in Appendix A of the Arcadis report whereas the modelling spreadsheets for each scenario are provided in Appendix B ndash the Arcadis report is attached to this report as Appendix P
9521 Input parameters
The input parameters adopted for the vapour intrusion modelling relate to the following
the construction type and details of existing or proposed buildings ndash refer to Table 92 for adopted building input parameters
the nature of the soil profile ndash refer to Table 93 for adopted soil input parameters (0 to 1 m BGL) and
the contaminant source concentrations ndash refer to Table 6 in Appendix L
Table 92 Tier 2 vapour intrusion modelling ndash building input parameters
Parameter Units Adopted value Reference
Residential Commercial industrial
Width of Building cm 1000 2000 Friebel and Nadebaum (2011)
Length of Building cm 1500 2000
Height of Room cm 240 300
Height of crawl space cm 30 - Assumption for crawl space
Attenuation from basement to ground floor air
- 01 01 Friebel and Nadebaum (2011)
Air Exchange Rate (AER)
Indoor per hour 06 083 Friebel and Nadebaum (2011)
Crawl space per hour 06 - Friebel and Nadebaum (2011)
Basement per hour 06 - As per residential (indoor)
Fraction of Cracks in Walls and foundation
- 0001 0001 Friebel and Nadebaum (2011)
Qsoil cm 3s 300 277 Calculated from QsoilQbuilding ratio of 0005 (residential) and 0001 (commercial)
80607-1 REV1 30102017 PAGE 51
EPA REF 0524111 FINAL REPORT STAGE 1 ENVIRONMENTAL ASSESSMENT THEBARTON ASSESSMENT AREA
Table 93 Tier 2 vapour intrusion modelling ndash soil input parameters
Parameter Units Adopted value Reference
Depth cm 100 Depth of shallow soil vapour data
Total porosity - 047 Site specific geotechnical data ndash ie averaged from MW3 and MW11 shallow samples (refer to Table 1 in Appendix L) Air filled porosity - 030
Water filled porosity - 017 Notes ie representing a conservative approach whereby data for the shallow samples with the highest total porosity and lowest degree of saturation (and therefore the highest air filled porosity) have been adopted
The site specific attenuation factors calculated within the vapour intrusion models (Appendix B of the Arcadis report) are summarised in Table 94 These are chemical and depth specific values applicable to each building construction scenario These attenuation factors have been applied to the soil vapour data measured across the Thebarton EPA Assessment Area to calculate indoor air concentrations (residential properties only) in proximity to each soil vapour location ndash for commercialindustrial properties (slab on grade) indoor air concentrations have only been calculated with respect to the soil vapour data obtained for SV3 (ie the soil vapour bore with the highest measured TCE concentrations)
Table 94 Adopted attenuation factors for TCE in soil vapour to indoor air
Scenario Attenuation factor
Residential ndash slab on grade 706 x 10-4
Residential ndash crawl space 209 x 10-3
Residential ndash basement 113 x 10-1
Commercial ndash slab on grade 408 x 10-4
Notes ie soil vapour intrusion to indoor air of residential living spaces refer to Section 953 for a discussion of potential vapour intrusion risks associated with commercialindustrial properties
The chemical parameters of the COPC adopted in the JampE model were updated with data from the chemical database in the Risk Assessment Information System (RAIS 2016) as detailed in Table 95
Table 95 Summary of chemical parameters adopted for vapour intrusion modelling
Chemical Diffusivity in Air Diffusivity in Water Solubility Henryrsquos Law Molecular weight (Dair) Water (Dwater) (S) Constant 25oC (gmol)
(cm2s) (cm2s) (mgL) (unitless)
11-DCE 00863 0000011 2420 107 969
PCE 00505 000000946 206 0724 166
TCE 00687 00000102 1280 0403 131
PAGE 52 80607-1 REV1 30102017
EPA REF 0524111 FINAL REPORT STAGE 1 ENVIRONMENTAL ASSESSMENT THEBARTON ASSESSMENT AREA
9522 Predicted indoor air concentrations
Residential The predicted indoor air concentrations for each soil vapour data point as calculated by Arcadis for the three residential building scenarios (ie slab on grade crawl space and basement) are presented in Appendix C of the Arcadis report (included in this report as Appendix P)
Table 96 provides a comparison of predicted indoor air concentrations against the EPA response levels detailed in Section 951 (Figure 91) ndash ie using the 1 m soil vapour data space for slab on grade and crawl space scenarios versus the 3 m soil vapour data for basements
It should be noted that if residential properties within the Thebarton EPA Assessment Area have basements however the vapour intrusion risks will increase whereas slab on grade construction will carry a lesser vapour intrusion risk (as detailed in Table 96)
Commercialindustrial The predicted indoor air concentrations as calculated by Arcadis for a commercialindustrial (ie slab on grade) land use scenario with respect to the soil vapour data obtained for SV3 (ie maximum measured soil vapour concentrations) are as follows
11-DCE 3 microgm3
PCE 19 microgm3 and
TCE 86 microgm3
As these values are not directly comparable to the EPA response levels developed for residential land use further discussion of potential vapour intrusion risks to human health under a commercialindustrial land use
scenario is included in Section 953
As discussed for residential properties the vapour intrusion risks may increase if basements are present
80607-1 REV1 30102017 PAGE 53
EPA REF 0524111 FINAL REPORT STAGE 1 ENVIRONMENTAL ASSESSMENT THEBARTON ASSESSMENT AREA
Table 96 Comparison of predicted residential indoor air concentrations with SA EPA response levels
Indoor Air Concentration Ranges (microgmsup3) SA EPA response levels
non-detect No action
gt non-detect to lt2 Validation
2 to lt20 Investigation
20 to lt200 Intervention
ge200 Accelerated Intervention
Soil vapour bore
Sample depth
(m)
Soil vapour TCE concentration
(microgmsup3)
Predicted indoor air concentration (microgmsup3)
Residential scenario
Slab on grade Crawl space Basement
Attenuation factor
7 x 10⁻⁴ 2 x 10⁻³ 1 x 10⁻¹
SV1 10 5700 4 11
SV1 30 21000 2100
SV2 10 51000 36 102
SV2 30 890000 89000
SV2 (FD) 30 940000 94000
SV3 10 210000 147 420
SV3 30 1000000 100000
SV4 10 17000 12 34
SV4 30 43000 4300
SV5 10 100000 70 200
SV5 30 160000 16000
SV6 10 22000 15 44
SV6 (FD) 10 22000 15 44
SV6 30 150000 15000
SV6 (FD) 30 140000 14000
SV7 10 22000 15 44
SV7 30 110000 11000
SV8 10 2300 2 5
SV8 30 14000 1400
SV9 10 170 012 030
SV9 30 260 26
SV10 10 9 0007 0019
SV10 30 51 51
SV11 10 lt18 - -
SV12 10 16 0011 0032
SV12 30 55 55
SV13 10 lt21 - -
PAGE 54 80607-1 REV1 30102017
EPA REF 0524111 FINAL REPORT STAGE 1 ENVIRONMENTAL ASSESSMENT THEBARTON ASSESSMENT AREA
Notes With respect to the predicted indoor air CHC concentrations in the Arcadis VIRA report (refer to Appendix P) the results in Table 5 were calculated for SV3 using the unrounded attenuation factors presented in Appendix B (and Table 94 of this report) whereas the TCE indoor air concentrations in Appendix C (as summarised in Table 96) were calculated using rounded attenuation factors ndash this does not change the overall interpretation of the results Abbreviations FD = field duplicate
9523 Sensitivity analysis
Table 97 presents a qualitative sensitivity analysis for some of the input variables used in the modelling ndash it includes the range of practical values for each variable the value used in the risk assessment the relative model sensitivity and the uncertainty associated with the variable
Although Arcadis note that a number of parameters used within the risk assessment have a moderate degree of uncertainty associated with them thereby suggesting that the modelling may be sensitive to changes in these parameters values used to define these parameters were selected to be conservative This is considered to have resulted in an assessment which is expected to be conservative and to over-estimate actual risk
Table 97 Summary of model input parameters subjected to sensitivity analysis
Input Range of values Value adopted Sensitivity of calculated input parameters variable
Soil physical parameters
Total porosity
Varies by soil type generally 03 to 05
047 Site-specific
Indoor air concentrations will decrease with increasing total porosity Moderate sensitivity parameter decreasing by 50 will increase predicted concentration by a factor of 4
Air filled porosity
Varies by soil type generally 015 to 03
03 Site-specific
Indoor air concentrations will increase with increasing air filled porosity Moderate to high sensitivity parameter reduction by 50 decreases concentration by a factor of 10
Water filled porosity
Varies by soil type from 005 (fill or
sand) to 03 (clay)
017 Site-specific
Negligible impact on predicted indoor air concentrations although may decrease with increasing moisture content Very low sensitivity parameter
Building parameters
Air exchange rate (AER)
Varies from 05 hr-1
in smaller buildings to gt2 hr-1
06 hr-1 for residential structures
083 hr-1 for commercial
Indoor air concentrations will decrease with increasing air exchange Moderate sensitivity parameter has linear relationship with predicted concentrations conservative assumptions used
80607-1 REV1 30102017 PAGE 55
EPA REF 0524111 FINAL REPORT STAGE 1 ENVIRONMENTAL ASSESSMENT THEBARTON ASSESSMENT AREA
Input Range of values Value adopted Sensitivity of calculated input parameters variable
Advective flow rates
Varies depending on building size and
AER
300 cm3sec Calculated from building AER and
ratio of 0005
Indoor air concentrations will increase with increasing advective flow Low sensitivity parameter particularly within normal range of potential values The assumption that advective flow is occurring into a building at all times is generally conservative for Australian settings Advection is unlikely to occur under a crawl space home and diffusive transport is the dominant transport mechanism
Building size Variable Variable consistent with
Friebel and Nadebaum (2011)
Indoor air concentrations decrease with increasing building volume
Very low sensitivity parameter
9524 Uncertainties
The following uncertainties were identified in the Arcadis report (Appendix P)
Vapour transport modelling
The use of a model to predict the migration of vapour from a sub-surface source to indoor air requires the simplification of many complex processes in the sub-surface as well as the potential for entry and dispersion within a building or outdoor air To address this simplification the vapour models available (and adopted in this assessment) are considered to be conservative such that uncertainties are addressed through the overshyestimation of likely concentrations
It should be noted that the vapour model used is designed to be a first tier screening tool and is considered likely to over-estimate air concentrations due to the incorporation of a number of conservative assumptions including the following
chemical concentrations in soil vapour were assumed to remain constant over the duration of exposure (ie it was assumed that the source was non-depleting and not subject to natural biodegradation processes)
the maximum reported soil vapour concentrations were assumed to be present beneath nearby dwellings and
the occurrence of steady well-mixed vapour dispersion within the enclosed or ambient mixing space
Overall the vapour modelling undertaken is expected to provide an over-estimation of the actual vapour exposure concentrations
PAGE 56 80607-1 REV1 30102017
EPA REF 0524111 FINAL REPORT STAGE 1 ENVIRONMENTAL ASSESSMENT THEBARTON ASSESSMENT AREA
Toxicological Data
In general the available scientific information involves the extrapolation of toxicity information from studies involving experimental laboratory animals with some validation of observable health effects obtained through epidemiological studies
This may introduce two types of uncertainties into the risk assessment as follows
those related to extrapolating from one species to another and
those related to extrapolating from the high exposure doses usually used in experimental animal studies to the lower doses usually estimated for human exposure situations
In order to adjust for these uncertainties toxicity values commonly incorporate safety factors that may vary from 10 to 10000
Overall the toxicological data presented in this assessment are considered to be current and adequate for the assessment of risks to human health associated with potential exposure to the COPC identified The uncertainties inherent in the toxicological values adopted are considered likely to result in an over-estimation of actual risk
953 Potential vapour intrusion risks associated with commercialindustrial properties
An assessment of potential vapour intrusion risks to workers at commercialindustrial properties (slab on grade construction) within the Thebarton EPA Assessment Area was undertaken by Arcadis using the methodology published by US EPA (2009) and incorporated into the ASC NEPM (1999) This approach recommends adjustment of the measured or estimated contaminant concentrations in air to account for site specific exposures by the relevant receptors as follows
Ca ET EF EDECinh = days hours AT 365 24 year day
Where
ECinh = Exposure Adjusted Air Concentration (mgm3) Ca = Chemical Concentration in Air (mgm3) ET = Exposure Time (hoursday) EF = Exposure Frequency (daysyear) ED = Exposure Duration (years) AT = Averaging Time (years)
= 70 years for non-threshold carcinogens = ED for chemicals assessed based on threshold effects
80607-1 REV1 30102017 PAGE 57
EPA REF 0524111 FINAL REPORT STAGE 1 ENVIRONMENTAL ASSESSMENT THEBARTON ASSESSMENT AREA
Exposure parameters were selected from Australian sources (enHealth 2012b ASC NEPM 1999) for the receptor groups evaluated or were based on site specific factors Table 98 presents an overview of the parameters used whereas adopted inhalation TRVs are presented in Table 99
Risk was characterised for threshold and non-threshold effects for the COPC ndash spreadsheets presenting the risk calculations are provided in Appendix B of the Arcadis report (as included in Appendix P) For commercialindustrial properties the non-threshold risk level was calculated to be 3 x 10⁻⁵ (compared to a target risk level of 1 x 10⁻⁵) whereas the threshold risk level was calculated to be 10 (compared to a target risk level of 1) ndash these results indicated a potentially unacceptable vapour intrusion risk to commercialindustrial workers in the vicinity of the maximum soil vapour CHC concentrations (ie at SV3 ndash worst-case scenario based on maximum soil vapour concentrations)
Table 98 Exposure parameters ndash Commercialindustrial workers
Exposure parameter Units Value Reference
Exposure frequency days year 365 ASC NEPM (1999)
Exposure duration years 30 ASC NEPM (1999)
Exposure time indoors hoursday 8 ASC NEPM (1999)
Averaging time
Non-threshold
threshold
Years
years
70
30 ASC NEPM (1999)
Table 99 Adopted inhalation toxicity reference values
COPC Toxicity reference values
Non-threshold (microgm3)
Reference Threshold (microgm3)
Reference
11-DCE NA - 80 ATSDR (1994)
PCE NA - 200 WHO (2006)
TCE 41 US EPA (2011) IRIS 2 US EPA (2011) IRIS Notes Abbreviations NA = not applicable
954 Potential risks to trenchmaintenanceutility workers
Although trenchmaintenanceutility workers may be exposed to soil vapour concentrations as measured at 1 m BGL due to the short-term nature of such works their total intakes of TCE and other CHC will be low Assuming that a trenchmaintenanceutility worker may be exposed to TCE for a limited number of working days throughout the year (eg 20 days of 8 hours duration within an excavation) their intake will be approximately one fiftieth of the intake of a resident (who is assumed to be exposed 21 hours a day for 365 days a year)
PAGE 58 80607-1 REV1 30102017
EPA REF 0524111 FINAL REPORT STAGE 1 ENVIRONMENTAL ASSESSMENT THEBARTON ASSESSMENT AREA
Therefore the management of exposures by trenchmaintenanceutility workers may be required in areas where TCE at 1 m BGL is greater than 100 microgm3 (or 50 times the acceptable concentration for indoor air)
96 Conclusions
On the basis of the available data and the assessment presented in the Arcadis VIRA report (Appendix P) the following conclusions were provided
Health risks for residents due to the intrusion of CHC in soil vapour into residential buildings with a slab on grade crawl space or basement construction were calculated to be above the adopted EPA response levels and risks to residents may therefore be unacceptable within some parts of the Thebarton EPA Assessment Area
Health risks for commercial workers due to the intrusion of CHC in soil vapour into buildings with a slab on grade construction were calculated to be above the adopted target risk levels and risks to workers may therefore be unacceptable within some parts of the Thebarton EPA Assessment Area
In the absence of specific information regarding building construction within the Thebarton EPA Assessment Area the predicted indoor air concentrations calculated from the 1 m BGL soil vapour data for a residential crawl space scenario are summarised in Table 910
Table 910 Summary of properties with predicted indoor air concentrations (residential crawl space) above adopted EPA response levels
EPA response level No of residential properties affected Indoor air concentration (microgm3) Response
non-detect to lt2 Validation 9
2 to lt20 Investigation 10
20 to lt200 Intervention 8
ge200 Accelerated intervention 3 Notes According to information provided by the EPA there are approximately 130 residential properties located in the Thebarton EPA Assessment Area calculated on the basis of cadastral boundaries ndash some properties host more than one residence whereas some have one residence across two properties andor also host a commercial facility ndash these data would therefore need to be confirmed via a property survey
80607-1 REV1 30102017 PAGE 59
EPA REF 0524111 FINAL REPORT STAGE 1 ENVIRONMENTAL ASSESSMENT THEBARTON ASSESSMENT AREA
10 CONCEPTUAL SITE MODEL
As detailed in Table 101 a CSM has been developed for the Thebarton EPA Assessment Area on the basis of historical information (as summarised in Section 12 as well as Appendices A and B) and the data obtained during the recent Fyfe investigation program
Table 101 Summary of existing information for the Thebarton EPA Assessment Area
Topic Summarised Information
Site Characterisation
Identification of Assessment Area
An approximately 27 ha Assessment Area located within the suburb of Thebarton has been defined by the EPA The boundaries of this area are detailed in Section 21 and illustrated on Figure 1
History of land use Properties located within the Thebarton EPA Assessment Area have been used for a mixture of commercialindustrial and low density residential land uses over time Current commercialindustrial properties include a beverage factory in the north-eastern portion of the assessment area a refrigeration equipment facility a car dealership two hotels (at least one of which has a cellarbasement) automotive and other workshops and the Ice Arena Former commercialindustrial activities have been identified as including a gas works a mechanicrsquos workshop sheet metal working facilities and a farm machinery manufacturer
Historical investigations
Reports provided to Fyfe by the EPA that pertain to previous investigations undertaken within the Thebarton EPA Assessment Area have been reviewed and summarised in Appendix A Additional historical information is included in Appendix B
Local geology Natural soils encountered from the surfacenear surface to the maximum drill depth of 19 m BGL across the Thebarton EPA Assessment Area were considered to be indicative of the Quaternary Pooraka and Hindmarsh Clay formations Whereas fill materials (ie sand gravelcrushed rock andor silt) were encountered to depths of up to 09 m BGL at a number of sampling locations underlying natural soils comprised mainly low to medium plasticity silty or sandy clays with variable gravel contents Geotechnical testing of subsurface soil samples collected from 10 drill cores indicated that the PSD comprised predominantly claysilt with lesser components of sand andor gravel ndash these soil samples were mostly classified as Clay although some were classified as Sandy Clay or Clayey Sand According to Stapledon (1971) the Hindmarsh Clay unit typically contains many structural features and defects which greatly influence its permeability thereby resulting in potential preferential pathways for the vertical and lateral movement of soil vapour and groundwater Such features were not specifically observed during the recent drilling and soil logging work although some gravel lenseslayers were identified
Hydrogeology In accordance with Gerges (2006) and his classification of the Adelaide metropolitan area into a number of zones based on their individual hydrogeological characteristics the Thebarton EPA Assessment Area is located within Zone 3 (subzone 3E) to the west of the Para Fault It contains five to six Quaternary aquifers and three or four Tertiary aquifers Based on the most recent investigations the depth to water within the Q1 aquifer in the Thebarton EPA Assessment Area ranges from approximately 123 to 159 m BGL and groundwater flows in a general north-westerly direction with a relatively flat hydraulic gradient (000062 to 00012) Salinity levels (based on field EC readings) range from approximately 1230 to 3620 mgL TDS and a groundwater flow velocity range of approximately 44 to 23 myear has
80607-1 REV1 30102017 PAGE 61
EPA REF 0524111 FINAL REPORT STAGE 1 ENVIRONMENTAL ASSESSMENT THEBARTON ASSESSMENT AREA
Topic Summarised Information
been inferred As detailed in Section 222 a search of the DEWNR (2017) WaterConnect database identified 59 bores within the general Thebarton area of which 18 are located within the Thebarton EPA Assessment Area Although (where recorded) bores were listed as having been installed primarily for monitoring investigation or observation purpose other purposes (for presumed Quaternary aquifer bores) included drainage domestic and industrial A BUA has identified realistic groundwater uses as potentially including potable residential irrigation and primary contact recreationaesthetics Based on proximity to the River Torrens freshwater ecosystem protection has also been considered ndash however since the River Torrens is considered to be either a recharge boundary (ie discharging to local groundwater) or not actually hydraulically connected to the Q1 aquifer in this area this may not be a realistic beneficial use Since volatile contaminants have been detected within the Q1 aquifer a potential vapour flux risk to future site users has also been considered
Hydrology No surface water bodies have been identified within the Thebarton EPA Assessment Area The closest surface water body is the River Torrens located approximately 03 km to the east and 07 km to the north and north-west Current stormwater run-off within the Thebarton EPA Assessment Area is expected to be collected by localised (and engineered) drainage systems
Fyfe Investigation Results
Groundwater impacts Contaminants identified in groundwater beneath the Thebarton EPA Assessment Area include TCE PCE 12-DCE (cis- and trans-) and 11-DCE Although TCE PCE and 11-DCE are all considered to represent primary contaminants TCE is considered to be the main COPC (ie with the highest concentrations and greatest distribution) By comparison cis- and trans-12-DCE which are considered to represent break-down (ie daughter) products of TCE andor PCE occur at relatively minor concentrations at scattered locations and were not considered indicative of significant TCE breakdown (ie via dechlorination) Although VC represents another (expected) daughter product of TCE it was not detected in any of the groundwater wells tested The groundwater TCE plume is considered to have migrated in a north-westerly direction from the suspected source site (ie the former Austral sheet metal works) in accordance with the predominant flow direction associated with the Q1 aquifer (refer to Figures 4 and 5) The plume has been traced as far west and north as Dew Street and Smith Street respectively within the Thebarton EPA Assessment Area (ie the extent of the monitoring well network installed by Fyfe) but its north-western extent has not yet been determined (whereas its extent has been defined in all other directions)
Soil vapour impacts Contaminants identified in soil vapour beneath the Thebarton EPA Assessment Area include TCE PCE 12-DCE (cis- and trans-) and 11-DCE The distribution of TCE in soil vapour at 1 and 3 m BGL generally correlates with the north-westerly groundwater flow direction (refer to Figures 6 and 7) and is therefore considered to be a product of volatilisation from the groundwater CHC plume ndash the consistent decrease in soil vapour concentrations with decreasing depth also supports this conclusion The soil vapour samples with the maximum TCE concentrations (ie SV3_10m and SV3_30m) also had the highest PCE and 11-DCE concentrations (or elevated LOR) thereby suggesting that they could represent co-contaminants (ie from a similar source areaactivity) These samples also had elevated LOR for 12-DCE (cis- and trans-) Although VC was not detected in any of the soil vapour samples the laboratory LOR for VC in most of the samples with the highest concentrations of TCE (ie SV2_30m SV3_10m SV3_30m and SV7_30m) exceeded the adopted HILs for residential andor commercialindustrial land use Although the absence of VC in soil vapour cannot therefore be confirmed its absence at detectable levels in groundwater suggests that (limited) TCE
PAGE 62 80607-1 REV1 30102017
EPA REF 0524111 FINAL REPORT STAGE 1 ENVIRONMENTAL ASSESSMENT THEBARTON ASSESSMENT AREA
Topic Summarised Information
degradation has not yet resulted in its production (ie at measureable levels) Although the extent of the soil vapour TCE plume has not yet been determined (ie in any direction) it is expected to have a similar extent to that of the identified groundwater plume (ie as the groundwater CHC impacts represent the source of the measured soil vapour CHC concentrations)
Potential Exposure Pathways
Contaminants of Based on the results of historical investigations the EPA identified a number of CHC as being of Potential Concern concern for the Thebarton EPA Assessment Area The main COPC was identified as TCE with
additional COPC including PCE 12-DCE (cis- and trans-) VC and 11-DCE Further detail is provided in Section 14 These COPC were confirmed by the Fyfe investigations with TCE identified as both the main contaminant in groundwater and soil vapour and the main driver in terms of potential human health risks associated with vapour intrusion into buildings within the Thebarton EPA Assessment Area (refer to Section 9)
Suspected source and The suspected source of the identified CHC groundwater (and soil vapour) impacts within the affected media Thebarton EPA Assessment Area is the former Austral sheet metal works located over multiple
allotments between George and Maria Streets from the 1920s until the 1960s-1970s Previous investigations (Appendix A) had identified groundwater CHC impacts on part of this suspected source site The Fyfe investigations have concentrated on impacts within groundwater and soil vapour across the Thebarton EPA Assessment Area both of which generally correlate with the inferred north-westerly groundwater flow direction and are considered to be related to the previously identified dissolved phase groundwater CHC impacts
Sensitive receptors The following sensitive receptors have been identified as potentially relevant to the Thebarton EPA Assessment Area Ecological groundwater ecosystems within the assessment area extending to at least Dew and Smith
Streets (ie as the north-western extent of the groundwater CHC plume has not yet been determined) and
the freshwater ecosystem of the River Torrens located at a distance of approximately 07 km in a hydraulically down-gradient (ie north-westerly) direction but not necessarily representing a groundwater receiving environment
Human current and future occupants of and visitors to residential properties current and future workers on the source site and other commercialindustrial properties
within the area current and future underground trenchmaintenanceutility workers and down-gradient groundwater bore users
Contaminant Possible contaminant transport mechanisms associated with the CHC-impacted groundwater transport identified within the Q1 aquifer beneath the Thebarton EPA Assessment Area include mechanisms flow through the aquifer to a hydraulically down-gradient surface water body andor down-
gradient groundwater bores vapour generation andor flow via subsurface preferential pathways (eg service trenches
more permeable soils) and downward movement into underlying aquifers (eg dense non-aqueous phase liquid
(DNAPL))
80607-1 REV1 30102017 PAGE 63
EPA REF 0524111 FINAL REPORT STAGE 1 ENVIRONMENTAL ASSESSMENT THEBARTON ASSESSMENT AREA
Topic Summarised Information
Exposure Possible exposure mechanisms associated with impacted groundwater within the Thebarton mechanisms EPA Assessment Area include
direct contact (eg during extractionuse of groundwater) incidental ingestion (eg during extractionuse of groundwater) and inhalation of vapours (eg during extractionuse of groundwater andor as a result of
vapour intrusion into buildings)
Assessment of Risk
Groundwater risks The recent groundwater analytical results have indicated that the Q1 aquifer beneath the Thebarton EPA Assessment Area contains measurable concentrations of CHC (mainly TCE but also including PCE 12-DCE andor 11-DCE at some locations) Measured concentrations of TCE exceeded the adopted assessment criteria for potable andor primary contact recreation in wells MW02 MW3 MW5 MW6 MW11 MW12 MW14 MW15 MW17 MW20 MW21 and MW23 located on Admella Maria George Albert and Dew Streets as well as Light Terrace with maximum concentrations corresponding to the ldquocorerdquo area of the plume One well (MW25) contained a concentration of carbon tetrachloride that exceeded the adopted potable criterion Although groundwater vapour flux has mainly been addressed by the VIRA it could also occur during the extraction of groundwater for domestic use and in terms of aesthetic considerations the CHC impacted groundwater could be odorous Additional parameters measured for the purpose of establishing general aquifer conditions (including whether conditions may be amenable to the breakdown of CHC) have also been reported ndash no clear secondary lines of evidence for the occurrence of natural attenuation have been identified
Groundwater fate Although scattered detectable concentrations of 12-DCE have been measured in groundwater and transport across the Thebarton EPA Assessment Area the absence of significant and ubiquitous TCE modelling daughter products has been interpreted to indicate that substantial dechlorination is not
occurring Groundwater fate and transport modelling (refer to Section 8 and Appendix O) has predicted that the likely extent of the dissolved phase groundwater TCE plume over the next 100 years will extend by another 500 m beyond the boundaries of the current Thebarton EPA Assessment Area However no significant lateral plume expansion is expected
Vapour intrusion risks A VIRA (refer to Section 9 and Appendix P) was undertaken to assess potential risks to human health from the intrusion of CHC vapours (primarily TCE) into indoor air from soil vapour The predicted indoor air concentrations of TCE within the residential portion (assuming crawl space construction in the absence of specific structural information) of the Thebarton EPA Assessment Area indicated that 21 (ie of approximately 130 residential properties) were predicted to have detectable levels of TCE in indoor air and therefore require further action as follows 10 properties within the investigation range (2 to lt20 microgm3) eight properties within the intervention range (20 to lt200 microgm3) and three properties within accelerated intervention range (ge200 microgm3) All remaining residential properties in the Thebarton EPA Assessment Area are considered to be safe from soil vapour intrusion with predicted indoor air concentrations of TCE below 2 microgm3
(assuming crawl space construction) Based on the results of the VIRA however substantially increased risks are likely to exist should cellarsbasements be present whereas risks may be lower for slab on grade construction premises Where permission has been granted by the ownersoccupiers indoor air monitoring of properties within the 20 to lt200 microgm3 and ge200 microgm3 response level ranges as well as
PAGE 64 80607-1 REV1 30102017
EPA REF 0524111 FINAL REPORT STAGE 1 ENVIRONMENTAL ASSESSMENT THEBARTON ASSESSMENT AREA
Topic Summarised Information
selected adjoining properties has been commissioned by the EPA to validate the results of the VIRA modelling (ie which are expected to be overly-conservative) ndash these results will be documented in a subsequent report Calculated vapour intrusion risks to workers within commercialindustrial properties (slab on grade construction) across at least part of the Thebarton EPA Assessment Area (ie based on the maximum soil vapour CHC concentrations in soil vapour bore SV3 located on Maria Street) are considered to be unacceptable Although a basementcellar is known to be present at one commercial property on George Street vapour intrusion risks to subsurface structures associated with commercialindustrial properties have not yet been assessed Management of exposures by trenchmaintenanceutility workers may be required in areas where TCE at 1 m BGL is greater than 100 microgm3 (ie corresponding to 50 times the acceptable concentration for indoor air)
Complete Exposure Pathways
Identified pathways and areas of potential risk
Based on the results of the recent Fyfe investigations (including the VIRA) and taking into account available historical information (Appendices A and B) and DEWNR (2017) WaterConnect bore information the following complete exposure pathways and associated risks are considered possible for the Thebarton EPA Assessment Area exposure (direct contact incidental ingestion andor inhalation of vapours) during use of
groundwater for domestic (eg drinking water plumbing garden irrigation) andor recreational (eg filling of swimming poolsspas) purposes
vapour intrusion into indoor air within 30 residential propertieslocated within the vicinity of soil vapour bores SV1 to SV9 (assuming crawl space construction) ndash although 19 of these properties are predicted to be in the validationinvestigation action level range 11 are predicted to be in the intervention action level range (with actual indoor air monitoring results for properties within the intervention action level range pending)
vapour intrusion into residential cellarsbasements (if present) in the vicinity of soil vapour bores SV1 to SV10 and SV12 and
vapour intrusion into the indoor air of commercialindustrial properties ndash although actual risks to site workers would require further specific considerationassessment
In addition although only assessed in a qualitative manner to date trenchmaintenanceutility workers may also be at risk where TCE at 1 m BGL is greater than 100 microgm3 (or 50 times the acceptable concentration for indoor air) Exposure management should involve the development of a site-specific HSP (prior to the commencement of work in the affected area) that details measures such as restricting personnel exposure times monitoring volatile compounds using a PID unit providing increased ventilation and using appropriate PPE (eg gas masks) as required
Notes calculated on the basis of cadastral boundaries and assuming crawl space construction ndash some properties host more than one residence whereas some have one residence across two properties andor also host a commercial premises a property survey would be required to confirm building construction details and the number of individual residences affected
80607-1 REV1 30102017 PAGE 65
EPA REF 0524111 FINAL REPORT STAGE 1 ENVIRONMENTAL ASSESSMENT THEBARTON ASSESSMENT AREA
11 CONCLUSIONS
Between May and August 2017 Fyfe undertook an investigation of groundwater and soil vapour CHC impacts within an EPA-designated Assessment Area located in Thebarton South Australia The results of the investigation have been used to assess potential vapour intrusion to indoor air risks within residential and commercialindustrial properties A CSM has been developed from the field analytical and modelling results as presented in Section 10
The following conclusions have been reached
Subsurface geological conditions are generally consistent across the Thebarton EPA Assessment Area and are dominated by the sediments (ie low to medium plasticity silty or sandy clays with variable gravel contents) of the Pooraka and Hindmarsh Clay formations While there is some potential for structural defects and coarser horizons to act as preferential pathways (lateral and vertical) for soil vapour movement no significant spatially-consistent features were identified during the recent soil drillinglogging work ndash although thin gravel lenses were present within the subsurface at some locations and a 15 m thick layer of gravel was encountered at 12 to 135 m in groundwater well MW17
Groundwater within the Q1 aquifer is located at a depth of approximately 123 to 159 m BGL and flows in a general north-westerly direction (refer to Figure 4) ndash the closest surface water receptor is the River Torrens located approximately 03 km to the east and 07 km to the north and north-west A groundwater flow velocity range of approximately 44 to 23 myear has been inferred16 and the groundwater gradient beneath the Thebarton EPA Assessment area is relatively flat (ie 000062 to 00012)
Beneficial uses for groundwater within the Q1 aquifer beneath the Thebarton EPA Assessment Area have been identified to include domestic irrigation primary contact recreationaesthetics human health in non-use scenarios (ie vapour flux as assessed by the VIRA) and possibly also potable Although freshwater ecosystem protection was also considered the River Torrens is thought to comprise either a recharge boundary (ie discharging to local groundwater) or to not actually be hydraulically connected to the Q1 aquifer in this area
Groundwater beneath parts of the Thebarton EPA Assessment Area contains detectable concentrations of various CHC and includes TCE and carbon tetrachloride (one location only) levels that exceed the adopted assessment criteria for potable use andor primary contact recreation ndash thereby indicating that groundwater would be unsuitable for drinking or the filling of swimming poolsspas In addition vapour flux could also occur during the extraction of groundwater for domestic use and in terms of aesthetic considerations the groundwater could be odorous
16 ie as calculated by Fyfe based on available data
80607-1 REV1 30102017 PAGE 67
EPA REF 0524111 FINAL REPORT STAGE 1 ENVIRONMENTAL ASSESSMENT THEBARTON ASSESSMENT AREA
The groundwater and soil vapour CHC impacts identified beneath parts of the Thebarton EPA Assessment Area are considered likely to have emanated from the former Austral sheet metal works located over multiple allotments between George and Maria Streets from the 1920s until the 1960sshy1970s The possible presence of on-going (primary andor secondary) source(s) at this property has not yet been investigated
As depicted on Figures 6 and 7 the current extent of the soil vapour CHC (ie dominated by TCE) impacts has been determined to correspond to the mapped distribution of the groundwater TCE impacts (Figure 5) and is considered to be directly related to groundwater (rather than soil) CHC impacts Although no soil vapour impacts were detected at 1 m BGL in SV11 and SV1317 located near the eastern and western ends of Light Terrace respectively the north-western extents of the groundwater and soil vapour CHC impacts have not yet been determined In addition although the extent of the groundwater TCE plume has been delineated in all other directions the soil vapour TCE plume has not been delineated in any direction
TCE is considered to be a primary contaminant as well as the dominant (ie in terms of concentration and extent) CHC in both groundwater and soil vapour ndash the presence of PCE and 11-DCE suggests however that more than one primary contaminant is present Although the detectable concentrations of 12-DCE (cis- and trans) are considered to have resulted from the breakdown of TCEPCE no VC has been detected in either groundwater or soil vapour ndash the scattered distribution and relatively low concentrations of 12-DCE as well as the absence of measurable VC have been interpreted to indicate that significant dechlorination of the primary contaminants has not occurred (despite the likely age of the plume ndash ie possibly up to about 90 years old)
Although the COPC adopted for the soil vapour assessment program included various CHC (ie with TCE identified as the dominant contaminant in groundwater and soil vapour) the Tier 1 VIRA confirmed that TCE PCE and 11-DCE all exceeded the adopted vapour intrusion HILs Based primarily on its greater toxicity however the risk driver for the Thebarton EPA Assessment Area is considered to be TCE
The VIRA (Tier 2) results for predicted indoor air concentrations of TCE within the residential portion (assuming crawl space construction) of the Thebarton EPA Assessment Area indicated that 21 (ie of approximately 130 residential properties) were predicted to have detectable levels of TCE in indoor air and that require further action as follows
― 10 properties within the investigation range (2 to lt20 microgm3)
― eight properties within the intervention range (20 to lt200 microgm3) and
― three properties within accelerated intervention range (ge200 microgm3)
All remaining residential properties in the Thebarton EPA Assessment Area are considered to be safe from soil vapour intrusion with predicted indoor air concentrations of TCE below 2 microgm3 (assuming
17 noting that the laboratory LOR for TCE was elevated as compared to the other soil vapour samples
PAGE 68 80607-1 REV1 30102017
EPA REF 0524111 FINAL REPORT STAGE 1 ENVIRONMENTAL ASSESSMENT THEBARTON ASSESSMENT AREA
crawl space construction) Based on the results of the VIRA however substantially increased risks are likely to exist should cellarsbasements be present whereas risks may be lower for slab on grade construction premises ndash refer to Table 96
Calculated vapour intrusion risks to workers within commercialindustrial properties (slab on grade construction) across at least part of the Thebarton EPA Assessment Area (ie based on the maximum soil vapour CHC concentration obtained for soil vapour bore SV3 located on Maria Street) are considered to be unacceptable Although a basementcellar is known to be present at one commercial property on George Street vapour intrusion risks to subsurface structures associated with commercialindustrial properties have not yet been assessed
Although only assessed in a qualitative manner trenchmaintenanceutility workers may be at risk in areas where TCE concentrations at 1 m BGL are greater than 100 microgm3 (or 50 times the acceptable concentration for indoor air) ndash in this case appropriate management measures would be required to be adopted This should involve the development of a site-specific HSP (prior to the commencement of work in the affected area) that details measures such as restricting personnel exposure times monitoring volatile compounds using a PID unit providing increased ventilation and using appropriate PPE (eg gas masks) as required
80607-1 REV1 30102017 PAGE 69
EPA REF 0524111 FINAL REPORT STAGE 1 ENVIRONMENTAL ASSESSMENT THEBARTON ASSESSMENT AREA
12 DATA GAPS
Based on the results obtained during the recent Fyfe investigations as well as available historical information (Appendices A and B) the following data gaps have been identified for the Thebarton EPA Assessment Area
property information assumed for the vapour intrusion modelling has not been confirmed (ie current land use (residential versus commercial) building construction type (slab crawl space presence of basements and cellars including cellarsbasements for commercial properties)
groundwater uses considered for the beneficial use assessment have not been confirmed (whether bores are registered or not)
the conclusions are based on a single sampling event meaning the understanding of temporal and spatial variation is limited for both groundwater and soil vapour and
the groundwater contamination has not been fully delineated in the hydraulically down-gradient direction (north-west) and hence the groundwater fate and transport modelling is not validated
80607-1 REV1 30102017 PAGE 71
EPA REF 0524111 FINAL REPORT STAGE 1 ENVIRONMENTAL ASSESSMENT THEBARTON ASSESSMENT AREA
13 REFERENCES
ANZECCARMCANZ (2000a) Australian Guidelines for Water Quality Monitoring and Reporting
ANZECCARMCANZ (2000b) Australian and New Zealand Guidelines for Fresh and Marine Water Quality
ASTM (2001) Standard Practice for Active Soil Gas Sampling in the Vadose Zone for Vapor Intrusion Evaluations ASTM Guide D7663-12
ASTM (2006) Standard Guide for Soil Gas Monitoring in the Vadose Zone ASTM Guide D5314-92
ATSDR (1994) Toxicological profile ndash 11-Dichloroethene httpswwwatsdrcdcgovToxProfilestpaspid=722amptid=130
AustralianNew Zealand Standard (1998) Water Quality Sampling Part 1 Guidance on the Design of Sampling Programs Sampling Techniques and the Preservation and Handling of Samples ASNZS 566711998
AustralianNew Zealand Standard (1998) Water Quality Sampling Part 11 Guidance on Sampling of Groundwaters ASNZS 5667111998
Bouwer H and Rice RC (1976) A Slug Test Method for Determining Hydraulic Conductivity of Unconfined Aquifers with Completely or Partially Penetrating Wells Water Resources Research vol 12 no 3 pp 423-428
Butler JJ Jr (1998) The Design Performance and Analysis of Slug Tests
Cooper HH Bredehoeft JD and Papadopulos SS (1967) Response of a Finite-Diameter Well to an Instantaneous Charge of Water Water Resources Research vol 3 no 1 pp 263-269
CRC CARE (2013) Petroleum Hydrocarbon Vapour Intrusion Assessment ndash Australian Guidance CRC CARE Technical Report No 23 July 2013
Dagan G (1978) A Note on Packer Slug and Recovery Tests in Unconfined Aquifers Water Resources Research vol 14 no 5 pp 929-934
Department of Environment Water and Natural Resources (DEWNR 2017) Water Connect Master Register of All Bores Primary Industries and Resources South Australia
Duffield G (2007) AQTESOLVreg Professional Version 45 Hydrosolve Inc
enHealth (2012a) Environmental Health Risk Assessment - Guidelines for assessing human health risks from environmental hazards enHealth Council
enHealth (2012b) Australian Exposure Factor Guidance Handbook enHealth Council
Environment Protection Act 1993
80607-1 REV1 30102017 PAGE 73
EPA REF 0524111 FINAL REPORT STAGE 1 ENVIRONMENTAL ASSESSMENT THEBARTON ASSESSMENT AREA
Environment Protection Regulations 2009
Friebel E and Nadebaum P (2011) Health Screening Levels for Petroleum Hydrocarbons in Soil and Groundwater CRC CARE Technical Report No 10
Gerges NZ (1999) The Geology and Hydrogeology of the Adelaide Metropolitan Area Flinders University (South Australia) PhD thesis (unpublished)
Gerges NZ (2006) Overview of the Hydrogeology of the Adelaide Metropolitan Area DWLBC Report 200610
Golder Associates (1994) Contamination Assessment George Street Thebarton SA Report to United Land dated 9 December 1994
Hvorslev MJ (1951) Time Lag and Soil Permeability in Ground-Water Observations Bulletin no 36 Waterways Exper Sta Corps of Engrs US Army Vicksburg Mississippi pp 1-50
Hyder Z Butler JJ Jr McElwee CD and Liu W (1994) Slug Tests in Partially Penetrating Wells Water Resources Research vol 30 no 11 pp 2945-2957
ITRC (2007) Vapor Intrusion Pathway - A Practical Guidance
Johnson PC and Ettinger RA (1991) Heuristic Model for Predicting the Intrusion Rate of Contaminant Vapors
into Buildings Environ Sci Technology 251445-1452
McDonald M G and Harbaugh A W (1988) A Modular Three-Dimensional Finite-Difference Ground-Water Flow Model Techniques of Water-Resources Investigations Book 6 Chapter A1 U S Geological Survey
NEPM (1999) National Environment Protection (Assessment of Site Contamination) Measure Schedules B1 to
B9 National Environment Protection Council Australia
NHMRC (2008) Guidelines for Managing Risks in Recreational Water
NHMRCNRMMC (2011) Australian Drinking Water Guidelines (as revised in 2016)
NJDEP (2013) Site Remediation Program Vapor Intrusion Technical Guidance (Version 31)
NSW DEC (2006) Guidelines for the NSW Site Auditor Scheme (2nd edition)
Payne FC Quinnan JA and Potter ST (2008) Remediation Hydraulics CRC Press Boca Raton FL
RAIS (2016) Chemical Specific Parameters for Trichloroethylene Risk Assessment Information System Office of Environmental Management US Department of Energy
REM (2005a) George St Thebarton Site ndash Stage 2 Investigations Report to Luca Group dated 26 August 2005
REM (2005b) Stage 3 Environmental Site Assessment George St Thebarton SA Report to Luca Group dated 23 November 2005
SA Department of Mines and Energy (1969) 1250000 Adelaide Geological Map Sheet Sheet S1 54-9
PAGE 74 80607-1 REV1 30102017
EPA REF 0524111 FINAL REPORT STAGE 1 ENVIRONMENTAL ASSESSMENT THEBARTON ASSESSMENT AREA
SA EPA (2007) Regulatory Monitoring and Testing Groundwater Sampling
SA EPA (2009) Guidelines for the Assessment and Remediation of Groundwater Contamination
SA EPA (2014) Clovelly Park Mitchell Park Project Management Team Assessment Program Flip Book November 2014
SA EPA (2015) Environment Protection (Water Quality) Policy
Standards Australia (1993) Geotechnical Site Investigations AS1726-1993
Standards Australia (2005) Guide to the Sampling and Investigation of Potentially Contaminated Soil Part 1 Non-Volatile and Semi-Volatile Compounds AS44821-2005
Stapledon DH (1971) Changes and Structural Defects Developed in some South Australian Clays and their Engineering Consequences Proceedings of Symposium on Soils and Earth Structures in Arid Climates Adelaide 1970
US EPA (1996) Soil Screening Guidance Technical Background Document Office of Emergency and Remedial Response Washington DC EPA540R95128
US EPA (1999) Compendium of Methods for the Determination of Toxic Organic Compounds in Ambient Air Second Edition Compendium Method TO-15 Determination Of Volatile Organic Compounds (VOCs) In Air Collected In Specially-Prepared Canisters And Analyzed By Gas Chromatography Mass Spectrometry (GCMS) EPA625R-96010b
US EPA (2002) OSWER Draft Guidance for Evaluating the Vapour Intrusion to Indoor Air Pathway from Groundwater and Soils (Subsurface Vapour Intrusion Guidance) EPA530-D-02-004
US EPA (2009) EPArsquos Risk-Screening Environmental Indicators (RSEI) Methodology Office of Pollution Prevention and Toxics Washington DC
US EPA (2011) IRIS (Integrated Risk Information System) Trichloroethylene Chemical Assessment Summary httpscfpubepagovnceairisiris_documentsdocumentssubst0199_summarypdf
US EPA (2012) EPArsquos Vapor Intrusion Database Evaluation and Characterization of Attenuation Factors for Chlorinated Volatile Organic Compounds and Residential Buildings
US EPA (2015) OSWER Technical Guide for Assessing and Mitigating the Vapour Intrusion Pathway from Subsurface Vapour Sources to Indoor Air
US EPA (2017a) Regional Screening Levels (RSLs) - Generic Tables (June 2017) httpswwwepagovriskregional-screening-levels-rsls-generic-tables-june-2017
US EPA (2017b) Regional Screening Levels for Chemical Contaminants at Superfund Sites httpwwwepagovreg3hwmdriskhumanrb-concentration_tableGeneric_Tablesindexhtm
80607-1 REV1 30102017 PAGE 75
EPA REF 0524111 FINAL REPORT STAGE 1 ENVIRONMENTAL ASSESSMENT THEBARTON ASSESSMENT AREA
WHO (2006) Air Quality Guidelines for Europe Second Edition WHO Regional Publications European Series No 91
WHO (2017) Guidelines for Drinking-water Quality Fourth edition (incorporating the first addendum)
Wiedemeier T Swanson M Moutoux D Gordon E Wilson J Wilson B Kampbell D Haas P Miller R Hansen J and Chapelle F (1998) Technical Protocol for Evaluating Natural Attenuation of Chlorinated Solvents in Ground Water National Risk Management Research Laboratory Office of Research and Development US EPA
Zheng C (1990) MT3D A Modular Three-Dimensional Transport Model for Simulation of Advection Dispersion and Chemical Reactions of Contaminants in Groundwater Systems Prepared for US EPA by Robert S Kerr Environmental Research Laboratory Ada Oklahoma developed by SS Papadopulos amp Associates Inc Rockville Maryland
PAGE 76 80607-1 REV1 30102017
EPA REF 0524111 FINAL REPORT STAGE 1 ENVIRONMENTAL ASSESSMENT THEBARTON ASSESSMENT AREA
14 STATEMENT OF LIMITATIONS
The opinions and conclusions presented in this report are specific to the conditions of the Thebarton EPA Assessment Area and the state of legislation currently enacted as at the date of this report Fyfe does not make any representation or warranty that the opinions and conclusions in this report will be applicable in the future as there may be changes in the condition of the Thebarton EPA Assessment Area applicable legislation or other factors that would affect the opinions and conclusions contained in this report
Fyfe has used the degree of skill and care ordinarily exercised by reputable members of our profession practising in the same or similar locality This report has been prepared for the South Australian Environment Protection Authority for the specific purpose identified in the report Fyfe accepts no liability or responsibility to any third party for the accuracy of any information contained in the report or any opinion or conclusion expressed in the report Neither the whole of the report nor any part or reference thereto may be in any way used relied upon or reproduced by any third party without Fyfersquos prior written approval This report must be read in its entirety including all tables and attachments
80607-1 REV1 30102017 PAGE 77
EPA REF 0524111 FINAL REPORT STAGE 1 ENVIRONMENTAL ASSESSMENT THEBARTON ASSESSMENT AREA
FIGURES
Figure 1 Site Location and Assessment Area
Figure 2 Assessment Point Locations
Figure 3 Waterloo Membrane Samplertrade TCE Concentration Plan
Figure 4 Groundwater Elevation Contour Plan
Figure 5 Groundwater Concentration Plan
Figure 6 Soil Vapour Concentration Plan (10m)
Figure 7 Soil Vapour Concentration Plan (30m)
80607-1 REV1 30102017 PAGE 79
JAM
ES CO
NG
DO
N D
RIV
E
JAM
ES CO
NG
DO
N D
RIV
E
DEW
STREET
DEW
STREET
CHAPEL STREETCHAPEL STREET
PAR
KER
STREET
PAR
KER
STREET
POR
T RO
AD
POR
T RO
AD
POR
T RO
AD
POR
T RO
AD
LIGHT TERRACELIGHT TERRACE
DEW
STREET
DEW
STREET
WA
LSH ST
WA
LSH ST
AD
MELLA
STREET
AD
MELLA
STREET
ALB
ERT STR
EETA
LBER
T STREET
HO
LLAN
D ST
REET
HO
LLAN
D ST
REET
RANDOLPH STREET
RANDOLPH STREET
JAM
ES STREET
JAM
ES STREET
DOVE STREET
DOVE STREET
SMITH STREETSMITH STREET
MARIA STREETMARIA STREET
GEORGE STREETGEORGE STREET
KINTORE STREET
KINTORE STREET
PORT ROAD
PORT ROAD
PORT ROAD
PORT ROAD
CAW
THO
RN
E STR
EETC
AWTH
OR
NE ST
REET
DEVON STREETDEVON STREET
KINTORE STREETKINTORE STREET
GOODENOUGH STREETGOODENOUGH STREET
LIVESTR
ON
G PATH
WAY
LIVESTR
ON
G PATH
WAY
CCAAWW
TTHHOO
RRNN
EE SSTTRR
EEEETT
HHOO
LLLLAANN
DD SSTT
RREEEETT
DE
DEW
SW
STREET
TREET
JJAM
EA
MES S
S STREET
TREET
DDOOVVEE SSTTRREEEETT
LLIIVVEESSTTRR
OONN
GG PPAATTHH
WWAAYY
LIGHT TERRLIGHT TERRAACECE
AD
MELLA
SA
DM
ELLA STR
EETTR
EET
CHAPEL SCHAPEL STREETTREET
AALLBB
EERRTT SSTTRR
EEEETT
GEGEORORGE SGE STREETTREET
PPOORRTT RROOAADD
PPOORRTT RROOAADD
DDEEWW
SSTTRREEEETT
MMAARRIIAA SSTTRREEEETT
JJAAMM
EESS CCOO
NNGG
DDOO
NN DD
RRIIVV
EE
WWAA
LLSSHH SSTT
SSMMIITTHH SSTTRREEEETT
RRANDOLPH S
ANDOLPH STREETTREET
PPOORR
TT RROO
AADD
PPOORR
TT RROO
AADD
KKIINNTTOORREE SSTTRREEEETT
KKIINNTTOORREE SSTTRREEEETT
PPAARR
KKEERR
SSTTRREEEETT
GGOOOODDEENNOOUUGGHH SSTTRREEEETT
DDEEVVOONN SSTTRREEEETT
ASSESSMENT AREA
CBD
750m
LEGEND
EPA ASSESSMENT AREA
CADASTRE
12500 A3
0 25 50 m
CLIENT
SA EPA
PROJECT
FIGURE 1 SITE LOCATION AND ASSESSMENT AREA
EPA THEBARTON ASSESSMENT AREA - STAGE 1
TITLE
FIGURE 1 SITE LOCATION AND ASSESSMENT AREA
PROJECT NO DATE CREATED
80607-1 290917
80607_Fig 1 - Site Location and Assessment Areaai REV 1 gt 290917
LE
VE
L 1
12
4 S
OU
TH
TE
RR
AC
E
AD
EL
AID
E S
A 5
00
0
P
H
(08
) 8
23
2 9
08
8
F
AX
(0
8)
82
32
90
99
EM
AIL
in
fo
fyfe
co
ma
u
W
EB
fy
fec
om
au
AB
N
57
00
8 1
16 1
30
JAM
ES CO
NG
DO
N D
RIV
E
JAM
ES CO
NG
DO
N D
RIV
E
DEW
STREET
DEW
STREET
CHAPEL STREETCHAPEL STREET
PAR
KER
STREET
PAR
KER
STREET
POR
T RO
AD
POR
T RO
AD
POR
T RO
AD
POR
T RO
AD
LIGHT TERRACELIGHT TERRACE
DEW
STREET
DEW
STREET
WA
LSH ST
WA
LSH ST
AD
MELLA
STREET
AD
MELLA
STREET
ALB
ERT STR
EETA
LBER
T STREET
HO
LLAN
D ST
REET
HO
LLAN
D ST
REET
RANDOLPH STREET
RANDOLPH STREET
JAM
ES STREET
JAM
ES STREET
DOVE STREET
DOVE STREET
SMITH STREETSMITH STREET
MARIA STREETMARIA STREET
GEORGE STREETGEORGE STREET
KINTORE STREET
KINTORE STREET
PORT ROAD
PORT ROAD
PORT ROAD
PORT ROAD
CAW
THO
RN
E STR
EETC
AWTH
OR
NE ST
REET
DEVON STREETDEVON STREET
KINTORE STREETKINTORE STREET
GOODENOUGH STREETGOODENOUGH STREET
LIVESTR
ON
G PATH
WAY
LIVESTR
ON
G PATH
WAY
SV1SV1
SV2SV2
SV3SV3SV4SV4
SV5SV5
SV6SV6
SV7SV7SV8SV8
SV9SV9
SV10SV10
SV11SV11SV12SV12
SV13SV13
MW1MW1
MW02MW02
MW3MW3
MW4MW4MW5MW5MW6MW6
MW7MW7
MW8MW8
MW9MW9
MW10MW10MW11MW11
MW12MW12MW13MW13
MW14MW14MW15MW15
MW16MW16
MW17MW17
MW18MW18
MW19MW19
MW20MW20
MW21MW21
MW22MW22
MW23MW23
MW24MW24
MW25MW25
MW26MW26
WMS2WMS2WMS1WMS1
WMS3WMS3WMS4WMS4WMS5WMS5
WMS6WMS6
WMS7WMS7WMS8WMS8
WMS9WMS9WMS10WMS10
WMS11WMS11
WMS12WMS12
WMS13WMS13WMS14WMS14
WMS15WMS15
WMS41WMS41
WMS40WMS40
WMS39WMS39WMS38WMS38
WMS16WMS16
WMS17WMS17
WMS18WMS18WMS19WMS19
WMS20WMS20
WMS21WMS21WMS22WMS22
WMS23WMS23WMS24WMS24
WMS25WMS25
WMS26WMS26
WMS27WMS27WMS28WMS28WMS29WMS29
WMS30WMS30
WMS31WMS31
WMS32WMS32
WMS33WMS33
WMS34WMS34
WMS35WMS35
WMS36WMS36
WMS37WMS37
WWAA
LLSSHHSSTT
SSMMIITTHH SSTTRREEEETT
RRANDOLPH S
ANDOLPH STREETTREET
PPOORR
TT RROO
AADD
PPOORR
TT RROO
AADD
CCAAWW
TTHHOO
RRNN
EE SSTTRR
EEEETT
JJAM
EA
MES S
S STREET
TREET
HHOO
LLLLAANN
DDSSTT
RREEEETT
DE
DEW
SW
STREET
TREET
DDOOVVEE SSTTRREEEETT
LLIIVVEESSTTRR
OONN
GGPPAATTHH
WWAAYY
LIGHT TERRLIGHT TERRAACECE
CHAPEL SCHAPEL STREETTREET
AALLBB
EERRTT SSTTRR
EEEETT
AD
MELLA
SA
DM
ELLA STR
EETTR
EET
GEGEORORGE SGE STREETTREET
PPOORRTT RROOAADD PPOORRTT RROOAADD
DDEEWW
SSTTRREEEETT MMAARRIIAA SSTTRREEEETT
JJAAMM
EESS CCOO
NNGG
DDOO
NN DD
RRIIVV
EE
KKIINNTTOORREE SSTTRREEEETT
KKIINNTTOORREE SSTTRREEEETT
PPAARR
KKEERR
SSTTRREEEETT
GGOOOODDEENNOOUUGGHH SSTTRREEEETT
DDEEVVOONN SSTTRREEEETT
FIGURE 2 ASSESSMENT POINT LOCATIONS
MMWW88
MW2MW244 WMS3WMS355
MW2MW255
WMS3WMS366
WMS3WMS377
WMS3WMS311
MW2MW222WMS34WMS34
MW2MW233 WMS3WMS322
WMS3WMS333
WMS2WMS277WMS2WMS299 WMS2WMS288
SSV12V12 SSVV1111 MW19MW19
MW18MW18 SSVV1133 MW2MW200 WMS3WMS300
MW2MW211 WMS2WMS255
WMS2WMS266
MW17MW17 WMS2WMS244
WMS2WMS233
WMS2WMS222 WMS2WMS211
SSVV99
SSV10V10WMS2WMS200 MW14MW14MW15MW15 WMS18WMS18
WMS19WMS19 MW16MW16
WMS13WMS13MW10MW10 WMS14WMS14MMWW1111SVSV77WMS15WMS15SSVV88WMS16WMS16
SVSV66WMS4WMS411MW13MW13 LEGENDMW12MW12
WATERLOO MEMBRANE SAMPLERTM - ROUND 1WMS17WMS17 WMS40WMS40 SSVV55 MW0MW022MW9MW9 GROUNDWATER MONITORING WELL
WMS11WMS11 WMS6WMS6 SOIL VAPOUR BORE
WATERLOO MEMBRANE SAMPLERTM - ROUND 2
SVSV22WMS8WMS8SVSVWMS12WMS12 44 WMS7WMS7 MW4MW4MMWW SVSV66 33 MW5MW5WMS3WMS388
WMS3WMS399 MW7MW7 EPA ASSESSMENT AREAWMS10WMS10 WMS9WMS9
SVSV11 CADASTRE
MW3MW3
MW1MW1 WMS3WMS3WMS4WMS4MW2MW266 WMS5WMS5 12500 A3
0 25 50 m
CLIENT
SA EPAWMS1WMS1
WMS2WMS2 PROJECT
EPA THEBARTON ASSESSMENT AREA - STAGE 1
TITLE
FIGURE 2 ASSESSMENT POINT LOCATIONS
PROJECT NO DATE CREATED
80607-1 280917
80607_Fig 2 - Assessment Point Locationsai REV 1 gt 280917
LE
VE
L 1
12
4 S
OU
TH
TE
RR
AC
E
AD
EL
AID
E S
A 5
00
0
PH
(0
8)
82
32
90
88
F
AX
(0
8)
82
32
90
99
E
MA
IL
info
fy
fec
om
au
W
EB
fy
fec
om
au
A
BN
5
7 0
08
116
13
0
JAM
ES CO
NG
DO
N D
RIV
E
JAM
ES CO
NG
DO
N D
RIV
E
DEW
STREET
DEW
STREET
CHAPEL STREETCHAPEL STREET
PAR
KER
STREET
PAR
KER
STREET
POR
T RO
AD
POR
T RO
AD
POR
T RO
AD
POR
T RO
AD
LIGHT TERRACELIGHT TERRACE
DEW
STREET
DEW
STREET
WA
LSH ST
WA
LSH ST
AD
MELLA
STREET
AD
MELLA
STREET
ALB
ERT STR
EETA
LBER
T STREET
HO
LLAN
D ST
REET
HO
LLAN
D ST
REET
RANDOLPH STREET
RANDOLPH STREET
JAM
ES STREET
JAM
ES STREET
DOVE STREET
DOVE STREET
SMITH STREETSMITH STREET
MARIA STREETMARIA STREET
GEORGE STREETGEORGE STREET
KINTORE STREET
KINTORE STREET
PORT ROAD
PORT ROAD
PORT ROAD
PORT ROAD
CAW
THO
RN
E STR
EETC
AWTH
OR
NE ST
REET
DEVON STREETDEVON STREET
KINTORE STREETKINTORE STREET
GOODENOUGH STREETGOODENOUGH STREET
LIVESTR
ON
G PATH
WAY
LIVESTR
ON
G PATH
WAY
WMS2WMS2WMS1WMS1
WMS3WMS3WMS4WMS4
WMS5WMS5
WMS6WMS6
WMS7WMS7WMS8WMS8
WMS9WMS9
WMS10WMS10
WMS11WMS11
WMS12WMS12
WMS13WMS13WMS14WMS14
WMS15WMS15 WMS41WMS41
WMS40WMS40
WMS39WMS39WMS38WMS38
WMS16WMS16
WMS17WMS17
WMS18WMS18WMS19WMS19WMS20WMS20
WMS21WMS21WMS22WMS22
WMS23WMS23WMS24WMS24
WMS25WMS25
WMS26WMS26
WMS27WMS27WMS28WMS28WMS29WMS29
WMS30WMS30
WMS31WMS31
WMS32WMS32WMS33WMS33
WMS34WMS34
WMS35WMS35
WMS36WMS36
WMS37WMS37
WWAA
LLSSHHSSTT
SSMMIITTHH SSTTRREEEETT
RRANDOLPH S
ANDOLPH STREETTREET
PPOORR
TT RROO
AADD
PPOORR
TT RROO
AADD
CCAAWW
TTHHOO
RRNN
EE SSTTRR
EEEETT
JJAM
EA
MES S
S STREET
TREET
HHOO
LLLLAANN
DDSSTT
RREEEETT
DE
DEW
SW
STREET
TREET
DDOOVVEE SSTTRREEEETT
LLIIVVEESSTTRR
OONN
GGPPAATTHH
WWAAYY
LIGHT TERRLIGHT TERRAACECE
AD
MELLA
SA
DM
ELLA STR
EETTR
EET
AALLBB
EERRTT SSTTRR
EEEETT
CHAPEL SCHAPEL STREETTREET
GEGEORORGE SGE STREETTREET
PPOORRTT RROOAADD PPOORRTT RROOAADD
DDEEWW
SSTTRREEEETT MMAARRIIAA SSTTRREEEETT
JJAAMM
EESS CCOO
NNGG
DDOO
NN DD
RRIIVV
EE
KKIINNTTOORREE SSTTRREEEETT
KKIINNTTOORREE SSTTRREEEETT
PPAARR
KKEERR
SSTTRREEEETT
GGOOOODDEENNOOUUGGHH SSTTRREEEETT
DDEEVVOONN SSTTRREEEETT
FIGURE 3 WATERLOO MEMBRANE SAMPLERTM
TCE CONCENTRATION PLAN
WMS3WMS355 TCE lt78
WMS3WMS366 TCE lt77WMS3WMS377
TCE 44
WMS3WMS311 TCE lt78
WMS34WMS34 TCE 11
WMS3WMS322WMS3WMS333 TCE lt78TCE lt79
WMS2WMS277WMS2WMS299 WMS2WMS288 TCE 64 TCE lt77 TCE lt8
WMS3WMS300 TCE lt8
WMS2WMS255
WMS2WMS266 TCE 1400(D)
WMS2WMS222 TCE 38 WMS2WMS211
TCE lt79
TCE lt78
WMS2WMS233 WMS2WMS244 TCE lt77
TCE 230
WMS2WMS200 WMS19WMS19TCE lt78 WMS18WMS18 TCE 11000
TCE 4200
WMS13WMS13 WMS14WMS14 TCE lt79
WMS4WMS411WMS15WMS15 TCE 46000WMS16WMS16 TCE 18000 LEGENDTCE lt8
TCE lt78WMS17WMS17 WATERLOO MEMBRANE SAMPLERTM - ROUND 1WMS40WMS40TCE lt79
TCE 110000 WATERLOO MEMBRANE SAMPLERTM - ROUND 2WMS11WMS11
TCE 71000WMS12WMS12 EPA ASSESSMENT AREA
CADASTRE
WMS6WMS6 TCE lt58 WMS8WMS8 WMS3WMS388 TCE 32WMS7WMS7WMS3WMS399
TCE 12000 TCE 13000 TCE 1900TCE 1300WMS9WMS9 TCE lt58 NotesWMS10WMS10
All concentrations are in μgm3 TCE lt58
D = Duplicate result
WMS3WMS3WMS4WMS4 12500 A3
LE
VE
L 1
12
4 S
OU
TH
TE
RR
AC
E
AD
EL
AID
E S
A 5
00
0
PH
(0
8)
82
32
90
88
F
AX
(0
8)
82
32
90
99
E
MA
IL
info
fy
fec
om
au
W
EB
fy
fec
om
au
A
BN
5
7 0
08
116
13
0
TCE lt57WMS5WMS5 TCE lt57 TCE lt58 0 25 50
m
CLIENT
SA EPA
WMS2WMS2 TCE lt56
WMS1WMS1 TCE lt56
PROJECT
EPA THEBARTON ASSESSMENT AREA - STAGE 1
TITLE
FIGURE 3 WATERLOO MEMBRANE SAMPLERTM
TCE CONCENTRATION PLAN
PROJECT NO DATE CREATED
80607-1 241017
80607_Fig 3 - WMS TCE Concentration Planai REV 1 gt 241017
JAM
ES CO
NG
DO
N D
RIV
E
JAM
ES CO
NG
DO
N D
RIV
E
DEW
STREET
DEW
STREET
CHAPEL STREETCHAPEL STREET
PAR
KER
STREET
PAR
KER
STREET
POR
T RO
AD
POR
T RO
AD
POR
T RO
AD
POR
T RO
AD
LIGHT TERRACELIGHT TERRACE
DEW
STREET
DEW
STREET
WA
LSH ST
WA
LSH ST
AD
MELLA
STREET
AD
MELLA
STREET
ALB
ERT STR
EETA
LBER
T STREET
HO
LLAN
D ST
REET
HO
LLAN
D ST
REET
RANDOLPH STREET
RANDOLPH STREET
JAM
ES STREET
JAM
ES STREET
DOVE STREET
DOVE STREET
SMITH STREETSMITH STREET
MARIA STREETMARIA STREET
GEORGE STREETGEORGE STREET
KINTORE STREET
KINTORE STREET
PORT ROAD
PORT ROAD
PORT ROAD
PORT ROAD
CAW
THO
RN
E STR
EETC
AWTH
OR
NE ST
REET
DEVON STREETDEVON STREET
KINTORE STREETKINTORE STREET
GOODENOUGH STREETGOODENOUGH STREET
LIVESTR
ON
G PATH
WAY
LIVESTR
ON
G PATH
WAY
MW1MW1
MW02MW02
MW3MW3
MW4MW4MW5MW5
MW6MW6
MW7MW7
MW8MW8
MW9MW9
MW10MW10MW11MW11
MW12MW12
MW13MW13
MW14MW14
MW15MW15
MW16MW16
MW17MW17
MW18MW18
MW19MW19MW20MW20
MW21MW21
MW22MW22
MW23MW23
MW24MW24
MW25MW25
MW26MW26
WWAA
LLSSHHSSTT
SSMMIITTHH SSTTRREEEETT
4
466
PPOORR
TT RROO
AADD
PPOORR
TT RROO
AADD
RRANDOLPH S
ANDOLPH STREETTREET 4455
DE
DEW
SW
STREET
TREET
JJAM
EA
MES S
S STREET
TREET
HHOO
LLLLAANN
DD SSTT
RREEEETT
CCAAWW
TTHHOO
RRNN
EE SSTTRR
EEEETT 4477
DDOOVVEE SSTTRREEEETT
4455
4488
LLIIVVEESSTTRR
OONN
GGPPAATTHH
WWAAYY
4455
LIGHT TERRLIGHT TERRAACECE
AD
MELLA
SA
DM
ELLA STR
EETTR
EET
4466
CHAPEL SCHAPEL STREETTREET
4477 AA
LLBBEERR
TT SSTTRREEEETT
4499
GR4466 OUND
FLOW DIREW
GEGEORORGE SGE STREETTREET ATER C
4488 TION
PPOORRTT RROOAADD PPOORRTT RROOAADD 55
00 DD
EEWW SSTTRR
EEEETT 4499
MMAARRIIAA SSTTRREEEETT
4477
5500
JJAAMM
EESS CCOO
NNGG
DDOO
NN DD
RRIIVV
EE
88 44
KKIINNTTOORREE SSTTRREEEETT
KKIINNTTOORREE SSTTRREEEETT
PPAARR
KKEERR
SSTTRREEEETT GGOOOODDEENNOOUUGGHH SSTTRREEEETT
5500
4499
DDEEVVOONN SSTTRREEEETT
FIGURE 4 GROUNDWATER ELEVATION CONTOUR PLAN
Groundwater SWL MMWW88 Monitoring Well (m AHD)
MW1 5011 MW2MW244
MW02 4786
MW3 484
MW2MW255 MW4 507
MW5 4833
MW6 4794
MW7 4703
MW8 4581
MW9 4728
MW10 4871
MW11 4785 MW2MW222
MW12 4689
MW13 4662
MW2MW233 MW14 4723
MW15 464
MW16 4577
MW17 4619
MW18 4538
MW19 4735
MW20 457
MW21 4531
MW22 4501
MW23 4497
MW24 4537
MW25 4469
MW26 4918
MW19MW19 MW2MW200
MW2MW211MW18MW18
MW17MW17
MW14MW14
MW15MW15
MW16MW16
MW10MW10 LEGEND MMWW1111
GROUNDWATER MONITORING WELLMW12MW12
50 INFERRED GROUNDWATER ELEVATION CONTOUR
MW13MW13
MW0MW022 INFERRED GROUNDWATER FLOW DIRECTION
EPA ASSESSMENT AREA
MW9MW9
MW5MW5 CADASTREMMWW66 MW4MW4
MW7MW7 Note This is one interpretation only Other interpretations possibleMW3MW3
12500 A3
0 25 50 m
CLIENT
SA EPA
PROJECT
EPA THEBARTON ASSESSMENT AREA - STAGE 1
TITLE
FIGURE 4 GROUNDWATER ELEVATION CONTOUR PLAN
PROJECT NO DATE CREATED
80607-1 290917
MW1MW1 MW2MW266
80607_Fig 4 - Groundwater Elevation Contour Planai REV 1 gt 290917
LE
VE
L 1
12
4 S
OU
TH
TE
RR
AC
E
AD
EL
AID
E S
A 5
00
0
PH
(0
8)
82
32
90
88
F
AX
(0
8)
82
32
90
99
E
MA
IL
info
fy
fec
om
au
W
EB
fy
fec
om
au
A
BN
5
7 0
08
116
13
0
JAM
ES CO
NG
DO
N D
RIV
E
JAM
ES CO
NG
DO
N D
RIV
E
DEW
STREET
DEW
STREET
CHAPEL STREETCHAPEL STREET
PAR
KER
STREET
PAR
KER
STREET
POR
T RO
AD
POR
T RO
AD
POR
T RO
AD
POR
T RO
AD
LIGHT TERRACELIGHT TERRACE
DEW
STREET
DEW
STREET
WA
LSH ST
WA
LSH ST
AD
MELLA
STREET
AD
MELLA
STREET
ALB
ERT STR
EETA
LBER
T STREET
HO
LLAN
D ST
REET
HO
LLAN
D ST
REET
RANDOLPH STREET
RANDOLPH STREET
JAM
ES STREET
JAM
ES STREET
DOVE STREET
DOVE STREET
SMITH STREETSMITH STREET
MARIA STREETMARIA STREET
GEORGE STREETGEORGE STREET
KINTORE STREET
KINTORE STREET
PORT ROAD
PORT ROAD
PORT ROAD
PORT ROAD
CAW
THO
RN
E STR
EETC
AWTH
OR
NE ST
REET
DEVON STREETDEVON STREET
KINTORE STREETKINTORE STREET
GOODENOUGH STREETGOODENOUGH STREET
LIVESTR
ON
G PATH
WAY
LIVESTR
ON
G PATH
WAY
MW1MW1
MW02MW02
MW3MW3
MW4MW4
MW5MW5
MW6MW6
MW7MW7
MW8MW8
MW9MW9
MW10MW10MW11MW11
MW12MW12
MW13MW13
MW14MW14
MW15MW15
MW16MW16
MW17MW17
MW18MW18
MW19MW19MW20MW20
MW21MW21
MW22MW22
MW23MW23
MW24MW24
MW25MW25
MW26MW26
WWAA
LLSSHHSSTT
SSMMIITTHH SSTTRREEEETT
ndnd
RRANDOLPH S
ANDOLPH STREETTREET
PPOORR
TTRR
OOAA
DD
PPOORR
TTRR
OOAA
DD
JJAM
EA
MES S
S STREET
TREET
HHOO
LLLLAANN
DDSSTT
RREEEETT
CCAAWW
TTHHOO
RRNN
EESSTT
RREEEETT
DE
DEW
SW
STREET
TREET
DDOOVVEE SSTTRREEEETT
LLIIVVEESSTTRR
OONN
GGPPAATTHH
WWAAYY
LIGHT TERRLIGHT TERRAACECE
AD
MELLA
SA
DM
ELLA STR
EETTR
EET
AALLBB
EERRTT SSTTRR
EEEETT
CHAPEL SCHAPEL STREETTREET
ndnd ndnd
100100
11000000
GEGEORORGE SGE STREETTREET
1010000000
PPOORRTT RROOAADD PPOORRTT RROOAADD
DDEEWW
SSTTRREEEETT
1010000000 11000000 MMAARRIIAA SSTTRREEEETT
100100
JJAAMM
EESSCC
OONN
GGDD
OONN
DDRR
IIVVEE
KKIINNTTOORREE SSTTRREEEETT ndnd
KKIINNTTOORREE SSTTRREEEETT
PPAARR
KKEERR
SSTTRREEEETT GGOOOODDEENNOOUUGGHH SSTTRREEEETT
DDEEVVOONN SSTTRREEEETT
FIGURE 5 GROUNDWATER CONCENTRATION PLAN
MW2MW244
MMWW88 TCE lt1
PCE lt1
11-DCE lt1TCE lt1
12-DCE lt1PCE lt1
11-DCE lt1MW2MW255 12-DCE lt1
TCE 2
PCE lt1
11-DCE lt1
12-DCE lt1
MW2MW222 TCE lt1
PCE lt1
11-DCE lt1MW2MW233 12-DCE lt1
TCE 21
PCE lt1
11-DCE lt1
12-DCE lt1
MW19MW19 TCE lt1
MW2MW200 TCE 70 PCE lt1MW2MW211 PCE lt1MW18MW18 11-DCE lt1
TCE 23 11-DCE lt1TCE 5 12-DCE lt1 PCE lt1 12-DCE lt1PCE lt1 11-DCE lt1
11-DCE lt1 12-DCE lt1
12-DCE lt1
MW17MW17 LEGENDTCE 24 MW14MW14
PCE lt1 TCE 1100 lt1 MW15MW15 GROUNDWATER MONITORING WELL11-DCE PCE lt1
12-DCE lt1 TCE 180 11-DCE 2MW16MW16 100 INFERRED TCE GROUNDWATERPCE lt1 12-DCE 4 CONCENTRATION CONTOURSTCE lt1 11-DCE lt1 PCE lt1 12-DCE lt1 11-DCE lt1
12-DCE lt1 MMWW1111
EPA ASSESSMENT AREAMW10MW10
TCE lt1 CADASTREMW12MW12 TCE lt14900 PCE
lt1 11-DCE lt1TCE 700 PCEMW13MW13 12-DCE lt1 TCE CONCENTRATIONS (μgL)lt1 11-DCE 7PCE
TCE lt1 lt1 12-DCE 511-DCE gtnd to lt100 100 to lt1000 1000 to lt10000
MW0MW022PCE lt1 12-DCE lt1 2100011-DCE lt1 MW9MW9 TCE
PCE lt112-DCE lt1 TCE 2(D) 11-DCE 15PCE lt1 MW5MW5
10000 to 29000
nd = non-detect (lt1)12-DCE 4511-DCE lt1 MMWW66 TCE 29000 MW4MW4 12-DCE lt1
PCE 3 TCE lt1 NotesTCE 29 11-DCE 6MW7MW7 PCE lt1PCE lt1 This is one interpretation only Other interpretations possible12-DCE 23TCE lt1 11-DCE lt111-DCE lt1 All concentrations are in μgL
12-DCE includes cis and trans PCE lt1 MW3MW3 12-DCE lt112-DCE lt1 11-DCE lt1
TCE 69 D = Duplicate result12-DCE lt1 PCE lt1
11-DCE lt1
12-DCE lt1 MW1MW1
12500 A3MW2MW266 TCE lt1
TCE 2 PCE lt1
PCE lt1 11-DCE lt1
11-DCE lt1 12-DCE lt1
12-DCE lt1
LE
VE
L 1
12
4 S
OU
TH
TE
RR
AC
E
AD
EL
AID
E S
A 5
00
0
PH
(0
8)
82
32
90
88
F
AX
(0
8)
82
32
90
99
E
MA
IL
info
fy
fec
om
au
W
EB
fy
fec
om
au
A
BN
5
7 0
08
116
13
0
0 25 50 m
CLIENT
SA EPA
PROJECT
EPA THEBARTON ASSESSMENT AREA - STAGE 1
TITLE
FIGURE 5 GROUNDWATER CONCENTRATION PLAN
PROJECT NO DATE CREATED
80607-1 280917
80607_Fig 5 - Groundwater TCE Concentration Plan r2ai REV 2 gt 280917
JAM
ES CO
NG
DO
N D
RIV
E
JAM
ES CO
NG
DO
N D
RIV
E
DEW
STREET
DEW
STREET
CHAPEL STREETCHAPEL STREET
PAR
KER
STREET
PAR
KER
STREET
POR
T RO
AD
POR
T RO
AD
POR
T RO
AD
POR
T RO
AD
LIGHT TERRACELIGHT TERRACE
DEW
STREET
DEW
STREET
WA
LSH ST
WA
LSH ST
AD
MELLA
STREET
AD
MELLA
STREET
ALB
ERT STR
EETA
LBER
T STREET
HO
LLAN
D ST
REET
HO
LLAN
D ST
REET
RANDOLPH STREET
RANDOLPH STREET
JAM
ES STREET
JAM
ES STREET
DOVE STREET
DOVE STREET
SMITH STREETSMITH STREET
MARIA STREETMARIA STREET
GEORGE STREETGEORGE STREET
KINTORE STREET
KINTORE STREET
PORT ROAD
PORT ROAD
PORT ROAD
PORT ROAD
CAW
THO
RN
E STR
EETC
AWTH
OR
NE ST
REET
DEVON STREETDEVON STREET
KINTORE STREETKINTORE STREET
GOODENOUGH STREETGOODENOUGH STREET
LIVESTR
ON
G PATH
WAY
LIVESTR
ON
G PATH
WAY
SV1SV1
SV2SV2SV3SV3SV4SV4
SV5SV5
SV7SV7SV8SV8
SV9SV9
SV10SV10
SV11SV11SV12SV12
SV13SV13
SV6SV6
WWAA
LLSSHHSSTT
SSMMIITTHH SSTTRREEEETT
RRANDOLPH S
ANDOLPH STREETTREET
PPOORR
TTRR
OOAA
DD
PPOORR
TTRR
OOAA
DD
CCAAWW
TTHHOO
RRNN
EESSTT
RREEEETT
HHOO
LLLLAANN
DDSSTT
RREEEETT
JJAM
EA
MES S
S STREET
TREET
DE
DEW
SW
STREET
TREET
DDOOVVEE SSTTRREEEETT
00
LLIIVVEESSTTRR
OONN
GGPPAATTHH
WWAAYY
LIGHT TERRLIGHT TERRAACECE
AD
MELLA
SA
DM
ELLA STR
EETTR
EET
CHAPEL SCHAPEL STREETTREET
00
AALLBB
EERRTT SSTTRR
EEEETT
1010
GEGEORORGE SGE STREETTREET
000000
PPOORRTT RROOAADD
100100000
000
1010
PPOORRTT RROOAADD
000000
DDEEWW
SSTTRREEEETT MMAARRIIAA SSTTRREEEETT
JJAAMM
EESSCC
OONN
GGDD
OONN
DDRR
IIVVEE
KKIINNTTOORREE SSTTRREEEETT 00
KKIINNTTOORREE SSTTRREEEETT
PPAARR
KKEERR
SSTTRREEEETT GGOOOODDEENNOOUUGGHH SSTTRREEEETT
DDEEVVOONN SSTTRREEEETT
FIGURE 6 SOIL VAPOUR CONCENTRATION PLAN (10m)
SSVV1111 SSV12V12 TCE lt18
SSVV1133 TCE 16
PCE lt54 TCE lt21
11-DCE lt29 PCE lt25
12-DCE lt39 11-DCE lt14
12-DCE lt18
PCE lt22
11-DCE lt12
12-DCE lt16
TCE 170
PCE lt54
11-DCE lt3
12-DCE lt39 LEGEND SSVV99
SSV10V10 SOIL VAPOUR BORE
TCE lt21 0 INFERRED TCE SOIL VAPOUR CONTOUR PCE lt25
TCE 2200011-DCE lt14 EPA ASSESSMENT AREA
PCE 1912-DCE lt18
11-DCE lt27 CADASTRE
12-DCE lt37 SVSV66SVSV77
SSVV88 TCE 22000
TCE 2300 PCE 12 SOIL VAPOUR TCE CONCENTRATIONS (μgmsup3)TCE 100000 PCE 62 11-DCE lt29PCE 84 0 to lt10000SSVV55lt2711-DCE 12-DCE lt2911-DCE lt33 10000 to lt100000
100000 to 210000 12-DCE lt36 12-DCE lt44
TCE 17000 SVSV44 SVSV22SVSV33 NotePCE 31 TCE 51000TCE 210000 This is one interpretation only Other interpretations possible11-DCE lt14 PCE 39PCE 650012-DCE lt18 39 Estimated extent of plume has utilised groundwater11-DCE11-DCE 5900 12-DCE 21 concentration data12-DCE lt71
SVSV11 All concentrations are in (μgmsup3)
TCE 6300(LD) 12-DCE includes cis and trans PCE 78 LD = Laboratory duplicate result 11-DCE lt29
12-DCE lt38
12500 A3
0 25 50 m
CLIENT
SA EPA
PROJECT
EPA THEBARTON ASSESSMENT AREA - STAGE 1
TITLE
FIGURE 6 SOIL VAPOUR CONCENTRATION PLAN (10m)
PROJECT NO DATE CREATED
80607-1 290917
80607_Fig 6 - Soil Vapour TCE Concentration Plan - 1mai REV 2 gt 290917
LE
VE
L 1
12
4 S
OU
TH
TE
RR
AC
E
AD
EL
AID
E S
A 5
00
0
PH
(0
8)
82
32
90
88
F
AX
(0
8)
82
32
90
99
E
MA
IL
info
fy
fec
om
au
W
EB
fy
fec
om
au
A
BN
5
7 0
08
116
13
0
JAM
ES CO
NG
DO
N D
RIV
E
JAM
ES CO
NG
DO
N D
RIV
E
DEW
STREET
DEW
STREET
CHAPEL STREETCHAPEL STREET
PAR
KER
STREET
PAR
KER
STREET
POR
T RO
AD
POR
T RO
AD
POR
T RO
AD
POR
T RO
AD
LIGHT TERRACELIGHT TERRACE
DEW
STREET
DEW
STREET
WA
LSH ST
WA
LSH ST
AD
MELLA
STREET
AD
MELLA
STREET
ALB
ERT STR
EETA
LBER
T STREET
HO
LLAN
D ST
REET
HO
LLAN
D ST
REET
RANDOLPH STREET
RANDOLPH STREET
JAM
ES STREET
JAM
ES STREET
DOVE STREET
DOVE STREET
SMITH STREETSMITH STREET
MARIA STREETMARIA STREET
GEORGE STREETGEORGE STREET
KINTORE STREET
KINTORE STREET
PORT ROAD
PORT ROAD
PORT ROAD
PORT ROAD
CAW
THO
RN
E STR
EETC
AWTH
OR
NE ST
REET
DEVON STREETDEVON STREET
KINTORE STREETKINTORE STREET
GOODENOUGH STREETGOODENOUGH STREET
LIVESTR
ON
G PATH
WAY
LIVESTR
ON
G PATH
WAY
SV1SV1
SV2SV2SV3SV3SV4SV4
SV5SV5
SV7SV7SV8SV8
SV9SV9
SV10SV10
SV12SV12
SV6SV6
WWAA
LLSSHHSSTT
SSMMIITTHH SSTTRREEEETT
RRANDOLPH S
ANDOLPH STREETTREET
PPOORR
TTRR
OOAA
DD
PPOORR
TTRR
OOAA
DD
CCAAWW
TTHHOO
RRNN
EESSTT
RREEEETT
HHOO
LLLLAANN
DDSSTT
RREEEETT
DE
DEW
SW
STREET
TREET
JJAM
EA
MES S
S STREET
TREET
DDOOVVEE SSTTRREEEETT
00
LIGHT TERRLIGHT TERRAACECE
LLIIVVEESSTTRR
OONN
GGPPAATTHH
WWAAYY
AD
MELLA
SA
DM
ELLA STR
EETTR
EET
CHAPEL SCHAPEL STREETTREET
00
1010000000
AALLBB
EERRTT SSTTRR
EEEETT
100100 000
000 GEGEORORGE SGE STREETTREET
PPOORRTT RROOAADD 11000000000
000 PPOORRTT RROOAADD
DDEEWW
SSTTRREEEETT MMAARRIIAA SSTTRREEEETT
100100000000
JJAAMM
EESSCC
OONN
GGDD
OONN
DDRR
IIVVEE
1010000000
KKIINNTTOORREE SSTTRREEEETT
00
KKIINNTTOORREE SSTTRREEEETT
PPAARR
KKEERR
SSTTRREEEETT GGOOOODDEENNOOUUGGHH SSTTRREEEETT
DDEEVVOONN SSTTRREEEETT
FIGURE 7 SOIL VAPOUR CONCENTRATION PLAN (30m)
SSV12V12 TCE 55
PCE lt45
11-DCE lt24
12-DCE lt32
TCE 260
PCE lt51
11-DCE lt28
12-DCE
SSVV99
lt37 LEGEND
SSV10V10 SOIL VAPOUR BORE
TCE 51 0 INFERRED TCE SOIL VAPOUR CONTOURPCE lt53
TCE 11000011-DCE lt29
EPA ASSESSMENT AREAPCE lt13012-DCE lt39
11-DCE lt69
CADASTRE12-DCE lt92 SVSV66SVSV77
SSVV88 TCE 150000
TCE 14000 56 SOIL VAPOUR TCE CONCENTRATIONS (μgmsup3)PCETCE 160000 PCE 19 11-DCE lt30PCE 310 0 to lt10000SSVV5511-DCE lt26 12-DCE lt3911-DCE 33 10000 to lt100000
100000 to lt1000000 1000000
12-DCE lt35 12-DCE 20
TCE 43000 SVSV44 SVSV22SVSV33 NotePCE 90 TCE 940000(FD)TCE 1000000 This is one interpretation only Other interpretations possible11-DCE lt15 PCE 15000PCE 1500012-DCE 30 14000 Estimated extent of plume has utilised groundwater11-DCE11-DCE 14000 12-DCE lt930 concentration data12-DCE lt930
All concentrations are in (μgmsup3) 12-DCE includes cis and trans
SVSV11 TCE 21000
FD = Field Duplicate resultPCE 21
11-DCE lt57
12-DCE lt76
12500 A3
0 25 50 m
CLIENT
SA EPA
PROJECT
EPA THEBARTON ASSESSMENT AREA - STAGE 1
TITLE
FIGURE 7 SOIL VAPOUR CONCENTRATION PLAN (30m)
PROJECT NO DATE CREATED
80607-1 290917
80607_Fig 7 - Soil Vapour TCE Concentration Plan - 3m r2ai REV 2 gt 290917
LE
VE
L 1
12
4 S
OU
TH
TE
RR
AC
E
AD
EL
AID
E S
A 5
00
0
PH
(0
8)
82
32
90
88
F
AX
(0
8)
82
32
90
99
E
MA
IL
info
fy
fec
om
au
W
EB
fy
fec
om
au
A
BN
5
7 0
08
116
13
0
- THEBARTON ASSESSMENT AREA STAGE 1 ENVIRONMENTAL ASSESSMENT FINAL REPORT | EPA REF 0524111 30 OCTOBER 2017 VOLUME 1 REPORT13
- This report is formatted to print Double Sided
- TITLE PAGE13
- CONTENTS13
- LIST OF ACRONYMS13
- EXECUTIVE SUMMARY13
- 1 INTRODUCTION
-
- 11 Purpose
- 12 General background information
- 13 Definition of the assessment area
- 14 Identification of contaminants of potential concern
- 15 Objectives
-
- 2 CHARACTERISATION OF THE ASSESSMENT AREA
-
- 21 Site identification
- 22 Regional geology and hydrogeology
- 23 Data quality objectives
-
- 3 SCOPE OF WORK
-
- 31 Preliminary work
- 32 Field investigation and laboratory analysis program
- 33 Data interpretation
-
- 4 METHODOLOGY
-
- 41 Field methodologies
- 42 Laboratory analysis
-
- 5 QUALITY ASSURANCE AND QUALITY CONTROL
-
- 51 Field QAQC
- 52 Laboratory QAQC
- 53 QAQC summary
-
- 6 ASSESSMENT CRITERIA
-
- 61 Groundwater
- 62 Soil vapour
-
- 7 RESULTS
-
- 71 Surface and sub surface soil conditions
- 72 Waterloo Membrane Samplerstrade
- 73 Groundwater
- 74 Soil vapour bores
-
- 8 GROUNDWATER FATE AND TRANSPORT MODELLING
-
- 81 Groundwater flow modelling
- 82 Solute transport modelling
-
- 9 VAPOUR INTRUSION RISK ASSESSMENT
-
- 91 Objective
- 92 Areas of interest
- 93 Risk assessment approach
- 94 Tier 1 assessment
- 95 Tier 2 assessment
- 96 Conclusions
-
- 10 CONCEPTUAL SITE MODEL
- 11 CONCLUSIONS
- 12 DATA GAPS
- 13 REFERENCES
- 14 STATEMENT OF LIMITATIONS
- FIGURES13
- FIGURE 1 SITE LOCATION AND ASSESSMENT AREA
- FIGURE 2 ASSESSMENT POINT LOCATIONS
- FIGURE 3 WATERLOO MEMBRANE SAMPLERTM TCE CONCENTRATION PLAN13
- FIGURE 4 GROUNDWATER ELEVATION CONTOUR PLAN
- FIGURE 5 GROUNDWATER CONCENTRATION PLAN
- FIGURE 6 SOIL VAPOUR CONCENTRATION PLAN (10m)
- FIGURE 7 SOIL VAPOUR CONCENTRATION PLAN (30m)
-

THEBARTON ASSESSMENT AREA
STAGE 1 ENVIRONMENTAL ASSESSMENT
FINAL REPORT
EPA REF 0524111
PREPARED FOR Environment Protection Authority South Australia
PREPARED BY Fyfe Pty Ltd
ABN 57 008 116 130
ADDRESS L1 124 South Terrace Adelaide SA 5000
CONTACT Mr Marc Andrews Division Manager - Environment
TELEPHONE direct 08 8201 9794 mobile 0408 805 264
FACSIMILE 61 8 8201 9650
EMAIL marcandrewsfyfecomau
DATE 30102017
REFERENCE 80607-1 REV1
copyFyfe Pty Ltd 2017
Proprietary Information Statement
The information contained in this document produced by Fyfe Pty Ltd is solely for the use of the Client identified on the cover sheet for the purpose for which it has been prepared and Fyfe Pty Ltd undertakes no duty to or accepts any responsibility to any third party who may rely upon this document
All rights reserved No section or element of this document may be removed from this document reproduced electronically stored or transmitted in any form without the written permission of Fyfe Pty Ltd
Document Information
Report prepared by Dr Ruth Keogh Principal Environmental Scientist Fyfe Pty Ltd Date 27 October 2017
Report reviewed and approved by Division Manager - Environment Fyfe Pty Ltd Date 30 October 2017 Marc Andrews
Client receipt by Shannon Thompson Advisor Site Contamination SA EPA Date 30 October 2017
Revision History
Revision Revision Status Date of Issue Prepared Reviewed Approved
REV 0 Draft 6 October 2017 RK MJA MJA
REV 1 Final 30 October 2017 RK MJA MJA
Please note that when viewed electronically this document may contain pages that have been intentionally left blank These blank pages may occur because in consideration of the environment and for your convenience this document has been set up so that it can be printed correctly in double-sided format
EPA REF 0524111 FINAL REPORT STAGE 1 ENVIRONMENTAL ASSESSMENT THEBARTON ASSESSMENT AREA
CONTENTS
Page
VOLUME 1 REPORT
LIST OF ACRONYMS V
EXECUTIVE SUMMARY VIII
1 INTRODUCTION 1
11 Purpose 1
12 General background information 1
13 Definition of the assessment area 2
14 Identification of contaminants of potential concern 2
15 Objectives 3
2 CHARACTERISATION OF THE ASSESSMENT AREA 5
21 Site identification 5
22 Regional geology and hydrogeology 5
23 Data quality objectives 7
3 SCOPE OF WORK 11
31 Preliminary work 12
32 Field investigation and laboratory analysis program 12
33 Data interpretation 14
4 METHODOLOGY 15
41 Field methodologies 15
42 Laboratory analysis 19
5 QUALITY ASSURANCE AND QUALITY CONTROL 21
51 Field QAQC 21
52 Laboratory QAQC 24
53 QAQC summary 26
80607-1 REV1 30102017 PAGE I
EPA REF 0524111 FINAL REPORT STAGE 1 ENVIRONMENTAL ASSESSMENT THEBARTON ASSESSMENT AREA
6 ASSESSMENT CRITERIA 27
61 Groundwater 27
62 Soil vapour 29
7 RESULTS 31
71 Surface and sub surface soil conditions 31
72 Waterloo Membrane Samplerstrade 32
73 Groundwater 34
74 Soil vapour bores 40
8 GROUNDWATER FATE AND TRANSPORT MODELLING 43
81 Groundwater flow modelling 43
82 Solute transport modelling 43
9 VAPOUR INTRUSION RISK ASSESSMENT 47
91 Objective 47
92 Areas of interest 47
93 Risk assessment approach 47
94 Tier 1 assessment 48
95 Tier 2 assessment 49
96 Conclusions 59
10 CONCEPTUAL SITE MODEL 61
11 CONCLUSIONS 67
12 DATA GAPS 71
13 REFERENCES 73
14 STATEMENT OF LIMITATIONS 77
PAGE II 80607-1 REV1 30102017
EPA REF 0524111 FINAL REPORT STAGE 1 ENVIRONMENTAL ASSESSMENT THEBARTON ASSESSMENT AREA
LIST OF TABLES
Table 21 Information regarding registered groundwater bores located within the Thebarton EPA Assessment Area 7
Table 22 Data Quality Objectives 8 Table 31 Scope of field investigation program ndash May to August 2017 12 Table 32 Scope of laboratory testing program 13 Table 41 Summary of field methodologies 15 Table 51 Field QAQC procedures ndash Groundwater 22 Table 52 Field QAQC procedures ndash Soil vapour 23 Table 53 Laboratory QAQC procedures 25 Table 61 Assessment of groundwater beneficial uses for Thebarton EPA Assessment Area 28 Table 62 Sources of adopted groundwater assessment criteria 29 Table 71 Detectable Waterloo Membrane Samplertrade CHC results 32 Table 72 Comparison of CHC data for Round 1 and 2 WMStrade units 33 Table 73 Hydraulic conductivities (rising and falling head tests) 35 Table 74 Detectable groundwater CHC results 37 Table 75 Detectable soil vapour bore CHC results for Thebarton EPA Assessment Area 41 Table 76 Comparison of CHC data for Round 2 WMStrade units and closest soil vapour bores 42 Table 91 Tier 1 assessment ndash ASC NEPM (1999) and modified residential soil vapour HILs 49 Table 92 Tier 2 vapour intrusion modelling ndash building input parameters 51 Table 93 Tier 2 vapour intrusion modelling ndash soil input parameters 52 Table 94 Adopted attenuation factors for TCE in soil vapour to indoor air 52 Table 95 Summary of chemical parameters adopted for vapour intrusion modelling 52 Table 96 Comparison of predicted residential indoor air concentrations with SA EPA
response levels 54 Table 97 Summary of model input parameters subjected to sensitivity analysis 55 Table 98 Exposure parameters ndash Commercialindustrial workers 58 Table 99 Adopted inhalation toxicity reference values 58 Table 910 Summary of properties with predicted indoor air concentrations
(residential crawl space) above adopted EPA response levels 59 Table 101 Summary of existing information for the Thebarton EPA Assessment Area 61
LIST OF FIGURES (in text)
Figure 71 Piper diagram 39 Figure 81 Predictive TCE (1 microgL) plume extent after 100 years (ie shown in green)
relative to the boundary of the Thebarton EPA Assessment Area (red) and the extent of the modelling area (purple) 46
Figure 91 TCE indoor air screening criteria and the corresponding site-specific response levels 50
80607-1 REV1 30102017 PAGE III
EPA REF 0524111 FINAL REPORT STAGE 1 ENVIRONMENTAL ASSESSMENT THEBARTON ASSESSMENT AREA
FIGURES follow page 79
Figure 1 Site Location and Assessment Area Figure 2 Assessment Point Locations Figure 3 Waterloo Membrane Samplertrade TCE Concentration Plan Figure 4 Groundwater Elevation Contour Plan Figure 5 Groundwater Concentration Plan Figure 6 Soil Vapour Concentration Plan (10 m) Figure 7 Soil Vapour Concentration Plan (30 m)
VOLUME 2 APPENDICES
APPENDICES
Appendix A Historical Report Summary Appendix B Historical Information Supplied by the EPA Appendix C DEWNR Registered Groundwater Database Search Results Appendix D Groundwater Well Permits Appendix E Field Sampling Sheets ndash Groundwater Appendix F Survey Data Appendix G Certified Laboratory Certificates and Chain of Custody Documentation Appendix H Groundwater Well Log Reports Appendix I WMStrade Borehole Log Reports Appendix J Soil Vapour Borehole Log Reports Appendix K Waste Transport Certificates Appendix L Tabulated Results ndash Soil Vapour Geotechnical and Groundwater Appendix M Equipment Calibration Records Appendix N Drill Core Photographs Appendix O Arcadis Groundwater Fate and Transport Modelling Report Appendix P Arcadis Vapour Intrusion Risk Assessment Report
PAGE IV 80607-1 REV1 30102017
EPA REF 0524111 FINAL REPORT STAGE 1 ENVIRONMENTAL ASSESSMENT THEBARTON ASSESSMENT AREA
LIST OF ACRONYMS
AER Air Exchange Rate
AF Attenuation Factor
AHD Australian Height Datum
ANZECC Australian and New Zealand Environment and Conservation Council
ARMCANZ Agriculture and Resource Management Council of Australia and New Zealand
ASC Assessment of Site Contamination
ASTM American Standard Testing Material
AT Averaging Time
ATSDR Agency for Toxic Substances and Disease Registry
AWQC Australian Water Quality Centre
BGL Below Ground Level
BTEX Benzene Toluene Ethylbenzene Xylenes
BTOC Below Top of Casing
BUA Beneficial Use Assessment
CBD Central Business District
CHC Chlorinated Hydrocarbon Compound
COC Chain of Custody
COPC Contaminants of Potential Concern
CRC CARE Cooperative Research Centre for Contamination Assessment and Remediation of the Environment
CSM Conceptual Site Model
11-DCA 11-dichloroethane
11-DCE 11-dichloroethene
12-DCE 12-dichloroethene
DCE Dichloroethene
DEC Department of Environment and Conservation
DEWNR Department of Environment Water and Natural Resources
DNAPL Dense Non-Aqueous Phase Liquid
DO Dissolved Oxygen
DQI Data Quality Indicator
DQO Data Quality Objective
EC Electrical Conductivity
ED Exposure Duration
80607-1 REV1 30102017 PAGE V
EPA REF 0524111 FINAL REPORT STAGE 1 ENVIRONMENTAL ASSESSMENT THEBARTON ASSESSMENT AREA
EF Exposure Frequency
EMP Environmental Management Plan
EPA Environment Protection Authority
EPC Exposure Point Concentration
EPP Environment Protection Policy
ET Exposure Time
GPA Groundwater Prohibition Area
GPR Ground Penetrating Radar
GPS Global Positioning System
HHRA Human Health Risk Assessment
HIL Health Investigation Level
HSP Health and safety Plan
IPA Isopropyl Alcohol (isopropanol or 2-propanol)
IRIS Integrated Risk Information System
ITRC Interstate Technology and Regulatory Council
JampE Johnson and Ettinger
JHA Job Hazard Analysis
LNAPL Light Non-Aqueous Phase Liquid
LOR Limit of Reporting
MGA Map Grid of Australia
MQO Measuring Quality Objectives
MTC Mass Transfer Co-efficient
NA Not Applicable
NAPL Non-Aqueous Phase Liquid
NATA National Association of Testing Authorities
ND Non Detect
NEPM National Environment Protection Measure
NHMRC National Health and Medical Research Council
NJDEP New Jersey Department of Environmental Protection
NRMMC National Resource Management Ministerial Council
PAH Polycyclic Aromatic Hydrocarbons
PCE Tetrachloroethene (perchloroethylene)
PID Photoionisation Detector
PQL Practical Quantification Limit
PSD Particle Size Distribution
QA Quality Assurance
80607-1 REV1 30102017 PAGE VI
EPA REF 0524111 FINAL REPORT STAGE 1 ENVIRONMENTAL ASSESSMENT THEBARTON ASSESSMENT AREA
QC Quality Control
RAIS Risk Assessment Information System
RFQ Request for Quote
REM Resource and Environmental Management
RPD Relative Percentage Difference
RSL Regional Screening Level
SA EPA South Australian Environment Protection Authority
SAQP Sampling and Analysis Quality Plan
SOP Standard Operating Procedure
SVOC Semi-Volatile Organic Compound
SWL Standing Water Level
SWMS Safe Work Method Statement
111-TCA 111-trichloroethane
TCE Trichloroethene
TDS Total Dissolved Solids
TRH Total Recoverable Hydrocarbons1
TRV Toxicity Reference Value
US EPA United Stated Environment Protection Agency
USGS United States Geological Survey
VC Vinyl Chloride
VIRA Vapour Intrusion Risk Assessment
VOC Volatile Organic Compound
VOCC Volatile Organic Chlorinated Compound
WHO World Health Organisation
WMStrade Waterloo Membrane Samplertrade
TRH = measurable amount of petroleum-based hydrocarbon (ie complex mixture of crude oil and natural gas (gt 250 compounds) including aromatics aliphatics paraffins unsaturated alkanes and naphthalenes) plus various other compounds including fatty acids esters humic acids phthalates and sterols
80607-1 REV1 30102017 PAGE VII
1
EPA REF 0524111 FINAL REPORT STAGE 1 ENVIRONMENTAL ASSESSMENT THEBARTON ASSESSMENT AREA
EXECUTIVE SUMMARY
Background information
An approximate 27 hectare mixed use area of Thebarton has been designated by the South Australian Environment Protection Authority (EPA) as the Thebarton EPA Assessment Area
The former Austral sheet metal works (Austral) property located over multiple allotments between George and Maria Streets from the 1920s until the 1960s-1970s has been identified as a possible source of dissolved phase groundwater chlorinated hydrocarbon (CHC) contamination Groundwater CHC impacts within the uppermost (Quaternary ndash Q1) aquifer were identified as extending in a general north-westerly direction (consistent with regional groundwater flow direction) from the south-eastern portion of the Thebarton EPA Assessment Area and having resulted in the generation of soil vapour containing elevated concentrations of CHC
The boundaries of the Thebarton EPA Assessment Area were established on the basis of the following
the previous identification of groundwater CHC contamination associated with properties located at 31-37 George Street (part of the former Austral property) and 39 Smith Street (hydraulically down-gradient of the former Austral property) in Thebarton
the fact that although the George Street property (andor the broader Austral facility of which it formed a part) was suspected to be located in the vicinity of the source the specific source site had not yet been confirmed and
the identification of an inferred (general) north-westerly groundwater flow direction within the Q1 aquifer
Key objectives
The results of the recent investigations undertaken by Fyfe have been used to assess potential vapour intrusion to indoor air risks within residential and commercialindustrial properties within the Thebarton EPA Assessment Area
The key objectives detailed by the EPA were to
further delineate the chlorinated hydrocarbon contamination in groundwater
further delineate the chlorinated hydrocarbon contamination in soil vapour initially using Waterloo Membrane Samplers (WMStrade) and
undertake a Human Health Risk Assessment Vapour Intrusion Risk Assessment (HHRAVIRA) based on the data collected
80607-1 REV1 30102017 PAGE VIII
EPA REF 0524111 FINAL REPORT STAGE 1 ENVIRONMENTAL ASSESSMENT THEBARTON ASSESSMENT AREA
With respect to the VIRA the EPA requested that there be specific consideration of
residential properties (slab on grade)
residential properties (crawl space)
residential properties (with basement) and
trenchmaintenanceutility workers that may be working in the vicinity of the contamination
Site conditions
Subsurface geological conditions are generally consistent across the Thebarton EPA Assessment Area and are dominated by the sediments (ie low to medium plasticity silty or sandy clays with variable gravel contents) of the Pooraka and Hindmarsh Clay formations While there is some potential for structural defects and coarser horizons to act as preferential pathways (lateral and vertical) for soil vapour movement no significant spatially-consistent features were identified during the recent soil drillinglogging work ndash although thin gravel lenses were identified within the subsurface at some locations and a 15 m thick layer of gravel was encountered at 12 to 135 m below ground level (BGL) during the drilling of groundwater well MW17 the latter consistent with the depth of groundwater within the Q1 aquifer
Soil
Groundwater within the Q1 aquifer is located at a depth of approximately 123 to Groundwater 159 m BGL and flows in a general north-westerly direction The closest surface water receptor is the River Torrens located approximately 03 km to the east and 07 km to the north and north-west A groundwater flow velocity range of approximately 44 to 23 myear has been inferred and the groundwater gradient is relatively flat (ie 000062 to 00012)
Beneficial uses for groundwater within the Q1 aquifer beneath the Thebarton EPA Assessment Area have been identified (based on factors such a groundwater salinity registered bore use and the locations of potential sensitive receptors) as including domestic irrigation primary contact recreationaesthetics human health in non-use scenarios (ie vapour flux) and possibly also potable
Contaminants of Potential Concern (COPC)
The contaminants of potential concern (COPC) for the Thebarton EPA Assessment Area comprise a number of CHC The main COPC has been identified as trichloroethene (TCE) a solvent historically used for metal cleaningdegreasing activities in various manufacturing industries Additional COPC identified for the assessment area include the breakdown products of TCE namely 12-dichloroethene (12-DCE cis- and trans-) and vinyl chloride (VC) as well as other solvents such as tetrachloroethene (PCE) and 11-dichloroethene (11-DCE)
80607-1 REV1 30102017 PAGE IX
EPA REF 0524111 FINAL REPORT STAGE 1 ENVIRONMENTAL ASSESSMENT THEBARTON ASSESSMENT AREA
Scope of work
A groundwater and soil vapour monitoring program was undertaken by Fyfe across the Thebarton EPA Assessment Area between May and August 2017 It involved the following scope of work
installation of a total of 41 WMStrade units to 1 m BGL in an approximate grid-pattern across the entire assessment area (Round 1) and at specific targeted locations (Round 2) followed by laboratory analysis of retrieved sample units for specific CHC
drilling and installation of 25 groundwater wells to depths of between 15 and 19 m BGL including a background well to the east of the southern portion of the assessment area
testing of 30 selected groundwater well drill core samples for geotechnical parameters
gauging and sampling of the 25 newly installed groundwater wells as well as an existing well located in Admella Street followed by laboratory analysis of all samples for specific CHC and 10 selected samples for major cationsanions natural attenuation parameters and additional nutrients
aquifer permeability (rising and falling head ldquoslugrdquo) testing of 10 groundwater wells
drilling and installation of 13 soil vapour bores including 11 nested bores (ie to 1 and 3 m BGL) and two bores to 1 m BGL and
sampling of all soil vapour bores followed by laboratory analysis of samples for specific CHC and general gases
The soil vapour data were used to undertake a VIRA aimed at predicting indoor air concentrations of TCE under various land use and building construction scenarios In order to validate the results of the modelling which includes a number of conservative assumptions and is therefore expected to over-estimate potential risk the EPA has commissioned indoor air monitoring in a number of residential properties within the Thebarton EPA Assessment Area ndash the indoor air monitoring results will be reported under separate cover
Groundwater fate and transport modelling was undertaken to provide a preliminary estimate of the future extent of CHC impacted groundwater within the Thebarton EPA Assessment Area The provision of this information is aimed at supporting the definition (extent and geometry) of a potential future Groundwater Prohibition Area (GPA) to be designated by the EPA in accordance with the provisions of Section S103S of the Environment Protection Act 1993
80607-1 REV1 30102017 PAGE X
EPA REF 0524111 FINAL REPORT STAGE 1 ENVIRONMENTAL ASSESSMENT THEBARTON ASSESSMENT AREA
Identified impacts
Contaminants identified in the Q1 aquifer beneath the Thebarton EPA Assessment Area include TCE PCE 12-DCE (cis- and trans-) and 11-DCE Although TCE PCE and 11-DCE are all considered to represent primary contaminants TCE is considered to be the main COPC (ie with the highest concentrations and greatest distribution) By comparison cis- and trans-12-DCE which are considered to represent break-down
Groundwater
(ie daughter) products of TCE andor PCE occur at relatively minor concentrations at scattered locations and were not considered indicative of significant TCE breakdown (ie via dechlorination) Although VC represents another (expected) daughter product of TCE it was not detected in any of the groundwater wells tested
The groundwater TCE plume is considered to have migrated in a north-westerly direction from the suspected (Austral) source site in accordance with the predominant flow direction associated with the Q1 aquifer The plume has been traced as far west and north as Dew Street and Smith Street respectively within the Thebarton EPA Assessment Area (ie the extent of the monitoring well network installed by Fyfe) ndash whereas its north-western extent has not yet been determined the groundwater CHC plume has been delineated in all other directions
Contaminants identified in soil vapour beneath the Thebarton EPA Assessment Area include TCE PCE 12-DCE (cis- and trans-) and 11-DCE The distribution of TCE in soil vapour at 1 and 3 m BGL generally correlates with the north-westerly groundwater flow direction and is therefore considered to be a product of volatilisation from the groundwater CHC plume ndash the consistent decrease in soil vapour concentrations with decreasing depth also supports this conclusion
Soil vapour
The soil vapour samples with the maximum TCE concentrations also had the highest PCE and 11-DCE concentrations (or elevated laboratory limits of reporting (LOR)) thereby suggesting that they could represent co-contaminants (ie from a similar source areaactivity) These samples also had elevated LOR for 12-DCE (cis- and trans-)
Although VC was not detected in any of the soil vapour samples the laboratory LOR for VC in most of the samples with the highest concentrations of TCE exceeded the adopted health investigation levels (HILs) for residential andor commercialindustrial land use Although the absence of VC in soil vapour cannot therefore be confirmed its absence at detectable levels in groundwater suggests that (limited) TCE degradation has not yet resulted in its production
Although the extent of the soil vapour TCE plume has not yet been determined (ie in any direction) it is expected to have a similar extent to that of the identified groundwater plume (ie as the groundwater CHC impacts represent the source of the measured soil vapour CHC concentrations)
80607-1 REV1 30102017 PAGE XI
EPA REF 0524111 FINAL REPORT STAGE 1 ENVIRONMENTAL ASSESSMENT THEBARTON ASSESSMENT AREA
Assessment of risk
Measured concentrations of TCE exceeded the adopted assessment criteria for potable use andor primary contact recreation in wells located on Admella Maria George Albert Chapel and Dew Streets as well as Light Terrace ndash with the highest concentrations corresponding to the ldquocorerdquo area of the plume One well on Albert Street also contained a concentration of carbon tetrachloride that exceeded the respective potable criterion
Groundwater risks
Although groundwater vapour flux has mainly been addressed by the VIRA it could also occur during the extraction of groundwater for domestic use and in terms of aesthetic considerations the CHC impacted groundwater could be odorous
Additional parameters measured for the purpose of establishing general aquifer conditions (including whether conditions may be amenable to the breakdown of CHC) have also been reported ndash no clear secondary lines of evidence for the occurrence of natural attenuation have been identified
The groundwater modelling undertaken by Arcadis involved the development of an Groundwater fate and transport initial groundwater flow model using MODFLOW followed by the development of a modelling site-specific (three-dimensional) solute transport model using the MT3DMS transport
code
The results of this modelling were interpreted to indicate the following
although scattered detectable concentrations of 12-DCE have been measured in groundwater across the Thebarton EPA Assessment Area the absence of significant and ubiquitous TCE daughter products indicate that substantial dechlorination is not occurring and
the dissolved phase groundwater TCE plume is predicted to extend by another 500 m (ie beyond the boundaries of the current Thebarton EPA Assessment Area) over the next 100 years whereas no significant lateral plume expansion is expected
The VIRA undertaken by Arcadis involved a two-tier assessment approach Whereas Vapour intrusion the Tier 1 screening risk assessment compared the measured soil vapour CHC concentrations to (modified) guideline values the Tier 2 risk assessment involved the application of the Johnson and Ettinger vapour intrusion model to predict indoor air CHC concentrations for residential (slab on grade crawl space and basement construction) and commercialindustrial (slab on grade construction) properties across the assessment area Site-specific geotechnical parameters and soil vapour data collected from 1 and 3 m BGL throughout the Thebarton EPA Assessment Area were used in the modelling It should be noted that overall the vapour modelling
risks
80607-1 REV1 30102017 PAGE XII
EPA REF 0524111 FINAL REPORT STAGE 1 ENVIRONMENTAL ASSESSMENT THEBARTON ASSESSMENT AREA
undertaken is expected to provide an over-estimation of the actual vapour exposure concentrations
The results of the VIRA with respect to the predicted indoor air concentrations of TCE within residential properties (assuming crawl space construction) versus adopted EPA response levels indicated that 21 (ie of approximately 130 residential properties) were predicted to have detectable levels of TCE in indoor air that require further action as follows
10 properties within the investigation range (2 to lt20 microgm3)
eight properties within the intervention range (20 to lt200 microgm3) and
three properties within accelerated intervention range (ge200 microgm3)
All remaining residential properties in the Thebarton EPA Assessment Area are considered to be safe from soil vapour intrusion with predicted indoor air concentrations of TCE below 2 microgm3 (assuming crawl space construction) Based on the results of the VIRA however substantially increased risks are likely to exist should cellarsbasements be present whereas risks may be lower for slab on grade construction premises
Where permission has been granted by the ownersoccupiers indoor air monitoring of properties within the 20 to lt200 microgm3 and ge200 microgm3 response level ranges as well as selected adjoining properties has been commissioned by the EPA to validate the results of the VIRA modelling (ie which is expected to be overly-conservative) ndash these results will be documented in a subsequent report
Calculated vapour intrusion risks to workers within commercialindustrial properties (slab on grade construction) across at least part of the Thebarton EPA Assessment Area (ie as determined for the maximum soil vapour CHC concentrations in soil vapour bore SV3 located on Maria Street) are considered to be unacceptable Although a basementcellar is known to be present at one commercial property on George Street vapour intrusion risks to subsurface structures associated with commercialindustrial properties have not yet been assessed
A qualitative assessment of potential risks to subsurface trenchmaintenanceutility workers indicated that exposure management may be required in areas where TCE concentrations at 1 m BGL are above 100 microgm3 (ie corresponding to 50 times the acceptable concentration for indoor air) Exposure management should involve the development of a site-specific health and safety plan (prior to the commencement of work in the affected area) that details measures such as restricting personnel exposure times monitoring volatile compounds using a photoionisation detector (PID) unit providing increased ventilation and using appropriate personal protective equipment (eg gas masks) as required
80607-1 REV1 30102017 PAGE XIII
EPA REF 0524111 FINAL REPORT STAGE 1 ENVIRONMENTAL ASSESSMENT THEBARTON ASSESSMENT AREA
Data gaps
Based on the results obtained during the recent Fyfe investigations as well as available historical information the following data gaps have been identified for the Thebarton EPA Assessment Area
property information assumed for the vapour intrusion modelling has not been confirmed (ie current land use (residential versus commercial) building construction type (slab crawl space presence of basements and cellars including cellarsbasements for commercial properties)
groundwater uses considered for the beneficial use assessment have not been confirmed (whether bores are registered or not)
the conclusions are based on a single sampling event meaning the understanding of temporal and spatial variation is limited for both groundwater and soil vapour and
the groundwater contamination has not been fully delineated in the hydraulically down-gradient direction (north-west) and hence the groundwater fate and transport modelling is not validated
Notes ie the interim soil vapour HILs adopted from the National Environment (Assessment of Site Contamination) Measure 1999 (as revised in 2013 ndash ie the ASC NEPM (1999)) but assuming a sub-slab to indoor air attenuation factor of 003 as compared to the value of 01 adopted by the ASC NEPM (1999)
80607-1 REV1 30102017 PAGE XIV
EPA REF 0524111 FINAL REPORT STAGE 1 ENVIRONMENTAL ASSESSMENT THEBARTON ASSESSMENT AREA
1 INTRODUCTION
11 Purpose
Fyfe Pty Ltd (Fyfe) was commissioned by the South Australian Environment Protection Authority (SA EPA referred to herein as the EPA) to undertake Stage 1 groundwater and soil vapour investigation works groundwater fate and transport modelling and a human health vapour intrusion risk assessment (VIRA) within an EPA designated assessment area located within Thebarton South Australia (herein referred to as the Thebarton EPA Assessment Area) The location and extent of the Thebarton EPA Assessment Area referenced within this document is identified on Figure 1
12 General background information
Previous environmental assessment work undertaken since 1994 (as summarised in Appendix A) combined with historical information provided by the EPA (as included in Appendix B) indicates that the Thebarton EPA Assessment Area has been used for mixed residential and commercialindustrial purposes over time
Groundwater impacts2 identified within the uppermost (Quaternary ndash Q1) aquifer in the vicinity of the former Austral sheet metal works (Austral) on George Street included both petroleum hydrocarbons (ie diesel fuel) as well as chlorinated hydrocarbon compounds (CHC) such as trichloroethene (TCE) and were first notified to the EPA in 2006
Available historical information for the Austral property (ie the suspected source site) indicates that it operated from the 1920s until the 1960s-1970s and occupied an extensive area of Thebarton including
part of the southern side of George Street extending from about half way between East Terrace3 and Admella Street (ie 11-25 George Street) to the west of Admella Street (ie 31-35 George Street)
the entire northern side of Maria Street from East Terrace to the west of Admella Street
part of the southern side of Maria Street (ie from 21 Maria Street) to Admella Street and
25-27 East Terrace
2 Note that the term ldquoimpactrdquo has been used by Fyfe to indicate identified concentrations of compounds (specifically chlorinated hydrocarbons) that are not naturally occurring (ie concentrations above background that have resulted from anthropogenic activities) The use of this term does not denote that the presence of these compounds represents a risk to either human health or the environment and the term ldquoimpactrdquo is therefore not directly interchangeable with the term ldquoSite Contaminationrdquo the latter defined under the Environment Protection Act 1993 to include actual or potential harm to human health andor the environment
3 now James Congdon Drive
80607-1 REV1 30102017 PAGE 1
EPA REF 0524111 FINAL REPORT STAGE 1 ENVIRONMENTAL ASSESSMENT THEBARTON ASSESSMENT AREA
Historical newspaper articles described the Austral property as hosting a factory that extended over more than three acres and included an electroplating facility In 1938 it was described as the largest aluminium utensil manufacturing company in the southern hemisphere
Other potential sources of groundwater contamination4 identified within the Thebarton EPA Assessment Area include a former gas works (ie located to the south and south-east of the Austral property and including the current Ice Arena property) a mechanicrsquos workshop another sheet metal working facility and a farm machinery manufacturer
The Stage 1 assessment work described herein was commissioned by the EPA to determine whether historical contamination in the vicinity of George Street was presenting a risk to human health or the environment
13 Definition of the assessment area
As detailed on Figure 1 the current EPA Assessment Area covers an area of approximately 27 ha within the suburb of Thebarton located approximately 2 km north-west of the Adelaide central business district (CBD)
The boundaries of the Thebarton EPA Assessment Area were established by the EPA on the basis of the following
the previous identification of groundwater CHC contamination associated with properties located at 31-37 George Street and 39 Smith Street in Thebarton (refer to Appendix A)
the fact that although the George Street property (andor the broader Austral facility of which it formed a part) was suspected to be located in the vicinity of the source the specific source site had not yet been confirmed and
the identification of an inferred (general) north-westerly groundwater flow direction within the Q1 aquifer
14 Identification of contaminants of potential concern
The contaminants of potential concern (COPC) for the Thebarton EPA Assessment Area comprise a number of CHC The main COPC has been identified as trichloroethene (TCE) a solvent historically used for metal cleaningdegreasing activities in various manufacturing industries Additional COPC identified for the assessment area include the breakdown products of TCE namely 12-dichloroethene (12-DCE cis- and trans) and vinyl chloride (VC) as well as other solvents such as tetrachloroethene (PCE) and 11-dichloroethene (11-DCE)
Site Contamination is defined by the Environment Protection Act 1993 as existing if chemical substances are present on or below the surface of a site in concentrations above background the contaminants are there as a result of activity at the site or elsewhere and their presence has resulted in actual or potential harm (that is not trivial) to the health and safety of human beings taking into account current and proposed land uses or water or the environment
PAGE 2 80607-1 REV1 30102017
4
EPA REF 0524111 FINAL REPORT STAGE 1 ENVIRONMENTAL ASSESSMENT THEBARTON ASSESSMENT AREA
15 Objectives
As defined by the EPA the key objectives of the recent Stage 1 environmental assessment program undertaken within the Thebarton EPA Assessment Area (refer to Figure 1) were to
further delineate the chlorinated hydrocarbon contamination in groundwater
further delineate the chlorinated hydrocarbon contamination in soil vapour initially using Waterloo Membrane Samplers (WMStrade) and
undertake a Human Health Risk Assessment Vapour Intrusion Risk Assessment (HHRAVIRA) based on the data collected
With respect to the VIRA the EPA requested that there be specific consideration of
residential properties (slab on grade)
residential properties (crawl space)
residential properties (with basement) and
trenchmaintenanceutility workers that may be working in the vicinity of the contamination
80607-1 REV1 30102017 PAGE 3
EPA REF 0524111 FINAL REPORT STAGE 1 ENVIRONMENTAL ASSESSMENT THEBARTON ASSESSMENT AREA
2 CHARACTERISATION OF THE ASSESSMENT AREA
21 Site identification
For the purpose of this investigation program the Thebarton EPA Assessment Area (as delineated in Figure 1) has been defined by the following roadways
North northern verge of Smith Street
South Maria Street (between Dew Street and Albert Street) portion of Parker Street (between Maria Street and Goodenough Street) and Goodenough Street (between Parker Street and James Congdon Drive)
East western verge of Port Road and James Congdon Drive and
West western verge of Dew Street
22 Regional geology and hydrogeology
221 Geology
The Thebarton area is located within the Adelaide Plains approximately 8 km to the east of Gulf St Vincent and to the west of the Para Fault It lies within the Golden Grove ndash Adelaide Embayment area of the St Vincent Basin which consists of a succession of Tertiary and Quaternary age sediments (with thicknesses of up to 600 m) overlying basement rocks
The 1250000 Adelaide geological map (SA Department of Mines and Energy 1969) indicates that the near-surface geology of the area consists primarily of Quaternary aged soils and sediments including the Pooraka and Hindmarsh Clay formations The Pleistocene aged Pooraka Formation generally comprises a thickness of approximately 10 m and is of alluvial origin comprising sandy clays and clayey to sandy silts interbedded with layers of clay sand andor gravel The underlying Pleistocene aged Hindmarsh Clay Formation represents the basal unit of the Adelaide Plains and has a maximum general thickness of more than 100 m It generally comprises a basal gravel layer a middle layer of mottled medium to high plasticity (red-brown yellow brown greygreen to orange) often stiff to hard clays and an upper layer of fluvial and alluvial red-brown silty sand Gerges (1999) describes Hindmarsh Clay as comprising a mottled brown to pale olive grey predominantly clay formation that becomes green grey towards the basal section (approximately 16 to 20 m below ground level (BGL)) and is characterised by an increasing gravel content with depth
Underlying the Hindmarsh Clay are sands and limestone of Tertiary age which are in turn underlain by metamorphosed basement rock of the Proterozoic Umberatana Group
80607-1 REV1 30102017 PAGE 5
EPA REF 0524111 FINAL REPORT STAGE 1 ENVIRONMENTAL ASSESSMENT THEBARTON ASSESSMENT AREA
222 Hydrogeology
According to Gerges (2006) the aquifers identified within the Quaternary aged sediments of the Adelaide Plains are typically found within the coarser interbedded silt sand and gravel layers of the Hindmarsh Clay Formation and vary greatly in thickness (typically from 1 to 18 m) lithology and hydraulic conductivity Confining beds between the Quaternary aquifers consist of clay and silt layers and range in thickness from 1 to 20 m These confining beds vary in terms of the amount of coarser grained material they contain their bulk hydraulic conductivity andor the presence and density of fractures In addition their absence in some areas allows direct hydraulic connection between the aquifers
The Thebarton area is located within Hydrogeological Zone 3 (Subzone 3E) of Gerges (2006) This zone contains five to six Quaternary aquifers and three to four almost flat-lying Tertiary aquifers The first Tertiary aquifer estimated by Gerges (2006) to be intersected at a depth of approximately 130 m BGL near the Para Fault is most frequently accessed for industrial and recreational groundwater use
The Q1 aquifer assessed as part of the current investigations is typically located at depths of between 3 and 10 m BGL beneath the Adelaide Plains with an average thickness of 2 m The Q1 aquifer contains water of variable salinity with Subzone 3E including a range of 500 to 3500 mgL total dissolved solids (TDS) The gradient of the Q1 aquifer is generally flat (particularly to the west of the Para Fault) and flow direction is typically towards the north-west
A search of the registered bore database maintained by the Department of Environment Water and Natural Resources (DEWNR (2017) WaterConnect database) identified 59 bores within the general Thebarton area of which 18 are located in the Thebarton EPA Assessment Area Although eight bores were installed for monitoring purposes on or immediately adjacent to the property located at 31-37 George Street (ie part of the former Austral facility) it is understood that only one bore (6628-21951 ndash located within the Admella Street roadway intersecting the Q1 aquifer and identified as MW01 in Appendix A but MW02 by Fyfe5) remains in situ
In addition to numerous monitoringinvestigationobservation bores the Q1 aquifer within the general (ie broader) Thebarton area is recorded in the DEWNR (2017) database as being accessed for drainage domestic and industrial purposes
DEWNR (2017) information for registered bores located within the general Thebarton area is included in Appendix C whereas information for bores located within the Thebarton EPA Assessment Area (excluding those associated with the property at 31-37 George Street and installed solely for monitoring purposes6) is summarised in Table 21
5 This existing groundwater well was identified as MW02 by Fyfe in accordance with the markings on the gatic cover and the DEWNR (2017) WaterConnect bore identification details although it was originally installed as MW01 by REM (refer to discussion of previous reports in Appendix A)
6 ie 6628-21951 6628-21952 6628-22229 to 6628-22233 and 6628-22236
PAGE 6 80607-1 REV1 30102017
EPA REF 0524111 FINAL REPORT STAGE 1 ENVIRONMENTAL ASSESSMENT THEBARTON ASSESSMENT AREA
Table 21 Information regarding registered groundwater bores located within the Thebarton EPA Assessment Area
Bore ID Location Purpose Status Maximu SWL Salinity Yield Aquifer m well (m (mgL (Lsec
Tertiary (T1)
depth BGL) TDS) ) (m BGL)
125 6628-516 Coca Cola plant Rehabilitated 138 1963 794
6628-1435 Coca Cola plant Backfilled 184 212 921 392 Tertiary (T1)
6628-4576 Corner of Admella amp Chapel Streets
125 1454 445 Tertiary (T1)
6628-7724 Coca Cola plant Observation 155 2017 1272 1516 Tertiary (T1)
6628-7725 Coca Cola plant Observation 127 3016 1100 1005 Tertiary (T1)
6628-12516 Coca Cola plant Industrial Backfilled 210 212 1300 1875 Tertiary (T1)
6628-20663 39 Smith Street Irrigation 121 1105 50 Tertiary (T1)
6628-20969 39 Smith Street Industrial 30 14 1535 25 Quaternary (Q1)
6628shy21951
Admella Street 20 Quaternary (Q1)
6628-22395 21 James Congdon Drive
20 157 1541 05 Quaternary
6628-23525 41 Maria Street 206 273 1078 10 Tertiary (T1)
Notes Shading indicates that information was not recorded in the database as interpreted from information provided in the database ndash approximate only in some instances
ie MW02 as included in the groundwater monitoring program of Fyfe ndash refer to Table 31 Abbreviations BGL = below ground level SWL = standing water level TDS = total dissolved solids
23 Data quality objectives
The Data Quality Objective (DQO) process as described in Australian Standard AS44821-2005 and the National Environment Protection (Assessment of Site Contamination) Measure (ASC NEPM 1999)7
Schedule B2 Guideline on Data Collection Sample Design and Reporting and more fully documented in the NSW DEC (2006) Guidelines for the NSW Site Auditor Scheme involves a seven-step iterative approach that was initially developed by the United States Environment Protection Agency (US EPA) to facilitate the systematic planning and verification of contaminated sites assessment projects
As stated in Schedule B2 of the ASC NEPM (1999) the first six steps of the DQO process comprise the development of qualitative and quantitative statements that define the objectives of the site assessment program and the quantity and quality of data needed to inform risk-based decisions These steps enable the
All references to the ASC NEPM (1999) refer to the version amended on 16 May 2013
80607-1 REV1 30102017 PAGE 7
7
EPA REF 0524111 FINAL REPORT STAGE 1 ENVIRONMENTAL ASSESSMENT THEBARTON ASSESSMENT AREA
project team to communicate the goals decisions constraints (eg time budget) and uncertainties associated with the project and detail how they are to be addressed The seventh step comprises the development of a Sampling and Analysis Quality Plan (SAQP) to generate the data required to adequately characterise site contamination issues and assess their associated potential environmental and human health risks under the proposed land use scenario
The DQOs defined for the Thebarton EPA Assessment Area are summarised in Table 22
Table 22 Data Quality Objectives
Objective Comment
Step 1 ndash Statement of the Problem According to information provided to Fyfe by the EPA (as summarised in Appendix A) a property located at 31-37 George Street (immediately west of Admella Street) in Thebarton and historically occupied by part of the Austral facility had been found to be underlain by groundwater CHC (primarily TCE) impacts More recent reporting to the EPA for a property at 39 Smith Street located approximately 350 m north-west (and hydraulically down-gradient) of the George Street property indicated that detectable CHC (predominantly TCE) were also present within groundwater Since this area of Thebarton is occupied by a mixture of commercialindustrial and residential properties and the source and extent of the CHC impacts within the Q1 aquifer had not yet been determined potential risks to human health andor the environment had yet to be assessed
Step 2 ndash The Decision that Needs The assessment works commissioned by the EPA were necessitated to to Result from the Investigation investigate the source extent and magnitude of the groundwater CHC
contamination beneath a designated area of Thebarton (ie that included both the George Street and Smith Street properties) and to understand the possible risk to public health from potential vapour generation Fyfe have therefore undertaken vapour modelling and intrusion risk assessment works aimed at evaluating whether concentrations of identified groundwater andor soil vapour contaminants pose an unacceptable risk to human health In addition groundwater fate and transport modelling has been undertaken to predict the extent of the plume This will assist the EPA to determine a potential future Groundwater Prohibition Area (GPA) in accordance with the provisions of Section 103S of the Environment Protection Act 1993
Step 3 ndash Inputs to the Decision The information that was required to resolve the decision statement included the collection of physical and chemical data from across the Thebarton EPA Assessment Area The collected data as well as physical observations regarding the geology of the area and possible preferential contaminant pathways was used to determine potential risks to human health via groundwater fate and transport and vapour intrusion modelling
Step 4 ndash Boundaries of the Investigation
The lateral boundaries of the Thebarton EPA Assessment Area are as defined in Sections 13 and 21 as depicted on Figure 1 Vertically the investigations extended as far as the maximum drilled depth (19 m BGL)
Step 5 ndash Decision Rules The decision rule will be based upon the identification of predicted indoor air concentrations of CHC compounds associated with groundwater andor soil vapour impacts which exceed adopted response levels
PAGE 8 80607-1 REV1 30102017
EPA REF 0524111 FINAL REPORT STAGE 1 ENVIRONMENTAL ASSESSMENT THEBARTON ASSESSMENT AREA
Objective Comment
Step 6 ndash Decision Error Tolerances The purpose of establishing decision error tolerance is to control the acceptable degree of uncertainty upon which decisions are made in order to avoid the making of an incorrect decision and to enable identification of additional investigation monitoring or remediation activities required on the basis of accurate data for the protection of human health and the environment The Measuring Quality Objectives (MQO) include the quality assurance (QA) activities that were conducted during the assessment the quality control (QC) acceptance criteria applicable to the assessment and the adopted Data Quality Indicators (DQIs) as follows (and further discussed in Section 5) completeness ndash a measure of the amount of useable data from a data
collection activity comparability ndash the confidence (expressed qualitatively) that data may be
considered to be equivalent for each sampling and analytical event representativeness ndash the confidence (expressed qualitatively) that data
are representative of each media present on the site precision ndash a quantitative measure of the variability (or reproducibility) of
data and accuracy (bias) ndash a quantitative measure of the closeness of reported data
to the true value
Step 7 ndash Optimisation of the Data collection was undertaken in general accordance with the Sample Collection Design methodologies outlined in the relevant documentsguidelines referenced
throughout this report As determined by the EPA the data collection design included targeted sampling to investigate and delineate areas of potential groundwater and soil vapour contamination and to assess potential associated human health risks
80607-1 REV1 30102017 PAGE 9
EPA REF 0524111 FINAL REPORT STAGE 1 ENVIRONMENTAL ASSESSMENT THEBARTON ASSESSMENT AREA
3 SCOPE OF WORK
The scope of work undertaken by Fyfe was generally consistent with that requested within the original EPA request for quote (RFQ) dated 27 March 2017 Some modifications to the original workscope occurred based on site findings and additional site information was collected where required and as agreed with the EPA in order to achieve the EPArsquos project objectives outlined in Section 15
As identified in the RFQ the scope of work was designed to
provide an initial delineation of CHC impacts in soil vapour through the deployment of Waterloo Membrane Samplers (WMStrade) as a screening tool
further delineate the previously identified CHC impacts in groundwater
decide based on the results of the WMStrade and groundwater results the need for the number of and the locations of permanent soil vapour monitoring bores
identify the nature extent and potential source area(s) of the identified CHC impacts in groundwater andor soil vapour
determine the likely fate and transport of the groundwater CHC plume to support the establishment of a potential future GPA
determine the potential human health (including vapour intrusion) risk(s) on the basis of the data collected and
ascertain whether or not a public health risk exists within the Thebarton EPA Assessment Area
The scope of work is further detailed in Section 32 Variations from the scope of work originally requested in the EPA RFQ were agreed with the EPA during the course of the project and included the following
deployment of an additional four WMStrade units ndash ie 41 in total as compared to the original allowance of 37
installation (and sampling) of an additional six nested soil vapour bores (to depths of 1 and 3 m BGL) ndash ie 11 in total as compared to the original allowance of five
installation (and sampling) two individually located (ie as opposed to the nested locations) soil vapour bores to a depth of 1 m BGL ndash ie as compared to the original allowance of 10
installation (and sampling) of 25 groundwater monitoring wells ndash ie as compared to the original allowance of 20 and
sampling of an existing well in Admella Street (MW02) ndash ie not included in the original EPA scope
80607-1 REV1 30102017 PAGE 11
EPA REF 0524111 FINAL REPORT STAGE 1 ENVIRONMENTAL ASSESSMENT THEBARTON ASSESSMENT AREA
31 Preliminary work
Preliminary work involved the following
review and summation of all available historical reports (as supplied by the EPA) ndash refer to Appendix A
development of a preliminary (working) conceptual site model (CSM) based on a review of the historical data
preparation of a detailed health and safety plan covering all aspects and stages of the work and
detailed planning with key stakeholders prior to the execution of the field investigation program
32 Field investigation and laboratory analysis program
The scope of the field investigation program undertaken by Fyfe between 31 May and 28 August 2017 is summarised in Table 31 whereas the scope of the laboratory testing program is summarised in Table 32
A plan showing the various assessment point locations is included as Figure 2
Table 31 Scope of field investigation program ndash May to August 2017
Scope Item Description of works Date of works
Passive soil vapour sampling ndash Round 1
Thirty-seven WMStrade units identified as WMS 1 to WMS 37 were installed within the soil profile to 1 m BGL at scattered (approximately grid-like) locations across the Thebarton EPA Assessment Area
31 May and 1 to 2 June
The WMStrade units were extracted and forwarded to the analytical laboratory 7 June
Soil bores were located using a hand-held global positioning system (GPS) unit before being backfilled with (drillerrsquos) sand
7 August
Monitoring well drilling and installation
Individual groundwater well permits were obtained from DEWNR prior to well installation ndash copies of the well permits are included in Appendix D Groundwater monitoring wells (MW1 MW3 and MW5 to MW26) were installed to depths of between 15 and 19 m BGL at 24 locations across the Thebarton EPA Assessment Area Background well MW4 was installed to 19 m BGL within a public recreational area located across James Congdon Drive to the east (ie near the south-eastern corner of the Thebarton EPA Assessment Area) All 25 newly installed wells were developed following installation
28 to 30 June 3 to 7 July and 10 to 14 July
Geotechnical soil testing
Intact soil cores collected during the drilling of 10 groundwater wells (MW3 MW5 MW7 MW11 MW12 MW17 MW19 MW21 MW22 and MW25) were forwarded to the analytical laboratory for geotechnical testing
Groundwater gauging
All 25 newly installed monitoring wells (MW1 and MW3 to MW26) as well as the existing Admella Street well (MW02) were gauged to assess total well depth standing water level (SWL) and the presenceabsence of non aqueous phase liquid (NAPL) This was undertaken as a discrete event prior to the commencement of groundwater sampling
18 July
PAGE 12 80607-1 REV1 30102017
EPA REF 0524111 FINAL REPORT STAGE 1 ENVIRONMENTAL ASSESSMENT THEBARTON ASSESSMENT AREA
Scope Item Description of works Date of works
Groundwater sampling
All 26 existing and newly installed wells were sampled using a combination of low flow (micropurge) and HydraSleevetrade sampling techniques (as recorded on the field sampling sheets in Appendix E) ndash samples were forwarded to the analytical laboratories
18 to 21 and 24 to 25 July
Aquifer testing Aquifer permeability (slug) testing was undertaken on 10 wells (MW02 MW3 MW7 MW14 MW17 MW20 MW21 MW23 MW25 and MW26) Data was subsequently evaluated by Arcadis Pty Ltd (Arcadis) to estimate the hydraulic conductivity of the aquifer beneath the Thebarton EPA Assessment Area (refer to Section 732)
28 July
Soil vapour bore drilling and installation
Following the receipt of the groundwater data 11 nested soil vapour bores (SV1 to SV10 and SV12) were installed to a depth of 1 and 3 m BGL at selected locations within the Thebarton EPA Assessment Area Two additional soil vapour bores (SV11 and SV13) were installed to a depth of 1 m BGL
18 21 and 22 August
Active soil vapour sampling
Sampling of soil vapour bores was undertaken using summa canister (TO-15) sample collection methods Vapour (canister) and general gas (Tedlar bag) samples were extracted from all 13 locations (ie SV1 to SV13) including the 11 nested bores
24 August
Passive soil vapour sampling ndash Round 2
Following the receipt of the groundwater data and for the purposes of comparison with the soil vapour bore data an additional four WMStrade units (WMS 38 to WMS 41) were installed within the soil profile to 1 m BGL at targeted locations across the Thebarton EPA Assessment Area (ie within approximately 1 m of soil vapour bores SV2 SV4 SV5 and SV7) Soil bores were located using a hand-held GPS unit
18 August
The WMStrade units were extracted and forwarded to the analytical laboratory and the soil bores were backfilled with (drillerrsquos) sand
24 August
Surveying The locations of all soil vapour bores and groundwater wells were surveyed by a licensed surveyor relative to the Map Grid of Australia (MGA) 1994 and the top of each bore was surveyed relative to Australian Height Datum (AHD) The survey data are included in Appendix F
22 July and 28 August
Notes as determined by the EPA
Table 32 Scope of laboratory testing program
Scope Item Description of works
Soil geotechnical testing
Soil samples from each of three depths within core samples collected during the drilling of groundwater wells MW3 MW5 MW7 MW11 MW12 MW17 MW19 MW21 MW22 and MW25 were analysed for particle size distribution (PSD) moisture content including degree of saturation bulk density dry density and specific gravity void ratio and porosity
80607-1 REV1 30102017 PAGE 13
EPA REF 0524111 FINAL REPORT STAGE 1 ENVIRONMENTAL ASSESSMENT THEBARTON ASSESSMENT AREA
Scope Item Description of works
Groundwater testing Groundwater samples from all 26 wells were analysed for the COPC detailed in Section 14 As requested by the EPA groundwater samples from selected wells (MW02 MW5 MW8 MW9 MW12 MW17 MW21 MW22 MW23 and MW26) were also analysed for the following major cations and anions (calcium magnesium sodium potassium chloride and alkalinity)
and natural attenuation parameters (carbon dioxide (CO2) sulfate iron manganese nitrate) Additional components reported by the analytical laboratory included nitrite and nitrate + nitrite
Soil vapour testing The WMStrade units deployed during each of Rounds 1 and 2 were analysed for the COPC detailed in Section 14 The soil vapour (summa canister) samples were analysed for the COPC detailed in Section 14 as well as 2-propanol and general gases (helium hydrogen oxygen nitrogen methane carbon dioxide ethane propane butane iso-butane pentane iso-pentane hexane argon carbon monoxide and ethylene)
Notes Specific sample depths are detailed in the relevant laboratory reports in Appendix G also known as isopropyl alcohol isopropanol or IPA
33 Data interpretation
Following the receipt and collation of the field and laboratory data hydrogeological (fate and transport) and VIRA modelling (refer to Sections 8 and 9 respectively) were undertaken to enable an assessment of risk and to refine the CSM (Section 10)
PAGE 14 80607-1 REV1 30102017
EPA REF 0524111 FINAL REPORT STAGE 1 ENVIRONMENTAL ASSESSMENT THEBARTON ASSESSMENT AREA
4 METHODOLOGY
41 Field methodologies
Prior to the commencement of the field investigations a site specific Health and Safety Plan (HSP) including Safe Work Method Statements (SWMS) and a Job Hazard Analysis (JHA) was prepared ndash all personnel working at the site were required to read understand sign and conform to the HSP
Each proposed drilling location was cleared of underground services by a professional service location company (Pipeline Technologies) using conventional (electronic) service detection methods as well as ground penetrating radar (GPR) Where underground or overhead services were present andor deemed to be a potential safety risk during drilling activities the drill location was moved to an area considered by the Fyfe representative and service locator to be safe All changes to drilling locations were notified to EPA and recorded on a site plan for future reference
Given that works were undertaken within suburban streets Fyfe employed the services of a qualified traffic management company (Altus Traffic) during drilling activities in order to ensure safety for pedestrians and road users minimal disruption to traffic flow and the provision of a safe working environment
Field methodologies as detailed in Table 41 were undertaken in accordance with Fyfersquos standard operating procedures (SOPs) Relevant field sampling sheets are included in Appendices F (groundwater) and G (soil vapour ndash combined field sampling sheets and chain of custody (COC) documents) and borehole log reports are presented in Appendices H (groundwater) I (WMStrade) and J (soil vapour)
Table 41 Summary of field methodologies
Activity Details
Passive soil bore sampling The soil bores used to deploy the WMStrade units were hand augered by personnel from Fyfe and Aussie Probe to a depth of 1 m BGL SGS Australia (SGS) personnel suspended each WMStrade unit into its respective borehole from a string The hole was then sealed with an expandable foam plug inside a polyethylene sleeve and the string suspending the sampler was connected to a temporary plastic cap at the ground surface The Round 1 WMStrade units were deployed for periods of between six and seven days whereas the Round 2 WMStrade units were all deployed for six days Following retrieval by SGS each WMStrade unit was placed into a sealed glass vial and a labelled foil bag The WMStrade units did not require chilling during transport to the analytical laboratory Borehole log reports are included in Appendix I whereas combined field sampling sheets and COC documents are presented in Appendix G
80607-1 REV1 30102017 PAGE 15
EPA REF 0524111 FINAL REPORT STAGE 1 ENVIRONMENTAL ASSESSMENT THEBARTON ASSESSMENT AREA
Activity Details
Groundwater well Groundwater wells were drilled by WB Drilling using a combination of hand augering installation mechanical pushtube and solid auger techniques
Following the completion of drilling each borehole was fitted with 50 mm class 18 uPVC casing with a basal 6 m long section of slotted well screen A filter pack comprising clean graded sands of suitable size to provide sufficient inflow of groundwater was installed within the annular space between the borehole and the well casing and extended from the base of the screened interval to approximately 1 m above the termination of the slotted casing A 1 m long bentonite collar comprising pelleted or granulated bentonite was placed above the filter pack to prevent water seepage downward along the well casing or borehole from ground surface Each well was grouted up to surface level and fitted with a (lockable) steel gatic cover the latter flush mounted to prevent tripping andor other hazards Groundwater well log reports are included in Appendix H
Soil logging and Soil logging was undertaken in general accordance with the ASC NEPM (1999) which geotechnical sampling endorses AS1726-1993 In addition to the requirements of AS1726-1993 particular
attention was paid during logging to any lithological variations such as sandgravel lenses or secondary porosity (such as clay fracturing) which may act as potential preferential pathways for contaminant vapourgroundwater migration through the sub-surface as well as the presence of fill material andor any olfactory or visual evidence of contamination Soil descriptions have been included on the logs in Appendices H to J Cores for geotechnical analysis were collected using push tube sampling methodologies to obtain undisturbed samples Section(s) of core to be tested were retained (intact) within the pushtube liners and capped at each end for storage and transport to the analytical laboratory
Field screening of soils Field screening of individual soil layers was undertaken at the majority of the drilling locations and involved the use of a photoionisation (PID) unit fitted with an 117 eV lamp (ie as considered suitable for the detection of CHC) The PID unit was calibrated by the hire company prior to delivery and was checked on a daily basis against an isobutylene calibration gas of known concentration Field screen samples were collected with care to ensure that each sample was representative of the soil stratum from which it was collected and experienced minimal loss of volatile compounds The soil material was placed immediately into a zip lock bag and sealed ensuring the bag was half filled (ie such that the volume ratio of soil to air was equal) Soil clumps within the bag were manually broken up and the bag was left to rest for a minimum of five minutes but no longer than 20 minutes Prior to testing the bag was shaken vigorously to release any vapours within the soil To test the tip of the PID probe was inserted into the bag and the maximum volatile organic compound (VOC) reading recorded after a nominal 10 second period or when the reading had peaked Results were recorded on the appropriate bore log sheets presented in Appendices H to J
Groundwater well Following installation the wells were developed by purging a minimum of four well development volumes (ie until stable parameters were obtained andor until the well purged dry) from
the casing with a steel bailer andor twister pump to ensure hydraulic connectivity with the aquifer formation
Groundwater gauging Groundwater levels in the newly installed and existing monitoring wells located across the Thebarton EPA Assessment Area were gauged using an interface probe prior to the commencement of the groundwater sampling program All monitoring wells were gauged for SWL the potential presence of NAPL and the total well depth Groundwater field gauging results are presented in Appendix E
PAGE 16 80607-1 REV1 30102017
EPA REF 0524111 FINAL REPORT STAGE 1 ENVIRONMENTAL ASSESSMENT THEBARTON ASSESSMENT AREA
Activity Details
Groundwater sampling The majority of the wells were sampled using low flow (micropurge) techniques Where recovery was particularly low (ie MW4 MW8 MW15 MW18 MW19 and MW24) and unsuitable for low flow (micropurge) sampling the original sampling technique was abandoned and a HydraSleeveTM (no purge) methodology was used instead Groundwater samples were collected in laboratory-supplied screw top bottles containing appropriate preservative (if required) with no headspace allowed Samples were chilled during storage and transport to the analytical laboratory Disposable nitrile gloves worn by field personnel were changed prior to the collection of each sample Samples for metals (ie iron manganese) analysis were filtered in the field using 045 microm filters Groundwater field sampling sheets are presented in Appendix E
Low Flow Methodology The low flow sampling technique involved the following the pump was placed close to the bottom of the screened interval the flow rate (up to 05 Lmin) was regulated to maintain an acceptable level of
drawdown with minimal fluctuation of the dynamic water level during pumping and sampling
groundwater drawdown was monitored constantly during purging and sampling using an interface probe
water quality parameters were considered to have stabilised when the following ranges were recorded over three consecutive readings ndash electrical conductivity plusmn 5 ndash pH plusmn 01 ndash temperature plusmn 02degC ndash dissolved oxygen plusmn 10 ndash redox potential plusmn 10 mV
the stabilisation parameters were recorded on field logging sheets after every one litre of groundwater purged using a calibrated water quality meter and a flow cell suspended in a bucket with litre intervals marked and
samples were collected once three consecutive stabilisation parameters were recorded and a volume of between 28 and 6 litres was purged prior to sampling
HydraSleeveTM Methodology The HydraSleeveTM sampling technique involved attaching a stainless steel weight to the bottom and a wire tether clip to the throat of the HydraSleeveTM before lowering it into the water column to the desired depth and allowing it to fill with groundwater After a minimum period of 24 hours the HydraSleeveTM was quickly and smoothly withdrawn from the well and the contents were transferred into the sample containers Water quality parameters were measured after samples were decanted ndash either within the water remaining in the HydraSleeveTM or within a grab sample collected using a disposable bailer
Hydraulic testing Rising and falling head permeability (ldquoslugrdquo) tests were undertaken to estimate the hydraulic conductivity (K) of the aquifer within various parts of the Thebarton EPA Assessment Area The falling-head tests were initiated by quickly inserting a 1285 m long and 36 mm diameter solid PVC cylinder (slug) into the water column at each well to produce a sufficient sudden rise in the water level The subsequent ldquofallrdquo back to the static water level (recovery) was measured and recorded automatically and in real-time using a
80607-1 REV1 30102017 PAGE 17
EPA REF 0524111 FINAL REPORT STAGE 1 ENVIRONMENTAL ASSESSMENT THEBARTON ASSESSMENT AREA
Activity Details
pressure transducerdata logger programmed to record water levels at a one second interval After static water level conditions returned in the well the rising-head test was initiated by quickly removing the slug from the well to create a sudden drop in the water column height As with the falling-head test the rise of the water level back to a static condition (recovery) was automatically recorded
Soil vapour bore Soil vapour bores were drilled by Aussie Probe using a combination of hand augering and installation mechanical pushtube techniques
Within each 3 m deep soil vapour bore teflon tubing attached to a soil vapour probe was inserted to the base of the hole which had been prefilled with approximately 005 m of clean filter pack sand An additional 045 m of sand (ie approximately 05 m in total) was then added to the hole and topped by a bentonite plug seal of approximately 05 m thickness A second soil vapour probe was installed at a depth of about 1 m within a 05 m sand pack which was overlain by bentonite to a depth of about 02 to 03 m BGL The two 1 m deep soil vapour bores were installed in a similar manner with a sand pack extending from the base to about 05 to 06 m BGL overlain by a bentonite plug to 03 m BGL Each installation was completed with grout to surface and topped with a standard flush-mounted gatic cover Soil vapour bore log reports are included in Appendix J
Soil vapour sampling All soil vapour sampling works were undertaken by SGS using suitably trained and experienced personnel ndash SGS holds National Association of Testing Authorities (NATA) accreditation for all soil vapour sampling and laboratory analytical works Combined field sampling sheets and COC documents are presented in Appendix G Soil vapour samples were collected using summa canisters and analysed using the US EPA (1999) TO-15 method Sampling involved the connection of a passivated 1 L stainless steel canister to the teflon tubing extending from the soil vapour probe and the use of a soil gas sampling train to restrict flow to a maximum rate of 200 mLmin Canister vacuum pressure was monitored during sampling to enable calculation of the volume of sample drawn into the canister ndash the small amount of vacuum left in the canister at the end of the sampling procedure was measured in the laboratory to check if any leaks occurred during transit (refer to further discussion in Table 52) A shroud was set up around the sampling point and tracer chemicals were introduced at high concentrations by flooding the shroud with helium and placing a cloth soaked with IPA into the shroud Each canister was cleaned and certified by SGS prior to use (refer to Appendix G) and backshyup coconut shell carbon sorbent tube samples were also collected (but not analysed) Summa canisters did not require chilling during transport to the analytical laboratory
Waste disposal Waste water and surplus soil corescuttings were stored together within 205 litre drums in the rear car park of a commercialindustrial property at 19-21 James Congdon Drive (as organised by the EPA) prior to removaldisposal by a licensed waste removal company (Cleanaway) Analytical results pertaining to the soils were forwarded to the licensed receiving facility and all of the soil was classified as lsquoWaste Fillrsquo in accordance with the Environment Protection Regulations 2009 The waste transport certificates are included in Appendix K
PAGE 18 80607-1 REV1 30102017
EPA REF 0524111 FINAL REPORT STAGE 1 ENVIRONMENTAL ASSESSMENT THEBARTON ASSESSMENT AREA
42 Laboratory analysis
The following laboratories were used for the analysis of the environmental samples
complete soil cores for geotechnical sample analysis were forwarded to SMS Geotechnical
primary groundwater samples collected by Fyfe were analysed at the SGS laboratory whereas secondary groundwater samples were forwarded to EurofinsMGT and
soil vapour (including WMStrade) samples collected by SGS were analysed at their laboratory
80607-1 REV1 30102017 PAGE 19
EPA REF 0524111 FINAL REPORT STAGE 1 ENVIRONMENTAL ASSESSMENT THEBARTON ASSESSMENT AREA
5 QUALITY ASSURANCE AND QUALITY CONTROL
Data quality is typically discussed in terms of the DQIs presented in Table 22 ndash ie completeness comparability representativeness precision and accuracy In order to assess the quality of the data collected during the Fyfe investigation program against these DQIs specific QAQC procedures were implemented during both the field sampling and laboratory analysis programs as detailed in the following sections
51 Field QAQC
Field QA procedures undertaken during the recent investigations included the collection of the following QC samples aimed at assessing possible errors associated with cross contamination as well as inconsistencies in sampling andor laboratory analytical techniques
intra-laboratory duplicate (duplicate) samples submitted to the same (primary laboratory) to assess variation in analyte concentrations between samples collected from the same sampling point andor the repeatability (precision) of the analytical procedures
inter-laboratory duplicate (split or triplicate) samples submitted to a second laboratory to check on the analytical proficiency (accuracy) of the results produced by the primary laboratory
equipment rinsate blank samples collected during groundwater sampling only and used to assess cross-contamination that may have occurred from sampling equipment during sampling and
trip blank samples used to assess whether cross-contamination may have occurred between samples during transport
Whereas analyte concentrations within the rinsate and trip blank samples should be below the laboratory limit of reporting (LOR) the inter- and intra-laboratory duplicate sample results are assessed via the calculation of a relative percentage difference (RPD) as follows
(Concentration 1 minus Concentration 2) x 100RPD = (Concentration 1 + Concentration 2) 2
Maximum RPDs of 30 (inorganics) and 50 (organics) are generally considered acceptable with higher RPD values often recorded where concentrations of an analyte approach the laboratory LOR
All field QC sample results are included in the summary data tables in Appendix L
511 Groundwater
Table 51 presents conformance to field QAQC procedures undertaken as part of the groundwater investigations
80607-1 REV1 30102017 PAGE 21
EPA REF 0524111 FINAL REPORT STAGE 1 ENVIRONMENTAL ASSESSMENT THEBARTON ASSESSMENT AREA
Table 51 Field QAQC procedures ndash Groundwater
QAQC Item Detail
Field procedures Field procedures were undertaken in accordance with the ASC NEPM (1999) AustralianNew Zealand standards ASNZS 566711998 and ASNZS 5667111998 SA EPA (2007) and Fyfe SOPs Details are provided in Table 41
Calibration of field equipment
Documentation regarding the calibration of field equipment is included in Appendix M
Decontamination of All disposable equipment (tubing pump bladders plastic bailers bailer cord and equipment HydraSleeveTM units) were replaced between wells Re-usable equipment (micropurge pump
interface probe and HydraSleeveTM weights) was decontaminated between sampling locations using potable water and Decon 90trade phosphate free detergent
Sample preservation and storage
Samples were kept in laboratory supplied containers in a portable chilled insulated box (esky) prior to and during transport to the laboratory
Sample tracking COC documentation was used for the transport of all samples to the laboratory and is included in Appendix G
Duplicate samples Two intra-laboratory and two inter-laboratory duplicate samples were analysed for CHC with respect to 26 primary groundwater samples ndash thereby constituting an overall ratio of approximately one duplicate per 65 primary samples (or 15) compared to a generally acceptable ratio of 110 samples (or 10) One intra-laboratory and one inter-laboratory duplicate sample were analysed for the remaining parameters with respect to 10 primary groundwater samples ndash thereby constituting an overall ratio of one duplicate per five primary samples (or 20) compared to a generally acceptable ratio of 110 samples (or 10) Intra- and inter-laboratory duplicate sample RPDs were calculated where both data sets had a reported concentration above the specific analyte laboratory LOR All calculated RPDs for CHC were within the acceptable range with the exception of the following intra-laboratory duplicate sample pair MW9QW1 TCE (67) nitrate (147) and inter-laboratory duplicate sample pair MW9QW2 total CO2 (59) iron (190)
manganese (183) potassium (64) nitrate (194) The elevated RPD for TCE in the intra-laboratory duplicate sample pair is considered to be related to the low concentration detected and does not alter the interpretation of the data The other RPD exceedances are not considered significant (ie in terms of overall data interpretation) as they were not obtained for identified COPC (as defined in Section 14)
Rinsate blank samples Six equipment rinsate blank samples (one for each day of sampling) were collected from either the pump housing or a new HydraSleevetrade (final day of sampling only) and analysed for CHC to confirm the effectiveness of the decontamination procedures and the cleanliness of disposable equipment The analytical results obtained for the rinsate blank samples were all below the laboratory LOR thereby indicating that decontamination practices during the groundwater sampling program were acceptable and that no contamination was introduced by the use of the HydraSleevestrade
Trip blank samples Six trip blank samples were included within containers (eskies) of sample bottles provided by the analytical laboratory and returned to the analytical laboratory All of the trip blank samples were analysed for CHC With the exception of TB187 which contained 1 microgL TCE the analytical results obtained for the trip blank samples were all below the laboratory LOR thereby indicating that there was limited impact on sample quality during storage or transport of the samples to the analytical laboratory
PAGE 22 80607-1 REV1 30102017
EPA REF 0524111 FINAL REPORT STAGE 1 ENVIRONMENTAL ASSESSMENT THEBARTON ASSESSMENT AREA
Notes No duplicate QC samples were collected during the use of the HydraSleeveTM sampling technique as detailed in ANZECCARMCANZ (2000a) at least 5 (ie 120) duplicate samples should be analysed ndash the generally accepted industry standard however is 10 (110) including 5 intra-laboratory and 5 inter-laboratory duplicates
512 Soil vapour
Tables 52 presents conformance to field QAQC procedures undertaken as part of the soil vapour (passive and active) investigations
Table 52 Field QAQC procedures ndash Soil vapour
QAQC Item Detail
Field procedures Field procedures were undertaken in accordance with the ASC NEPM (1999) as well as ASTM (2001 2006) ITRC (2007) CRC CARE (2013) guidance and Fyfe SOPs Details are included in Table 41 and Appendix G (ie SGS sampling methodology sheet) During the use of summa canisters to sample the soil vapour bores leak testing was undertaken (as described in Table 41) Although small leaks or ambient drawdown appear to have occurred with respect to samples SV11_10m (003 helium) SV13_10m (003 helium) and SV1_10m (360 microgm3 IPA) ITRC (2007) and NJDEP (2013) state that ge 5 helium andor gt10 mgm3 IPA are required to be indicative of a significant leak or substantial ambient drawdown Given that the leaks were relatively small (ie 06 (helium) and 36 (IPA) of the levels considered indicative of a significant leak) the data from these bores were still considered to be valid ndash refer to SGS correspondence in Appendix G As detailed in Table 41 a small amount of vacuum was generally left in each summa canister at the end of the sampling procedure and was measured in the laboratory to check if any leaks had occurred during transit However samples SV11_10m SV12_30m as well as the helium blank were recorded as having zero vacuum upon receipt at the analytical laboratory A query lodged with SGS regarding this issue indicated that whereas the helium blank comprised a grab sample collected into a Tedlar bag directly from the helium cylinder (ie without the use of a gauge) the canisters used for samples SV11_10m and SV12_30 were filled during sampling so that there was no remaining vacuum ndash refer to field sampling documentation in Appendix G SGS stated that although it is good practice to have a small amount of vacuum remaining in a canister at the completion of sampling appropriate additional QC measures were employed and the absence of other common background VOCs (eg petroleum hydrocarbons) upon sample testing indicated that leakage had not occurred during transit In addition all canisters are fitted with quick connect one-way valves that are closed upon removal from the sampling train and canistersfittings are leak checked prior to leaving the laboratory and again in the field to ensure that they are leak free Refer to SGS correspondence in Appendix G The presence of detectable IPA (120 microgm3) and TCE (48 microgm3) in the helium blank was also queried with SGS who stated that this (ie variability in the quality of the high purity helium gas used) is not an uncommon occurrence The reason for collecting a helium blank sample is to identify any impurities present in the helium gas so that if a leak does occur during sampling it is possible to determine whether any target compounds could be introduced into the sample train Although a target compound (ie TCE) was detected in the blank the concentration is minor and even if a leak had occurred during sampling (of which there was no evidence) it would not have affected the overall results and data interpretation The presence of IPA in the helium blank is
80607-1 REV1 30102017 PAGE 23
EPA REF 0524111 FINAL REPORT STAGE 1 ENVIRONMENTAL ASSESSMENT THEBARTON ASSESSMENT AREA
QAQC Item Detail
suspected by SGS of having resulted from a handling issue in the field ndash ie sub-sampling from the helium cylinder (ie into a summa canister via a flex foil bag) in the vicinity of the high concentrations of IPA being used for leak detection Refer to SGS correspondence in Appendix G
Sample preservation and storage
Following collection the WMStrade units were placed into individual glass vials which were sealed and placed into foil bags for transport to the analytical laboratory at ambient temperature Summa canisters were stored in specially constructed cases during transport to the analytical laboratory at ambient temperature
Sample tracking COC documentation was used for the transport of all samples to the laboratory and is included in Appendix G
QC samples ndash WMStrade sampling
During the first round of passive soil vapour sampling three additional WMStrade units were deployed in soil bores drilled adjacent to WMS 22 WMS 25 and WMS 28 to act as duplicate QC samples ndash thereby constituting a ratio of approximately one duplicate per 12 primary samples (or 8) Two trip blank samples were also included with samples transported from and to the analytical laboratory All of the QC samples were analysed by the primary laboratory Intra-duplicate sample RPDs were calculated where both data sets had a reported concentration above the specific analyte laboratory LOR All calculated RPDs for CHC were within an acceptable range (ie lt30) The analytical results obtained for the trip blank samples were all below the laboratory LOR thereby indicating that there was negligible impact on sample quality during storage or transport of the samples to the analytical laboratory
QC samples ndash soil vapour bore sampling
Two intra-laboratory duplicate QC samples were analysed for CHC and general gases with respect to 24 primary soil vapour samples ndash thereby constituting a ratio of approximately one duplicate per 12 primary samples (or 83) compared to an acceptable ratio of 110 samples (or 10) Intra-laboratory duplicate RPDs were calculated where both samples had a reported concentration above the laboratory LOR All calculated RPDs for CHC and general gases were within an acceptable range (ie lt30) The analytical results obtained for the helium shroud (Tedlar bags) helium blank and IPA shroud (carbon tube) samples were all considered to be satisfactory
Notes The American Society for Testing and Materials (ASTM) is an internationally recognised source of testing methods Although Appendix J of CRC CARE (2013) stipulates a 110 duplicate sampling ratio for active vapour sampling a specific ratio is not stipulated for passive vapour sampling
52 Laboratory QAQC
Laboratory QA procedures generally include the performance of a number of internal checks of data precision and accuracy that are aimed at assessing possible errors associated with sample preparation and analytical techniques Specific types of QC samples analysed by laboratories and the relevant acceptance criteria are as follows
PAGE 24 80607-1 REV1 30102017
EPA REF 0524111 FINAL REPORT STAGE 1 ENVIRONMENTAL ASSESSMENT THEBARTON ASSESSMENT AREA
internal laboratory replicate samples maximum RPD values of 20 to 50 although this varies depending on laboratory LOR
spike recoveries results between 70 and 130 and
laboratory controlmethod blanks results below the laboratory LOR
Table 53 presents conformance to laboratory QAQC procedures undertaken as part of the overall investigation program
Table 53 Laboratory QAQC procedures
QAQC Item Detail
Samples analysed and Samples were generally analysed within specified holding times ndash with the exception extracted within relevant of the following groundwater samples holding times SGS report no ME303457 nitrate was analysed two days late in some samples
(MW5 MW17 MW26) SGS report no ME303475 nitrate was analysed one day late in all samples and EurofinsMGT report no 555810-W total CO2 was analysed five days late None of these holding time exceedances are considered to be significant with respect to the interpretation of the CHC data the determination of potential human healthenvironmental risks andor the determination of natural attenuation
Laboratories used and The laboratories used (SGS Eurofins MGT and SMS Geotechnical) were NATA NATA accreditation accredited for the majority of the analyses undertaken
The exception was SMS Geotechnical which was not NATA accredited for the calculations undertaken to derive some of the data ndash this is the case however for all geotechnical laboratories
Appropriate analytical methodologies used
Refer to the laboratory reports in Appendix G
Laboratory limit of The laboratory LOR is the minimum concentration of an analyte (substance) that can reporting (LOR) be measured with a high degree of confidence that the analyte is present at or above
that concentration The LOR are presented in the laboratory certificates of analysis (Appendix G) and are considered to be generally appropriate (ie below the adopted assessment criteria ndash refer to Section 62) ndash the following exceptions in soil vapour (ie considered to be due to interference associated with elevated concentrations of other compounds ndash refer to SGS correspondence in Appendix G) are discussed further in Table 101 VC in all of the WMStrade samples relative to the ASC NEPM (1999) interim soil
vapour health investigation level (HIL) for residential land use cis-12-DCE and VC in two soil vapour bore samples (SV2_30m and SV3_30m)
relative to the ASC NEPM (1999) interim soil vapour HILs for residential and commercialindustrial land use and
VC in two soil vapour bore samples (SV3_10m and SV7_30m) relative to the ASC NEPM (1999) interim soil vapour HIL for residential land use
In addition to the above although ultra-trace analysis was requested the laboratory LOR for VC in groundwater (ie 1 microgL) is above the adopted NHMRCMRMMC (2011) potable guideline (ie 03 microgL) ndash refer to Section 612
80607-1 REV1 30102017 PAGE 25
EPA REF 0524111 FINAL REPORT STAGE 1 ENVIRONMENTAL ASSESSMENT THEBARTON ASSESSMENT AREA
QAQC Item Detail
Laboratory internal QC analyses
Results obtained for the laboratory internal QC samples were generally within the acceptable limits of repeatability chemical extraction and detection with the exception of the following SGS report ME303457 matrix spike results for iron were outside normal tolerances
due to the high concentrations of iron in the spiked sample ndash matrix spike results for iron could therefore not be calculated This is not considered to be a significant issue
Full details regarding laboratory QAQC procedures and results are presented in the certified laboratory certificates contained in Appendix G
Notes Since holding times were not specified in the SGS groundwater reports Fyfersquos assessment of holding times has been based on those adopted by EurofinsMGT (ie the secondary laboratory used for groundwater analysis) ie in accordance with Schedule B3 of the ASC NEPM (1999) also referred to as practical quantification limits (PQL)
53 QAQC summary
In summary it is considered that
the field QAQC programs were generally undertaken with regard to relevant legislation standards andor guidelines and were sufficient for obtaining samples that are representative of site conditions and
the overall laboratory QAQC procedures and results were adequate such that the laboratory analytical results obtained are of acceptable quality for addressing the key objectives outlined in Section 15
PAGE 26 80607-1 REV1 30102017
EPA REF 0524111 FINAL REPORT STAGE 1 ENVIRONMENTAL ASSESSMENT THEBARTON ASSESSMENT AREA
6 ASSESSMENT CRITERIA
61 Groundwater
611 Beneficial Use Assessment
In accordance with Schedule B6 of the ASC NEPM (1999) and SA EPA (2009) a Beneficial Use Assessment (BUA) was undertaken to assess both the current and realistic future uses of groundwater within the Q1 aquifer beneath the Thebarton EPA Assessment Area
This was aimed at determining what groundwater uses need to be protected and assessing the risk(s) that groundwater may pose to human health and the environment (refer also to the VIRA in Section 9)
As summarised in Table 61 the potential beneficial uses for groundwater within the Q1 aquifer that have been considered are as follows ndash taking into account the salinity of the groundwater the Environment Protection (Water Quality) Policy 2015 (Water Quality EPP 2015) the DEWNR (2017) WaterConnect database information presented in Section 222 and possible sensitive receptors located within andor within the vicinity of the Thebarton EPA Assessment Area
The salinity of groundwater has been calculated to approximate 1230 to 3620 mgL TDS (refer to Section 7312) According to the Water Quality EPP 2015 the applicable environmental values for groundwater with salinity above 1200 mgL TDS but less than 3000 mgL TDS are irrigation livestock and aquaculture whereas the salinity is considered to be too high for potable use ndash although domestic irrigation is considered to be a potentially realistic use for this area (see below) livestock watering is considered unlikely to be undertaken in such an urban setting and no local water bodies (ie surface or groundwater) have been identified as being used for commercial aquaculture purposes
The DEWNR (2017) WaterConnect database indicates that groundwater within the Q1 aquifer in the Thebarton area is accessed for drainage domestic and industrial purposes ndash domestic groundwater use could include garden irrigation plumbing water andor the filling of swimming pools (ie primary contact recreation) Although domestic groundwater extraction is considered unlikely to include potable use (ie due to its salinity and the availability of a reticulated mains water supply) potential mixing with rain watermains water could render it suitable (ie from a salinity perspective) for drinking
As the closest freshwater surface water body the River Torrens is located approximately 03 km to the east and 07 km to the north and north-west of the northern portion of this area groundwater discharge from the Thebarton EPA Assessment Area into a freshwater aquatic ecosystem is considered possible However as the River Torrens is considered to be either a recharge boundary (ie discharging to local groundwater) or not actually hydraulically connected to the Q1 aquifer in this area the potential for impact on a freshwater aquatic environment has not been confirmed
80607-1 REV1 30102017 PAGE 27
EPA REF 0524111 FINAL REPORT STAGE 1 ENVIRONMENTAL ASSESSMENT THEBARTON ASSESSMENT AREA
Since the closest marine surface water body Gulf St Vincent is located approximately 8 km to the west groundwater discharge from the Thebarton EPA Assessment Area into a marine aquatic ecosystem is not considered to be realistic
Since volatile contaminants have been detected within the Q1 aquifer (refer to Section 7331) a potential vapour flux risk to future site users must be considered
Given the measured depth of the Q1 aquifer beneath the site (ie approximately 1232 to 1585 m BGL ndash refer to Section 7311) it is considered unlikely that direct contact could occur between groundwater and building footingsunderground services
Table 61 Assessment of groundwater beneficial uses for Thebarton EPA Assessment Area
Environmental Values Beneficial Uses
Water Quality EPP 2015
environmental value
SA EPA (2009) Potential
Beneficial Uses
Beneficial Use Assessment
Considered Applicable
Aquatic Ecosystem
Marine Yes No
Fresh Yes Possibly
Potable - Yes Possibly
Agriculture Irrigation - Yes Yes
Livestock - Yes No
Aquaculture - Yes No
Recreation amp Aesthetics
Primary contact Yes Possibly
Aesthetics Yes Possibly
Industrial - Yes Yes
Human health in non-use scenarios
Vapour flux -
Yes Yes
Buildings and structures
Contact - Yes No
Notes ie for underground waters with a background TDS level of between 1200 and 3000 mgL ndash note that although they are not listed as environmental values of groundwater in Schedule 1(3) of the Water Quality EPP 2015 aquatic ecosystems as well as recreation amp aesthetics are included as environmental values for waters in general in Part 1(6) of the document ie domestic irrigation only
612 Groundwater beneficial use criteria
The health and ecological criteria used for the assessment of the COPC (refer to Section 14) in groundwater have been based on the results of the BUA (Section 611) A summary of the references used to source the groundwater assessment criteria is provided in Table 62
PAGE 28 80607-1 REV1 30102017
EPA REF 0524111 FINAL REPORT STAGE 1 ENVIRONMENTAL ASSESSMENT THEBARTON ASSESSMENT AREA
Table 62 Sources of adopted groundwater assessment criteria
Beneficial Use Reference
Freshwater Ecosystems No criteria available for COPC
Potable NHMRCNRMMC (2011) Australian Drinking Water Guidelines
WHO (2017) Guidelines for Drinking-water Quality ndash TCE only
Irrigation No criteria available for COPC
Primary contact recreation (including aesthetics)
NHMRC (2008) Guidelines for Managing Risks in Recreational Water ndash based on NHMRCNRMMC (2011) Australian Drinking Water Guidelines but (with the exception of aesthetic guidelines) multiplied by a factor of 10 to take account of accidental ingestion rates as opposed to deliberate ingestion
ANZECCARMCANZ (2000b) Australian and New Zealand Guidelines for Fresh and Marine Water Quality ndash recreational values (TCE only)
Human health in non-use scenarios ndash vapour flux Refer to the VIRA in Section 9
Notes As there are no specific guidelines for industrial water these values are considered likely to be protective of this additional beneficial use The NHMRC (2008) guidelines are based on drinking water levels and assume a consumption factor of 2 L per day Therefore as recommended in the NHMRC (2008) document potable criteria (ie with the exception of aesthetic criteria) need to be adjusted by a factor of 10 to account for an accidental consumption rate of 100 to 200 ml per day As noted in ANZECCARMCANZ (2000b) although recreational guidelines are protective of ingestion recreational waters should also not contain any chemicals that can cause skin irritation likewise although not specifically addressed by recreational water criteria inhalation may also represent a source of exposure with respect to some (ie volatile) contaminants In the absence of a NHMRCNRMMC (2011) drinking water guideline for TCE the ANZECCARMCANZ (2000b) recreational criterion (30 microgL) has been adopted However if the NHMRC (2008) rule of multiplying potable (healthshybased) guidelines by 10 is applied to the WHO (2017) drinking water guideline of 20 microgL a recreational guideline of 200 microgL would be more applicable
62 Soil vapour
The ASC NEPM (1999) interim soil vapour health investigation levels (HILs) for volatile organic chlorinated compounds (VOCCs) have been adopted (ie in the first instance ndash refer to Section 7331) as Tier 1 soil vapour assessment criteria ndash relevant land use scenarios within the Thebarton EPA Assessment Area include residential (HIL AB) and commercialindustrial (HIL D)
These criteria have been further adjustedappended for the purposes of the VIRA Tier 1 assessment ndash refer to Section 94
80607-1 REV1 30102017 PAGE 29
EPA REF 0524111 FINAL REPORT STAGE 1 ENVIRONMENTAL ASSESSMENT THEBARTON ASSESSMENT AREA
7 RESULTS
71 Surface and sub surface soil conditions
711 Field observations
Groundwater well and soil vapour borehole log reports are included in Appendices H to J and provide details of the soil profile encountered at each sampling location
Where encountered fill materials extended to depths of between 01 and 09 m BGL and included a range of different soil types (sand gravelcrushed rock silt) with only minimal waste inclusions (ie asphalt glass andor metal fragments) identified at some locations
The underlying natural soil profile (encountered to the maximum drill depth of 19 m BGL) was dominated by low to medium plasticity brown to red-brown silty clays and sand claysclayey sands some of which contained sub-angular to rounded gravels that included river pebbles andor comprised fine distinct lenses in places Groundwater well MW17 also included a 15 m thick layer of gravel at depth (ie 12 to 135 m BGL) ndash ie consistent with the depth of groundwater within the Q1 aquifer
During the course of the drilling works no odours or visual indicators of contamination were detected and measured PID readings ranged up to 6 ppm but were generally lt3 ppm
712 Soil geotechnical testing
A table of geotechnical testing results is presented in Appendix L (Table 1) and a copy of the certified laboratory report is included in Appendix G Photographs of soil cores are included in Appendix N
The results were interpreted to indicate the following
The soil core samples submitted for PSD analysis were dominated by clay with lesser amounts of fine to medium gravel andor fine to coarse-grained sand ndash all samples analysed were classified as either CLAY or Sandy CLAY with one sample classified as Clayey SAND The classifications obtained from the laboratory were deemed to be generally consistent with the descriptions on the groundwater well log reports (Appendix H) although the PSD results did not specify silt as a significant secondary component
The moisture content of the analysed soil core samples ranged from 65 to 231 Moisture content with respect to soil type depth and location has been considered in more detail for the purposes of the VIRA (Section 9) The degree of saturation for the analysed soil cores samples ranged from 218 to 964
Measured bulk density ranged from 160 to 212 tm3 specimen dry density from 141 to 184 tm3 and specific gravity from 255 to 281 tm3
The measured void ratio ranged from 043 to 088 whereas porosity ranged from 032 to 047
80607-1 REV1 30102017 PAGE 31
EPA REF 0524111 FINAL REPORT STAGE 1 ENVIRONMENTAL ASSESSMENT THEBARTON ASSESSMENT AREA
72 Waterloo Membrane Samplerstrade A table of WMStrade analytical results (ie from both rounds of sampling) is presented in Appendix L (Table 2) and copies of certified laboratory reports are included in Appendix G8
Of the 41 WMStrade units deployed across the Thebarton EPA Assessment Area during the two sampling rounds 20 returned measurable concentrations of CHC including TCE PCE cis-12-DCE trans-12-DCE andor 11-DCE Although no VC was detected the laboratory LOR in all samples (ie 35 to 50 microgm3) was above the ASC NEPM (1999) soil vapour interim HIL for residential land use (30 microgm3) ndash refer also to Table 53
Detectable COPC concentrations are summarised in Table 71 relative to the ASC NEPM (1999) soil vapour interim HILs along with the closest soil vapour bore andor groundwater monitoring well locations Measured TCE concentrations are detailed on Figure 3
A comparison of the Round 1 and 2 WMStrade results (ie for closely located units9) is presented in Table 72 ndash the results indicate a general order of magnitude correlation of the results for most COPC with the exception of PCE for which lower concentrations were obtained during Round 2 As the Round 1 and 2 WMStrade units were located within different soil bores and deployed at different times some variability in the results is to be expected In addition and as discussed in Section 74 the WMStrade units have been used during this assessment as a (semi-quantitative) screening tool (ie to assist with the siting of the permanent soil vapour bores) with the results obtained from the soil vapour bores considered more representative of actual subsurface conditions
Table 71 Detectable Waterloo Membrane Samplertrade CHC results
Sample ID
Location Closest land uses
CHC concentration (microgm3) Closest soil vapour bore
andor groundwater
well
TCE PCE cis-12shyDCE
trans-12shyDCE
11shyDCE
VC
WMS 1 Goodenough Street CI 35 -
WMS 6 Maria Street CI 32 -
WMS 7 Maria Street CI and R 1900 45 SV2 MW5
WMS 8 Maria Street CI and R 12000 37 SV4
WMS 11 Admella Street CI 71000 260 19 20 36 SV5 MW02
WMS 14 George Street CI 46000 45 SV6 MW11
WMS 18 Admella Street CI 4200 34 MW14
WMS 19 Albert Street CI 11000 42 SV10MW15
WMS 21 Chapel Street CI 10 -
WMS 22 Admella Street CI 38 SV9
WMS 24 Chapel Street CI 230 62 10 11 48 MW17
8 Note that the original laboratory report for the Round 1 WMStrade samples was found to be incorrect (ie following receipt of the soil vapour bore and Round 2 WMStrade sample results) and was subsequently re-issued by SGS
9 only two of which were sufficiently co-located for comparative purposes ndash Round 2 locations WMS 39 and WMS 41 were not within the immediate vicinity of Round 1 WMStrade bores (ie the closest Round 1 bores were approximately 30 m away)
PAGE 32 80607-1 REV1 30102017
EPA REF 0524111 FINAL REPORT STAGE 1 ENVIRONMENTAL ASSESSMENT THEBARTON ASSESSMENT AREA
Sample ID
Location Closest land uses
CHC concentration (microgm3) Closest soil vapour bore
andor groundwater
well
TCE PCE cis-12shyDCE
trans-12shyDCE
11shyDCE
VC
WMS 25 Albert Street CI and R 1400 20 MW17
WMS 27 Light Terrace CI 64 62 SV11 MW19
WMS 32 Holland Street R 16 -
WMS 34 James Street R 11 -
WMS 37 Dew Street R 44 -
WMS 38 Maria Street CI and R 13000 56 SV2 MW5
WMS 39 Maria Street CI and R 1300 SV4
WMS 40 Admella Street CI 110000 97 SV5 MW02
WMS 41 George Street CI 18000 10 SV7 ASC NEPM (1999) HIL - Residential 20 2000 80 - - 30 ASC NEPM (1999) HIL ndash Commercialindustrial 80 8000 300 - - 100
Notes Shaded cells indicate concentrations were below the laboratory LOR Where (field) duplicate QC samples were analysed the maximum concentrations have been adopted for data interpretation purposes Concentrations in italics exceed adopted assessment criteria Closest land uses CI = commercialindustrial R = residential Chloroform (up to 530 microgm3) was also detected in WMS 8 WMS 11 WMS 14 WMS 16 WMS 18 WMS 19 WM 25 WMS 33 WMS 40 and WMS 41 interim soil vapour health investigation level (HIL)
Table 72 Comparison of CHC data for Round 1 and 2 WMStrade units
Bore ID
Depth (m)
Location CHC concentration (microgm3)
TCE PCE cis-12-DCE trans-12-DCE 11-DCE VC
WMS 8 10 Maria Street 12000 37 lt95 lt99 lt22 lt36
WMS 38 13000 56 lt11 lt11 lt25 lt41
Relative percentage difference 8 147 - - - -
WMS 11 10 Admella Street 71000 260 19 20 36 lt37
WMS 40 110000 97 lt11 lt11 lt25 lt41
Relative percentage difference 43 91 - - - -Notes Shaded cells indicate concentrations were below the laboratory LOR
80607-1 REV1 30102017 PAGE 33
EPA REF 0524111 FINAL REPORT STAGE 1 ENVIRONMENTAL ASSESSMENT THEBARTON ASSESSMENT AREA
73 Groundwater
731 Field measurements
A table of groundwater field parameters is presented in Appendix L (Table 3) and groundwater field sampling sheets are included in Appendix E
7311 Groundwater elevation and flow direction
The depth to water within the Q1 aquifer beneath the Thebarton EPA Assessment Area on 18 July 2017 ranged from 12323 to 15854 m below top of casing (BTOC)10 and 4469 to 5070 m AHD
Groundwater elevation contours constructed from the July 2017 gauging data indicated that the overall groundwater flow direction within the Q1 aquifer was north-westerly consistent with expected regional groundwater flow The groundwater contours and inferred flow direction are shown on Figure 4
7312 Field parameters
As detailed in Table 51 field measurements were recorded during low flow purging (ie prior to micropurge sampling) of monitoring wells and immediately following the collection of HydraSleeveTM samples
The field parameter readings recorded for the monitoring wells immediately prior to (low flow micropurge) and after (HydraSleeveTM) sampling indicated the following (as summarised in Table 3 Appendix L)
groundwater pH ranged from 6 8 to 79 thereby indicating neutral conditions
electrical conductivity (EC) measurements ranged from 189 to 556 mScm and were found to be reasonably consistent across the area thereby indicating that it is underlain by moderately saline water (ie approximating 1230 to 3620 mgL TDS11)
redox concentrations ranged from -20 to 624 mV thereby indicating slightly reducing to strongly oxygenating conditions
measured dissolved oxygen (DO) concentrations ranged from 04 to 78 ppm indicating slightly to highly oxygenated water and
temperature ranged from 173 to 224oC
Observations recorded during sampling indicated that the groundwater was clear to brown and only slightly to moderately turbid at most locations ndash the higher turbidity at MW18 and MW19 (combined with poor recharge) contributed towards the decision to use a HydraSleeveTM sampling method No odours or sheen were observed in any of the wells during gauging or sampling
10 ie approximating m BGL 11 ie calculated by multiplying the field EC data by 065
PAGE 34 80607-1 REV1 30102017
EPA REF 0524111 FINAL REPORT STAGE 1 ENVIRONMENTAL ASSESSMENT THEBARTON ASSESSMENT AREA
732 Hydraulic conductivity
Rising and falling head aquifer permeability (ldquoslugrdquo) tests were conducted on 10 groundwater wells (refer to Table 31 and Figure 2) to assess the hydraulic conductivity (K) of the Q1 aquifer
To obtain estimates of near-well horizontal hydraulic conductivity for each well tested the slug test data were analysed by Arcadis using AQTESOLV for Windowstrade (Duffield 2007) following the guidelines presented in Butler (1998) ndash normalised displacement data collected from each test are plotted against time in Appendix A of the Arcadis report (refer to Appendix O) Since only one set of tests were performed at each well the reproducibility of the results as well as the dependence of the results on the initial displacement could not be verified or demonstrated As such multiple relevant and applicable solutions were applied to each test to account for that uncertainty (ie to ensure consistency of normalised response at each well regardless of initial displacement)
Table 73 presents a summary of the range and average estimated hydraulic conductivity values (and corresponding analytical solutions used) for each well tested The results indicate that hydraulic conductivities ranged from approximately 0073 to 37 mday with an overall average of approximately 1 mday
Table 73 Hydraulic conductivities (rising and falling head tests)
Groundwater Test Type Range of Estimated Applied Analytical Average Well Hydraulic Conductivity Solution Estimated
(mday) Hydraulic Conductivity
(mday)
MW02 Falling head 011 to 014 DA CBP HV
012 Rising head 0073 to 015 BR DA
MW3 Falling head 034 to 062 BR DA
047 Rising head 030 to 062 BR DA
MW7 Falling head 075 to 25 BR DA
139 Rising head 055 to 175 BR DA
MW14 Falling head 011 to 021 BR DA
014 Rising head 009 to 015 BR DA
MW17 Falling head 21 to 22 DA KGS
220 Rising head 225 to 244 DA KGS
MW20 Falling head 22 to 37 BR DA HV
256 Rising head 06 to 32 BR DA
MW21 Falling head 073 to 123 BR DA
084 Rising head 054 to 084 BR DA
MW23 Falling head 088 to 162 BR DA
101 Rising head 031 to 122 BR DA
80607-1 REV1 30102017 PAGE 35
EPA REF 0524111 FINAL REPORT STAGE 1 ENVIRONMENTAL ASSESSMENT THEBARTON ASSESSMENT AREA
Groundwater Test Type Range of Estimated Applied Analytical Average Well Hydraulic Conductivity Solution Estimated
(mday) Hydraulic Conductivity
(mday)
MW25 Falling head 10 to 18 BR DA CBP HV
132 Rising head 049 to 17 BR DA
MW26 Falling head 019 to 036 BR DA
023 Rising head 010 to 029 BR DA
Overall average K (mday) 1028 Notes References BR = Bouwer and Rice (1976) CBP = Cooper et al (1967) DA = Dagan (1978) HV = Hvorslev (1951) KGS = Hyder et al (1994)
The monitoring wells that exhibited lower permeabilities (ie MW02 MW3 MW14 and MW26) were noted to be generally located in the up-gradient (south-eastern) portion of the Thebarton EPA Assessment Area whereas monitoring wells showing relatively higher permeabilities (ie MW7 MW17 MW20 MW21 MW23 and MW25) are generally located in the down-gradient (north-western) portion These results were considered by Arcadis to suggest a possible hydrogeologic transition from the south-east to the north-west AQTESOLV solution plots for each analysis are provided as Appendix A of the Arcadis report (Appendix O)
As slug test results can be influenced by a number of factors which are difficult to avoid when performing and analysing slug test results hydraulic conductivity estimates derived from slug tests should be considered to be the lower bound of the hydraulic conductivity of the formation in the vicinity of the well (Butler 1998) However Arcadis also noted that the results obtained for the Thebarton EPA Assessment Area were similar to those reported for other areas of Adelaide with average values of 1 and 27 mday (refer to Appendix O)
The slug test results were used by Arcadis in their groundwater fate and transport model (refer to Section 8)
733 Analytical results
Tables of groundwater analytical results are presented in Appendix L (Tables 4 and 5) and copies of certified laboratory reports are included in Appendix G
7331 Chlorinated hydrocarbon compounds
A table of CHC results is included in Appendix L (Table 4) and a plan showing their distribution in groundwater beneath the Thebarton EPA Assessment Area is included as Figure 5 Detectable CHC concentrations are summarised in Table 74 relative to the adopted potable and primary contact recreation criteria ndash the closest soil vapour bore locations are also detailed
PAGE 36 80607-1 REV1 30102017
EPA REF 0524111 FINAL REPORT STAGE 1 ENVIRONMENTAL ASSESSMENT THEBARTON ASSESSMENT AREA
Table 74 Detectable groundwater CHC results
Sample ID
Location CHC concentration (microgL) Closest soil vapour bore
TCE PCE cis-12shyDCE
trans-12-DCE
11-DCE VC Carbon tetrachloride
MW02 Admella Street 20000 38 7 15 SV5
MW3 Admella Street 69 SV1
MW5 Maria Street 29000 3 21 2 6 SV2 SV3
MW6 Maria Street 29 SV4
MW9 Albert Street 2 -
MW11 George Street 4900 3 4 1 7 SV6 SV7
MW12 George Street 700 SV8
MW14 Admella Street 1000 4 2 SV9
MW15 Albert Street 180 SV10
MW17 Chapel Street 24 -
MW18 Dew Street 5 -
MW20 Light Terrace 70 SV12
MW21 Light Terrace 23 SV13
MW23 Dew Street 21 -
MW25 Smith Street 2 5 -
MW26 Kintore Street 2 -
Potable 20 50 60 30 03 3
Primary contact recreation
30 500 600 300 30 30
Notes Shaded cells indicate concentrations were below the laboratory LOR Where (field) duplicate QC samples were analysed the maximum concentrations have been adopted for data interpretation purposes Concentrations in italics exceed adopted assessment criteria Chloroform was also detected in a number of wells (MW02 MW3 MW5 MW8 MW11 MW12 and MW19 to MW25) ndash refer to Table 4 in Appendix L Although no VC was detected the laboratory LOR (1 microgL) exceeded the adopted potable criterion NHMRCNRMMC (2011) Australian Drinking Water Guidelines TCE criterion from WHO (2017) Guidelines for Drinking-water Quality NHMRC (2008) Guidelines for Managing Risks in Recreational Water ndash based on NHMRCNRMMC (2011) Australian Drinking Water Guidelines TCE criterion from ANZECCARMCANZ (2000b) Australian and New Zealand Guidelines for Fresh and Marine Water Quality
The results indicate that the highest TCE concentrations (20000 to 29000 microgL) were measured in wells MW02 and MW5 located in the immediate vicinity of the former Austral property and that the TCE plume extends in a general north-westerly direction (ie consistent with the inferred groundwater flow direction
80607-1 REV1 30102017 PAGE 37
EPA REF 0524111 FINAL REPORT STAGE 1 ENVIRONMENTAL ASSESSMENT THEBARTON ASSESSMENT AREA
within the Q1 aquifer) Although lesser concentrations of PCE 12-DCE (cis- andor trans) andor 11-DCE were present in some wells no VC was detected and the main COPC was identified as TCE
A number of wells within the Thebarton EPA Assessment Area contained TCE concentrations that exceeded the adopted potable andor primary contact recreation criteria Although the extent of the TCE plume was not delineated to the north-west (but was delineated in all other directions) with detectable TCE concentrations (ie up to 21 microgL) identified beneath both Smith Street and Dew Street these concentrations were below the adopted primary contact recreation criterion (but not necessarily the adopted potable value ndash ie MW23)
The background well (MW4) located across James Congdon Drive (to the east of the southern portion of the Thebarton EPA Assessment Area) did not contain any measurable CHC concentrations
7332 Other measured groundwater parameters
Major cations and anions
The laboratory results obtained for the remaining groundwater analytes are summarised in Appendix L (Table 5)
The groundwater ionic data obtained from selected wells across the Thebarton EPA Assessment Area are graphically represented on a Piper diagram in Figure 71 The results indicate a relatively consistent groundwater composition across the area thereby indicating that the groundwater sampled from these wells is derived from a single aquifer Ionic charge balance ranged from 32 to 22 with the highest value (22) calculated for MW12 indicating that additional anions (ie not measured as part of this study) could be present
PAGE 38 80607-1 REV1 30102017
EPA REF 0524111 FINAL REPORT STAGE 1 ENVIRONMENTAL ASSESSMENT THEBARTON ASSESSMENT AREA
Figure 71 Piper diagram
Natural attenuation parameters
With respect to the measured natural attenuation parameters (ie DO nitrate iron sulfate CO2 and manganese) the following wells were selected based on their locations relative to the inferred extent of the CHC plume
MW26 located on Kintore Street to the south (and hydraulically up-gradient) of the former Austral property (ie the suspected source site)
MW02 and MW5 located within the immediate vicinity of the former Austral property and the area of maximum CHC contamination
MW9 MW12 and MW17 located on Albert Street George Street and Chapel Street respectively to the north-west (and hydraulically down-gradient) of the former Austral property
80607-1 REV1 30102017 PAGE 39
EPA REF 0524111 FINAL REPORT STAGE 1 ENVIRONMENTAL ASSESSMENT THEBARTON ASSESSMENT AREA
MW21 and MW22 located on Light Terrace and Cawthorne Street respectively to the northshywestnorth-north-west (and further hydraulically down-gradient) of the former Austral property and
MW8 and MW23 located on Smith Street and Dew Street respectively representing the furthest wells to the northnorth-west of the former Austral property
According to Wiedemeier et al (1998) the most important process in the degradation of CHC is the process of reductive dechlorination Although daughter products of TCE (ie 12-DCE) are present in groundwater (and soil vapour) at scattered locations within the Thebarton EPA Assessment Area they are not considered indicative of substantial breakdown of TCE ndash refer also to the Arcadis report in Appendix O as summarised in Section 8 In addition the analysis of the natural attenuation parameters data constituting physical and chemical indicators of biodegradation processes has not provided a definitive secondary line of evidence
74 Soil vapour bores A table of soil vapour bore analytical results is presented in Appendix L (Table 6) and a copy of the certified laboratory report is included in Appendix G
Of the soil vapour bores installed to 10 andor 30 m BGL within the Thebarton EPA Assessment Area the majority (ie with the exception of the 10 m deep bores installed as SV11 and SV13 and located on Light Terrace) returned measurable concentrations of CHC dominated by TCE and to a lesser extent (and only at some locations) PCE Detectable soil vapour CHC concentrations are summarised in Table 75 whereas CHC concentrations and inferred soil vapour TCE concentration contours are detailed on Figures 6 (1 m BGL) and 7 (3 m BGL)
The TCE results which have been used to predict indoor air concentrations as part of the VIRA (refer to Section 9) suggest the following
the highest concentration (1000000 microgL) was detected at 3 m BGL in soil vapour bore SV3 located in the vicinity of residential and commercialindustrial properties (including the former Austral property) on Maria Street
where nested wells were tested soil vapour CHC concentrations were higher at depth consistent with a groundwater source
TCE PCE and 11-DCE are all assumed to represent primary contaminants with 12-DCE representing a break-down product of TCE andor PCE
although no VC was detected the laboratory LOR in some samples (ie up to 490 microgm3 in samples with the highest measured TCE concentrations) was above the ASC NEPM (1999) interim soil vapour HIL for residential land use (30 microgm3) ndash refer to Table 53 and
although the extent of the soil vapour plume has apparently not been delineated (ie in any direction) by the existing soil vapour bores it extends in a north-westerly direction (and hydraulically down-
PAGE 40 80607-1 REV1 30102017
EPA REF 0524111 FINAL REPORT STAGE 1 ENVIRONMENTAL ASSESSMENT THEBARTON ASSESSMENT AREA
gradient) from the suspected source site (ie the former Austral property) and corresponds well with the groundwater TCE plume (refer to Figure 5)
A comparison of the results obtained for the WMStrade units (WMS 38 to WMS 41) deployed during the second round of sampling and the closest soil vapour bore data (10 m BGL) is provided in Table 76 Although the results indicate good correlation for TCE and PCE in SV5WMS 40 as well as TCE in SV7WMS 41 the remaining results were more variable ndash this supports the use of the WMStrade units as an initial (semishyquantitative) screening tool with follow-up soil vapour bore data considered to provide more quantitative results
Table 75 Detectable soil vapour bore CHC results for Thebarton EPA Assessment Area
Bore ID
Depth (m)
Location Closest land
uses
CHC concentration (microgm3)
TCE PCE cis-12shyDCE
trans-12-DCE
11-DCE VC
SV1 10 Admella Street CI and R 6300 78
30 21000 21
SV2 10 Maria Street CI and R 51000 39 21 39
30 940000
SV3 10 Maria Street CI and R 210000 6500 5900
30 1000000 15000 14000
SV4 10 Maria Street CI and R 17000 31
30 43000 90 30
SV5 10 Admella Street CI 100000 84
30 160000 310 20 33
SV6 10 George Street CI 22000 12
30 150000 56
SV7 10 George Street CI 22000 19
30 110000
SV8 10 George Street CI 2300 62
30 14000 19
SV9 10 Chapel Street CI 170
30 260
SV10 10 Albert Street CI 93
30 51
SV12 10 Light Terrace CI 16
30 55 ASC NEPM (1999) HIL - Residential 20 2000 80 - - 30 ASC NEPM (1999) HIL ndash Commercialindustrial 80 8000 300 - - 100
Notes Shaded cells indicate concentrations were below the laboratory LOR
80607-1 REV1 30102017 PAGE 41
EPA REF 0524111 FINAL REPORT STAGE 1 ENVIRONMENTAL ASSESSMENT THEBARTON ASSESSMENT AREA
Where (field andor laboratory) duplicate QC samples were analysed the maximum concentrations have been adopted for data interpretation purposes Concentrations in italics exceed adopted assessment criteria Closest land uses CI = commercialindustrial R = residential Chloroform was also detected in a number of samplesinterim soil vapour health investigation level (HIL)
Table 76 Comparison of CHC data for Round 2 WMStrade units and closest soil vapour bores
Bore ID
Depth (m)
Location CHC concentration (microgm3)
TCE PCE cis-12-DCE trans-12-DCE 11-DCE VC
SV2 10 Maria Street 51000 39 21 lt13 39 lt89
WMS 38 13000 56 lt11 lt11 lt25 lt41
Relative percentage difference 119 150 - - - -
SV4 10 Maria Street 17000 31 lt18 lt14 lt14 lt92
WMS 39 1300 lt52 lt11 lt11 lt25 lt41
Relative percentage difference 172 - - - - -
SV5 10 Admella Street 100000 84 lt44 lt33 lt33 lt22
WMS 40 110000 97 lt11 lt11 lt25 lt41
Relative percentage difference 95 14 - - - -
SV7 10 George Street 22000 19 lt37 lt27 lt27 lt18
WMS 41 18000 10 lt11 lt11 lt25 lt41
Relative percentage difference 20 62 - - - -Notes Shaded cells indicate concentrations were below the laboratory LOR
PAGE 42 80607-1 REV1 30102017
EPA REF 0524111 FINAL REPORT STAGE 1 ENVIRONMENTAL ASSESSMENT THEBARTON ASSESSMENT AREA
8 GROUNDWATER FATE AND TRANSPORT MODELLING
Arcadis were commissioned by Fyfe to undertake preliminary fate and transport modelling of the groundwater CHC impacts detected within the Thebarton EPA Assessment Area based on the recently obtained groundwater data The Arcadis report is included as Appendix O
The aim of the modelling was to provide a preliminary estimate of the future extent of CHC impacted groundwater within the Thebarton area in order that potential future groundwater restrictions could be applied by the EPA (ie via the potential future definition of a GPA) to protect human health
81 Groundwater flow modelling
The MODFLOW code a publicly-available groundwater flow simulation program developed by the United States Geological Survey (USGS) as described by McDonald and Harbaugh (1988) was used to construct a groundwater flow model It was developed for a horizontal area of approximately 25 km2 (ie to minimise possible boundary effects within the assessment area itself12) and was rotated 45deg counter-clockwise to align with the prevailing (north-westerly) groundwater flow direction The model extended approximately 23 km in a south-east to north-west direction and approximately 11 km in a south-west to north-east direction (ie perpendicular to groundwater flow) Whereas a 4 m grid spacing was used within the area of the plume and its migration pathway (ie to enhance model accuracy and precision) a broader 15 m grid was adopted outside the specific area of interest Vertically the model adopted a single 20 m thick layer as representative of the hydrostratigraphy of the Q1 aquifer sediments beneath the area but it was noted that only the bottom portion (ie few metres) of this model layer are actually saturated and therefore active in the model
An informal sensitivity analysis performed as part of the model calibration process indicated that the model was most sensitive to changes in hydraulic conductivity and recharge ndash this was not unexpected given the relatively flat hydraulic gradient and relatively narrow range of estimated values for both model parameters (ie based on reasonably low uncertainty) The final calibrated value for aquifer recharge adopted in the model was 295 mmyear consistent with results reported for nearby sites as well as regional estimates Likewise the final calibrated hydraulic conductivity values for the up-gradient (06 mday) and down-gradient (2 mday) zones were consistent with both the site-specific slug test data and results obtained for other nearby EPA assessment areas The final calibrated down-gradient constant head elevation was 15 m AHD It was concluded by Arcadis that the groundwater flow model was well calibrated and could therefore serve as an appropriate basis for the development of a site-specific solute transport model
82 Solute transport modelling
A site-specific (three-dimensional) solute transport model using the MT3DMS transport code of Zheng (1990) was developed by Arcadis to predict the fate and transport of groundwater contaminants (specifically
12 Further information regarding boundary effects is provided in the Arcadis report (Appendix O)
80607-1 REV1 30102017 PAGE 43
EPA REF 0524111 FINAL REPORT STAGE 1 ENVIRONMENTAL ASSESSMENT THEBARTON ASSESSMENT AREA
CHC) under current conditions over a period of 100 years This dual-domain mass transport model was used in conjunction with the groundwater flow model developed through the use of MODFLOW (as detailed above) assuming the following
The primary COPC is TCE ndash the initial concentration distribution of TCE in groundwater was based on the recent (July 2017) monitoring data
The age of the groundwater TCE plume was assumed to be up to about 90 years ndash ie based on the history of industrial land use (specifically the former Austral facility) in the area
Although lesser amounts of other CHC are present in groundwater the lack of significant daughter products of TCE has been interpreted to indicate that substantial biodegradation is not occurring (ie as a conservative approach)
Although a CHC source was not explicitly incorporated into the solute transport model the MT3DMS transport code indirectly accounts for on-going contaminant mass contribution to the dissolved-phase plume
The fate and transport of TCE within the area of interest involves the processes of advection adsorption dilution and diffusion ndash however given that recharge via the infiltration of precipitation was considered to be insignificant dilution effects were assumed to be minimal
Two porosity values (ie dual domain) are relevant to the movement of contaminants in the subshysurface with adopted values based on site-specific geology and Payne et al (2008) ndash whereby the two domains are in equilibrium
― mobile porosity that portion of the formation with the highest permeability where advective transport dominates ndash assumed to be 5 (high) 10 (intermediate) or 15 (low) for different mobility transport conditions and
― immobile porosity lower permeability portions of the formation where diffusion is dominant ndash assumed to be 15
As discussed in Section 732 hydraulic conductivity values of 06 mday (south-eastern approximate quarter of the modelling area) and 2 mday (northern approximate three-quarters of the modelling area) were adopted to reflect the hydrogeologic transition (ie from the south-east to the north-west) interpreted from the slug test data
The adopted TCE retardation factor of 147 for intermediate mobility transport conditions was based on the following
― an assumed organic carbon fraction of 01 (US EPA 1996 amp 2009) ndash this was varied to 005 and 2 to assess alternate (ie high versus low) mobility transport conditions
― an assumed organic carbon adsorption co-efficient of 61 Lkg (US EPA 2017a)
PAGE 44 80607-1 REV1 30102017
EPA REF 0524111 FINAL REPORT STAGE 1 ENVIRONMENTAL ASSESSMENT THEBARTON ASSESSMENT AREA
― a calculated partition co-efficient of 0061 Lkg ndash this was varied to 129 and 178 Lkg to assess alternate (ie high versus low) mobility transport conditions and
― an average soil bulk density of 192 gcm3 (based on measured geochemical data ndash refer to Table 1 Appendix L)
An optimum mass transfer co-efficient (MTC) was based on simulated flux distribution in the groundwater flow model whereby
― the calculated MTC in the model ranged from approximately 38E-08day-1 to 37E-05 day-1 and
― the average MTC was 185E-05day-1
The site-specific solute transport model was used in predictive mode to assess the long-term (eg 100 year) potential migration of the groundwater TCE plume and to support the EPA in the potential future definition of an appropriate GPA The model was calibrated against the current extent (ie concentrations of TCE above 1 microgL have migrated approximately 500 m from the suspected source site13) and expected age (ie up to about 90 years) of the plume The results indicate that the leading edge of the TCE (ie the 1 microgL contour) is estimated to migrate between approximately 400 and 620 m over a period of 100 years under low to high mobility transport conditions14 with intermediate transport conditions resulting in an estimated migration of 500 m By comparison no significant lateral plume expansion would be expected to occur Figures 5 to 17 of the Arcadis report (Appendix O) show the predicted extent of the TCE plume at 5 10 50 and 100 years under low to high mobility transport conditions
Figure 81 shows the predicted extent of the 1 microgL TCE boundary in 100 years under intermediate transport conditions ndash it is recommended that this information be used to support the EPA in establishing a potential future GPA
The Arcadis report notes that given the available site information (site history potential source area(s) and uncertainty associated with the current plume extent) and degree of model calibration (flow model parameter values are consistent with site-specific data as well as regionalnearby studies while transport parameter values are consistent with literatureindustry standards) the model-predicted migration of approximately 500 m over 100 years is considered to be a reasonable representation of future conditions
Key uncertainties associated with the modelling were identified as including the following
current plume extents (ie down-gradient delineation)
site-specific fraction organic values (or site-specific partition coefficient estimates) and
site-specific porosity estimates
13 although it was noted that there is uncertainty with respect to the current extent of the TCE plume since all three down-gradient monitoring wells (MW18 MW23 and MW25) have TCE concentrations above 1 μgL
14 ie assuming different values for mobileimmobile porosity the TCE distribution (sorption) coefficient and the TCE retardation factor
80607-1 REV1 30102017 PAGE 45
EPA REF 0524111 FINAL REPORT STAGE 1 ENVIRONMENTAL ASSESSMENT THEBARTON ASSESSMENT AREA
Lesser uncertainties were considered to include site-specific bulk hydraulic conductivity estimates and determination of the presence or absence of naturally-occurring TCE degradation
Additional site investigation and data collection (eg multi-well pumping tests for bulk hydraulic conductivity estimates site-specific fraction organic carbon andor distribution (sorption) coefficient additional down-gradient plume delineation) would help to further refine the model and increase confidence in the predictive results
Figure 81 Predictive TCE (1 microgL) plume extent after 100 years (ie shown in green) relative to the boundary of the Thebarton EPA Assessment Area (red) and the extent of the modelling area (purple)
PAGE 46 80607-1 REV1 30102017
EPA REF 0524111 FINAL REPORT STAGE 1 ENVIRONMENTAL ASSESSMENT THEBARTON ASSESSMENT AREA
9 VAPOUR INTRUSION RISK ASSESSMENT
Arcadis were commissioned by Fyfe to undertake a Vapour Intrusion Risk Assessment (VIRA) of the soil vapour CHC impacts detected within the Thebarton EPA Assessment Area based on the recently obtained (ie August 2017) permanent soil vapour bore data The Arcadis report is included as Appendix P
91 Objective
The main objective of the VIRA was to evaluate the potential risk to human health from vapour intrusion related to the concentrations of CHC identified in soil vapour within the Thebarton EPA Assessment Area
92 Areas of interest
The following areas of specific interest (ie located within the Thebarton EPA Assessment Area) were identified for the purpose of this VIRA
commercialindustrial properties (assumed slab on grade construction) including the former Austral property (ie the suspected source site) and
residential properties (slab on grade crawl space and basement constructions)
Potential exposure by trenchmaintenanceutility workers has also been considered (qualitatively)
93 Risk assessment approach
The VIRA was conducted in accordance with the ASC NEPM (1999) enHealth (2012a) and other relevant Australian guidance documents as well as guidance documents issued by the US EPA and other international regulatory agencies (where applicable)
The conduct of the risk assessment was based on a multiple lines of evidence approach using the available site-specific information collected as part of the scope of works detailed in Section 32
The following information was used as a basis for the VIRA
CHC including TCE PCE and DCE (11- cis-12- and trans-12-) have been identified within soil vapour andor groundwater within the Thebarton EPA Assessment Area ndash the analytical data indicate that TCE constitutes between about 95 and 100 of the CHC identified in groundwater and soil vapour
TCE has been considered as the risk driver for the VIRA (ie based on its toxicity and concentrations in soil vapour and groundwater) ndash although TCE PCE 12-DCE 11-DCE and VC have all been included as COPC for the Tier 1 screening assessment (Section 94) the Tier 2 assessment (Section 95) has
80607-1 REV1 30102017 PAGE 47
EPA REF 0524111 FINAL REPORT STAGE 1 ENVIRONMENTAL ASSESSMENT THEBARTON ASSESSMENT AREA
concentrated on TCE PCE and 11-DCE (ie due to their presence at concentrations that exceeded the adopted Tier 1 screening criteria)
The CHC identified within the Thebarton EPA Assessment Area are volatile chemicals and could potentially pose a risk to human health via the vapour intrusion pathway Although the source area has yet to be confirmed the CHC concentrations observed in groundwater and soil vapour are considered likely to have originated from the former Austral property (as discussed in Section 12)
The natural soils underlying the fill material (where present) in the Thebarton EPA Assessment Area are typified by the Quaternary age soils and sediments of the Adelaide Plains with the Pooraka Formation and Hindmarsh Clay units considered to dominate the upper soil profile
The soil geotechnical data and soil vapour results collected by Fyfe (as discussed in Sections 712 and 74 respectively) have been used for the VIRA
A two-tier approach was adopted for the VIRA The first tier (herein referred to as the Tier 1 assessment) was conducted by comparing the measured soil vapour TCE concentrations to published guideline values adjusted (conservatively) to account for attenuation from sub-slab soil into indoor air The second tier (herein referred to as the Tier 2 assessment) involved the comparison of predicted indoor air TCE concentrations to adopted indoor air criteria or response levels
94 Tier 1 assessment
As detailed in Section 74 the initial Tier 1 (screening risk) assessment involved comparing measured soil vapour COPC concentrations with the ASC NEPM (1999) interim soil vapour HILs for residential and commercialindustrial land uses (refer to Table 74) Given that the development of the interim soil vapour HILs was based on very conservative assumptions the initial Tier 1 assessment provided only a first-pass screening assessment of the data to determine if further risk assessment would be required
The interim soil vapour HILs are applicable for the assessment of soil vapour at 0 to 1 m beneath the floor of a building They were based on adopted toxicity reference values (TRV) and relevant exposure parameters (ie adjusted for different land uses) as well as an assumed soil vapour to indoor air attenuation factor of 01
The soil vapour to indoor air attenuation factor (01) was based on the US EPA (2002) recommended default attenuation factors for the generic screening step of a tiered vapour intrusion assessment process As discussed in the US EPA (2002) document the default attenuation factor of 01 for sub-slab soil vapour was based on a US EPA database of empirical attenuation factors calculated using measurements of indoor air and soil vapours from different sites In 2012 the US EPA provided an updated database which was accompanied by an evaluation and statistical analysis of attenuation factors for volatile CHC in residential buildings US EPA (2012) found the sub-slab to indoor air attenuation factor of 003 to be the 95th percentile In 2015 the revised sub-slab attenuation factor (003) was adopted by the US EPA
PAGE 48 80607-1 REV1 30102017
EPA REF 0524111 FINAL REPORT STAGE 1 ENVIRONMENTAL ASSESSMENT THEBARTON ASSESSMENT AREA
The revised sub-slab to indoor air attenuation factor of 003 was adopted to derive modified residential and commercialindustrial soil vapour HILs for the Tier 1 assessment The modified residential soil vapour HILs are presented in Table 91 relative to the maximum CHC concentrations obtained for soil vapour within the Thebarton EPA Assessment Area
The Tier 1 assessment based on a comparison of the COPC concentrations measured in soil vapour at various locations within the Thebarton EPA Assessment Area with the modified residential soil vapour HILs detailed in Table 91 indicated the following
TCE concentrations exceeded the adopted criterion in SV1 to SV9 whereas
the concentrations of PCE and 11-DCE exceeded the adopted criteria in SV3 only
These locations were identified as requiring further assessment (ie Tier 2 VIRA ndash refer to Section 95)15
Table 91 Tier 1 assessment ndash ASC NEPM (1999) and modified residential soil vapour HILs
Compound ASC NEPM (1999) HIL
(microgm3)
Modified Tier 1 HIL (microgm3)
(AF = 003)
Maximum measured soil vapour concentration (microgm3)
Acceptable
Location 1 m BGL Location 3 m BGL
11-DCE 7000 SV3 5900 SV3 14000 No ndash Tier 2 required
cis-12-DCE 80 265 SV2 21 SV4 30 Yes
trans-12-DCE 80 265 - ND SV5 20 Yes
PCE 2000 6650 SV3 6500 SV3 15000 No ndash Tier 2 required
TCE 20 65 SV3 210000 SV3 100000 0
No ndash Tier 2 required
VC 30 100 - ND - ND Yes Notes Values in bold exceed the modified residential soil vapour HILs cis-12-DCE HIL adopted as surrogate screening criterion based on US EPA (2017b) regional screening level for residential air elevated laboratory LOR (ie above modified Tier 1 HIL) also reported Abbreviations AF = attenuation factor HIL = health investigation level ND = non detect
95 Tier 2 assessment
951 Tier 2 assessment criteria
The Tier 2 VIRA criteria for the residential zone comprise HIL-based residential indoor air criteria for the COPC (refer to Section 94) along with the residential indoor air level response ranges for TCE that were
15 Note that all locations were subjected to the Tier 2 VIRA in this assessment
80607-1 REV1 30102017 PAGE 49
EPA REF 0524111 FINAL REPORT
STAGE 1 ENVIRONMENTAL ASSESSMENT
THEBARTON ASSESSMENT AREA
initially developed by the EPA and SA Health for the EPA Assessment Area at Clovelly Park and Mitchell
Park These screening criteria and indoor air response ranges as detailed in SA EPA (2014) and
reproduced in Figure 91 are now widely adopted in South Australia for the assessment of TCE relating
to indoor air exposure
Figure 91 TCE indoor air screening criteria and the corresponding site-specific response levels
Note The no action response level is applicable where a soil vapour concentration is below the laboratory LOR (ie ND or ldquonon-
detectrdquo assumed to be lt01 microgm3)
PAGE 50 80607-1 REV1 | 30102017
EPA REF 0524111 FINAL REPORT STAGE 1 ENVIRONMENTAL ASSESSMENT THEBARTON ASSESSMENT AREA
952 Vapour intrusion modelling
For this VIRA exposure point concentrations (EPCs) of COPC in the indoor air of buildings with a slab on grade crawl space or basement construction were estimated using conservative screening assumptions and the Johnson and Ettinger (1991) vapour transport and mixing model (ie the JampE model)
The algorithms applied in the JampE (1991) model are detailed in Appendix A of the Arcadis report whereas the modelling spreadsheets for each scenario are provided in Appendix B ndash the Arcadis report is attached to this report as Appendix P
9521 Input parameters
The input parameters adopted for the vapour intrusion modelling relate to the following
the construction type and details of existing or proposed buildings ndash refer to Table 92 for adopted building input parameters
the nature of the soil profile ndash refer to Table 93 for adopted soil input parameters (0 to 1 m BGL) and
the contaminant source concentrations ndash refer to Table 6 in Appendix L
Table 92 Tier 2 vapour intrusion modelling ndash building input parameters
Parameter Units Adopted value Reference
Residential Commercial industrial
Width of Building cm 1000 2000 Friebel and Nadebaum (2011)
Length of Building cm 1500 2000
Height of Room cm 240 300
Height of crawl space cm 30 - Assumption for crawl space
Attenuation from basement to ground floor air
- 01 01 Friebel and Nadebaum (2011)
Air Exchange Rate (AER)
Indoor per hour 06 083 Friebel and Nadebaum (2011)
Crawl space per hour 06 - Friebel and Nadebaum (2011)
Basement per hour 06 - As per residential (indoor)
Fraction of Cracks in Walls and foundation
- 0001 0001 Friebel and Nadebaum (2011)
Qsoil cm 3s 300 277 Calculated from QsoilQbuilding ratio of 0005 (residential) and 0001 (commercial)
80607-1 REV1 30102017 PAGE 51
EPA REF 0524111 FINAL REPORT STAGE 1 ENVIRONMENTAL ASSESSMENT THEBARTON ASSESSMENT AREA
Table 93 Tier 2 vapour intrusion modelling ndash soil input parameters
Parameter Units Adopted value Reference
Depth cm 100 Depth of shallow soil vapour data
Total porosity - 047 Site specific geotechnical data ndash ie averaged from MW3 and MW11 shallow samples (refer to Table 1 in Appendix L) Air filled porosity - 030
Water filled porosity - 017 Notes ie representing a conservative approach whereby data for the shallow samples with the highest total porosity and lowest degree of saturation (and therefore the highest air filled porosity) have been adopted
The site specific attenuation factors calculated within the vapour intrusion models (Appendix B of the Arcadis report) are summarised in Table 94 These are chemical and depth specific values applicable to each building construction scenario These attenuation factors have been applied to the soil vapour data measured across the Thebarton EPA Assessment Area to calculate indoor air concentrations (residential properties only) in proximity to each soil vapour location ndash for commercialindustrial properties (slab on grade) indoor air concentrations have only been calculated with respect to the soil vapour data obtained for SV3 (ie the soil vapour bore with the highest measured TCE concentrations)
Table 94 Adopted attenuation factors for TCE in soil vapour to indoor air
Scenario Attenuation factor
Residential ndash slab on grade 706 x 10-4
Residential ndash crawl space 209 x 10-3
Residential ndash basement 113 x 10-1
Commercial ndash slab on grade 408 x 10-4
Notes ie soil vapour intrusion to indoor air of residential living spaces refer to Section 953 for a discussion of potential vapour intrusion risks associated with commercialindustrial properties
The chemical parameters of the COPC adopted in the JampE model were updated with data from the chemical database in the Risk Assessment Information System (RAIS 2016) as detailed in Table 95
Table 95 Summary of chemical parameters adopted for vapour intrusion modelling
Chemical Diffusivity in Air Diffusivity in Water Solubility Henryrsquos Law Molecular weight (Dair) Water (Dwater) (S) Constant 25oC (gmol)
(cm2s) (cm2s) (mgL) (unitless)
11-DCE 00863 0000011 2420 107 969
PCE 00505 000000946 206 0724 166
TCE 00687 00000102 1280 0403 131
PAGE 52 80607-1 REV1 30102017
EPA REF 0524111 FINAL REPORT STAGE 1 ENVIRONMENTAL ASSESSMENT THEBARTON ASSESSMENT AREA
9522 Predicted indoor air concentrations
Residential The predicted indoor air concentrations for each soil vapour data point as calculated by Arcadis for the three residential building scenarios (ie slab on grade crawl space and basement) are presented in Appendix C of the Arcadis report (included in this report as Appendix P)
Table 96 provides a comparison of predicted indoor air concentrations against the EPA response levels detailed in Section 951 (Figure 91) ndash ie using the 1 m soil vapour data space for slab on grade and crawl space scenarios versus the 3 m soil vapour data for basements
It should be noted that if residential properties within the Thebarton EPA Assessment Area have basements however the vapour intrusion risks will increase whereas slab on grade construction will carry a lesser vapour intrusion risk (as detailed in Table 96)
Commercialindustrial The predicted indoor air concentrations as calculated by Arcadis for a commercialindustrial (ie slab on grade) land use scenario with respect to the soil vapour data obtained for SV3 (ie maximum measured soil vapour concentrations) are as follows
11-DCE 3 microgm3
PCE 19 microgm3 and
TCE 86 microgm3
As these values are not directly comparable to the EPA response levels developed for residential land use further discussion of potential vapour intrusion risks to human health under a commercialindustrial land use
scenario is included in Section 953
As discussed for residential properties the vapour intrusion risks may increase if basements are present
80607-1 REV1 30102017 PAGE 53
EPA REF 0524111 FINAL REPORT STAGE 1 ENVIRONMENTAL ASSESSMENT THEBARTON ASSESSMENT AREA
Table 96 Comparison of predicted residential indoor air concentrations with SA EPA response levels
Indoor Air Concentration Ranges (microgmsup3) SA EPA response levels
non-detect No action
gt non-detect to lt2 Validation
2 to lt20 Investigation
20 to lt200 Intervention
ge200 Accelerated Intervention
Soil vapour bore
Sample depth
(m)
Soil vapour TCE concentration
(microgmsup3)
Predicted indoor air concentration (microgmsup3)
Residential scenario
Slab on grade Crawl space Basement
Attenuation factor
7 x 10⁻⁴ 2 x 10⁻³ 1 x 10⁻¹
SV1 10 5700 4 11
SV1 30 21000 2100
SV2 10 51000 36 102
SV2 30 890000 89000
SV2 (FD) 30 940000 94000
SV3 10 210000 147 420
SV3 30 1000000 100000
SV4 10 17000 12 34
SV4 30 43000 4300
SV5 10 100000 70 200
SV5 30 160000 16000
SV6 10 22000 15 44
SV6 (FD) 10 22000 15 44
SV6 30 150000 15000
SV6 (FD) 30 140000 14000
SV7 10 22000 15 44
SV7 30 110000 11000
SV8 10 2300 2 5
SV8 30 14000 1400
SV9 10 170 012 030
SV9 30 260 26
SV10 10 9 0007 0019
SV10 30 51 51
SV11 10 lt18 - -
SV12 10 16 0011 0032
SV12 30 55 55
SV13 10 lt21 - -
PAGE 54 80607-1 REV1 30102017
EPA REF 0524111 FINAL REPORT STAGE 1 ENVIRONMENTAL ASSESSMENT THEBARTON ASSESSMENT AREA
Notes With respect to the predicted indoor air CHC concentrations in the Arcadis VIRA report (refer to Appendix P) the results in Table 5 were calculated for SV3 using the unrounded attenuation factors presented in Appendix B (and Table 94 of this report) whereas the TCE indoor air concentrations in Appendix C (as summarised in Table 96) were calculated using rounded attenuation factors ndash this does not change the overall interpretation of the results Abbreviations FD = field duplicate
9523 Sensitivity analysis
Table 97 presents a qualitative sensitivity analysis for some of the input variables used in the modelling ndash it includes the range of practical values for each variable the value used in the risk assessment the relative model sensitivity and the uncertainty associated with the variable
Although Arcadis note that a number of parameters used within the risk assessment have a moderate degree of uncertainty associated with them thereby suggesting that the modelling may be sensitive to changes in these parameters values used to define these parameters were selected to be conservative This is considered to have resulted in an assessment which is expected to be conservative and to over-estimate actual risk
Table 97 Summary of model input parameters subjected to sensitivity analysis
Input Range of values Value adopted Sensitivity of calculated input parameters variable
Soil physical parameters
Total porosity
Varies by soil type generally 03 to 05
047 Site-specific
Indoor air concentrations will decrease with increasing total porosity Moderate sensitivity parameter decreasing by 50 will increase predicted concentration by a factor of 4
Air filled porosity
Varies by soil type generally 015 to 03
03 Site-specific
Indoor air concentrations will increase with increasing air filled porosity Moderate to high sensitivity parameter reduction by 50 decreases concentration by a factor of 10
Water filled porosity
Varies by soil type from 005 (fill or
sand) to 03 (clay)
017 Site-specific
Negligible impact on predicted indoor air concentrations although may decrease with increasing moisture content Very low sensitivity parameter
Building parameters
Air exchange rate (AER)
Varies from 05 hr-1
in smaller buildings to gt2 hr-1
06 hr-1 for residential structures
083 hr-1 for commercial
Indoor air concentrations will decrease with increasing air exchange Moderate sensitivity parameter has linear relationship with predicted concentrations conservative assumptions used
80607-1 REV1 30102017 PAGE 55
EPA REF 0524111 FINAL REPORT STAGE 1 ENVIRONMENTAL ASSESSMENT THEBARTON ASSESSMENT AREA
Input Range of values Value adopted Sensitivity of calculated input parameters variable
Advective flow rates
Varies depending on building size and
AER
300 cm3sec Calculated from building AER and
ratio of 0005
Indoor air concentrations will increase with increasing advective flow Low sensitivity parameter particularly within normal range of potential values The assumption that advective flow is occurring into a building at all times is generally conservative for Australian settings Advection is unlikely to occur under a crawl space home and diffusive transport is the dominant transport mechanism
Building size Variable Variable consistent with
Friebel and Nadebaum (2011)
Indoor air concentrations decrease with increasing building volume
Very low sensitivity parameter
9524 Uncertainties
The following uncertainties were identified in the Arcadis report (Appendix P)
Vapour transport modelling
The use of a model to predict the migration of vapour from a sub-surface source to indoor air requires the simplification of many complex processes in the sub-surface as well as the potential for entry and dispersion within a building or outdoor air To address this simplification the vapour models available (and adopted in this assessment) are considered to be conservative such that uncertainties are addressed through the overshyestimation of likely concentrations
It should be noted that the vapour model used is designed to be a first tier screening tool and is considered likely to over-estimate air concentrations due to the incorporation of a number of conservative assumptions including the following
chemical concentrations in soil vapour were assumed to remain constant over the duration of exposure (ie it was assumed that the source was non-depleting and not subject to natural biodegradation processes)
the maximum reported soil vapour concentrations were assumed to be present beneath nearby dwellings and
the occurrence of steady well-mixed vapour dispersion within the enclosed or ambient mixing space
Overall the vapour modelling undertaken is expected to provide an over-estimation of the actual vapour exposure concentrations
PAGE 56 80607-1 REV1 30102017
EPA REF 0524111 FINAL REPORT STAGE 1 ENVIRONMENTAL ASSESSMENT THEBARTON ASSESSMENT AREA
Toxicological Data
In general the available scientific information involves the extrapolation of toxicity information from studies involving experimental laboratory animals with some validation of observable health effects obtained through epidemiological studies
This may introduce two types of uncertainties into the risk assessment as follows
those related to extrapolating from one species to another and
those related to extrapolating from the high exposure doses usually used in experimental animal studies to the lower doses usually estimated for human exposure situations
In order to adjust for these uncertainties toxicity values commonly incorporate safety factors that may vary from 10 to 10000
Overall the toxicological data presented in this assessment are considered to be current and adequate for the assessment of risks to human health associated with potential exposure to the COPC identified The uncertainties inherent in the toxicological values adopted are considered likely to result in an over-estimation of actual risk
953 Potential vapour intrusion risks associated with commercialindustrial properties
An assessment of potential vapour intrusion risks to workers at commercialindustrial properties (slab on grade construction) within the Thebarton EPA Assessment Area was undertaken by Arcadis using the methodology published by US EPA (2009) and incorporated into the ASC NEPM (1999) This approach recommends adjustment of the measured or estimated contaminant concentrations in air to account for site specific exposures by the relevant receptors as follows
Ca ET EF EDECinh = days hours AT 365 24 year day
Where
ECinh = Exposure Adjusted Air Concentration (mgm3) Ca = Chemical Concentration in Air (mgm3) ET = Exposure Time (hoursday) EF = Exposure Frequency (daysyear) ED = Exposure Duration (years) AT = Averaging Time (years)
= 70 years for non-threshold carcinogens = ED for chemicals assessed based on threshold effects
80607-1 REV1 30102017 PAGE 57
EPA REF 0524111 FINAL REPORT STAGE 1 ENVIRONMENTAL ASSESSMENT THEBARTON ASSESSMENT AREA
Exposure parameters were selected from Australian sources (enHealth 2012b ASC NEPM 1999) for the receptor groups evaluated or were based on site specific factors Table 98 presents an overview of the parameters used whereas adopted inhalation TRVs are presented in Table 99
Risk was characterised for threshold and non-threshold effects for the COPC ndash spreadsheets presenting the risk calculations are provided in Appendix B of the Arcadis report (as included in Appendix P) For commercialindustrial properties the non-threshold risk level was calculated to be 3 x 10⁻⁵ (compared to a target risk level of 1 x 10⁻⁵) whereas the threshold risk level was calculated to be 10 (compared to a target risk level of 1) ndash these results indicated a potentially unacceptable vapour intrusion risk to commercialindustrial workers in the vicinity of the maximum soil vapour CHC concentrations (ie at SV3 ndash worst-case scenario based on maximum soil vapour concentrations)
Table 98 Exposure parameters ndash Commercialindustrial workers
Exposure parameter Units Value Reference
Exposure frequency days year 365 ASC NEPM (1999)
Exposure duration years 30 ASC NEPM (1999)
Exposure time indoors hoursday 8 ASC NEPM (1999)
Averaging time
Non-threshold
threshold
Years
years
70
30 ASC NEPM (1999)
Table 99 Adopted inhalation toxicity reference values
COPC Toxicity reference values
Non-threshold (microgm3)
Reference Threshold (microgm3)
Reference
11-DCE NA - 80 ATSDR (1994)
PCE NA - 200 WHO (2006)
TCE 41 US EPA (2011) IRIS 2 US EPA (2011) IRIS Notes Abbreviations NA = not applicable
954 Potential risks to trenchmaintenanceutility workers
Although trenchmaintenanceutility workers may be exposed to soil vapour concentrations as measured at 1 m BGL due to the short-term nature of such works their total intakes of TCE and other CHC will be low Assuming that a trenchmaintenanceutility worker may be exposed to TCE for a limited number of working days throughout the year (eg 20 days of 8 hours duration within an excavation) their intake will be approximately one fiftieth of the intake of a resident (who is assumed to be exposed 21 hours a day for 365 days a year)
PAGE 58 80607-1 REV1 30102017
EPA REF 0524111 FINAL REPORT STAGE 1 ENVIRONMENTAL ASSESSMENT THEBARTON ASSESSMENT AREA
Therefore the management of exposures by trenchmaintenanceutility workers may be required in areas where TCE at 1 m BGL is greater than 100 microgm3 (or 50 times the acceptable concentration for indoor air)
96 Conclusions
On the basis of the available data and the assessment presented in the Arcadis VIRA report (Appendix P) the following conclusions were provided
Health risks for residents due to the intrusion of CHC in soil vapour into residential buildings with a slab on grade crawl space or basement construction were calculated to be above the adopted EPA response levels and risks to residents may therefore be unacceptable within some parts of the Thebarton EPA Assessment Area
Health risks for commercial workers due to the intrusion of CHC in soil vapour into buildings with a slab on grade construction were calculated to be above the adopted target risk levels and risks to workers may therefore be unacceptable within some parts of the Thebarton EPA Assessment Area
In the absence of specific information regarding building construction within the Thebarton EPA Assessment Area the predicted indoor air concentrations calculated from the 1 m BGL soil vapour data for a residential crawl space scenario are summarised in Table 910
Table 910 Summary of properties with predicted indoor air concentrations (residential crawl space) above adopted EPA response levels
EPA response level No of residential properties affected Indoor air concentration (microgm3) Response
non-detect to lt2 Validation 9
2 to lt20 Investigation 10
20 to lt200 Intervention 8
ge200 Accelerated intervention 3 Notes According to information provided by the EPA there are approximately 130 residential properties located in the Thebarton EPA Assessment Area calculated on the basis of cadastral boundaries ndash some properties host more than one residence whereas some have one residence across two properties andor also host a commercial facility ndash these data would therefore need to be confirmed via a property survey
80607-1 REV1 30102017 PAGE 59
EPA REF 0524111 FINAL REPORT STAGE 1 ENVIRONMENTAL ASSESSMENT THEBARTON ASSESSMENT AREA
10 CONCEPTUAL SITE MODEL
As detailed in Table 101 a CSM has been developed for the Thebarton EPA Assessment Area on the basis of historical information (as summarised in Section 12 as well as Appendices A and B) and the data obtained during the recent Fyfe investigation program
Table 101 Summary of existing information for the Thebarton EPA Assessment Area
Topic Summarised Information
Site Characterisation
Identification of Assessment Area
An approximately 27 ha Assessment Area located within the suburb of Thebarton has been defined by the EPA The boundaries of this area are detailed in Section 21 and illustrated on Figure 1
History of land use Properties located within the Thebarton EPA Assessment Area have been used for a mixture of commercialindustrial and low density residential land uses over time Current commercialindustrial properties include a beverage factory in the north-eastern portion of the assessment area a refrigeration equipment facility a car dealership two hotels (at least one of which has a cellarbasement) automotive and other workshops and the Ice Arena Former commercialindustrial activities have been identified as including a gas works a mechanicrsquos workshop sheet metal working facilities and a farm machinery manufacturer
Historical investigations
Reports provided to Fyfe by the EPA that pertain to previous investigations undertaken within the Thebarton EPA Assessment Area have been reviewed and summarised in Appendix A Additional historical information is included in Appendix B
Local geology Natural soils encountered from the surfacenear surface to the maximum drill depth of 19 m BGL across the Thebarton EPA Assessment Area were considered to be indicative of the Quaternary Pooraka and Hindmarsh Clay formations Whereas fill materials (ie sand gravelcrushed rock andor silt) were encountered to depths of up to 09 m BGL at a number of sampling locations underlying natural soils comprised mainly low to medium plasticity silty or sandy clays with variable gravel contents Geotechnical testing of subsurface soil samples collected from 10 drill cores indicated that the PSD comprised predominantly claysilt with lesser components of sand andor gravel ndash these soil samples were mostly classified as Clay although some were classified as Sandy Clay or Clayey Sand According to Stapledon (1971) the Hindmarsh Clay unit typically contains many structural features and defects which greatly influence its permeability thereby resulting in potential preferential pathways for the vertical and lateral movement of soil vapour and groundwater Such features were not specifically observed during the recent drilling and soil logging work although some gravel lenseslayers were identified
Hydrogeology In accordance with Gerges (2006) and his classification of the Adelaide metropolitan area into a number of zones based on their individual hydrogeological characteristics the Thebarton EPA Assessment Area is located within Zone 3 (subzone 3E) to the west of the Para Fault It contains five to six Quaternary aquifers and three or four Tertiary aquifers Based on the most recent investigations the depth to water within the Q1 aquifer in the Thebarton EPA Assessment Area ranges from approximately 123 to 159 m BGL and groundwater flows in a general north-westerly direction with a relatively flat hydraulic gradient (000062 to 00012) Salinity levels (based on field EC readings) range from approximately 1230 to 3620 mgL TDS and a groundwater flow velocity range of approximately 44 to 23 myear has
80607-1 REV1 30102017 PAGE 61
EPA REF 0524111 FINAL REPORT STAGE 1 ENVIRONMENTAL ASSESSMENT THEBARTON ASSESSMENT AREA
Topic Summarised Information
been inferred As detailed in Section 222 a search of the DEWNR (2017) WaterConnect database identified 59 bores within the general Thebarton area of which 18 are located within the Thebarton EPA Assessment Area Although (where recorded) bores were listed as having been installed primarily for monitoring investigation or observation purpose other purposes (for presumed Quaternary aquifer bores) included drainage domestic and industrial A BUA has identified realistic groundwater uses as potentially including potable residential irrigation and primary contact recreationaesthetics Based on proximity to the River Torrens freshwater ecosystem protection has also been considered ndash however since the River Torrens is considered to be either a recharge boundary (ie discharging to local groundwater) or not actually hydraulically connected to the Q1 aquifer in this area this may not be a realistic beneficial use Since volatile contaminants have been detected within the Q1 aquifer a potential vapour flux risk to future site users has also been considered
Hydrology No surface water bodies have been identified within the Thebarton EPA Assessment Area The closest surface water body is the River Torrens located approximately 03 km to the east and 07 km to the north and north-west Current stormwater run-off within the Thebarton EPA Assessment Area is expected to be collected by localised (and engineered) drainage systems
Fyfe Investigation Results
Groundwater impacts Contaminants identified in groundwater beneath the Thebarton EPA Assessment Area include TCE PCE 12-DCE (cis- and trans-) and 11-DCE Although TCE PCE and 11-DCE are all considered to represent primary contaminants TCE is considered to be the main COPC (ie with the highest concentrations and greatest distribution) By comparison cis- and trans-12-DCE which are considered to represent break-down (ie daughter) products of TCE andor PCE occur at relatively minor concentrations at scattered locations and were not considered indicative of significant TCE breakdown (ie via dechlorination) Although VC represents another (expected) daughter product of TCE it was not detected in any of the groundwater wells tested The groundwater TCE plume is considered to have migrated in a north-westerly direction from the suspected source site (ie the former Austral sheet metal works) in accordance with the predominant flow direction associated with the Q1 aquifer (refer to Figures 4 and 5) The plume has been traced as far west and north as Dew Street and Smith Street respectively within the Thebarton EPA Assessment Area (ie the extent of the monitoring well network installed by Fyfe) but its north-western extent has not yet been determined (whereas its extent has been defined in all other directions)
Soil vapour impacts Contaminants identified in soil vapour beneath the Thebarton EPA Assessment Area include TCE PCE 12-DCE (cis- and trans-) and 11-DCE The distribution of TCE in soil vapour at 1 and 3 m BGL generally correlates with the north-westerly groundwater flow direction (refer to Figures 6 and 7) and is therefore considered to be a product of volatilisation from the groundwater CHC plume ndash the consistent decrease in soil vapour concentrations with decreasing depth also supports this conclusion The soil vapour samples with the maximum TCE concentrations (ie SV3_10m and SV3_30m) also had the highest PCE and 11-DCE concentrations (or elevated LOR) thereby suggesting that they could represent co-contaminants (ie from a similar source areaactivity) These samples also had elevated LOR for 12-DCE (cis- and trans-) Although VC was not detected in any of the soil vapour samples the laboratory LOR for VC in most of the samples with the highest concentrations of TCE (ie SV2_30m SV3_10m SV3_30m and SV7_30m) exceeded the adopted HILs for residential andor commercialindustrial land use Although the absence of VC in soil vapour cannot therefore be confirmed its absence at detectable levels in groundwater suggests that (limited) TCE
PAGE 62 80607-1 REV1 30102017
EPA REF 0524111 FINAL REPORT STAGE 1 ENVIRONMENTAL ASSESSMENT THEBARTON ASSESSMENT AREA
Topic Summarised Information
degradation has not yet resulted in its production (ie at measureable levels) Although the extent of the soil vapour TCE plume has not yet been determined (ie in any direction) it is expected to have a similar extent to that of the identified groundwater plume (ie as the groundwater CHC impacts represent the source of the measured soil vapour CHC concentrations)
Potential Exposure Pathways
Contaminants of Based on the results of historical investigations the EPA identified a number of CHC as being of Potential Concern concern for the Thebarton EPA Assessment Area The main COPC was identified as TCE with
additional COPC including PCE 12-DCE (cis- and trans-) VC and 11-DCE Further detail is provided in Section 14 These COPC were confirmed by the Fyfe investigations with TCE identified as both the main contaminant in groundwater and soil vapour and the main driver in terms of potential human health risks associated with vapour intrusion into buildings within the Thebarton EPA Assessment Area (refer to Section 9)
Suspected source and The suspected source of the identified CHC groundwater (and soil vapour) impacts within the affected media Thebarton EPA Assessment Area is the former Austral sheet metal works located over multiple
allotments between George and Maria Streets from the 1920s until the 1960s-1970s Previous investigations (Appendix A) had identified groundwater CHC impacts on part of this suspected source site The Fyfe investigations have concentrated on impacts within groundwater and soil vapour across the Thebarton EPA Assessment Area both of which generally correlate with the inferred north-westerly groundwater flow direction and are considered to be related to the previously identified dissolved phase groundwater CHC impacts
Sensitive receptors The following sensitive receptors have been identified as potentially relevant to the Thebarton EPA Assessment Area Ecological groundwater ecosystems within the assessment area extending to at least Dew and Smith
Streets (ie as the north-western extent of the groundwater CHC plume has not yet been determined) and
the freshwater ecosystem of the River Torrens located at a distance of approximately 07 km in a hydraulically down-gradient (ie north-westerly) direction but not necessarily representing a groundwater receiving environment
Human current and future occupants of and visitors to residential properties current and future workers on the source site and other commercialindustrial properties
within the area current and future underground trenchmaintenanceutility workers and down-gradient groundwater bore users
Contaminant Possible contaminant transport mechanisms associated with the CHC-impacted groundwater transport identified within the Q1 aquifer beneath the Thebarton EPA Assessment Area include mechanisms flow through the aquifer to a hydraulically down-gradient surface water body andor down-
gradient groundwater bores vapour generation andor flow via subsurface preferential pathways (eg service trenches
more permeable soils) and downward movement into underlying aquifers (eg dense non-aqueous phase liquid
(DNAPL))
80607-1 REV1 30102017 PAGE 63
EPA REF 0524111 FINAL REPORT STAGE 1 ENVIRONMENTAL ASSESSMENT THEBARTON ASSESSMENT AREA
Topic Summarised Information
Exposure Possible exposure mechanisms associated with impacted groundwater within the Thebarton mechanisms EPA Assessment Area include
direct contact (eg during extractionuse of groundwater) incidental ingestion (eg during extractionuse of groundwater) and inhalation of vapours (eg during extractionuse of groundwater andor as a result of
vapour intrusion into buildings)
Assessment of Risk
Groundwater risks The recent groundwater analytical results have indicated that the Q1 aquifer beneath the Thebarton EPA Assessment Area contains measurable concentrations of CHC (mainly TCE but also including PCE 12-DCE andor 11-DCE at some locations) Measured concentrations of TCE exceeded the adopted assessment criteria for potable andor primary contact recreation in wells MW02 MW3 MW5 MW6 MW11 MW12 MW14 MW15 MW17 MW20 MW21 and MW23 located on Admella Maria George Albert and Dew Streets as well as Light Terrace with maximum concentrations corresponding to the ldquocorerdquo area of the plume One well (MW25) contained a concentration of carbon tetrachloride that exceeded the adopted potable criterion Although groundwater vapour flux has mainly been addressed by the VIRA it could also occur during the extraction of groundwater for domestic use and in terms of aesthetic considerations the CHC impacted groundwater could be odorous Additional parameters measured for the purpose of establishing general aquifer conditions (including whether conditions may be amenable to the breakdown of CHC) have also been reported ndash no clear secondary lines of evidence for the occurrence of natural attenuation have been identified
Groundwater fate Although scattered detectable concentrations of 12-DCE have been measured in groundwater and transport across the Thebarton EPA Assessment Area the absence of significant and ubiquitous TCE modelling daughter products has been interpreted to indicate that substantial dechlorination is not
occurring Groundwater fate and transport modelling (refer to Section 8 and Appendix O) has predicted that the likely extent of the dissolved phase groundwater TCE plume over the next 100 years will extend by another 500 m beyond the boundaries of the current Thebarton EPA Assessment Area However no significant lateral plume expansion is expected
Vapour intrusion risks A VIRA (refer to Section 9 and Appendix P) was undertaken to assess potential risks to human health from the intrusion of CHC vapours (primarily TCE) into indoor air from soil vapour The predicted indoor air concentrations of TCE within the residential portion (assuming crawl space construction in the absence of specific structural information) of the Thebarton EPA Assessment Area indicated that 21 (ie of approximately 130 residential properties) were predicted to have detectable levels of TCE in indoor air and therefore require further action as follows 10 properties within the investigation range (2 to lt20 microgm3) eight properties within the intervention range (20 to lt200 microgm3) and three properties within accelerated intervention range (ge200 microgm3) All remaining residential properties in the Thebarton EPA Assessment Area are considered to be safe from soil vapour intrusion with predicted indoor air concentrations of TCE below 2 microgm3
(assuming crawl space construction) Based on the results of the VIRA however substantially increased risks are likely to exist should cellarsbasements be present whereas risks may be lower for slab on grade construction premises Where permission has been granted by the ownersoccupiers indoor air monitoring of properties within the 20 to lt200 microgm3 and ge200 microgm3 response level ranges as well as
PAGE 64 80607-1 REV1 30102017
EPA REF 0524111 FINAL REPORT STAGE 1 ENVIRONMENTAL ASSESSMENT THEBARTON ASSESSMENT AREA
Topic Summarised Information
selected adjoining properties has been commissioned by the EPA to validate the results of the VIRA modelling (ie which are expected to be overly-conservative) ndash these results will be documented in a subsequent report Calculated vapour intrusion risks to workers within commercialindustrial properties (slab on grade construction) across at least part of the Thebarton EPA Assessment Area (ie based on the maximum soil vapour CHC concentrations in soil vapour bore SV3 located on Maria Street) are considered to be unacceptable Although a basementcellar is known to be present at one commercial property on George Street vapour intrusion risks to subsurface structures associated with commercialindustrial properties have not yet been assessed Management of exposures by trenchmaintenanceutility workers may be required in areas where TCE at 1 m BGL is greater than 100 microgm3 (ie corresponding to 50 times the acceptable concentration for indoor air)
Complete Exposure Pathways
Identified pathways and areas of potential risk
Based on the results of the recent Fyfe investigations (including the VIRA) and taking into account available historical information (Appendices A and B) and DEWNR (2017) WaterConnect bore information the following complete exposure pathways and associated risks are considered possible for the Thebarton EPA Assessment Area exposure (direct contact incidental ingestion andor inhalation of vapours) during use of
groundwater for domestic (eg drinking water plumbing garden irrigation) andor recreational (eg filling of swimming poolsspas) purposes
vapour intrusion into indoor air within 30 residential propertieslocated within the vicinity of soil vapour bores SV1 to SV9 (assuming crawl space construction) ndash although 19 of these properties are predicted to be in the validationinvestigation action level range 11 are predicted to be in the intervention action level range (with actual indoor air monitoring results for properties within the intervention action level range pending)
vapour intrusion into residential cellarsbasements (if present) in the vicinity of soil vapour bores SV1 to SV10 and SV12 and
vapour intrusion into the indoor air of commercialindustrial properties ndash although actual risks to site workers would require further specific considerationassessment
In addition although only assessed in a qualitative manner to date trenchmaintenanceutility workers may also be at risk where TCE at 1 m BGL is greater than 100 microgm3 (or 50 times the acceptable concentration for indoor air) Exposure management should involve the development of a site-specific HSP (prior to the commencement of work in the affected area) that details measures such as restricting personnel exposure times monitoring volatile compounds using a PID unit providing increased ventilation and using appropriate PPE (eg gas masks) as required
Notes calculated on the basis of cadastral boundaries and assuming crawl space construction ndash some properties host more than one residence whereas some have one residence across two properties andor also host a commercial premises a property survey would be required to confirm building construction details and the number of individual residences affected
80607-1 REV1 30102017 PAGE 65
EPA REF 0524111 FINAL REPORT STAGE 1 ENVIRONMENTAL ASSESSMENT THEBARTON ASSESSMENT AREA
11 CONCLUSIONS
Between May and August 2017 Fyfe undertook an investigation of groundwater and soil vapour CHC impacts within an EPA-designated Assessment Area located in Thebarton South Australia The results of the investigation have been used to assess potential vapour intrusion to indoor air risks within residential and commercialindustrial properties A CSM has been developed from the field analytical and modelling results as presented in Section 10
The following conclusions have been reached
Subsurface geological conditions are generally consistent across the Thebarton EPA Assessment Area and are dominated by the sediments (ie low to medium plasticity silty or sandy clays with variable gravel contents) of the Pooraka and Hindmarsh Clay formations While there is some potential for structural defects and coarser horizons to act as preferential pathways (lateral and vertical) for soil vapour movement no significant spatially-consistent features were identified during the recent soil drillinglogging work ndash although thin gravel lenses were present within the subsurface at some locations and a 15 m thick layer of gravel was encountered at 12 to 135 m in groundwater well MW17
Groundwater within the Q1 aquifer is located at a depth of approximately 123 to 159 m BGL and flows in a general north-westerly direction (refer to Figure 4) ndash the closest surface water receptor is the River Torrens located approximately 03 km to the east and 07 km to the north and north-west A groundwater flow velocity range of approximately 44 to 23 myear has been inferred16 and the groundwater gradient beneath the Thebarton EPA Assessment area is relatively flat (ie 000062 to 00012)
Beneficial uses for groundwater within the Q1 aquifer beneath the Thebarton EPA Assessment Area have been identified to include domestic irrigation primary contact recreationaesthetics human health in non-use scenarios (ie vapour flux as assessed by the VIRA) and possibly also potable Although freshwater ecosystem protection was also considered the River Torrens is thought to comprise either a recharge boundary (ie discharging to local groundwater) or to not actually be hydraulically connected to the Q1 aquifer in this area
Groundwater beneath parts of the Thebarton EPA Assessment Area contains detectable concentrations of various CHC and includes TCE and carbon tetrachloride (one location only) levels that exceed the adopted assessment criteria for potable use andor primary contact recreation ndash thereby indicating that groundwater would be unsuitable for drinking or the filling of swimming poolsspas In addition vapour flux could also occur during the extraction of groundwater for domestic use and in terms of aesthetic considerations the groundwater could be odorous
16 ie as calculated by Fyfe based on available data
80607-1 REV1 30102017 PAGE 67
EPA REF 0524111 FINAL REPORT STAGE 1 ENVIRONMENTAL ASSESSMENT THEBARTON ASSESSMENT AREA
The groundwater and soil vapour CHC impacts identified beneath parts of the Thebarton EPA Assessment Area are considered likely to have emanated from the former Austral sheet metal works located over multiple allotments between George and Maria Streets from the 1920s until the 1960sshy1970s The possible presence of on-going (primary andor secondary) source(s) at this property has not yet been investigated
As depicted on Figures 6 and 7 the current extent of the soil vapour CHC (ie dominated by TCE) impacts has been determined to correspond to the mapped distribution of the groundwater TCE impacts (Figure 5) and is considered to be directly related to groundwater (rather than soil) CHC impacts Although no soil vapour impacts were detected at 1 m BGL in SV11 and SV1317 located near the eastern and western ends of Light Terrace respectively the north-western extents of the groundwater and soil vapour CHC impacts have not yet been determined In addition although the extent of the groundwater TCE plume has been delineated in all other directions the soil vapour TCE plume has not been delineated in any direction
TCE is considered to be a primary contaminant as well as the dominant (ie in terms of concentration and extent) CHC in both groundwater and soil vapour ndash the presence of PCE and 11-DCE suggests however that more than one primary contaminant is present Although the detectable concentrations of 12-DCE (cis- and trans) are considered to have resulted from the breakdown of TCEPCE no VC has been detected in either groundwater or soil vapour ndash the scattered distribution and relatively low concentrations of 12-DCE as well as the absence of measurable VC have been interpreted to indicate that significant dechlorination of the primary contaminants has not occurred (despite the likely age of the plume ndash ie possibly up to about 90 years old)
Although the COPC adopted for the soil vapour assessment program included various CHC (ie with TCE identified as the dominant contaminant in groundwater and soil vapour) the Tier 1 VIRA confirmed that TCE PCE and 11-DCE all exceeded the adopted vapour intrusion HILs Based primarily on its greater toxicity however the risk driver for the Thebarton EPA Assessment Area is considered to be TCE
The VIRA (Tier 2) results for predicted indoor air concentrations of TCE within the residential portion (assuming crawl space construction) of the Thebarton EPA Assessment Area indicated that 21 (ie of approximately 130 residential properties) were predicted to have detectable levels of TCE in indoor air and that require further action as follows
― 10 properties within the investigation range (2 to lt20 microgm3)
― eight properties within the intervention range (20 to lt200 microgm3) and
― three properties within accelerated intervention range (ge200 microgm3)
All remaining residential properties in the Thebarton EPA Assessment Area are considered to be safe from soil vapour intrusion with predicted indoor air concentrations of TCE below 2 microgm3 (assuming
17 noting that the laboratory LOR for TCE was elevated as compared to the other soil vapour samples
PAGE 68 80607-1 REV1 30102017
EPA REF 0524111 FINAL REPORT STAGE 1 ENVIRONMENTAL ASSESSMENT THEBARTON ASSESSMENT AREA
crawl space construction) Based on the results of the VIRA however substantially increased risks are likely to exist should cellarsbasements be present whereas risks may be lower for slab on grade construction premises ndash refer to Table 96
Calculated vapour intrusion risks to workers within commercialindustrial properties (slab on grade construction) across at least part of the Thebarton EPA Assessment Area (ie based on the maximum soil vapour CHC concentration obtained for soil vapour bore SV3 located on Maria Street) are considered to be unacceptable Although a basementcellar is known to be present at one commercial property on George Street vapour intrusion risks to subsurface structures associated with commercialindustrial properties have not yet been assessed
Although only assessed in a qualitative manner trenchmaintenanceutility workers may be at risk in areas where TCE concentrations at 1 m BGL are greater than 100 microgm3 (or 50 times the acceptable concentration for indoor air) ndash in this case appropriate management measures would be required to be adopted This should involve the development of a site-specific HSP (prior to the commencement of work in the affected area) that details measures such as restricting personnel exposure times monitoring volatile compounds using a PID unit providing increased ventilation and using appropriate PPE (eg gas masks) as required
80607-1 REV1 30102017 PAGE 69
EPA REF 0524111 FINAL REPORT STAGE 1 ENVIRONMENTAL ASSESSMENT THEBARTON ASSESSMENT AREA
12 DATA GAPS
Based on the results obtained during the recent Fyfe investigations as well as available historical information (Appendices A and B) the following data gaps have been identified for the Thebarton EPA Assessment Area
property information assumed for the vapour intrusion modelling has not been confirmed (ie current land use (residential versus commercial) building construction type (slab crawl space presence of basements and cellars including cellarsbasements for commercial properties)
groundwater uses considered for the beneficial use assessment have not been confirmed (whether bores are registered or not)
the conclusions are based on a single sampling event meaning the understanding of temporal and spatial variation is limited for both groundwater and soil vapour and
the groundwater contamination has not been fully delineated in the hydraulically down-gradient direction (north-west) and hence the groundwater fate and transport modelling is not validated
80607-1 REV1 30102017 PAGE 71
EPA REF 0524111 FINAL REPORT STAGE 1 ENVIRONMENTAL ASSESSMENT THEBARTON ASSESSMENT AREA
13 REFERENCES
ANZECCARMCANZ (2000a) Australian Guidelines for Water Quality Monitoring and Reporting
ANZECCARMCANZ (2000b) Australian and New Zealand Guidelines for Fresh and Marine Water Quality
ASTM (2001) Standard Practice for Active Soil Gas Sampling in the Vadose Zone for Vapor Intrusion Evaluations ASTM Guide D7663-12
ASTM (2006) Standard Guide for Soil Gas Monitoring in the Vadose Zone ASTM Guide D5314-92
ATSDR (1994) Toxicological profile ndash 11-Dichloroethene httpswwwatsdrcdcgovToxProfilestpaspid=722amptid=130
AustralianNew Zealand Standard (1998) Water Quality Sampling Part 1 Guidance on the Design of Sampling Programs Sampling Techniques and the Preservation and Handling of Samples ASNZS 566711998
AustralianNew Zealand Standard (1998) Water Quality Sampling Part 11 Guidance on Sampling of Groundwaters ASNZS 5667111998
Bouwer H and Rice RC (1976) A Slug Test Method for Determining Hydraulic Conductivity of Unconfined Aquifers with Completely or Partially Penetrating Wells Water Resources Research vol 12 no 3 pp 423-428
Butler JJ Jr (1998) The Design Performance and Analysis of Slug Tests
Cooper HH Bredehoeft JD and Papadopulos SS (1967) Response of a Finite-Diameter Well to an Instantaneous Charge of Water Water Resources Research vol 3 no 1 pp 263-269
CRC CARE (2013) Petroleum Hydrocarbon Vapour Intrusion Assessment ndash Australian Guidance CRC CARE Technical Report No 23 July 2013
Dagan G (1978) A Note on Packer Slug and Recovery Tests in Unconfined Aquifers Water Resources Research vol 14 no 5 pp 929-934
Department of Environment Water and Natural Resources (DEWNR 2017) Water Connect Master Register of All Bores Primary Industries and Resources South Australia
Duffield G (2007) AQTESOLVreg Professional Version 45 Hydrosolve Inc
enHealth (2012a) Environmental Health Risk Assessment - Guidelines for assessing human health risks from environmental hazards enHealth Council
enHealth (2012b) Australian Exposure Factor Guidance Handbook enHealth Council
Environment Protection Act 1993
80607-1 REV1 30102017 PAGE 73
EPA REF 0524111 FINAL REPORT STAGE 1 ENVIRONMENTAL ASSESSMENT THEBARTON ASSESSMENT AREA
Environment Protection Regulations 2009
Friebel E and Nadebaum P (2011) Health Screening Levels for Petroleum Hydrocarbons in Soil and Groundwater CRC CARE Technical Report No 10
Gerges NZ (1999) The Geology and Hydrogeology of the Adelaide Metropolitan Area Flinders University (South Australia) PhD thesis (unpublished)
Gerges NZ (2006) Overview of the Hydrogeology of the Adelaide Metropolitan Area DWLBC Report 200610
Golder Associates (1994) Contamination Assessment George Street Thebarton SA Report to United Land dated 9 December 1994
Hvorslev MJ (1951) Time Lag and Soil Permeability in Ground-Water Observations Bulletin no 36 Waterways Exper Sta Corps of Engrs US Army Vicksburg Mississippi pp 1-50
Hyder Z Butler JJ Jr McElwee CD and Liu W (1994) Slug Tests in Partially Penetrating Wells Water Resources Research vol 30 no 11 pp 2945-2957
ITRC (2007) Vapor Intrusion Pathway - A Practical Guidance
Johnson PC and Ettinger RA (1991) Heuristic Model for Predicting the Intrusion Rate of Contaminant Vapors
into Buildings Environ Sci Technology 251445-1452
McDonald M G and Harbaugh A W (1988) A Modular Three-Dimensional Finite-Difference Ground-Water Flow Model Techniques of Water-Resources Investigations Book 6 Chapter A1 U S Geological Survey
NEPM (1999) National Environment Protection (Assessment of Site Contamination) Measure Schedules B1 to
B9 National Environment Protection Council Australia
NHMRC (2008) Guidelines for Managing Risks in Recreational Water
NHMRCNRMMC (2011) Australian Drinking Water Guidelines (as revised in 2016)
NJDEP (2013) Site Remediation Program Vapor Intrusion Technical Guidance (Version 31)
NSW DEC (2006) Guidelines for the NSW Site Auditor Scheme (2nd edition)
Payne FC Quinnan JA and Potter ST (2008) Remediation Hydraulics CRC Press Boca Raton FL
RAIS (2016) Chemical Specific Parameters for Trichloroethylene Risk Assessment Information System Office of Environmental Management US Department of Energy
REM (2005a) George St Thebarton Site ndash Stage 2 Investigations Report to Luca Group dated 26 August 2005
REM (2005b) Stage 3 Environmental Site Assessment George St Thebarton SA Report to Luca Group dated 23 November 2005
SA Department of Mines and Energy (1969) 1250000 Adelaide Geological Map Sheet Sheet S1 54-9
PAGE 74 80607-1 REV1 30102017
EPA REF 0524111 FINAL REPORT STAGE 1 ENVIRONMENTAL ASSESSMENT THEBARTON ASSESSMENT AREA
SA EPA (2007) Regulatory Monitoring and Testing Groundwater Sampling
SA EPA (2009) Guidelines for the Assessment and Remediation of Groundwater Contamination
SA EPA (2014) Clovelly Park Mitchell Park Project Management Team Assessment Program Flip Book November 2014
SA EPA (2015) Environment Protection (Water Quality) Policy
Standards Australia (1993) Geotechnical Site Investigations AS1726-1993
Standards Australia (2005) Guide to the Sampling and Investigation of Potentially Contaminated Soil Part 1 Non-Volatile and Semi-Volatile Compounds AS44821-2005
Stapledon DH (1971) Changes and Structural Defects Developed in some South Australian Clays and their Engineering Consequences Proceedings of Symposium on Soils and Earth Structures in Arid Climates Adelaide 1970
US EPA (1996) Soil Screening Guidance Technical Background Document Office of Emergency and Remedial Response Washington DC EPA540R95128
US EPA (1999) Compendium of Methods for the Determination of Toxic Organic Compounds in Ambient Air Second Edition Compendium Method TO-15 Determination Of Volatile Organic Compounds (VOCs) In Air Collected In Specially-Prepared Canisters And Analyzed By Gas Chromatography Mass Spectrometry (GCMS) EPA625R-96010b
US EPA (2002) OSWER Draft Guidance for Evaluating the Vapour Intrusion to Indoor Air Pathway from Groundwater and Soils (Subsurface Vapour Intrusion Guidance) EPA530-D-02-004
US EPA (2009) EPArsquos Risk-Screening Environmental Indicators (RSEI) Methodology Office of Pollution Prevention and Toxics Washington DC
US EPA (2011) IRIS (Integrated Risk Information System) Trichloroethylene Chemical Assessment Summary httpscfpubepagovnceairisiris_documentsdocumentssubst0199_summarypdf
US EPA (2012) EPArsquos Vapor Intrusion Database Evaluation and Characterization of Attenuation Factors for Chlorinated Volatile Organic Compounds and Residential Buildings
US EPA (2015) OSWER Technical Guide for Assessing and Mitigating the Vapour Intrusion Pathway from Subsurface Vapour Sources to Indoor Air
US EPA (2017a) Regional Screening Levels (RSLs) - Generic Tables (June 2017) httpswwwepagovriskregional-screening-levels-rsls-generic-tables-june-2017
US EPA (2017b) Regional Screening Levels for Chemical Contaminants at Superfund Sites httpwwwepagovreg3hwmdriskhumanrb-concentration_tableGeneric_Tablesindexhtm
80607-1 REV1 30102017 PAGE 75
EPA REF 0524111 FINAL REPORT STAGE 1 ENVIRONMENTAL ASSESSMENT THEBARTON ASSESSMENT AREA
WHO (2006) Air Quality Guidelines for Europe Second Edition WHO Regional Publications European Series No 91
WHO (2017) Guidelines for Drinking-water Quality Fourth edition (incorporating the first addendum)
Wiedemeier T Swanson M Moutoux D Gordon E Wilson J Wilson B Kampbell D Haas P Miller R Hansen J and Chapelle F (1998) Technical Protocol for Evaluating Natural Attenuation of Chlorinated Solvents in Ground Water National Risk Management Research Laboratory Office of Research and Development US EPA
Zheng C (1990) MT3D A Modular Three-Dimensional Transport Model for Simulation of Advection Dispersion and Chemical Reactions of Contaminants in Groundwater Systems Prepared for US EPA by Robert S Kerr Environmental Research Laboratory Ada Oklahoma developed by SS Papadopulos amp Associates Inc Rockville Maryland
PAGE 76 80607-1 REV1 30102017
EPA REF 0524111 FINAL REPORT STAGE 1 ENVIRONMENTAL ASSESSMENT THEBARTON ASSESSMENT AREA
14 STATEMENT OF LIMITATIONS
The opinions and conclusions presented in this report are specific to the conditions of the Thebarton EPA Assessment Area and the state of legislation currently enacted as at the date of this report Fyfe does not make any representation or warranty that the opinions and conclusions in this report will be applicable in the future as there may be changes in the condition of the Thebarton EPA Assessment Area applicable legislation or other factors that would affect the opinions and conclusions contained in this report
Fyfe has used the degree of skill and care ordinarily exercised by reputable members of our profession practising in the same or similar locality This report has been prepared for the South Australian Environment Protection Authority for the specific purpose identified in the report Fyfe accepts no liability or responsibility to any third party for the accuracy of any information contained in the report or any opinion or conclusion expressed in the report Neither the whole of the report nor any part or reference thereto may be in any way used relied upon or reproduced by any third party without Fyfersquos prior written approval This report must be read in its entirety including all tables and attachments
80607-1 REV1 30102017 PAGE 77
EPA REF 0524111 FINAL REPORT STAGE 1 ENVIRONMENTAL ASSESSMENT THEBARTON ASSESSMENT AREA
FIGURES
Figure 1 Site Location and Assessment Area
Figure 2 Assessment Point Locations
Figure 3 Waterloo Membrane Samplertrade TCE Concentration Plan
Figure 4 Groundwater Elevation Contour Plan
Figure 5 Groundwater Concentration Plan
Figure 6 Soil Vapour Concentration Plan (10m)
Figure 7 Soil Vapour Concentration Plan (30m)
80607-1 REV1 30102017 PAGE 79
JAM
ES CO
NG
DO
N D
RIV
E
JAM
ES CO
NG
DO
N D
RIV
E
DEW
STREET
DEW
STREET
CHAPEL STREETCHAPEL STREET
PAR
KER
STREET
PAR
KER
STREET
POR
T RO
AD
POR
T RO
AD
POR
T RO
AD
POR
T RO
AD
LIGHT TERRACELIGHT TERRACE
DEW
STREET
DEW
STREET
WA
LSH ST
WA
LSH ST
AD
MELLA
STREET
AD
MELLA
STREET
ALB
ERT STR
EETA
LBER
T STREET
HO
LLAN
D ST
REET
HO
LLAN
D ST
REET
RANDOLPH STREET
RANDOLPH STREET
JAM
ES STREET
JAM
ES STREET
DOVE STREET
DOVE STREET
SMITH STREETSMITH STREET
MARIA STREETMARIA STREET
GEORGE STREETGEORGE STREET
KINTORE STREET
KINTORE STREET
PORT ROAD
PORT ROAD
PORT ROAD
PORT ROAD
CAW
THO
RN
E STR
EETC
AWTH
OR
NE ST
REET
DEVON STREETDEVON STREET
KINTORE STREETKINTORE STREET
GOODENOUGH STREETGOODENOUGH STREET
LIVESTR
ON
G PATH
WAY
LIVESTR
ON
G PATH
WAY
CCAAWW
TTHHOO
RRNN
EE SSTTRR
EEEETT
HHOO
LLLLAANN
DD SSTT
RREEEETT
DE
DEW
SW
STREET
TREET
JJAM
EA
MES S
S STREET
TREET
DDOOVVEE SSTTRREEEETT
LLIIVVEESSTTRR
OONN
GG PPAATTHH
WWAAYY
LIGHT TERRLIGHT TERRAACECE
AD
MELLA
SA
DM
ELLA STR
EETTR
EET
CHAPEL SCHAPEL STREETTREET
AALLBB
EERRTT SSTTRR
EEEETT
GEGEORORGE SGE STREETTREET
PPOORRTT RROOAADD
PPOORRTT RROOAADD
DDEEWW
SSTTRREEEETT
MMAARRIIAA SSTTRREEEETT
JJAAMM
EESS CCOO
NNGG
DDOO
NN DD
RRIIVV
EE
WWAA
LLSSHH SSTT
SSMMIITTHH SSTTRREEEETT
RRANDOLPH S
ANDOLPH STREETTREET
PPOORR
TT RROO
AADD
PPOORR
TT RROO
AADD
KKIINNTTOORREE SSTTRREEEETT
KKIINNTTOORREE SSTTRREEEETT
PPAARR
KKEERR
SSTTRREEEETT
GGOOOODDEENNOOUUGGHH SSTTRREEEETT
DDEEVVOONN SSTTRREEEETT
ASSESSMENT AREA
CBD
750m
LEGEND
EPA ASSESSMENT AREA
CADASTRE
12500 A3
0 25 50 m
CLIENT
SA EPA
PROJECT
FIGURE 1 SITE LOCATION AND ASSESSMENT AREA
EPA THEBARTON ASSESSMENT AREA - STAGE 1
TITLE
FIGURE 1 SITE LOCATION AND ASSESSMENT AREA
PROJECT NO DATE CREATED
80607-1 290917
80607_Fig 1 - Site Location and Assessment Areaai REV 1 gt 290917
LE
VE
L 1
12
4 S
OU
TH
TE
RR
AC
E
AD
EL
AID
E S
A 5
00
0
P
H
(08
) 8
23
2 9
08
8
F
AX
(0
8)
82
32
90
99
EM
AIL
in
fo
fyfe
co
ma
u
W
EB
fy
fec
om
au
AB
N
57
00
8 1
16 1
30
JAM
ES CO
NG
DO
N D
RIV
E
JAM
ES CO
NG
DO
N D
RIV
E
DEW
STREET
DEW
STREET
CHAPEL STREETCHAPEL STREET
PAR
KER
STREET
PAR
KER
STREET
POR
T RO
AD
POR
T RO
AD
POR
T RO
AD
POR
T RO
AD
LIGHT TERRACELIGHT TERRACE
DEW
STREET
DEW
STREET
WA
LSH ST
WA
LSH ST
AD
MELLA
STREET
AD
MELLA
STREET
ALB
ERT STR
EETA
LBER
T STREET
HO
LLAN
D ST
REET
HO
LLAN
D ST
REET
RANDOLPH STREET
RANDOLPH STREET
JAM
ES STREET
JAM
ES STREET
DOVE STREET
DOVE STREET
SMITH STREETSMITH STREET
MARIA STREETMARIA STREET
GEORGE STREETGEORGE STREET
KINTORE STREET
KINTORE STREET
PORT ROAD
PORT ROAD
PORT ROAD
PORT ROAD
CAW
THO
RN
E STR
EETC
AWTH
OR
NE ST
REET
DEVON STREETDEVON STREET
KINTORE STREETKINTORE STREET
GOODENOUGH STREETGOODENOUGH STREET
LIVESTR
ON
G PATH
WAY
LIVESTR
ON
G PATH
WAY
SV1SV1
SV2SV2
SV3SV3SV4SV4
SV5SV5
SV6SV6
SV7SV7SV8SV8
SV9SV9
SV10SV10
SV11SV11SV12SV12
SV13SV13
MW1MW1
MW02MW02
MW3MW3
MW4MW4MW5MW5MW6MW6
MW7MW7
MW8MW8
MW9MW9
MW10MW10MW11MW11
MW12MW12MW13MW13
MW14MW14MW15MW15
MW16MW16
MW17MW17
MW18MW18
MW19MW19
MW20MW20
MW21MW21
MW22MW22
MW23MW23
MW24MW24
MW25MW25
MW26MW26
WMS2WMS2WMS1WMS1
WMS3WMS3WMS4WMS4WMS5WMS5
WMS6WMS6
WMS7WMS7WMS8WMS8
WMS9WMS9WMS10WMS10
WMS11WMS11
WMS12WMS12
WMS13WMS13WMS14WMS14
WMS15WMS15
WMS41WMS41
WMS40WMS40
WMS39WMS39WMS38WMS38
WMS16WMS16
WMS17WMS17
WMS18WMS18WMS19WMS19
WMS20WMS20
WMS21WMS21WMS22WMS22
WMS23WMS23WMS24WMS24
WMS25WMS25
WMS26WMS26
WMS27WMS27WMS28WMS28WMS29WMS29
WMS30WMS30
WMS31WMS31
WMS32WMS32
WMS33WMS33
WMS34WMS34
WMS35WMS35
WMS36WMS36
WMS37WMS37
WWAA
LLSSHHSSTT
SSMMIITTHH SSTTRREEEETT
RRANDOLPH S
ANDOLPH STREETTREET
PPOORR
TT RROO
AADD
PPOORR
TT RROO
AADD
CCAAWW
TTHHOO
RRNN
EE SSTTRR
EEEETT
JJAM
EA
MES S
S STREET
TREET
HHOO
LLLLAANN
DDSSTT
RREEEETT
DE
DEW
SW
STREET
TREET
DDOOVVEE SSTTRREEEETT
LLIIVVEESSTTRR
OONN
GGPPAATTHH
WWAAYY
LIGHT TERRLIGHT TERRAACECE
CHAPEL SCHAPEL STREETTREET
AALLBB
EERRTT SSTTRR
EEEETT
AD
MELLA
SA
DM
ELLA STR
EETTR
EET
GEGEORORGE SGE STREETTREET
PPOORRTT RROOAADD PPOORRTT RROOAADD
DDEEWW
SSTTRREEEETT MMAARRIIAA SSTTRREEEETT
JJAAMM
EESS CCOO
NNGG
DDOO
NN DD
RRIIVV
EE
KKIINNTTOORREE SSTTRREEEETT
KKIINNTTOORREE SSTTRREEEETT
PPAARR
KKEERR
SSTTRREEEETT
GGOOOODDEENNOOUUGGHH SSTTRREEEETT
DDEEVVOONN SSTTRREEEETT
FIGURE 2 ASSESSMENT POINT LOCATIONS
MMWW88
MW2MW244 WMS3WMS355
MW2MW255
WMS3WMS366
WMS3WMS377
WMS3WMS311
MW2MW222WMS34WMS34
MW2MW233 WMS3WMS322
WMS3WMS333
WMS2WMS277WMS2WMS299 WMS2WMS288
SSV12V12 SSVV1111 MW19MW19
MW18MW18 SSVV1133 MW2MW200 WMS3WMS300
MW2MW211 WMS2WMS255
WMS2WMS266
MW17MW17 WMS2WMS244
WMS2WMS233
WMS2WMS222 WMS2WMS211
SSVV99
SSV10V10WMS2WMS200 MW14MW14MW15MW15 WMS18WMS18
WMS19WMS19 MW16MW16
WMS13WMS13MW10MW10 WMS14WMS14MMWW1111SVSV77WMS15WMS15SSVV88WMS16WMS16
SVSV66WMS4WMS411MW13MW13 LEGENDMW12MW12
WATERLOO MEMBRANE SAMPLERTM - ROUND 1WMS17WMS17 WMS40WMS40 SSVV55 MW0MW022MW9MW9 GROUNDWATER MONITORING WELL
WMS11WMS11 WMS6WMS6 SOIL VAPOUR BORE
WATERLOO MEMBRANE SAMPLERTM - ROUND 2
SVSV22WMS8WMS8SVSVWMS12WMS12 44 WMS7WMS7 MW4MW4MMWW SVSV66 33 MW5MW5WMS3WMS388
WMS3WMS399 MW7MW7 EPA ASSESSMENT AREAWMS10WMS10 WMS9WMS9
SVSV11 CADASTRE
MW3MW3
MW1MW1 WMS3WMS3WMS4WMS4MW2MW266 WMS5WMS5 12500 A3
0 25 50 m
CLIENT
SA EPAWMS1WMS1
WMS2WMS2 PROJECT
EPA THEBARTON ASSESSMENT AREA - STAGE 1
TITLE
FIGURE 2 ASSESSMENT POINT LOCATIONS
PROJECT NO DATE CREATED
80607-1 280917
80607_Fig 2 - Assessment Point Locationsai REV 1 gt 280917
LE
VE
L 1
12
4 S
OU
TH
TE
RR
AC
E
AD
EL
AID
E S
A 5
00
0
PH
(0
8)
82
32
90
88
F
AX
(0
8)
82
32
90
99
E
MA
IL
info
fy
fec
om
au
W
EB
fy
fec
om
au
A
BN
5
7 0
08
116
13
0
JAM
ES CO
NG
DO
N D
RIV
E
JAM
ES CO
NG
DO
N D
RIV
E
DEW
STREET
DEW
STREET
CHAPEL STREETCHAPEL STREET
PAR
KER
STREET
PAR
KER
STREET
POR
T RO
AD
POR
T RO
AD
POR
T RO
AD
POR
T RO
AD
LIGHT TERRACELIGHT TERRACE
DEW
STREET
DEW
STREET
WA
LSH ST
WA
LSH ST
AD
MELLA
STREET
AD
MELLA
STREET
ALB
ERT STR
EETA
LBER
T STREET
HO
LLAN
D ST
REET
HO
LLAN
D ST
REET
RANDOLPH STREET
RANDOLPH STREET
JAM
ES STREET
JAM
ES STREET
DOVE STREET
DOVE STREET
SMITH STREETSMITH STREET
MARIA STREETMARIA STREET
GEORGE STREETGEORGE STREET
KINTORE STREET
KINTORE STREET
PORT ROAD
PORT ROAD
PORT ROAD
PORT ROAD
CAW
THO
RN
E STR
EETC
AWTH
OR
NE ST
REET
DEVON STREETDEVON STREET
KINTORE STREETKINTORE STREET
GOODENOUGH STREETGOODENOUGH STREET
LIVESTR
ON
G PATH
WAY
LIVESTR
ON
G PATH
WAY
WMS2WMS2WMS1WMS1
WMS3WMS3WMS4WMS4
WMS5WMS5
WMS6WMS6
WMS7WMS7WMS8WMS8
WMS9WMS9
WMS10WMS10
WMS11WMS11
WMS12WMS12
WMS13WMS13WMS14WMS14
WMS15WMS15 WMS41WMS41
WMS40WMS40
WMS39WMS39WMS38WMS38
WMS16WMS16
WMS17WMS17
WMS18WMS18WMS19WMS19WMS20WMS20
WMS21WMS21WMS22WMS22
WMS23WMS23WMS24WMS24
WMS25WMS25
WMS26WMS26
WMS27WMS27WMS28WMS28WMS29WMS29
WMS30WMS30
WMS31WMS31
WMS32WMS32WMS33WMS33
WMS34WMS34
WMS35WMS35
WMS36WMS36
WMS37WMS37
WWAA
LLSSHHSSTT
SSMMIITTHH SSTTRREEEETT
RRANDOLPH S
ANDOLPH STREETTREET
PPOORR
TT RROO
AADD
PPOORR
TT RROO
AADD
CCAAWW
TTHHOO
RRNN
EE SSTTRR
EEEETT
JJAM
EA
MES S
S STREET
TREET
HHOO
LLLLAANN
DDSSTT
RREEEETT
DE
DEW
SW
STREET
TREET
DDOOVVEE SSTTRREEEETT
LLIIVVEESSTTRR
OONN
GGPPAATTHH
WWAAYY
LIGHT TERRLIGHT TERRAACECE
AD
MELLA
SA
DM
ELLA STR
EETTR
EET
AALLBB
EERRTT SSTTRR
EEEETT
CHAPEL SCHAPEL STREETTREET
GEGEORORGE SGE STREETTREET
PPOORRTT RROOAADD PPOORRTT RROOAADD
DDEEWW
SSTTRREEEETT MMAARRIIAA SSTTRREEEETT
JJAAMM
EESS CCOO
NNGG
DDOO
NN DD
RRIIVV
EE
KKIINNTTOORREE SSTTRREEEETT
KKIINNTTOORREE SSTTRREEEETT
PPAARR
KKEERR
SSTTRREEEETT
GGOOOODDEENNOOUUGGHH SSTTRREEEETT
DDEEVVOONN SSTTRREEEETT
FIGURE 3 WATERLOO MEMBRANE SAMPLERTM
TCE CONCENTRATION PLAN
WMS3WMS355 TCE lt78
WMS3WMS366 TCE lt77WMS3WMS377
TCE 44
WMS3WMS311 TCE lt78
WMS34WMS34 TCE 11
WMS3WMS322WMS3WMS333 TCE lt78TCE lt79
WMS2WMS277WMS2WMS299 WMS2WMS288 TCE 64 TCE lt77 TCE lt8
WMS3WMS300 TCE lt8
WMS2WMS255
WMS2WMS266 TCE 1400(D)
WMS2WMS222 TCE 38 WMS2WMS211
TCE lt79
TCE lt78
WMS2WMS233 WMS2WMS244 TCE lt77
TCE 230
WMS2WMS200 WMS19WMS19TCE lt78 WMS18WMS18 TCE 11000
TCE 4200
WMS13WMS13 WMS14WMS14 TCE lt79
WMS4WMS411WMS15WMS15 TCE 46000WMS16WMS16 TCE 18000 LEGENDTCE lt8
TCE lt78WMS17WMS17 WATERLOO MEMBRANE SAMPLERTM - ROUND 1WMS40WMS40TCE lt79
TCE 110000 WATERLOO MEMBRANE SAMPLERTM - ROUND 2WMS11WMS11
TCE 71000WMS12WMS12 EPA ASSESSMENT AREA
CADASTRE
WMS6WMS6 TCE lt58 WMS8WMS8 WMS3WMS388 TCE 32WMS7WMS7WMS3WMS399
TCE 12000 TCE 13000 TCE 1900TCE 1300WMS9WMS9 TCE lt58 NotesWMS10WMS10
All concentrations are in μgm3 TCE lt58
D = Duplicate result
WMS3WMS3WMS4WMS4 12500 A3
LE
VE
L 1
12
4 S
OU
TH
TE
RR
AC
E
AD
EL
AID
E S
A 5
00
0
PH
(0
8)
82
32
90
88
F
AX
(0
8)
82
32
90
99
E
MA
IL
info
fy
fec
om
au
W
EB
fy
fec
om
au
A
BN
5
7 0
08
116
13
0
TCE lt57WMS5WMS5 TCE lt57 TCE lt58 0 25 50
m
CLIENT
SA EPA
WMS2WMS2 TCE lt56
WMS1WMS1 TCE lt56
PROJECT
EPA THEBARTON ASSESSMENT AREA - STAGE 1
TITLE
FIGURE 3 WATERLOO MEMBRANE SAMPLERTM
TCE CONCENTRATION PLAN
PROJECT NO DATE CREATED
80607-1 241017
80607_Fig 3 - WMS TCE Concentration Planai REV 1 gt 241017
JAM
ES CO
NG
DO
N D
RIV
E
JAM
ES CO
NG
DO
N D
RIV
E
DEW
STREET
DEW
STREET
CHAPEL STREETCHAPEL STREET
PAR
KER
STREET
PAR
KER
STREET
POR
T RO
AD
POR
T RO
AD
POR
T RO
AD
POR
T RO
AD
LIGHT TERRACELIGHT TERRACE
DEW
STREET
DEW
STREET
WA
LSH ST
WA
LSH ST
AD
MELLA
STREET
AD
MELLA
STREET
ALB
ERT STR
EETA
LBER
T STREET
HO
LLAN
D ST
REET
HO
LLAN
D ST
REET
RANDOLPH STREET
RANDOLPH STREET
JAM
ES STREET
JAM
ES STREET
DOVE STREET
DOVE STREET
SMITH STREETSMITH STREET
MARIA STREETMARIA STREET
GEORGE STREETGEORGE STREET
KINTORE STREET
KINTORE STREET
PORT ROAD
PORT ROAD
PORT ROAD
PORT ROAD
CAW
THO
RN
E STR
EETC
AWTH
OR
NE ST
REET
DEVON STREETDEVON STREET
KINTORE STREETKINTORE STREET
GOODENOUGH STREETGOODENOUGH STREET
LIVESTR
ON
G PATH
WAY
LIVESTR
ON
G PATH
WAY
MW1MW1
MW02MW02
MW3MW3
MW4MW4MW5MW5
MW6MW6
MW7MW7
MW8MW8
MW9MW9
MW10MW10MW11MW11
MW12MW12
MW13MW13
MW14MW14
MW15MW15
MW16MW16
MW17MW17
MW18MW18
MW19MW19MW20MW20
MW21MW21
MW22MW22
MW23MW23
MW24MW24
MW25MW25
MW26MW26
WWAA
LLSSHHSSTT
SSMMIITTHH SSTTRREEEETT
4
466
PPOORR
TT RROO
AADD
PPOORR
TT RROO
AADD
RRANDOLPH S
ANDOLPH STREETTREET 4455
DE
DEW
SW
STREET
TREET
JJAM
EA
MES S
S STREET
TREET
HHOO
LLLLAANN
DD SSTT
RREEEETT
CCAAWW
TTHHOO
RRNN
EE SSTTRR
EEEETT 4477
DDOOVVEE SSTTRREEEETT
4455
4488
LLIIVVEESSTTRR
OONN
GGPPAATTHH
WWAAYY
4455
LIGHT TERRLIGHT TERRAACECE
AD
MELLA
SA
DM
ELLA STR
EETTR
EET
4466
CHAPEL SCHAPEL STREETTREET
4477 AA
LLBBEERR
TT SSTTRREEEETT
4499
GR4466 OUND
FLOW DIREW
GEGEORORGE SGE STREETTREET ATER C
4488 TION
PPOORRTT RROOAADD PPOORRTT RROOAADD 55
00 DD
EEWW SSTTRR
EEEETT 4499
MMAARRIIAA SSTTRREEEETT
4477
5500
JJAAMM
EESS CCOO
NNGG
DDOO
NN DD
RRIIVV
EE
88 44
KKIINNTTOORREE SSTTRREEEETT
KKIINNTTOORREE SSTTRREEEETT
PPAARR
KKEERR
SSTTRREEEETT GGOOOODDEENNOOUUGGHH SSTTRREEEETT
5500
4499
DDEEVVOONN SSTTRREEEETT
FIGURE 4 GROUNDWATER ELEVATION CONTOUR PLAN
Groundwater SWL MMWW88 Monitoring Well (m AHD)
MW1 5011 MW2MW244
MW02 4786
MW3 484
MW2MW255 MW4 507
MW5 4833
MW6 4794
MW7 4703
MW8 4581
MW9 4728
MW10 4871
MW11 4785 MW2MW222
MW12 4689
MW13 4662
MW2MW233 MW14 4723
MW15 464
MW16 4577
MW17 4619
MW18 4538
MW19 4735
MW20 457
MW21 4531
MW22 4501
MW23 4497
MW24 4537
MW25 4469
MW26 4918
MW19MW19 MW2MW200
MW2MW211MW18MW18
MW17MW17
MW14MW14
MW15MW15
MW16MW16
MW10MW10 LEGEND MMWW1111
GROUNDWATER MONITORING WELLMW12MW12
50 INFERRED GROUNDWATER ELEVATION CONTOUR
MW13MW13
MW0MW022 INFERRED GROUNDWATER FLOW DIRECTION
EPA ASSESSMENT AREA
MW9MW9
MW5MW5 CADASTREMMWW66 MW4MW4
MW7MW7 Note This is one interpretation only Other interpretations possibleMW3MW3
12500 A3
0 25 50 m
CLIENT
SA EPA
PROJECT
EPA THEBARTON ASSESSMENT AREA - STAGE 1
TITLE
FIGURE 4 GROUNDWATER ELEVATION CONTOUR PLAN
PROJECT NO DATE CREATED
80607-1 290917
MW1MW1 MW2MW266
80607_Fig 4 - Groundwater Elevation Contour Planai REV 1 gt 290917
LE
VE
L 1
12
4 S
OU
TH
TE
RR
AC
E
AD
EL
AID
E S
A 5
00
0
PH
(0
8)
82
32
90
88
F
AX
(0
8)
82
32
90
99
E
MA
IL
info
fy
fec
om
au
W
EB
fy
fec
om
au
A
BN
5
7 0
08
116
13
0
JAM
ES CO
NG
DO
N D
RIV
E
JAM
ES CO
NG
DO
N D
RIV
E
DEW
STREET
DEW
STREET
CHAPEL STREETCHAPEL STREET
PAR
KER
STREET
PAR
KER
STREET
POR
T RO
AD
POR
T RO
AD
POR
T RO
AD
POR
T RO
AD
LIGHT TERRACELIGHT TERRACE
DEW
STREET
DEW
STREET
WA
LSH ST
WA
LSH ST
AD
MELLA
STREET
AD
MELLA
STREET
ALB
ERT STR
EETA
LBER
T STREET
HO
LLAN
D ST
REET
HO
LLAN
D ST
REET
RANDOLPH STREET
RANDOLPH STREET
JAM
ES STREET
JAM
ES STREET
DOVE STREET
DOVE STREET
SMITH STREETSMITH STREET
MARIA STREETMARIA STREET
GEORGE STREETGEORGE STREET
KINTORE STREET
KINTORE STREET
PORT ROAD
PORT ROAD
PORT ROAD
PORT ROAD
CAW
THO
RN
E STR
EETC
AWTH
OR
NE ST
REET
DEVON STREETDEVON STREET
KINTORE STREETKINTORE STREET
GOODENOUGH STREETGOODENOUGH STREET
LIVESTR
ON
G PATH
WAY
LIVESTR
ON
G PATH
WAY
MW1MW1
MW02MW02
MW3MW3
MW4MW4
MW5MW5
MW6MW6
MW7MW7
MW8MW8
MW9MW9
MW10MW10MW11MW11
MW12MW12
MW13MW13
MW14MW14
MW15MW15
MW16MW16
MW17MW17
MW18MW18
MW19MW19MW20MW20
MW21MW21
MW22MW22
MW23MW23
MW24MW24
MW25MW25
MW26MW26
WWAA
LLSSHHSSTT
SSMMIITTHH SSTTRREEEETT
ndnd
RRANDOLPH S
ANDOLPH STREETTREET
PPOORR
TTRR
OOAA
DD
PPOORR
TTRR
OOAA
DD
JJAM
EA
MES S
S STREET
TREET
HHOO
LLLLAANN
DDSSTT
RREEEETT
CCAAWW
TTHHOO
RRNN
EESSTT
RREEEETT
DE
DEW
SW
STREET
TREET
DDOOVVEE SSTTRREEEETT
LLIIVVEESSTTRR
OONN
GGPPAATTHH
WWAAYY
LIGHT TERRLIGHT TERRAACECE
AD
MELLA
SA
DM
ELLA STR
EETTR
EET
AALLBB
EERRTT SSTTRR
EEEETT
CHAPEL SCHAPEL STREETTREET
ndnd ndnd
100100
11000000
GEGEORORGE SGE STREETTREET
1010000000
PPOORRTT RROOAADD PPOORRTT RROOAADD
DDEEWW
SSTTRREEEETT
1010000000 11000000 MMAARRIIAA SSTTRREEEETT
100100
JJAAMM
EESSCC
OONN
GGDD
OONN
DDRR
IIVVEE
KKIINNTTOORREE SSTTRREEEETT ndnd
KKIINNTTOORREE SSTTRREEEETT
PPAARR
KKEERR
SSTTRREEEETT GGOOOODDEENNOOUUGGHH SSTTRREEEETT
DDEEVVOONN SSTTRREEEETT
FIGURE 5 GROUNDWATER CONCENTRATION PLAN
MW2MW244
MMWW88 TCE lt1
PCE lt1
11-DCE lt1TCE lt1
12-DCE lt1PCE lt1
11-DCE lt1MW2MW255 12-DCE lt1
TCE 2
PCE lt1
11-DCE lt1
12-DCE lt1
MW2MW222 TCE lt1
PCE lt1
11-DCE lt1MW2MW233 12-DCE lt1
TCE 21
PCE lt1
11-DCE lt1
12-DCE lt1
MW19MW19 TCE lt1
MW2MW200 TCE 70 PCE lt1MW2MW211 PCE lt1MW18MW18 11-DCE lt1
TCE 23 11-DCE lt1TCE 5 12-DCE lt1 PCE lt1 12-DCE lt1PCE lt1 11-DCE lt1
11-DCE lt1 12-DCE lt1
12-DCE lt1
MW17MW17 LEGENDTCE 24 MW14MW14
PCE lt1 TCE 1100 lt1 MW15MW15 GROUNDWATER MONITORING WELL11-DCE PCE lt1
12-DCE lt1 TCE 180 11-DCE 2MW16MW16 100 INFERRED TCE GROUNDWATERPCE lt1 12-DCE 4 CONCENTRATION CONTOURSTCE lt1 11-DCE lt1 PCE lt1 12-DCE lt1 11-DCE lt1
12-DCE lt1 MMWW1111
EPA ASSESSMENT AREAMW10MW10
TCE lt1 CADASTREMW12MW12 TCE lt14900 PCE
lt1 11-DCE lt1TCE 700 PCEMW13MW13 12-DCE lt1 TCE CONCENTRATIONS (μgL)lt1 11-DCE 7PCE
TCE lt1 lt1 12-DCE 511-DCE gtnd to lt100 100 to lt1000 1000 to lt10000
MW0MW022PCE lt1 12-DCE lt1 2100011-DCE lt1 MW9MW9 TCE
PCE lt112-DCE lt1 TCE 2(D) 11-DCE 15PCE lt1 MW5MW5
10000 to 29000
nd = non-detect (lt1)12-DCE 4511-DCE lt1 MMWW66 TCE 29000 MW4MW4 12-DCE lt1
PCE 3 TCE lt1 NotesTCE 29 11-DCE 6MW7MW7 PCE lt1PCE lt1 This is one interpretation only Other interpretations possible12-DCE 23TCE lt1 11-DCE lt111-DCE lt1 All concentrations are in μgL
12-DCE includes cis and trans PCE lt1 MW3MW3 12-DCE lt112-DCE lt1 11-DCE lt1
TCE 69 D = Duplicate result12-DCE lt1 PCE lt1
11-DCE lt1
12-DCE lt1 MW1MW1
12500 A3MW2MW266 TCE lt1
TCE 2 PCE lt1
PCE lt1 11-DCE lt1
11-DCE lt1 12-DCE lt1
12-DCE lt1
LE
VE
L 1
12
4 S
OU
TH
TE
RR
AC
E
AD
EL
AID
E S
A 5
00
0
PH
(0
8)
82
32
90
88
F
AX
(0
8)
82
32
90
99
E
MA
IL
info
fy
fec
om
au
W
EB
fy
fec
om
au
A
BN
5
7 0
08
116
13
0
0 25 50 m
CLIENT
SA EPA
PROJECT
EPA THEBARTON ASSESSMENT AREA - STAGE 1
TITLE
FIGURE 5 GROUNDWATER CONCENTRATION PLAN
PROJECT NO DATE CREATED
80607-1 280917
80607_Fig 5 - Groundwater TCE Concentration Plan r2ai REV 2 gt 280917
JAM
ES CO
NG
DO
N D
RIV
E
JAM
ES CO
NG
DO
N D
RIV
E
DEW
STREET
DEW
STREET
CHAPEL STREETCHAPEL STREET
PAR
KER
STREET
PAR
KER
STREET
POR
T RO
AD
POR
T RO
AD
POR
T RO
AD
POR
T RO
AD
LIGHT TERRACELIGHT TERRACE
DEW
STREET
DEW
STREET
WA
LSH ST
WA
LSH ST
AD
MELLA
STREET
AD
MELLA
STREET
ALB
ERT STR
EETA
LBER
T STREET
HO
LLAN
D ST
REET
HO
LLAN
D ST
REET
RANDOLPH STREET
RANDOLPH STREET
JAM
ES STREET
JAM
ES STREET
DOVE STREET
DOVE STREET
SMITH STREETSMITH STREET
MARIA STREETMARIA STREET
GEORGE STREETGEORGE STREET
KINTORE STREET
KINTORE STREET
PORT ROAD
PORT ROAD
PORT ROAD
PORT ROAD
CAW
THO
RN
E STR
EETC
AWTH
OR
NE ST
REET
DEVON STREETDEVON STREET
KINTORE STREETKINTORE STREET
GOODENOUGH STREETGOODENOUGH STREET
LIVESTR
ON
G PATH
WAY
LIVESTR
ON
G PATH
WAY
SV1SV1
SV2SV2SV3SV3SV4SV4
SV5SV5
SV7SV7SV8SV8
SV9SV9
SV10SV10
SV11SV11SV12SV12
SV13SV13
SV6SV6
WWAA
LLSSHHSSTT
SSMMIITTHH SSTTRREEEETT
RRANDOLPH S
ANDOLPH STREETTREET
PPOORR
TTRR
OOAA
DD
PPOORR
TTRR
OOAA
DD
CCAAWW
TTHHOO
RRNN
EESSTT
RREEEETT
HHOO
LLLLAANN
DDSSTT
RREEEETT
JJAM
EA
MES S
S STREET
TREET
DE
DEW
SW
STREET
TREET
DDOOVVEE SSTTRREEEETT
00
LLIIVVEESSTTRR
OONN
GGPPAATTHH
WWAAYY
LIGHT TERRLIGHT TERRAACECE
AD
MELLA
SA
DM
ELLA STR
EETTR
EET
CHAPEL SCHAPEL STREETTREET
00
AALLBB
EERRTT SSTTRR
EEEETT
1010
GEGEORORGE SGE STREETTREET
000000
PPOORRTT RROOAADD
100100000
000
1010
PPOORRTT RROOAADD
000000
DDEEWW
SSTTRREEEETT MMAARRIIAA SSTTRREEEETT
JJAAMM
EESSCC
OONN
GGDD
OONN
DDRR
IIVVEE
KKIINNTTOORREE SSTTRREEEETT 00
KKIINNTTOORREE SSTTRREEEETT
PPAARR
KKEERR
SSTTRREEEETT GGOOOODDEENNOOUUGGHH SSTTRREEEETT
DDEEVVOONN SSTTRREEEETT
FIGURE 6 SOIL VAPOUR CONCENTRATION PLAN (10m)
SSVV1111 SSV12V12 TCE lt18
SSVV1133 TCE 16
PCE lt54 TCE lt21
11-DCE lt29 PCE lt25
12-DCE lt39 11-DCE lt14
12-DCE lt18
PCE lt22
11-DCE lt12
12-DCE lt16
TCE 170
PCE lt54
11-DCE lt3
12-DCE lt39 LEGEND SSVV99
SSV10V10 SOIL VAPOUR BORE
TCE lt21 0 INFERRED TCE SOIL VAPOUR CONTOUR PCE lt25
TCE 2200011-DCE lt14 EPA ASSESSMENT AREA
PCE 1912-DCE lt18
11-DCE lt27 CADASTRE
12-DCE lt37 SVSV66SVSV77
SSVV88 TCE 22000
TCE 2300 PCE 12 SOIL VAPOUR TCE CONCENTRATIONS (μgmsup3)TCE 100000 PCE 62 11-DCE lt29PCE 84 0 to lt10000SSVV55lt2711-DCE 12-DCE lt2911-DCE lt33 10000 to lt100000
100000 to 210000 12-DCE lt36 12-DCE lt44
TCE 17000 SVSV44 SVSV22SVSV33 NotePCE 31 TCE 51000TCE 210000 This is one interpretation only Other interpretations possible11-DCE lt14 PCE 39PCE 650012-DCE lt18 39 Estimated extent of plume has utilised groundwater11-DCE11-DCE 5900 12-DCE 21 concentration data12-DCE lt71
SVSV11 All concentrations are in (μgmsup3)
TCE 6300(LD) 12-DCE includes cis and trans PCE 78 LD = Laboratory duplicate result 11-DCE lt29
12-DCE lt38
12500 A3
0 25 50 m
CLIENT
SA EPA
PROJECT
EPA THEBARTON ASSESSMENT AREA - STAGE 1
TITLE
FIGURE 6 SOIL VAPOUR CONCENTRATION PLAN (10m)
PROJECT NO DATE CREATED
80607-1 290917
80607_Fig 6 - Soil Vapour TCE Concentration Plan - 1mai REV 2 gt 290917
LE
VE
L 1
12
4 S
OU
TH
TE
RR
AC
E
AD
EL
AID
E S
A 5
00
0
PH
(0
8)
82
32
90
88
F
AX
(0
8)
82
32
90
99
E
MA
IL
info
fy
fec
om
au
W
EB
fy
fec
om
au
A
BN
5
7 0
08
116
13
0
JAM
ES CO
NG
DO
N D
RIV
E
JAM
ES CO
NG
DO
N D
RIV
E
DEW
STREET
DEW
STREET
CHAPEL STREETCHAPEL STREET
PAR
KER
STREET
PAR
KER
STREET
POR
T RO
AD
POR
T RO
AD
POR
T RO
AD
POR
T RO
AD
LIGHT TERRACELIGHT TERRACE
DEW
STREET
DEW
STREET
WA
LSH ST
WA
LSH ST
AD
MELLA
STREET
AD
MELLA
STREET
ALB
ERT STR
EETA
LBER
T STREET
HO
LLAN
D ST
REET
HO
LLAN
D ST
REET
RANDOLPH STREET
RANDOLPH STREET
JAM
ES STREET
JAM
ES STREET
DOVE STREET
DOVE STREET
SMITH STREETSMITH STREET
MARIA STREETMARIA STREET
GEORGE STREETGEORGE STREET
KINTORE STREET
KINTORE STREET
PORT ROAD
PORT ROAD
PORT ROAD
PORT ROAD
CAW
THO
RN
E STR
EETC
AWTH
OR
NE ST
REET
DEVON STREETDEVON STREET
KINTORE STREETKINTORE STREET
GOODENOUGH STREETGOODENOUGH STREET
LIVESTR
ON
G PATH
WAY
LIVESTR
ON
G PATH
WAY
SV1SV1
SV2SV2SV3SV3SV4SV4
SV5SV5
SV7SV7SV8SV8
SV9SV9
SV10SV10
SV12SV12
SV6SV6
WWAA
LLSSHHSSTT
SSMMIITTHH SSTTRREEEETT
RRANDOLPH S
ANDOLPH STREETTREET
PPOORR
TTRR
OOAA
DD
PPOORR
TTRR
OOAA
DD
CCAAWW
TTHHOO
RRNN
EESSTT
RREEEETT
HHOO
LLLLAANN
DDSSTT
RREEEETT
DE
DEW
SW
STREET
TREET
JJAM
EA
MES S
S STREET
TREET
DDOOVVEE SSTTRREEEETT
00
LIGHT TERRLIGHT TERRAACECE
LLIIVVEESSTTRR
OONN
GGPPAATTHH
WWAAYY
AD
MELLA
SA
DM
ELLA STR
EETTR
EET
CHAPEL SCHAPEL STREETTREET
00
1010000000
AALLBB
EERRTT SSTTRR
EEEETT
100100 000
000 GEGEORORGE SGE STREETTREET
PPOORRTT RROOAADD 11000000000
000 PPOORRTT RROOAADD
DDEEWW
SSTTRREEEETT MMAARRIIAA SSTTRREEEETT
100100000000
JJAAMM
EESSCC
OONN
GGDD
OONN
DDRR
IIVVEE
1010000000
KKIINNTTOORREE SSTTRREEEETT
00
KKIINNTTOORREE SSTTRREEEETT
PPAARR
KKEERR
SSTTRREEEETT GGOOOODDEENNOOUUGGHH SSTTRREEEETT
DDEEVVOONN SSTTRREEEETT
FIGURE 7 SOIL VAPOUR CONCENTRATION PLAN (30m)
SSV12V12 TCE 55
PCE lt45
11-DCE lt24
12-DCE lt32
TCE 260
PCE lt51
11-DCE lt28
12-DCE
SSVV99
lt37 LEGEND
SSV10V10 SOIL VAPOUR BORE
TCE 51 0 INFERRED TCE SOIL VAPOUR CONTOURPCE lt53
TCE 11000011-DCE lt29
EPA ASSESSMENT AREAPCE lt13012-DCE lt39
11-DCE lt69
CADASTRE12-DCE lt92 SVSV66SVSV77
SSVV88 TCE 150000
TCE 14000 56 SOIL VAPOUR TCE CONCENTRATIONS (μgmsup3)PCETCE 160000 PCE 19 11-DCE lt30PCE 310 0 to lt10000SSVV5511-DCE lt26 12-DCE lt3911-DCE 33 10000 to lt100000
100000 to lt1000000 1000000
12-DCE lt35 12-DCE 20
TCE 43000 SVSV44 SVSV22SVSV33 NotePCE 90 TCE 940000(FD)TCE 1000000 This is one interpretation only Other interpretations possible11-DCE lt15 PCE 15000PCE 1500012-DCE 30 14000 Estimated extent of plume has utilised groundwater11-DCE11-DCE 14000 12-DCE lt930 concentration data12-DCE lt930
All concentrations are in (μgmsup3) 12-DCE includes cis and trans
SVSV11 TCE 21000
FD = Field Duplicate resultPCE 21
11-DCE lt57
12-DCE lt76
12500 A3
0 25 50 m
CLIENT
SA EPA
PROJECT
EPA THEBARTON ASSESSMENT AREA - STAGE 1
TITLE
FIGURE 7 SOIL VAPOUR CONCENTRATION PLAN (30m)
PROJECT NO DATE CREATED
80607-1 290917
80607_Fig 7 - Soil Vapour TCE Concentration Plan - 3m r2ai REV 2 gt 290917
LE
VE
L 1
12
4 S
OU
TH
TE
RR
AC
E
AD
EL
AID
E S
A 5
00
0
PH
(0
8)
82
32
90
88
F
AX
(0
8)
82
32
90
99
E
MA
IL
info
fy
fec
om
au
W
EB
fy
fec
om
au
A
BN
5
7 0
08
116
13
0
- THEBARTON ASSESSMENT AREA STAGE 1 ENVIRONMENTAL ASSESSMENT FINAL REPORT | EPA REF 0524111 30 OCTOBER 2017 VOLUME 1 REPORT13
- This report is formatted to print Double Sided
- TITLE PAGE13
- CONTENTS13
- LIST OF ACRONYMS13
- EXECUTIVE SUMMARY13
- 1 INTRODUCTION
-
- 11 Purpose
- 12 General background information
- 13 Definition of the assessment area
- 14 Identification of contaminants of potential concern
- 15 Objectives
-
- 2 CHARACTERISATION OF THE ASSESSMENT AREA
-
- 21 Site identification
- 22 Regional geology and hydrogeology
- 23 Data quality objectives
-
- 3 SCOPE OF WORK
-
- 31 Preliminary work
- 32 Field investigation and laboratory analysis program
- 33 Data interpretation
-
- 4 METHODOLOGY
-
- 41 Field methodologies
- 42 Laboratory analysis
-
- 5 QUALITY ASSURANCE AND QUALITY CONTROL
-
- 51 Field QAQC
- 52 Laboratory QAQC
- 53 QAQC summary
-
- 6 ASSESSMENT CRITERIA
-
- 61 Groundwater
- 62 Soil vapour
-
- 7 RESULTS
-
- 71 Surface and sub surface soil conditions
- 72 Waterloo Membrane Samplerstrade
- 73 Groundwater
- 74 Soil vapour bores
-
- 8 GROUNDWATER FATE AND TRANSPORT MODELLING
-
- 81 Groundwater flow modelling
- 82 Solute transport modelling
-
- 9 VAPOUR INTRUSION RISK ASSESSMENT
-
- 91 Objective
- 92 Areas of interest
- 93 Risk assessment approach
- 94 Tier 1 assessment
- 95 Tier 2 assessment
- 96 Conclusions
-
- 10 CONCEPTUAL SITE MODEL
- 11 CONCLUSIONS
- 12 DATA GAPS
- 13 REFERENCES
- 14 STATEMENT OF LIMITATIONS
- FIGURES13
- FIGURE 1 SITE LOCATION AND ASSESSMENT AREA
- FIGURE 2 ASSESSMENT POINT LOCATIONS
- FIGURE 3 WATERLOO MEMBRANE SAMPLERTM TCE CONCENTRATION PLAN13
- FIGURE 4 GROUNDWATER ELEVATION CONTOUR PLAN
- FIGURE 5 GROUNDWATER CONCENTRATION PLAN
- FIGURE 6 SOIL VAPOUR CONCENTRATION PLAN (10m)
- FIGURE 7 SOIL VAPOUR CONCENTRATION PLAN (30m)
-

EPA REF 0524111 FINAL REPORT STAGE 1 ENVIRONMENTAL ASSESSMENT THEBARTON ASSESSMENT AREA
EF Exposure Frequency
EMP Environmental Management Plan
EPA Environment Protection Authority
EPC Exposure Point Concentration
EPP Environment Protection Policy
ET Exposure Time
GPA Groundwater Prohibition Area
GPR Ground Penetrating Radar
GPS Global Positioning System
HHRA Human Health Risk Assessment
HIL Health Investigation Level
HSP Health and safety Plan
IPA Isopropyl Alcohol (isopropanol or 2-propanol)
IRIS Integrated Risk Information System
ITRC Interstate Technology and Regulatory Council
JampE Johnson and Ettinger
JHA Job Hazard Analysis
LNAPL Light Non-Aqueous Phase Liquid
LOR Limit of Reporting
MGA Map Grid of Australia
MQO Measuring Quality Objectives
MTC Mass Transfer Co-efficient
NA Not Applicable
NAPL Non-Aqueous Phase Liquid
NATA National Association of Testing Authorities
ND Non Detect
NEPM National Environment Protection Measure
NHMRC National Health and Medical Research Council
NJDEP New Jersey Department of Environmental Protection
NRMMC National Resource Management Ministerial Council
PAH Polycyclic Aromatic Hydrocarbons
PCE Tetrachloroethene (perchloroethylene)
PID Photoionisation Detector
PQL Practical Quantification Limit
PSD Particle Size Distribution
QA Quality Assurance
80607-1 REV1 30102017 PAGE VI
EPA REF 0524111 FINAL REPORT STAGE 1 ENVIRONMENTAL ASSESSMENT THEBARTON ASSESSMENT AREA
QC Quality Control
RAIS Risk Assessment Information System
RFQ Request for Quote
REM Resource and Environmental Management
RPD Relative Percentage Difference
RSL Regional Screening Level
SA EPA South Australian Environment Protection Authority
SAQP Sampling and Analysis Quality Plan
SOP Standard Operating Procedure
SVOC Semi-Volatile Organic Compound
SWL Standing Water Level
SWMS Safe Work Method Statement
111-TCA 111-trichloroethane
TCE Trichloroethene
TDS Total Dissolved Solids
TRH Total Recoverable Hydrocarbons1
TRV Toxicity Reference Value
US EPA United Stated Environment Protection Agency
USGS United States Geological Survey
VC Vinyl Chloride
VIRA Vapour Intrusion Risk Assessment
VOC Volatile Organic Compound
VOCC Volatile Organic Chlorinated Compound
WHO World Health Organisation
WMStrade Waterloo Membrane Samplertrade
TRH = measurable amount of petroleum-based hydrocarbon (ie complex mixture of crude oil and natural gas (gt 250 compounds) including aromatics aliphatics paraffins unsaturated alkanes and naphthalenes) plus various other compounds including fatty acids esters humic acids phthalates and sterols
80607-1 REV1 30102017 PAGE VII
1
EPA REF 0524111 FINAL REPORT STAGE 1 ENVIRONMENTAL ASSESSMENT THEBARTON ASSESSMENT AREA
EXECUTIVE SUMMARY
Background information
An approximate 27 hectare mixed use area of Thebarton has been designated by the South Australian Environment Protection Authority (EPA) as the Thebarton EPA Assessment Area
The former Austral sheet metal works (Austral) property located over multiple allotments between George and Maria Streets from the 1920s until the 1960s-1970s has been identified as a possible source of dissolved phase groundwater chlorinated hydrocarbon (CHC) contamination Groundwater CHC impacts within the uppermost (Quaternary ndash Q1) aquifer were identified as extending in a general north-westerly direction (consistent with regional groundwater flow direction) from the south-eastern portion of the Thebarton EPA Assessment Area and having resulted in the generation of soil vapour containing elevated concentrations of CHC
The boundaries of the Thebarton EPA Assessment Area were established on the basis of the following
the previous identification of groundwater CHC contamination associated with properties located at 31-37 George Street (part of the former Austral property) and 39 Smith Street (hydraulically down-gradient of the former Austral property) in Thebarton
the fact that although the George Street property (andor the broader Austral facility of which it formed a part) was suspected to be located in the vicinity of the source the specific source site had not yet been confirmed and
the identification of an inferred (general) north-westerly groundwater flow direction within the Q1 aquifer
Key objectives
The results of the recent investigations undertaken by Fyfe have been used to assess potential vapour intrusion to indoor air risks within residential and commercialindustrial properties within the Thebarton EPA Assessment Area
The key objectives detailed by the EPA were to
further delineate the chlorinated hydrocarbon contamination in groundwater
further delineate the chlorinated hydrocarbon contamination in soil vapour initially using Waterloo Membrane Samplers (WMStrade) and
undertake a Human Health Risk Assessment Vapour Intrusion Risk Assessment (HHRAVIRA) based on the data collected
80607-1 REV1 30102017 PAGE VIII
EPA REF 0524111 FINAL REPORT STAGE 1 ENVIRONMENTAL ASSESSMENT THEBARTON ASSESSMENT AREA
With respect to the VIRA the EPA requested that there be specific consideration of
residential properties (slab on grade)
residential properties (crawl space)
residential properties (with basement) and
trenchmaintenanceutility workers that may be working in the vicinity of the contamination
Site conditions
Subsurface geological conditions are generally consistent across the Thebarton EPA Assessment Area and are dominated by the sediments (ie low to medium plasticity silty or sandy clays with variable gravel contents) of the Pooraka and Hindmarsh Clay formations While there is some potential for structural defects and coarser horizons to act as preferential pathways (lateral and vertical) for soil vapour movement no significant spatially-consistent features were identified during the recent soil drillinglogging work ndash although thin gravel lenses were identified within the subsurface at some locations and a 15 m thick layer of gravel was encountered at 12 to 135 m below ground level (BGL) during the drilling of groundwater well MW17 the latter consistent with the depth of groundwater within the Q1 aquifer
Soil
Groundwater within the Q1 aquifer is located at a depth of approximately 123 to Groundwater 159 m BGL and flows in a general north-westerly direction The closest surface water receptor is the River Torrens located approximately 03 km to the east and 07 km to the north and north-west A groundwater flow velocity range of approximately 44 to 23 myear has been inferred and the groundwater gradient is relatively flat (ie 000062 to 00012)
Beneficial uses for groundwater within the Q1 aquifer beneath the Thebarton EPA Assessment Area have been identified (based on factors such a groundwater salinity registered bore use and the locations of potential sensitive receptors) as including domestic irrigation primary contact recreationaesthetics human health in non-use scenarios (ie vapour flux) and possibly also potable
Contaminants of Potential Concern (COPC)
The contaminants of potential concern (COPC) for the Thebarton EPA Assessment Area comprise a number of CHC The main COPC has been identified as trichloroethene (TCE) a solvent historically used for metal cleaningdegreasing activities in various manufacturing industries Additional COPC identified for the assessment area include the breakdown products of TCE namely 12-dichloroethene (12-DCE cis- and trans-) and vinyl chloride (VC) as well as other solvents such as tetrachloroethene (PCE) and 11-dichloroethene (11-DCE)
80607-1 REV1 30102017 PAGE IX
EPA REF 0524111 FINAL REPORT STAGE 1 ENVIRONMENTAL ASSESSMENT THEBARTON ASSESSMENT AREA
Scope of work
A groundwater and soil vapour monitoring program was undertaken by Fyfe across the Thebarton EPA Assessment Area between May and August 2017 It involved the following scope of work
installation of a total of 41 WMStrade units to 1 m BGL in an approximate grid-pattern across the entire assessment area (Round 1) and at specific targeted locations (Round 2) followed by laboratory analysis of retrieved sample units for specific CHC
drilling and installation of 25 groundwater wells to depths of between 15 and 19 m BGL including a background well to the east of the southern portion of the assessment area
testing of 30 selected groundwater well drill core samples for geotechnical parameters
gauging and sampling of the 25 newly installed groundwater wells as well as an existing well located in Admella Street followed by laboratory analysis of all samples for specific CHC and 10 selected samples for major cationsanions natural attenuation parameters and additional nutrients
aquifer permeability (rising and falling head ldquoslugrdquo) testing of 10 groundwater wells
drilling and installation of 13 soil vapour bores including 11 nested bores (ie to 1 and 3 m BGL) and two bores to 1 m BGL and
sampling of all soil vapour bores followed by laboratory analysis of samples for specific CHC and general gases
The soil vapour data were used to undertake a VIRA aimed at predicting indoor air concentrations of TCE under various land use and building construction scenarios In order to validate the results of the modelling which includes a number of conservative assumptions and is therefore expected to over-estimate potential risk the EPA has commissioned indoor air monitoring in a number of residential properties within the Thebarton EPA Assessment Area ndash the indoor air monitoring results will be reported under separate cover
Groundwater fate and transport modelling was undertaken to provide a preliminary estimate of the future extent of CHC impacted groundwater within the Thebarton EPA Assessment Area The provision of this information is aimed at supporting the definition (extent and geometry) of a potential future Groundwater Prohibition Area (GPA) to be designated by the EPA in accordance with the provisions of Section S103S of the Environment Protection Act 1993
80607-1 REV1 30102017 PAGE X
EPA REF 0524111 FINAL REPORT STAGE 1 ENVIRONMENTAL ASSESSMENT THEBARTON ASSESSMENT AREA
Identified impacts
Contaminants identified in the Q1 aquifer beneath the Thebarton EPA Assessment Area include TCE PCE 12-DCE (cis- and trans-) and 11-DCE Although TCE PCE and 11-DCE are all considered to represent primary contaminants TCE is considered to be the main COPC (ie with the highest concentrations and greatest distribution) By comparison cis- and trans-12-DCE which are considered to represent break-down
Groundwater
(ie daughter) products of TCE andor PCE occur at relatively minor concentrations at scattered locations and were not considered indicative of significant TCE breakdown (ie via dechlorination) Although VC represents another (expected) daughter product of TCE it was not detected in any of the groundwater wells tested
The groundwater TCE plume is considered to have migrated in a north-westerly direction from the suspected (Austral) source site in accordance with the predominant flow direction associated with the Q1 aquifer The plume has been traced as far west and north as Dew Street and Smith Street respectively within the Thebarton EPA Assessment Area (ie the extent of the monitoring well network installed by Fyfe) ndash whereas its north-western extent has not yet been determined the groundwater CHC plume has been delineated in all other directions
Contaminants identified in soil vapour beneath the Thebarton EPA Assessment Area include TCE PCE 12-DCE (cis- and trans-) and 11-DCE The distribution of TCE in soil vapour at 1 and 3 m BGL generally correlates with the north-westerly groundwater flow direction and is therefore considered to be a product of volatilisation from the groundwater CHC plume ndash the consistent decrease in soil vapour concentrations with decreasing depth also supports this conclusion
Soil vapour
The soil vapour samples with the maximum TCE concentrations also had the highest PCE and 11-DCE concentrations (or elevated laboratory limits of reporting (LOR)) thereby suggesting that they could represent co-contaminants (ie from a similar source areaactivity) These samples also had elevated LOR for 12-DCE (cis- and trans-)
Although VC was not detected in any of the soil vapour samples the laboratory LOR for VC in most of the samples with the highest concentrations of TCE exceeded the adopted health investigation levels (HILs) for residential andor commercialindustrial land use Although the absence of VC in soil vapour cannot therefore be confirmed its absence at detectable levels in groundwater suggests that (limited) TCE degradation has not yet resulted in its production
Although the extent of the soil vapour TCE plume has not yet been determined (ie in any direction) it is expected to have a similar extent to that of the identified groundwater plume (ie as the groundwater CHC impacts represent the source of the measured soil vapour CHC concentrations)
80607-1 REV1 30102017 PAGE XI
EPA REF 0524111 FINAL REPORT STAGE 1 ENVIRONMENTAL ASSESSMENT THEBARTON ASSESSMENT AREA
Assessment of risk
Measured concentrations of TCE exceeded the adopted assessment criteria for potable use andor primary contact recreation in wells located on Admella Maria George Albert Chapel and Dew Streets as well as Light Terrace ndash with the highest concentrations corresponding to the ldquocorerdquo area of the plume One well on Albert Street also contained a concentration of carbon tetrachloride that exceeded the respective potable criterion
Groundwater risks
Although groundwater vapour flux has mainly been addressed by the VIRA it could also occur during the extraction of groundwater for domestic use and in terms of aesthetic considerations the CHC impacted groundwater could be odorous
Additional parameters measured for the purpose of establishing general aquifer conditions (including whether conditions may be amenable to the breakdown of CHC) have also been reported ndash no clear secondary lines of evidence for the occurrence of natural attenuation have been identified
The groundwater modelling undertaken by Arcadis involved the development of an Groundwater fate and transport initial groundwater flow model using MODFLOW followed by the development of a modelling site-specific (three-dimensional) solute transport model using the MT3DMS transport
code
The results of this modelling were interpreted to indicate the following
although scattered detectable concentrations of 12-DCE have been measured in groundwater across the Thebarton EPA Assessment Area the absence of significant and ubiquitous TCE daughter products indicate that substantial dechlorination is not occurring and
the dissolved phase groundwater TCE plume is predicted to extend by another 500 m (ie beyond the boundaries of the current Thebarton EPA Assessment Area) over the next 100 years whereas no significant lateral plume expansion is expected
The VIRA undertaken by Arcadis involved a two-tier assessment approach Whereas Vapour intrusion the Tier 1 screening risk assessment compared the measured soil vapour CHC concentrations to (modified) guideline values the Tier 2 risk assessment involved the application of the Johnson and Ettinger vapour intrusion model to predict indoor air CHC concentrations for residential (slab on grade crawl space and basement construction) and commercialindustrial (slab on grade construction) properties across the assessment area Site-specific geotechnical parameters and soil vapour data collected from 1 and 3 m BGL throughout the Thebarton EPA Assessment Area were used in the modelling It should be noted that overall the vapour modelling
risks
80607-1 REV1 30102017 PAGE XII
EPA REF 0524111 FINAL REPORT STAGE 1 ENVIRONMENTAL ASSESSMENT THEBARTON ASSESSMENT AREA
undertaken is expected to provide an over-estimation of the actual vapour exposure concentrations
The results of the VIRA with respect to the predicted indoor air concentrations of TCE within residential properties (assuming crawl space construction) versus adopted EPA response levels indicated that 21 (ie of approximately 130 residential properties) were predicted to have detectable levels of TCE in indoor air that require further action as follows
10 properties within the investigation range (2 to lt20 microgm3)
eight properties within the intervention range (20 to lt200 microgm3) and
three properties within accelerated intervention range (ge200 microgm3)
All remaining residential properties in the Thebarton EPA Assessment Area are considered to be safe from soil vapour intrusion with predicted indoor air concentrations of TCE below 2 microgm3 (assuming crawl space construction) Based on the results of the VIRA however substantially increased risks are likely to exist should cellarsbasements be present whereas risks may be lower for slab on grade construction premises
Where permission has been granted by the ownersoccupiers indoor air monitoring of properties within the 20 to lt200 microgm3 and ge200 microgm3 response level ranges as well as selected adjoining properties has been commissioned by the EPA to validate the results of the VIRA modelling (ie which is expected to be overly-conservative) ndash these results will be documented in a subsequent report
Calculated vapour intrusion risks to workers within commercialindustrial properties (slab on grade construction) across at least part of the Thebarton EPA Assessment Area (ie as determined for the maximum soil vapour CHC concentrations in soil vapour bore SV3 located on Maria Street) are considered to be unacceptable Although a basementcellar is known to be present at one commercial property on George Street vapour intrusion risks to subsurface structures associated with commercialindustrial properties have not yet been assessed
A qualitative assessment of potential risks to subsurface trenchmaintenanceutility workers indicated that exposure management may be required in areas where TCE concentrations at 1 m BGL are above 100 microgm3 (ie corresponding to 50 times the acceptable concentration for indoor air) Exposure management should involve the development of a site-specific health and safety plan (prior to the commencement of work in the affected area) that details measures such as restricting personnel exposure times monitoring volatile compounds using a photoionisation detector (PID) unit providing increased ventilation and using appropriate personal protective equipment (eg gas masks) as required
80607-1 REV1 30102017 PAGE XIII
EPA REF 0524111 FINAL REPORT STAGE 1 ENVIRONMENTAL ASSESSMENT THEBARTON ASSESSMENT AREA
Data gaps
Based on the results obtained during the recent Fyfe investigations as well as available historical information the following data gaps have been identified for the Thebarton EPA Assessment Area
property information assumed for the vapour intrusion modelling has not been confirmed (ie current land use (residential versus commercial) building construction type (slab crawl space presence of basements and cellars including cellarsbasements for commercial properties)
groundwater uses considered for the beneficial use assessment have not been confirmed (whether bores are registered or not)
the conclusions are based on a single sampling event meaning the understanding of temporal and spatial variation is limited for both groundwater and soil vapour and
the groundwater contamination has not been fully delineated in the hydraulically down-gradient direction (north-west) and hence the groundwater fate and transport modelling is not validated
Notes ie the interim soil vapour HILs adopted from the National Environment (Assessment of Site Contamination) Measure 1999 (as revised in 2013 ndash ie the ASC NEPM (1999)) but assuming a sub-slab to indoor air attenuation factor of 003 as compared to the value of 01 adopted by the ASC NEPM (1999)
80607-1 REV1 30102017 PAGE XIV
EPA REF 0524111 FINAL REPORT STAGE 1 ENVIRONMENTAL ASSESSMENT THEBARTON ASSESSMENT AREA
1 INTRODUCTION
11 Purpose
Fyfe Pty Ltd (Fyfe) was commissioned by the South Australian Environment Protection Authority (SA EPA referred to herein as the EPA) to undertake Stage 1 groundwater and soil vapour investigation works groundwater fate and transport modelling and a human health vapour intrusion risk assessment (VIRA) within an EPA designated assessment area located within Thebarton South Australia (herein referred to as the Thebarton EPA Assessment Area) The location and extent of the Thebarton EPA Assessment Area referenced within this document is identified on Figure 1
12 General background information
Previous environmental assessment work undertaken since 1994 (as summarised in Appendix A) combined with historical information provided by the EPA (as included in Appendix B) indicates that the Thebarton EPA Assessment Area has been used for mixed residential and commercialindustrial purposes over time
Groundwater impacts2 identified within the uppermost (Quaternary ndash Q1) aquifer in the vicinity of the former Austral sheet metal works (Austral) on George Street included both petroleum hydrocarbons (ie diesel fuel) as well as chlorinated hydrocarbon compounds (CHC) such as trichloroethene (TCE) and were first notified to the EPA in 2006
Available historical information for the Austral property (ie the suspected source site) indicates that it operated from the 1920s until the 1960s-1970s and occupied an extensive area of Thebarton including
part of the southern side of George Street extending from about half way between East Terrace3 and Admella Street (ie 11-25 George Street) to the west of Admella Street (ie 31-35 George Street)
the entire northern side of Maria Street from East Terrace to the west of Admella Street
part of the southern side of Maria Street (ie from 21 Maria Street) to Admella Street and
25-27 East Terrace
2 Note that the term ldquoimpactrdquo has been used by Fyfe to indicate identified concentrations of compounds (specifically chlorinated hydrocarbons) that are not naturally occurring (ie concentrations above background that have resulted from anthropogenic activities) The use of this term does not denote that the presence of these compounds represents a risk to either human health or the environment and the term ldquoimpactrdquo is therefore not directly interchangeable with the term ldquoSite Contaminationrdquo the latter defined under the Environment Protection Act 1993 to include actual or potential harm to human health andor the environment
3 now James Congdon Drive
80607-1 REV1 30102017 PAGE 1
EPA REF 0524111 FINAL REPORT STAGE 1 ENVIRONMENTAL ASSESSMENT THEBARTON ASSESSMENT AREA
Historical newspaper articles described the Austral property as hosting a factory that extended over more than three acres and included an electroplating facility In 1938 it was described as the largest aluminium utensil manufacturing company in the southern hemisphere
Other potential sources of groundwater contamination4 identified within the Thebarton EPA Assessment Area include a former gas works (ie located to the south and south-east of the Austral property and including the current Ice Arena property) a mechanicrsquos workshop another sheet metal working facility and a farm machinery manufacturer
The Stage 1 assessment work described herein was commissioned by the EPA to determine whether historical contamination in the vicinity of George Street was presenting a risk to human health or the environment
13 Definition of the assessment area
As detailed on Figure 1 the current EPA Assessment Area covers an area of approximately 27 ha within the suburb of Thebarton located approximately 2 km north-west of the Adelaide central business district (CBD)
The boundaries of the Thebarton EPA Assessment Area were established by the EPA on the basis of the following
the previous identification of groundwater CHC contamination associated with properties located at 31-37 George Street and 39 Smith Street in Thebarton (refer to Appendix A)
the fact that although the George Street property (andor the broader Austral facility of which it formed a part) was suspected to be located in the vicinity of the source the specific source site had not yet been confirmed and
the identification of an inferred (general) north-westerly groundwater flow direction within the Q1 aquifer
14 Identification of contaminants of potential concern
The contaminants of potential concern (COPC) for the Thebarton EPA Assessment Area comprise a number of CHC The main COPC has been identified as trichloroethene (TCE) a solvent historically used for metal cleaningdegreasing activities in various manufacturing industries Additional COPC identified for the assessment area include the breakdown products of TCE namely 12-dichloroethene (12-DCE cis- and trans) and vinyl chloride (VC) as well as other solvents such as tetrachloroethene (PCE) and 11-dichloroethene (11-DCE)
Site Contamination is defined by the Environment Protection Act 1993 as existing if chemical substances are present on or below the surface of a site in concentrations above background the contaminants are there as a result of activity at the site or elsewhere and their presence has resulted in actual or potential harm (that is not trivial) to the health and safety of human beings taking into account current and proposed land uses or water or the environment
PAGE 2 80607-1 REV1 30102017
4
EPA REF 0524111 FINAL REPORT STAGE 1 ENVIRONMENTAL ASSESSMENT THEBARTON ASSESSMENT AREA
15 Objectives
As defined by the EPA the key objectives of the recent Stage 1 environmental assessment program undertaken within the Thebarton EPA Assessment Area (refer to Figure 1) were to
further delineate the chlorinated hydrocarbon contamination in groundwater
further delineate the chlorinated hydrocarbon contamination in soil vapour initially using Waterloo Membrane Samplers (WMStrade) and
undertake a Human Health Risk Assessment Vapour Intrusion Risk Assessment (HHRAVIRA) based on the data collected
With respect to the VIRA the EPA requested that there be specific consideration of
residential properties (slab on grade)
residential properties (crawl space)
residential properties (with basement) and
trenchmaintenanceutility workers that may be working in the vicinity of the contamination
80607-1 REV1 30102017 PAGE 3
EPA REF 0524111 FINAL REPORT STAGE 1 ENVIRONMENTAL ASSESSMENT THEBARTON ASSESSMENT AREA
2 CHARACTERISATION OF THE ASSESSMENT AREA
21 Site identification
For the purpose of this investigation program the Thebarton EPA Assessment Area (as delineated in Figure 1) has been defined by the following roadways
North northern verge of Smith Street
South Maria Street (between Dew Street and Albert Street) portion of Parker Street (between Maria Street and Goodenough Street) and Goodenough Street (between Parker Street and James Congdon Drive)
East western verge of Port Road and James Congdon Drive and
West western verge of Dew Street
22 Regional geology and hydrogeology
221 Geology
The Thebarton area is located within the Adelaide Plains approximately 8 km to the east of Gulf St Vincent and to the west of the Para Fault It lies within the Golden Grove ndash Adelaide Embayment area of the St Vincent Basin which consists of a succession of Tertiary and Quaternary age sediments (with thicknesses of up to 600 m) overlying basement rocks
The 1250000 Adelaide geological map (SA Department of Mines and Energy 1969) indicates that the near-surface geology of the area consists primarily of Quaternary aged soils and sediments including the Pooraka and Hindmarsh Clay formations The Pleistocene aged Pooraka Formation generally comprises a thickness of approximately 10 m and is of alluvial origin comprising sandy clays and clayey to sandy silts interbedded with layers of clay sand andor gravel The underlying Pleistocene aged Hindmarsh Clay Formation represents the basal unit of the Adelaide Plains and has a maximum general thickness of more than 100 m It generally comprises a basal gravel layer a middle layer of mottled medium to high plasticity (red-brown yellow brown greygreen to orange) often stiff to hard clays and an upper layer of fluvial and alluvial red-brown silty sand Gerges (1999) describes Hindmarsh Clay as comprising a mottled brown to pale olive grey predominantly clay formation that becomes green grey towards the basal section (approximately 16 to 20 m below ground level (BGL)) and is characterised by an increasing gravel content with depth
Underlying the Hindmarsh Clay are sands and limestone of Tertiary age which are in turn underlain by metamorphosed basement rock of the Proterozoic Umberatana Group
80607-1 REV1 30102017 PAGE 5
EPA REF 0524111 FINAL REPORT STAGE 1 ENVIRONMENTAL ASSESSMENT THEBARTON ASSESSMENT AREA
222 Hydrogeology
According to Gerges (2006) the aquifers identified within the Quaternary aged sediments of the Adelaide Plains are typically found within the coarser interbedded silt sand and gravel layers of the Hindmarsh Clay Formation and vary greatly in thickness (typically from 1 to 18 m) lithology and hydraulic conductivity Confining beds between the Quaternary aquifers consist of clay and silt layers and range in thickness from 1 to 20 m These confining beds vary in terms of the amount of coarser grained material they contain their bulk hydraulic conductivity andor the presence and density of fractures In addition their absence in some areas allows direct hydraulic connection between the aquifers
The Thebarton area is located within Hydrogeological Zone 3 (Subzone 3E) of Gerges (2006) This zone contains five to six Quaternary aquifers and three to four almost flat-lying Tertiary aquifers The first Tertiary aquifer estimated by Gerges (2006) to be intersected at a depth of approximately 130 m BGL near the Para Fault is most frequently accessed for industrial and recreational groundwater use
The Q1 aquifer assessed as part of the current investigations is typically located at depths of between 3 and 10 m BGL beneath the Adelaide Plains with an average thickness of 2 m The Q1 aquifer contains water of variable salinity with Subzone 3E including a range of 500 to 3500 mgL total dissolved solids (TDS) The gradient of the Q1 aquifer is generally flat (particularly to the west of the Para Fault) and flow direction is typically towards the north-west
A search of the registered bore database maintained by the Department of Environment Water and Natural Resources (DEWNR (2017) WaterConnect database) identified 59 bores within the general Thebarton area of which 18 are located in the Thebarton EPA Assessment Area Although eight bores were installed for monitoring purposes on or immediately adjacent to the property located at 31-37 George Street (ie part of the former Austral facility) it is understood that only one bore (6628-21951 ndash located within the Admella Street roadway intersecting the Q1 aquifer and identified as MW01 in Appendix A but MW02 by Fyfe5) remains in situ
In addition to numerous monitoringinvestigationobservation bores the Q1 aquifer within the general (ie broader) Thebarton area is recorded in the DEWNR (2017) database as being accessed for drainage domestic and industrial purposes
DEWNR (2017) information for registered bores located within the general Thebarton area is included in Appendix C whereas information for bores located within the Thebarton EPA Assessment Area (excluding those associated with the property at 31-37 George Street and installed solely for monitoring purposes6) is summarised in Table 21
5 This existing groundwater well was identified as MW02 by Fyfe in accordance with the markings on the gatic cover and the DEWNR (2017) WaterConnect bore identification details although it was originally installed as MW01 by REM (refer to discussion of previous reports in Appendix A)
6 ie 6628-21951 6628-21952 6628-22229 to 6628-22233 and 6628-22236
PAGE 6 80607-1 REV1 30102017
EPA REF 0524111 FINAL REPORT STAGE 1 ENVIRONMENTAL ASSESSMENT THEBARTON ASSESSMENT AREA
Table 21 Information regarding registered groundwater bores located within the Thebarton EPA Assessment Area
Bore ID Location Purpose Status Maximu SWL Salinity Yield Aquifer m well (m (mgL (Lsec
Tertiary (T1)
depth BGL) TDS) ) (m BGL)
125 6628-516 Coca Cola plant Rehabilitated 138 1963 794
6628-1435 Coca Cola plant Backfilled 184 212 921 392 Tertiary (T1)
6628-4576 Corner of Admella amp Chapel Streets
125 1454 445 Tertiary (T1)
6628-7724 Coca Cola plant Observation 155 2017 1272 1516 Tertiary (T1)
6628-7725 Coca Cola plant Observation 127 3016 1100 1005 Tertiary (T1)
6628-12516 Coca Cola plant Industrial Backfilled 210 212 1300 1875 Tertiary (T1)
6628-20663 39 Smith Street Irrigation 121 1105 50 Tertiary (T1)
6628-20969 39 Smith Street Industrial 30 14 1535 25 Quaternary (Q1)
6628shy21951
Admella Street 20 Quaternary (Q1)
6628-22395 21 James Congdon Drive
20 157 1541 05 Quaternary
6628-23525 41 Maria Street 206 273 1078 10 Tertiary (T1)
Notes Shading indicates that information was not recorded in the database as interpreted from information provided in the database ndash approximate only in some instances
ie MW02 as included in the groundwater monitoring program of Fyfe ndash refer to Table 31 Abbreviations BGL = below ground level SWL = standing water level TDS = total dissolved solids
23 Data quality objectives
The Data Quality Objective (DQO) process as described in Australian Standard AS44821-2005 and the National Environment Protection (Assessment of Site Contamination) Measure (ASC NEPM 1999)7
Schedule B2 Guideline on Data Collection Sample Design and Reporting and more fully documented in the NSW DEC (2006) Guidelines for the NSW Site Auditor Scheme involves a seven-step iterative approach that was initially developed by the United States Environment Protection Agency (US EPA) to facilitate the systematic planning and verification of contaminated sites assessment projects
As stated in Schedule B2 of the ASC NEPM (1999) the first six steps of the DQO process comprise the development of qualitative and quantitative statements that define the objectives of the site assessment program and the quantity and quality of data needed to inform risk-based decisions These steps enable the
All references to the ASC NEPM (1999) refer to the version amended on 16 May 2013
80607-1 REV1 30102017 PAGE 7
7
EPA REF 0524111 FINAL REPORT STAGE 1 ENVIRONMENTAL ASSESSMENT THEBARTON ASSESSMENT AREA
project team to communicate the goals decisions constraints (eg time budget) and uncertainties associated with the project and detail how they are to be addressed The seventh step comprises the development of a Sampling and Analysis Quality Plan (SAQP) to generate the data required to adequately characterise site contamination issues and assess their associated potential environmental and human health risks under the proposed land use scenario
The DQOs defined for the Thebarton EPA Assessment Area are summarised in Table 22
Table 22 Data Quality Objectives
Objective Comment
Step 1 ndash Statement of the Problem According to information provided to Fyfe by the EPA (as summarised in Appendix A) a property located at 31-37 George Street (immediately west of Admella Street) in Thebarton and historically occupied by part of the Austral facility had been found to be underlain by groundwater CHC (primarily TCE) impacts More recent reporting to the EPA for a property at 39 Smith Street located approximately 350 m north-west (and hydraulically down-gradient) of the George Street property indicated that detectable CHC (predominantly TCE) were also present within groundwater Since this area of Thebarton is occupied by a mixture of commercialindustrial and residential properties and the source and extent of the CHC impacts within the Q1 aquifer had not yet been determined potential risks to human health andor the environment had yet to be assessed
Step 2 ndash The Decision that Needs The assessment works commissioned by the EPA were necessitated to to Result from the Investigation investigate the source extent and magnitude of the groundwater CHC
contamination beneath a designated area of Thebarton (ie that included both the George Street and Smith Street properties) and to understand the possible risk to public health from potential vapour generation Fyfe have therefore undertaken vapour modelling and intrusion risk assessment works aimed at evaluating whether concentrations of identified groundwater andor soil vapour contaminants pose an unacceptable risk to human health In addition groundwater fate and transport modelling has been undertaken to predict the extent of the plume This will assist the EPA to determine a potential future Groundwater Prohibition Area (GPA) in accordance with the provisions of Section 103S of the Environment Protection Act 1993
Step 3 ndash Inputs to the Decision The information that was required to resolve the decision statement included the collection of physical and chemical data from across the Thebarton EPA Assessment Area The collected data as well as physical observations regarding the geology of the area and possible preferential contaminant pathways was used to determine potential risks to human health via groundwater fate and transport and vapour intrusion modelling
Step 4 ndash Boundaries of the Investigation
The lateral boundaries of the Thebarton EPA Assessment Area are as defined in Sections 13 and 21 as depicted on Figure 1 Vertically the investigations extended as far as the maximum drilled depth (19 m BGL)
Step 5 ndash Decision Rules The decision rule will be based upon the identification of predicted indoor air concentrations of CHC compounds associated with groundwater andor soil vapour impacts which exceed adopted response levels
PAGE 8 80607-1 REV1 30102017
EPA REF 0524111 FINAL REPORT STAGE 1 ENVIRONMENTAL ASSESSMENT THEBARTON ASSESSMENT AREA
Objective Comment
Step 6 ndash Decision Error Tolerances The purpose of establishing decision error tolerance is to control the acceptable degree of uncertainty upon which decisions are made in order to avoid the making of an incorrect decision and to enable identification of additional investigation monitoring or remediation activities required on the basis of accurate data for the protection of human health and the environment The Measuring Quality Objectives (MQO) include the quality assurance (QA) activities that were conducted during the assessment the quality control (QC) acceptance criteria applicable to the assessment and the adopted Data Quality Indicators (DQIs) as follows (and further discussed in Section 5) completeness ndash a measure of the amount of useable data from a data
collection activity comparability ndash the confidence (expressed qualitatively) that data may be
considered to be equivalent for each sampling and analytical event representativeness ndash the confidence (expressed qualitatively) that data
are representative of each media present on the site precision ndash a quantitative measure of the variability (or reproducibility) of
data and accuracy (bias) ndash a quantitative measure of the closeness of reported data
to the true value
Step 7 ndash Optimisation of the Data collection was undertaken in general accordance with the Sample Collection Design methodologies outlined in the relevant documentsguidelines referenced
throughout this report As determined by the EPA the data collection design included targeted sampling to investigate and delineate areas of potential groundwater and soil vapour contamination and to assess potential associated human health risks
80607-1 REV1 30102017 PAGE 9
EPA REF 0524111 FINAL REPORT STAGE 1 ENVIRONMENTAL ASSESSMENT THEBARTON ASSESSMENT AREA
3 SCOPE OF WORK
The scope of work undertaken by Fyfe was generally consistent with that requested within the original EPA request for quote (RFQ) dated 27 March 2017 Some modifications to the original workscope occurred based on site findings and additional site information was collected where required and as agreed with the EPA in order to achieve the EPArsquos project objectives outlined in Section 15
As identified in the RFQ the scope of work was designed to
provide an initial delineation of CHC impacts in soil vapour through the deployment of Waterloo Membrane Samplers (WMStrade) as a screening tool
further delineate the previously identified CHC impacts in groundwater
decide based on the results of the WMStrade and groundwater results the need for the number of and the locations of permanent soil vapour monitoring bores
identify the nature extent and potential source area(s) of the identified CHC impacts in groundwater andor soil vapour
determine the likely fate and transport of the groundwater CHC plume to support the establishment of a potential future GPA
determine the potential human health (including vapour intrusion) risk(s) on the basis of the data collected and
ascertain whether or not a public health risk exists within the Thebarton EPA Assessment Area
The scope of work is further detailed in Section 32 Variations from the scope of work originally requested in the EPA RFQ were agreed with the EPA during the course of the project and included the following
deployment of an additional four WMStrade units ndash ie 41 in total as compared to the original allowance of 37
installation (and sampling) of an additional six nested soil vapour bores (to depths of 1 and 3 m BGL) ndash ie 11 in total as compared to the original allowance of five
installation (and sampling) two individually located (ie as opposed to the nested locations) soil vapour bores to a depth of 1 m BGL ndash ie as compared to the original allowance of 10
installation (and sampling) of 25 groundwater monitoring wells ndash ie as compared to the original allowance of 20 and
sampling of an existing well in Admella Street (MW02) ndash ie not included in the original EPA scope
80607-1 REV1 30102017 PAGE 11
EPA REF 0524111 FINAL REPORT STAGE 1 ENVIRONMENTAL ASSESSMENT THEBARTON ASSESSMENT AREA
31 Preliminary work
Preliminary work involved the following
review and summation of all available historical reports (as supplied by the EPA) ndash refer to Appendix A
development of a preliminary (working) conceptual site model (CSM) based on a review of the historical data
preparation of a detailed health and safety plan covering all aspects and stages of the work and
detailed planning with key stakeholders prior to the execution of the field investigation program
32 Field investigation and laboratory analysis program
The scope of the field investigation program undertaken by Fyfe between 31 May and 28 August 2017 is summarised in Table 31 whereas the scope of the laboratory testing program is summarised in Table 32
A plan showing the various assessment point locations is included as Figure 2
Table 31 Scope of field investigation program ndash May to August 2017
Scope Item Description of works Date of works
Passive soil vapour sampling ndash Round 1
Thirty-seven WMStrade units identified as WMS 1 to WMS 37 were installed within the soil profile to 1 m BGL at scattered (approximately grid-like) locations across the Thebarton EPA Assessment Area
31 May and 1 to 2 June
The WMStrade units were extracted and forwarded to the analytical laboratory 7 June
Soil bores were located using a hand-held global positioning system (GPS) unit before being backfilled with (drillerrsquos) sand
7 August
Monitoring well drilling and installation
Individual groundwater well permits were obtained from DEWNR prior to well installation ndash copies of the well permits are included in Appendix D Groundwater monitoring wells (MW1 MW3 and MW5 to MW26) were installed to depths of between 15 and 19 m BGL at 24 locations across the Thebarton EPA Assessment Area Background well MW4 was installed to 19 m BGL within a public recreational area located across James Congdon Drive to the east (ie near the south-eastern corner of the Thebarton EPA Assessment Area) All 25 newly installed wells were developed following installation
28 to 30 June 3 to 7 July and 10 to 14 July
Geotechnical soil testing
Intact soil cores collected during the drilling of 10 groundwater wells (MW3 MW5 MW7 MW11 MW12 MW17 MW19 MW21 MW22 and MW25) were forwarded to the analytical laboratory for geotechnical testing
Groundwater gauging
All 25 newly installed monitoring wells (MW1 and MW3 to MW26) as well as the existing Admella Street well (MW02) were gauged to assess total well depth standing water level (SWL) and the presenceabsence of non aqueous phase liquid (NAPL) This was undertaken as a discrete event prior to the commencement of groundwater sampling
18 July
PAGE 12 80607-1 REV1 30102017
EPA REF 0524111 FINAL REPORT STAGE 1 ENVIRONMENTAL ASSESSMENT THEBARTON ASSESSMENT AREA
Scope Item Description of works Date of works
Groundwater sampling
All 26 existing and newly installed wells were sampled using a combination of low flow (micropurge) and HydraSleevetrade sampling techniques (as recorded on the field sampling sheets in Appendix E) ndash samples were forwarded to the analytical laboratories
18 to 21 and 24 to 25 July
Aquifer testing Aquifer permeability (slug) testing was undertaken on 10 wells (MW02 MW3 MW7 MW14 MW17 MW20 MW21 MW23 MW25 and MW26) Data was subsequently evaluated by Arcadis Pty Ltd (Arcadis) to estimate the hydraulic conductivity of the aquifer beneath the Thebarton EPA Assessment Area (refer to Section 732)
28 July
Soil vapour bore drilling and installation
Following the receipt of the groundwater data 11 nested soil vapour bores (SV1 to SV10 and SV12) were installed to a depth of 1 and 3 m BGL at selected locations within the Thebarton EPA Assessment Area Two additional soil vapour bores (SV11 and SV13) were installed to a depth of 1 m BGL
18 21 and 22 August
Active soil vapour sampling
Sampling of soil vapour bores was undertaken using summa canister (TO-15) sample collection methods Vapour (canister) and general gas (Tedlar bag) samples were extracted from all 13 locations (ie SV1 to SV13) including the 11 nested bores
24 August
Passive soil vapour sampling ndash Round 2
Following the receipt of the groundwater data and for the purposes of comparison with the soil vapour bore data an additional four WMStrade units (WMS 38 to WMS 41) were installed within the soil profile to 1 m BGL at targeted locations across the Thebarton EPA Assessment Area (ie within approximately 1 m of soil vapour bores SV2 SV4 SV5 and SV7) Soil bores were located using a hand-held GPS unit
18 August
The WMStrade units were extracted and forwarded to the analytical laboratory and the soil bores were backfilled with (drillerrsquos) sand
24 August
Surveying The locations of all soil vapour bores and groundwater wells were surveyed by a licensed surveyor relative to the Map Grid of Australia (MGA) 1994 and the top of each bore was surveyed relative to Australian Height Datum (AHD) The survey data are included in Appendix F
22 July and 28 August
Notes as determined by the EPA
Table 32 Scope of laboratory testing program
Scope Item Description of works
Soil geotechnical testing
Soil samples from each of three depths within core samples collected during the drilling of groundwater wells MW3 MW5 MW7 MW11 MW12 MW17 MW19 MW21 MW22 and MW25 were analysed for particle size distribution (PSD) moisture content including degree of saturation bulk density dry density and specific gravity void ratio and porosity
80607-1 REV1 30102017 PAGE 13
EPA REF 0524111 FINAL REPORT STAGE 1 ENVIRONMENTAL ASSESSMENT THEBARTON ASSESSMENT AREA
Scope Item Description of works
Groundwater testing Groundwater samples from all 26 wells were analysed for the COPC detailed in Section 14 As requested by the EPA groundwater samples from selected wells (MW02 MW5 MW8 MW9 MW12 MW17 MW21 MW22 MW23 and MW26) were also analysed for the following major cations and anions (calcium magnesium sodium potassium chloride and alkalinity)
and natural attenuation parameters (carbon dioxide (CO2) sulfate iron manganese nitrate) Additional components reported by the analytical laboratory included nitrite and nitrate + nitrite
Soil vapour testing The WMStrade units deployed during each of Rounds 1 and 2 were analysed for the COPC detailed in Section 14 The soil vapour (summa canister) samples were analysed for the COPC detailed in Section 14 as well as 2-propanol and general gases (helium hydrogen oxygen nitrogen methane carbon dioxide ethane propane butane iso-butane pentane iso-pentane hexane argon carbon monoxide and ethylene)
Notes Specific sample depths are detailed in the relevant laboratory reports in Appendix G also known as isopropyl alcohol isopropanol or IPA
33 Data interpretation
Following the receipt and collation of the field and laboratory data hydrogeological (fate and transport) and VIRA modelling (refer to Sections 8 and 9 respectively) were undertaken to enable an assessment of risk and to refine the CSM (Section 10)
PAGE 14 80607-1 REV1 30102017
EPA REF 0524111 FINAL REPORT STAGE 1 ENVIRONMENTAL ASSESSMENT THEBARTON ASSESSMENT AREA
4 METHODOLOGY
41 Field methodologies
Prior to the commencement of the field investigations a site specific Health and Safety Plan (HSP) including Safe Work Method Statements (SWMS) and a Job Hazard Analysis (JHA) was prepared ndash all personnel working at the site were required to read understand sign and conform to the HSP
Each proposed drilling location was cleared of underground services by a professional service location company (Pipeline Technologies) using conventional (electronic) service detection methods as well as ground penetrating radar (GPR) Where underground or overhead services were present andor deemed to be a potential safety risk during drilling activities the drill location was moved to an area considered by the Fyfe representative and service locator to be safe All changes to drilling locations were notified to EPA and recorded on a site plan for future reference
Given that works were undertaken within suburban streets Fyfe employed the services of a qualified traffic management company (Altus Traffic) during drilling activities in order to ensure safety for pedestrians and road users minimal disruption to traffic flow and the provision of a safe working environment
Field methodologies as detailed in Table 41 were undertaken in accordance with Fyfersquos standard operating procedures (SOPs) Relevant field sampling sheets are included in Appendices F (groundwater) and G (soil vapour ndash combined field sampling sheets and chain of custody (COC) documents) and borehole log reports are presented in Appendices H (groundwater) I (WMStrade) and J (soil vapour)
Table 41 Summary of field methodologies
Activity Details
Passive soil bore sampling The soil bores used to deploy the WMStrade units were hand augered by personnel from Fyfe and Aussie Probe to a depth of 1 m BGL SGS Australia (SGS) personnel suspended each WMStrade unit into its respective borehole from a string The hole was then sealed with an expandable foam plug inside a polyethylene sleeve and the string suspending the sampler was connected to a temporary plastic cap at the ground surface The Round 1 WMStrade units were deployed for periods of between six and seven days whereas the Round 2 WMStrade units were all deployed for six days Following retrieval by SGS each WMStrade unit was placed into a sealed glass vial and a labelled foil bag The WMStrade units did not require chilling during transport to the analytical laboratory Borehole log reports are included in Appendix I whereas combined field sampling sheets and COC documents are presented in Appendix G
80607-1 REV1 30102017 PAGE 15
EPA REF 0524111 FINAL REPORT STAGE 1 ENVIRONMENTAL ASSESSMENT THEBARTON ASSESSMENT AREA
Activity Details
Groundwater well Groundwater wells were drilled by WB Drilling using a combination of hand augering installation mechanical pushtube and solid auger techniques
Following the completion of drilling each borehole was fitted with 50 mm class 18 uPVC casing with a basal 6 m long section of slotted well screen A filter pack comprising clean graded sands of suitable size to provide sufficient inflow of groundwater was installed within the annular space between the borehole and the well casing and extended from the base of the screened interval to approximately 1 m above the termination of the slotted casing A 1 m long bentonite collar comprising pelleted or granulated bentonite was placed above the filter pack to prevent water seepage downward along the well casing or borehole from ground surface Each well was grouted up to surface level and fitted with a (lockable) steel gatic cover the latter flush mounted to prevent tripping andor other hazards Groundwater well log reports are included in Appendix H
Soil logging and Soil logging was undertaken in general accordance with the ASC NEPM (1999) which geotechnical sampling endorses AS1726-1993 In addition to the requirements of AS1726-1993 particular
attention was paid during logging to any lithological variations such as sandgravel lenses or secondary porosity (such as clay fracturing) which may act as potential preferential pathways for contaminant vapourgroundwater migration through the sub-surface as well as the presence of fill material andor any olfactory or visual evidence of contamination Soil descriptions have been included on the logs in Appendices H to J Cores for geotechnical analysis were collected using push tube sampling methodologies to obtain undisturbed samples Section(s) of core to be tested were retained (intact) within the pushtube liners and capped at each end for storage and transport to the analytical laboratory
Field screening of soils Field screening of individual soil layers was undertaken at the majority of the drilling locations and involved the use of a photoionisation (PID) unit fitted with an 117 eV lamp (ie as considered suitable for the detection of CHC) The PID unit was calibrated by the hire company prior to delivery and was checked on a daily basis against an isobutylene calibration gas of known concentration Field screen samples were collected with care to ensure that each sample was representative of the soil stratum from which it was collected and experienced minimal loss of volatile compounds The soil material was placed immediately into a zip lock bag and sealed ensuring the bag was half filled (ie such that the volume ratio of soil to air was equal) Soil clumps within the bag were manually broken up and the bag was left to rest for a minimum of five minutes but no longer than 20 minutes Prior to testing the bag was shaken vigorously to release any vapours within the soil To test the tip of the PID probe was inserted into the bag and the maximum volatile organic compound (VOC) reading recorded after a nominal 10 second period or when the reading had peaked Results were recorded on the appropriate bore log sheets presented in Appendices H to J
Groundwater well Following installation the wells were developed by purging a minimum of four well development volumes (ie until stable parameters were obtained andor until the well purged dry) from
the casing with a steel bailer andor twister pump to ensure hydraulic connectivity with the aquifer formation
Groundwater gauging Groundwater levels in the newly installed and existing monitoring wells located across the Thebarton EPA Assessment Area were gauged using an interface probe prior to the commencement of the groundwater sampling program All monitoring wells were gauged for SWL the potential presence of NAPL and the total well depth Groundwater field gauging results are presented in Appendix E
PAGE 16 80607-1 REV1 30102017
EPA REF 0524111 FINAL REPORT STAGE 1 ENVIRONMENTAL ASSESSMENT THEBARTON ASSESSMENT AREA
Activity Details
Groundwater sampling The majority of the wells were sampled using low flow (micropurge) techniques Where recovery was particularly low (ie MW4 MW8 MW15 MW18 MW19 and MW24) and unsuitable for low flow (micropurge) sampling the original sampling technique was abandoned and a HydraSleeveTM (no purge) methodology was used instead Groundwater samples were collected in laboratory-supplied screw top bottles containing appropriate preservative (if required) with no headspace allowed Samples were chilled during storage and transport to the analytical laboratory Disposable nitrile gloves worn by field personnel were changed prior to the collection of each sample Samples for metals (ie iron manganese) analysis were filtered in the field using 045 microm filters Groundwater field sampling sheets are presented in Appendix E
Low Flow Methodology The low flow sampling technique involved the following the pump was placed close to the bottom of the screened interval the flow rate (up to 05 Lmin) was regulated to maintain an acceptable level of
drawdown with minimal fluctuation of the dynamic water level during pumping and sampling
groundwater drawdown was monitored constantly during purging and sampling using an interface probe
water quality parameters were considered to have stabilised when the following ranges were recorded over three consecutive readings ndash electrical conductivity plusmn 5 ndash pH plusmn 01 ndash temperature plusmn 02degC ndash dissolved oxygen plusmn 10 ndash redox potential plusmn 10 mV
the stabilisation parameters were recorded on field logging sheets after every one litre of groundwater purged using a calibrated water quality meter and a flow cell suspended in a bucket with litre intervals marked and
samples were collected once three consecutive stabilisation parameters were recorded and a volume of between 28 and 6 litres was purged prior to sampling
HydraSleeveTM Methodology The HydraSleeveTM sampling technique involved attaching a stainless steel weight to the bottom and a wire tether clip to the throat of the HydraSleeveTM before lowering it into the water column to the desired depth and allowing it to fill with groundwater After a minimum period of 24 hours the HydraSleeveTM was quickly and smoothly withdrawn from the well and the contents were transferred into the sample containers Water quality parameters were measured after samples were decanted ndash either within the water remaining in the HydraSleeveTM or within a grab sample collected using a disposable bailer
Hydraulic testing Rising and falling head permeability (ldquoslugrdquo) tests were undertaken to estimate the hydraulic conductivity (K) of the aquifer within various parts of the Thebarton EPA Assessment Area The falling-head tests were initiated by quickly inserting a 1285 m long and 36 mm diameter solid PVC cylinder (slug) into the water column at each well to produce a sufficient sudden rise in the water level The subsequent ldquofallrdquo back to the static water level (recovery) was measured and recorded automatically and in real-time using a
80607-1 REV1 30102017 PAGE 17
EPA REF 0524111 FINAL REPORT STAGE 1 ENVIRONMENTAL ASSESSMENT THEBARTON ASSESSMENT AREA
Activity Details
pressure transducerdata logger programmed to record water levels at a one second interval After static water level conditions returned in the well the rising-head test was initiated by quickly removing the slug from the well to create a sudden drop in the water column height As with the falling-head test the rise of the water level back to a static condition (recovery) was automatically recorded
Soil vapour bore Soil vapour bores were drilled by Aussie Probe using a combination of hand augering and installation mechanical pushtube techniques
Within each 3 m deep soil vapour bore teflon tubing attached to a soil vapour probe was inserted to the base of the hole which had been prefilled with approximately 005 m of clean filter pack sand An additional 045 m of sand (ie approximately 05 m in total) was then added to the hole and topped by a bentonite plug seal of approximately 05 m thickness A second soil vapour probe was installed at a depth of about 1 m within a 05 m sand pack which was overlain by bentonite to a depth of about 02 to 03 m BGL The two 1 m deep soil vapour bores were installed in a similar manner with a sand pack extending from the base to about 05 to 06 m BGL overlain by a bentonite plug to 03 m BGL Each installation was completed with grout to surface and topped with a standard flush-mounted gatic cover Soil vapour bore log reports are included in Appendix J
Soil vapour sampling All soil vapour sampling works were undertaken by SGS using suitably trained and experienced personnel ndash SGS holds National Association of Testing Authorities (NATA) accreditation for all soil vapour sampling and laboratory analytical works Combined field sampling sheets and COC documents are presented in Appendix G Soil vapour samples were collected using summa canisters and analysed using the US EPA (1999) TO-15 method Sampling involved the connection of a passivated 1 L stainless steel canister to the teflon tubing extending from the soil vapour probe and the use of a soil gas sampling train to restrict flow to a maximum rate of 200 mLmin Canister vacuum pressure was monitored during sampling to enable calculation of the volume of sample drawn into the canister ndash the small amount of vacuum left in the canister at the end of the sampling procedure was measured in the laboratory to check if any leaks occurred during transit (refer to further discussion in Table 52) A shroud was set up around the sampling point and tracer chemicals were introduced at high concentrations by flooding the shroud with helium and placing a cloth soaked with IPA into the shroud Each canister was cleaned and certified by SGS prior to use (refer to Appendix G) and backshyup coconut shell carbon sorbent tube samples were also collected (but not analysed) Summa canisters did not require chilling during transport to the analytical laboratory
Waste disposal Waste water and surplus soil corescuttings were stored together within 205 litre drums in the rear car park of a commercialindustrial property at 19-21 James Congdon Drive (as organised by the EPA) prior to removaldisposal by a licensed waste removal company (Cleanaway) Analytical results pertaining to the soils were forwarded to the licensed receiving facility and all of the soil was classified as lsquoWaste Fillrsquo in accordance with the Environment Protection Regulations 2009 The waste transport certificates are included in Appendix K
PAGE 18 80607-1 REV1 30102017
EPA REF 0524111 FINAL REPORT STAGE 1 ENVIRONMENTAL ASSESSMENT THEBARTON ASSESSMENT AREA
42 Laboratory analysis
The following laboratories were used for the analysis of the environmental samples
complete soil cores for geotechnical sample analysis were forwarded to SMS Geotechnical
primary groundwater samples collected by Fyfe were analysed at the SGS laboratory whereas secondary groundwater samples were forwarded to EurofinsMGT and
soil vapour (including WMStrade) samples collected by SGS were analysed at their laboratory
80607-1 REV1 30102017 PAGE 19
EPA REF 0524111 FINAL REPORT STAGE 1 ENVIRONMENTAL ASSESSMENT THEBARTON ASSESSMENT AREA
5 QUALITY ASSURANCE AND QUALITY CONTROL
Data quality is typically discussed in terms of the DQIs presented in Table 22 ndash ie completeness comparability representativeness precision and accuracy In order to assess the quality of the data collected during the Fyfe investigation program against these DQIs specific QAQC procedures were implemented during both the field sampling and laboratory analysis programs as detailed in the following sections
51 Field QAQC
Field QA procedures undertaken during the recent investigations included the collection of the following QC samples aimed at assessing possible errors associated with cross contamination as well as inconsistencies in sampling andor laboratory analytical techniques
intra-laboratory duplicate (duplicate) samples submitted to the same (primary laboratory) to assess variation in analyte concentrations between samples collected from the same sampling point andor the repeatability (precision) of the analytical procedures
inter-laboratory duplicate (split or triplicate) samples submitted to a second laboratory to check on the analytical proficiency (accuracy) of the results produced by the primary laboratory
equipment rinsate blank samples collected during groundwater sampling only and used to assess cross-contamination that may have occurred from sampling equipment during sampling and
trip blank samples used to assess whether cross-contamination may have occurred between samples during transport
Whereas analyte concentrations within the rinsate and trip blank samples should be below the laboratory limit of reporting (LOR) the inter- and intra-laboratory duplicate sample results are assessed via the calculation of a relative percentage difference (RPD) as follows
(Concentration 1 minus Concentration 2) x 100RPD = (Concentration 1 + Concentration 2) 2
Maximum RPDs of 30 (inorganics) and 50 (organics) are generally considered acceptable with higher RPD values often recorded where concentrations of an analyte approach the laboratory LOR
All field QC sample results are included in the summary data tables in Appendix L
511 Groundwater
Table 51 presents conformance to field QAQC procedures undertaken as part of the groundwater investigations
80607-1 REV1 30102017 PAGE 21
EPA REF 0524111 FINAL REPORT STAGE 1 ENVIRONMENTAL ASSESSMENT THEBARTON ASSESSMENT AREA
Table 51 Field QAQC procedures ndash Groundwater
QAQC Item Detail
Field procedures Field procedures were undertaken in accordance with the ASC NEPM (1999) AustralianNew Zealand standards ASNZS 566711998 and ASNZS 5667111998 SA EPA (2007) and Fyfe SOPs Details are provided in Table 41
Calibration of field equipment
Documentation regarding the calibration of field equipment is included in Appendix M
Decontamination of All disposable equipment (tubing pump bladders plastic bailers bailer cord and equipment HydraSleeveTM units) were replaced between wells Re-usable equipment (micropurge pump
interface probe and HydraSleeveTM weights) was decontaminated between sampling locations using potable water and Decon 90trade phosphate free detergent
Sample preservation and storage
Samples were kept in laboratory supplied containers in a portable chilled insulated box (esky) prior to and during transport to the laboratory
Sample tracking COC documentation was used for the transport of all samples to the laboratory and is included in Appendix G
Duplicate samples Two intra-laboratory and two inter-laboratory duplicate samples were analysed for CHC with respect to 26 primary groundwater samples ndash thereby constituting an overall ratio of approximately one duplicate per 65 primary samples (or 15) compared to a generally acceptable ratio of 110 samples (or 10) One intra-laboratory and one inter-laboratory duplicate sample were analysed for the remaining parameters with respect to 10 primary groundwater samples ndash thereby constituting an overall ratio of one duplicate per five primary samples (or 20) compared to a generally acceptable ratio of 110 samples (or 10) Intra- and inter-laboratory duplicate sample RPDs were calculated where both data sets had a reported concentration above the specific analyte laboratory LOR All calculated RPDs for CHC were within the acceptable range with the exception of the following intra-laboratory duplicate sample pair MW9QW1 TCE (67) nitrate (147) and inter-laboratory duplicate sample pair MW9QW2 total CO2 (59) iron (190)
manganese (183) potassium (64) nitrate (194) The elevated RPD for TCE in the intra-laboratory duplicate sample pair is considered to be related to the low concentration detected and does not alter the interpretation of the data The other RPD exceedances are not considered significant (ie in terms of overall data interpretation) as they were not obtained for identified COPC (as defined in Section 14)
Rinsate blank samples Six equipment rinsate blank samples (one for each day of sampling) were collected from either the pump housing or a new HydraSleevetrade (final day of sampling only) and analysed for CHC to confirm the effectiveness of the decontamination procedures and the cleanliness of disposable equipment The analytical results obtained for the rinsate blank samples were all below the laboratory LOR thereby indicating that decontamination practices during the groundwater sampling program were acceptable and that no contamination was introduced by the use of the HydraSleevestrade
Trip blank samples Six trip blank samples were included within containers (eskies) of sample bottles provided by the analytical laboratory and returned to the analytical laboratory All of the trip blank samples were analysed for CHC With the exception of TB187 which contained 1 microgL TCE the analytical results obtained for the trip blank samples were all below the laboratory LOR thereby indicating that there was limited impact on sample quality during storage or transport of the samples to the analytical laboratory
PAGE 22 80607-1 REV1 30102017
EPA REF 0524111 FINAL REPORT STAGE 1 ENVIRONMENTAL ASSESSMENT THEBARTON ASSESSMENT AREA
Notes No duplicate QC samples were collected during the use of the HydraSleeveTM sampling technique as detailed in ANZECCARMCANZ (2000a) at least 5 (ie 120) duplicate samples should be analysed ndash the generally accepted industry standard however is 10 (110) including 5 intra-laboratory and 5 inter-laboratory duplicates
512 Soil vapour
Tables 52 presents conformance to field QAQC procedures undertaken as part of the soil vapour (passive and active) investigations
Table 52 Field QAQC procedures ndash Soil vapour
QAQC Item Detail
Field procedures Field procedures were undertaken in accordance with the ASC NEPM (1999) as well as ASTM (2001 2006) ITRC (2007) CRC CARE (2013) guidance and Fyfe SOPs Details are included in Table 41 and Appendix G (ie SGS sampling methodology sheet) During the use of summa canisters to sample the soil vapour bores leak testing was undertaken (as described in Table 41) Although small leaks or ambient drawdown appear to have occurred with respect to samples SV11_10m (003 helium) SV13_10m (003 helium) and SV1_10m (360 microgm3 IPA) ITRC (2007) and NJDEP (2013) state that ge 5 helium andor gt10 mgm3 IPA are required to be indicative of a significant leak or substantial ambient drawdown Given that the leaks were relatively small (ie 06 (helium) and 36 (IPA) of the levels considered indicative of a significant leak) the data from these bores were still considered to be valid ndash refer to SGS correspondence in Appendix G As detailed in Table 41 a small amount of vacuum was generally left in each summa canister at the end of the sampling procedure and was measured in the laboratory to check if any leaks had occurred during transit However samples SV11_10m SV12_30m as well as the helium blank were recorded as having zero vacuum upon receipt at the analytical laboratory A query lodged with SGS regarding this issue indicated that whereas the helium blank comprised a grab sample collected into a Tedlar bag directly from the helium cylinder (ie without the use of a gauge) the canisters used for samples SV11_10m and SV12_30 were filled during sampling so that there was no remaining vacuum ndash refer to field sampling documentation in Appendix G SGS stated that although it is good practice to have a small amount of vacuum remaining in a canister at the completion of sampling appropriate additional QC measures were employed and the absence of other common background VOCs (eg petroleum hydrocarbons) upon sample testing indicated that leakage had not occurred during transit In addition all canisters are fitted with quick connect one-way valves that are closed upon removal from the sampling train and canistersfittings are leak checked prior to leaving the laboratory and again in the field to ensure that they are leak free Refer to SGS correspondence in Appendix G The presence of detectable IPA (120 microgm3) and TCE (48 microgm3) in the helium blank was also queried with SGS who stated that this (ie variability in the quality of the high purity helium gas used) is not an uncommon occurrence The reason for collecting a helium blank sample is to identify any impurities present in the helium gas so that if a leak does occur during sampling it is possible to determine whether any target compounds could be introduced into the sample train Although a target compound (ie TCE) was detected in the blank the concentration is minor and even if a leak had occurred during sampling (of which there was no evidence) it would not have affected the overall results and data interpretation The presence of IPA in the helium blank is
80607-1 REV1 30102017 PAGE 23
EPA REF 0524111 FINAL REPORT STAGE 1 ENVIRONMENTAL ASSESSMENT THEBARTON ASSESSMENT AREA
QAQC Item Detail
suspected by SGS of having resulted from a handling issue in the field ndash ie sub-sampling from the helium cylinder (ie into a summa canister via a flex foil bag) in the vicinity of the high concentrations of IPA being used for leak detection Refer to SGS correspondence in Appendix G
Sample preservation and storage
Following collection the WMStrade units were placed into individual glass vials which were sealed and placed into foil bags for transport to the analytical laboratory at ambient temperature Summa canisters were stored in specially constructed cases during transport to the analytical laboratory at ambient temperature
Sample tracking COC documentation was used for the transport of all samples to the laboratory and is included in Appendix G
QC samples ndash WMStrade sampling
During the first round of passive soil vapour sampling three additional WMStrade units were deployed in soil bores drilled adjacent to WMS 22 WMS 25 and WMS 28 to act as duplicate QC samples ndash thereby constituting a ratio of approximately one duplicate per 12 primary samples (or 8) Two trip blank samples were also included with samples transported from and to the analytical laboratory All of the QC samples were analysed by the primary laboratory Intra-duplicate sample RPDs were calculated where both data sets had a reported concentration above the specific analyte laboratory LOR All calculated RPDs for CHC were within an acceptable range (ie lt30) The analytical results obtained for the trip blank samples were all below the laboratory LOR thereby indicating that there was negligible impact on sample quality during storage or transport of the samples to the analytical laboratory
QC samples ndash soil vapour bore sampling
Two intra-laboratory duplicate QC samples were analysed for CHC and general gases with respect to 24 primary soil vapour samples ndash thereby constituting a ratio of approximately one duplicate per 12 primary samples (or 83) compared to an acceptable ratio of 110 samples (or 10) Intra-laboratory duplicate RPDs were calculated where both samples had a reported concentration above the laboratory LOR All calculated RPDs for CHC and general gases were within an acceptable range (ie lt30) The analytical results obtained for the helium shroud (Tedlar bags) helium blank and IPA shroud (carbon tube) samples were all considered to be satisfactory
Notes The American Society for Testing and Materials (ASTM) is an internationally recognised source of testing methods Although Appendix J of CRC CARE (2013) stipulates a 110 duplicate sampling ratio for active vapour sampling a specific ratio is not stipulated for passive vapour sampling
52 Laboratory QAQC
Laboratory QA procedures generally include the performance of a number of internal checks of data precision and accuracy that are aimed at assessing possible errors associated with sample preparation and analytical techniques Specific types of QC samples analysed by laboratories and the relevant acceptance criteria are as follows
PAGE 24 80607-1 REV1 30102017
EPA REF 0524111 FINAL REPORT STAGE 1 ENVIRONMENTAL ASSESSMENT THEBARTON ASSESSMENT AREA
internal laboratory replicate samples maximum RPD values of 20 to 50 although this varies depending on laboratory LOR
spike recoveries results between 70 and 130 and
laboratory controlmethod blanks results below the laboratory LOR
Table 53 presents conformance to laboratory QAQC procedures undertaken as part of the overall investigation program
Table 53 Laboratory QAQC procedures
QAQC Item Detail
Samples analysed and Samples were generally analysed within specified holding times ndash with the exception extracted within relevant of the following groundwater samples holding times SGS report no ME303457 nitrate was analysed two days late in some samples
(MW5 MW17 MW26) SGS report no ME303475 nitrate was analysed one day late in all samples and EurofinsMGT report no 555810-W total CO2 was analysed five days late None of these holding time exceedances are considered to be significant with respect to the interpretation of the CHC data the determination of potential human healthenvironmental risks andor the determination of natural attenuation
Laboratories used and The laboratories used (SGS Eurofins MGT and SMS Geotechnical) were NATA NATA accreditation accredited for the majority of the analyses undertaken
The exception was SMS Geotechnical which was not NATA accredited for the calculations undertaken to derive some of the data ndash this is the case however for all geotechnical laboratories
Appropriate analytical methodologies used
Refer to the laboratory reports in Appendix G
Laboratory limit of The laboratory LOR is the minimum concentration of an analyte (substance) that can reporting (LOR) be measured with a high degree of confidence that the analyte is present at or above
that concentration The LOR are presented in the laboratory certificates of analysis (Appendix G) and are considered to be generally appropriate (ie below the adopted assessment criteria ndash refer to Section 62) ndash the following exceptions in soil vapour (ie considered to be due to interference associated with elevated concentrations of other compounds ndash refer to SGS correspondence in Appendix G) are discussed further in Table 101 VC in all of the WMStrade samples relative to the ASC NEPM (1999) interim soil
vapour health investigation level (HIL) for residential land use cis-12-DCE and VC in two soil vapour bore samples (SV2_30m and SV3_30m)
relative to the ASC NEPM (1999) interim soil vapour HILs for residential and commercialindustrial land use and
VC in two soil vapour bore samples (SV3_10m and SV7_30m) relative to the ASC NEPM (1999) interim soil vapour HIL for residential land use
In addition to the above although ultra-trace analysis was requested the laboratory LOR for VC in groundwater (ie 1 microgL) is above the adopted NHMRCMRMMC (2011) potable guideline (ie 03 microgL) ndash refer to Section 612
80607-1 REV1 30102017 PAGE 25
EPA REF 0524111 FINAL REPORT STAGE 1 ENVIRONMENTAL ASSESSMENT THEBARTON ASSESSMENT AREA
QAQC Item Detail
Laboratory internal QC analyses
Results obtained for the laboratory internal QC samples were generally within the acceptable limits of repeatability chemical extraction and detection with the exception of the following SGS report ME303457 matrix spike results for iron were outside normal tolerances
due to the high concentrations of iron in the spiked sample ndash matrix spike results for iron could therefore not be calculated This is not considered to be a significant issue
Full details regarding laboratory QAQC procedures and results are presented in the certified laboratory certificates contained in Appendix G
Notes Since holding times were not specified in the SGS groundwater reports Fyfersquos assessment of holding times has been based on those adopted by EurofinsMGT (ie the secondary laboratory used for groundwater analysis) ie in accordance with Schedule B3 of the ASC NEPM (1999) also referred to as practical quantification limits (PQL)
53 QAQC summary
In summary it is considered that
the field QAQC programs were generally undertaken with regard to relevant legislation standards andor guidelines and were sufficient for obtaining samples that are representative of site conditions and
the overall laboratory QAQC procedures and results were adequate such that the laboratory analytical results obtained are of acceptable quality for addressing the key objectives outlined in Section 15
PAGE 26 80607-1 REV1 30102017
EPA REF 0524111 FINAL REPORT STAGE 1 ENVIRONMENTAL ASSESSMENT THEBARTON ASSESSMENT AREA
6 ASSESSMENT CRITERIA
61 Groundwater
611 Beneficial Use Assessment
In accordance with Schedule B6 of the ASC NEPM (1999) and SA EPA (2009) a Beneficial Use Assessment (BUA) was undertaken to assess both the current and realistic future uses of groundwater within the Q1 aquifer beneath the Thebarton EPA Assessment Area
This was aimed at determining what groundwater uses need to be protected and assessing the risk(s) that groundwater may pose to human health and the environment (refer also to the VIRA in Section 9)
As summarised in Table 61 the potential beneficial uses for groundwater within the Q1 aquifer that have been considered are as follows ndash taking into account the salinity of the groundwater the Environment Protection (Water Quality) Policy 2015 (Water Quality EPP 2015) the DEWNR (2017) WaterConnect database information presented in Section 222 and possible sensitive receptors located within andor within the vicinity of the Thebarton EPA Assessment Area
The salinity of groundwater has been calculated to approximate 1230 to 3620 mgL TDS (refer to Section 7312) According to the Water Quality EPP 2015 the applicable environmental values for groundwater with salinity above 1200 mgL TDS but less than 3000 mgL TDS are irrigation livestock and aquaculture whereas the salinity is considered to be too high for potable use ndash although domestic irrigation is considered to be a potentially realistic use for this area (see below) livestock watering is considered unlikely to be undertaken in such an urban setting and no local water bodies (ie surface or groundwater) have been identified as being used for commercial aquaculture purposes
The DEWNR (2017) WaterConnect database indicates that groundwater within the Q1 aquifer in the Thebarton area is accessed for drainage domestic and industrial purposes ndash domestic groundwater use could include garden irrigation plumbing water andor the filling of swimming pools (ie primary contact recreation) Although domestic groundwater extraction is considered unlikely to include potable use (ie due to its salinity and the availability of a reticulated mains water supply) potential mixing with rain watermains water could render it suitable (ie from a salinity perspective) for drinking
As the closest freshwater surface water body the River Torrens is located approximately 03 km to the east and 07 km to the north and north-west of the northern portion of this area groundwater discharge from the Thebarton EPA Assessment Area into a freshwater aquatic ecosystem is considered possible However as the River Torrens is considered to be either a recharge boundary (ie discharging to local groundwater) or not actually hydraulically connected to the Q1 aquifer in this area the potential for impact on a freshwater aquatic environment has not been confirmed
80607-1 REV1 30102017 PAGE 27
EPA REF 0524111 FINAL REPORT STAGE 1 ENVIRONMENTAL ASSESSMENT THEBARTON ASSESSMENT AREA
Since the closest marine surface water body Gulf St Vincent is located approximately 8 km to the west groundwater discharge from the Thebarton EPA Assessment Area into a marine aquatic ecosystem is not considered to be realistic
Since volatile contaminants have been detected within the Q1 aquifer (refer to Section 7331) a potential vapour flux risk to future site users must be considered
Given the measured depth of the Q1 aquifer beneath the site (ie approximately 1232 to 1585 m BGL ndash refer to Section 7311) it is considered unlikely that direct contact could occur between groundwater and building footingsunderground services
Table 61 Assessment of groundwater beneficial uses for Thebarton EPA Assessment Area
Environmental Values Beneficial Uses
Water Quality EPP 2015
environmental value
SA EPA (2009) Potential
Beneficial Uses
Beneficial Use Assessment
Considered Applicable
Aquatic Ecosystem
Marine Yes No
Fresh Yes Possibly
Potable - Yes Possibly
Agriculture Irrigation - Yes Yes
Livestock - Yes No
Aquaculture - Yes No
Recreation amp Aesthetics
Primary contact Yes Possibly
Aesthetics Yes Possibly
Industrial - Yes Yes
Human health in non-use scenarios
Vapour flux -
Yes Yes
Buildings and structures
Contact - Yes No
Notes ie for underground waters with a background TDS level of between 1200 and 3000 mgL ndash note that although they are not listed as environmental values of groundwater in Schedule 1(3) of the Water Quality EPP 2015 aquatic ecosystems as well as recreation amp aesthetics are included as environmental values for waters in general in Part 1(6) of the document ie domestic irrigation only
612 Groundwater beneficial use criteria
The health and ecological criteria used for the assessment of the COPC (refer to Section 14) in groundwater have been based on the results of the BUA (Section 611) A summary of the references used to source the groundwater assessment criteria is provided in Table 62
PAGE 28 80607-1 REV1 30102017
EPA REF 0524111 FINAL REPORT STAGE 1 ENVIRONMENTAL ASSESSMENT THEBARTON ASSESSMENT AREA
Table 62 Sources of adopted groundwater assessment criteria
Beneficial Use Reference
Freshwater Ecosystems No criteria available for COPC
Potable NHMRCNRMMC (2011) Australian Drinking Water Guidelines
WHO (2017) Guidelines for Drinking-water Quality ndash TCE only
Irrigation No criteria available for COPC
Primary contact recreation (including aesthetics)
NHMRC (2008) Guidelines for Managing Risks in Recreational Water ndash based on NHMRCNRMMC (2011) Australian Drinking Water Guidelines but (with the exception of aesthetic guidelines) multiplied by a factor of 10 to take account of accidental ingestion rates as opposed to deliberate ingestion
ANZECCARMCANZ (2000b) Australian and New Zealand Guidelines for Fresh and Marine Water Quality ndash recreational values (TCE only)
Human health in non-use scenarios ndash vapour flux Refer to the VIRA in Section 9
Notes As there are no specific guidelines for industrial water these values are considered likely to be protective of this additional beneficial use The NHMRC (2008) guidelines are based on drinking water levels and assume a consumption factor of 2 L per day Therefore as recommended in the NHMRC (2008) document potable criteria (ie with the exception of aesthetic criteria) need to be adjusted by a factor of 10 to account for an accidental consumption rate of 100 to 200 ml per day As noted in ANZECCARMCANZ (2000b) although recreational guidelines are protective of ingestion recreational waters should also not contain any chemicals that can cause skin irritation likewise although not specifically addressed by recreational water criteria inhalation may also represent a source of exposure with respect to some (ie volatile) contaminants In the absence of a NHMRCNRMMC (2011) drinking water guideline for TCE the ANZECCARMCANZ (2000b) recreational criterion (30 microgL) has been adopted However if the NHMRC (2008) rule of multiplying potable (healthshybased) guidelines by 10 is applied to the WHO (2017) drinking water guideline of 20 microgL a recreational guideline of 200 microgL would be more applicable
62 Soil vapour
The ASC NEPM (1999) interim soil vapour health investigation levels (HILs) for volatile organic chlorinated compounds (VOCCs) have been adopted (ie in the first instance ndash refer to Section 7331) as Tier 1 soil vapour assessment criteria ndash relevant land use scenarios within the Thebarton EPA Assessment Area include residential (HIL AB) and commercialindustrial (HIL D)
These criteria have been further adjustedappended for the purposes of the VIRA Tier 1 assessment ndash refer to Section 94
80607-1 REV1 30102017 PAGE 29
EPA REF 0524111 FINAL REPORT STAGE 1 ENVIRONMENTAL ASSESSMENT THEBARTON ASSESSMENT AREA
7 RESULTS
71 Surface and sub surface soil conditions
711 Field observations
Groundwater well and soil vapour borehole log reports are included in Appendices H to J and provide details of the soil profile encountered at each sampling location
Where encountered fill materials extended to depths of between 01 and 09 m BGL and included a range of different soil types (sand gravelcrushed rock silt) with only minimal waste inclusions (ie asphalt glass andor metal fragments) identified at some locations
The underlying natural soil profile (encountered to the maximum drill depth of 19 m BGL) was dominated by low to medium plasticity brown to red-brown silty clays and sand claysclayey sands some of which contained sub-angular to rounded gravels that included river pebbles andor comprised fine distinct lenses in places Groundwater well MW17 also included a 15 m thick layer of gravel at depth (ie 12 to 135 m BGL) ndash ie consistent with the depth of groundwater within the Q1 aquifer
During the course of the drilling works no odours or visual indicators of contamination were detected and measured PID readings ranged up to 6 ppm but were generally lt3 ppm
712 Soil geotechnical testing
A table of geotechnical testing results is presented in Appendix L (Table 1) and a copy of the certified laboratory report is included in Appendix G Photographs of soil cores are included in Appendix N
The results were interpreted to indicate the following
The soil core samples submitted for PSD analysis were dominated by clay with lesser amounts of fine to medium gravel andor fine to coarse-grained sand ndash all samples analysed were classified as either CLAY or Sandy CLAY with one sample classified as Clayey SAND The classifications obtained from the laboratory were deemed to be generally consistent with the descriptions on the groundwater well log reports (Appendix H) although the PSD results did not specify silt as a significant secondary component
The moisture content of the analysed soil core samples ranged from 65 to 231 Moisture content with respect to soil type depth and location has been considered in more detail for the purposes of the VIRA (Section 9) The degree of saturation for the analysed soil cores samples ranged from 218 to 964
Measured bulk density ranged from 160 to 212 tm3 specimen dry density from 141 to 184 tm3 and specific gravity from 255 to 281 tm3
The measured void ratio ranged from 043 to 088 whereas porosity ranged from 032 to 047
80607-1 REV1 30102017 PAGE 31
EPA REF 0524111 FINAL REPORT STAGE 1 ENVIRONMENTAL ASSESSMENT THEBARTON ASSESSMENT AREA
72 Waterloo Membrane Samplerstrade A table of WMStrade analytical results (ie from both rounds of sampling) is presented in Appendix L (Table 2) and copies of certified laboratory reports are included in Appendix G8
Of the 41 WMStrade units deployed across the Thebarton EPA Assessment Area during the two sampling rounds 20 returned measurable concentrations of CHC including TCE PCE cis-12-DCE trans-12-DCE andor 11-DCE Although no VC was detected the laboratory LOR in all samples (ie 35 to 50 microgm3) was above the ASC NEPM (1999) soil vapour interim HIL for residential land use (30 microgm3) ndash refer also to Table 53
Detectable COPC concentrations are summarised in Table 71 relative to the ASC NEPM (1999) soil vapour interim HILs along with the closest soil vapour bore andor groundwater monitoring well locations Measured TCE concentrations are detailed on Figure 3
A comparison of the Round 1 and 2 WMStrade results (ie for closely located units9) is presented in Table 72 ndash the results indicate a general order of magnitude correlation of the results for most COPC with the exception of PCE for which lower concentrations were obtained during Round 2 As the Round 1 and 2 WMStrade units were located within different soil bores and deployed at different times some variability in the results is to be expected In addition and as discussed in Section 74 the WMStrade units have been used during this assessment as a (semi-quantitative) screening tool (ie to assist with the siting of the permanent soil vapour bores) with the results obtained from the soil vapour bores considered more representative of actual subsurface conditions
Table 71 Detectable Waterloo Membrane Samplertrade CHC results
Sample ID
Location Closest land uses
CHC concentration (microgm3) Closest soil vapour bore
andor groundwater
well
TCE PCE cis-12shyDCE
trans-12shyDCE
11shyDCE
VC
WMS 1 Goodenough Street CI 35 -
WMS 6 Maria Street CI 32 -
WMS 7 Maria Street CI and R 1900 45 SV2 MW5
WMS 8 Maria Street CI and R 12000 37 SV4
WMS 11 Admella Street CI 71000 260 19 20 36 SV5 MW02
WMS 14 George Street CI 46000 45 SV6 MW11
WMS 18 Admella Street CI 4200 34 MW14
WMS 19 Albert Street CI 11000 42 SV10MW15
WMS 21 Chapel Street CI 10 -
WMS 22 Admella Street CI 38 SV9
WMS 24 Chapel Street CI 230 62 10 11 48 MW17
8 Note that the original laboratory report for the Round 1 WMStrade samples was found to be incorrect (ie following receipt of the soil vapour bore and Round 2 WMStrade sample results) and was subsequently re-issued by SGS
9 only two of which were sufficiently co-located for comparative purposes ndash Round 2 locations WMS 39 and WMS 41 were not within the immediate vicinity of Round 1 WMStrade bores (ie the closest Round 1 bores were approximately 30 m away)
PAGE 32 80607-1 REV1 30102017
EPA REF 0524111 FINAL REPORT STAGE 1 ENVIRONMENTAL ASSESSMENT THEBARTON ASSESSMENT AREA
Sample ID
Location Closest land uses
CHC concentration (microgm3) Closest soil vapour bore
andor groundwater
well
TCE PCE cis-12shyDCE
trans-12shyDCE
11shyDCE
VC
WMS 25 Albert Street CI and R 1400 20 MW17
WMS 27 Light Terrace CI 64 62 SV11 MW19
WMS 32 Holland Street R 16 -
WMS 34 James Street R 11 -
WMS 37 Dew Street R 44 -
WMS 38 Maria Street CI and R 13000 56 SV2 MW5
WMS 39 Maria Street CI and R 1300 SV4
WMS 40 Admella Street CI 110000 97 SV5 MW02
WMS 41 George Street CI 18000 10 SV7 ASC NEPM (1999) HIL - Residential 20 2000 80 - - 30 ASC NEPM (1999) HIL ndash Commercialindustrial 80 8000 300 - - 100
Notes Shaded cells indicate concentrations were below the laboratory LOR Where (field) duplicate QC samples were analysed the maximum concentrations have been adopted for data interpretation purposes Concentrations in italics exceed adopted assessment criteria Closest land uses CI = commercialindustrial R = residential Chloroform (up to 530 microgm3) was also detected in WMS 8 WMS 11 WMS 14 WMS 16 WMS 18 WMS 19 WM 25 WMS 33 WMS 40 and WMS 41 interim soil vapour health investigation level (HIL)
Table 72 Comparison of CHC data for Round 1 and 2 WMStrade units
Bore ID
Depth (m)
Location CHC concentration (microgm3)
TCE PCE cis-12-DCE trans-12-DCE 11-DCE VC
WMS 8 10 Maria Street 12000 37 lt95 lt99 lt22 lt36
WMS 38 13000 56 lt11 lt11 lt25 lt41
Relative percentage difference 8 147 - - - -
WMS 11 10 Admella Street 71000 260 19 20 36 lt37
WMS 40 110000 97 lt11 lt11 lt25 lt41
Relative percentage difference 43 91 - - - -Notes Shaded cells indicate concentrations were below the laboratory LOR
80607-1 REV1 30102017 PAGE 33
EPA REF 0524111 FINAL REPORT STAGE 1 ENVIRONMENTAL ASSESSMENT THEBARTON ASSESSMENT AREA
73 Groundwater
731 Field measurements
A table of groundwater field parameters is presented in Appendix L (Table 3) and groundwater field sampling sheets are included in Appendix E
7311 Groundwater elevation and flow direction
The depth to water within the Q1 aquifer beneath the Thebarton EPA Assessment Area on 18 July 2017 ranged from 12323 to 15854 m below top of casing (BTOC)10 and 4469 to 5070 m AHD
Groundwater elevation contours constructed from the July 2017 gauging data indicated that the overall groundwater flow direction within the Q1 aquifer was north-westerly consistent with expected regional groundwater flow The groundwater contours and inferred flow direction are shown on Figure 4
7312 Field parameters
As detailed in Table 51 field measurements were recorded during low flow purging (ie prior to micropurge sampling) of monitoring wells and immediately following the collection of HydraSleeveTM samples
The field parameter readings recorded for the monitoring wells immediately prior to (low flow micropurge) and after (HydraSleeveTM) sampling indicated the following (as summarised in Table 3 Appendix L)
groundwater pH ranged from 6 8 to 79 thereby indicating neutral conditions
electrical conductivity (EC) measurements ranged from 189 to 556 mScm and were found to be reasonably consistent across the area thereby indicating that it is underlain by moderately saline water (ie approximating 1230 to 3620 mgL TDS11)
redox concentrations ranged from -20 to 624 mV thereby indicating slightly reducing to strongly oxygenating conditions
measured dissolved oxygen (DO) concentrations ranged from 04 to 78 ppm indicating slightly to highly oxygenated water and
temperature ranged from 173 to 224oC
Observations recorded during sampling indicated that the groundwater was clear to brown and only slightly to moderately turbid at most locations ndash the higher turbidity at MW18 and MW19 (combined with poor recharge) contributed towards the decision to use a HydraSleeveTM sampling method No odours or sheen were observed in any of the wells during gauging or sampling
10 ie approximating m BGL 11 ie calculated by multiplying the field EC data by 065
PAGE 34 80607-1 REV1 30102017
EPA REF 0524111 FINAL REPORT STAGE 1 ENVIRONMENTAL ASSESSMENT THEBARTON ASSESSMENT AREA
732 Hydraulic conductivity
Rising and falling head aquifer permeability (ldquoslugrdquo) tests were conducted on 10 groundwater wells (refer to Table 31 and Figure 2) to assess the hydraulic conductivity (K) of the Q1 aquifer
To obtain estimates of near-well horizontal hydraulic conductivity for each well tested the slug test data were analysed by Arcadis using AQTESOLV for Windowstrade (Duffield 2007) following the guidelines presented in Butler (1998) ndash normalised displacement data collected from each test are plotted against time in Appendix A of the Arcadis report (refer to Appendix O) Since only one set of tests were performed at each well the reproducibility of the results as well as the dependence of the results on the initial displacement could not be verified or demonstrated As such multiple relevant and applicable solutions were applied to each test to account for that uncertainty (ie to ensure consistency of normalised response at each well regardless of initial displacement)
Table 73 presents a summary of the range and average estimated hydraulic conductivity values (and corresponding analytical solutions used) for each well tested The results indicate that hydraulic conductivities ranged from approximately 0073 to 37 mday with an overall average of approximately 1 mday
Table 73 Hydraulic conductivities (rising and falling head tests)
Groundwater Test Type Range of Estimated Applied Analytical Average Well Hydraulic Conductivity Solution Estimated
(mday) Hydraulic Conductivity
(mday)
MW02 Falling head 011 to 014 DA CBP HV
012 Rising head 0073 to 015 BR DA
MW3 Falling head 034 to 062 BR DA
047 Rising head 030 to 062 BR DA
MW7 Falling head 075 to 25 BR DA
139 Rising head 055 to 175 BR DA
MW14 Falling head 011 to 021 BR DA
014 Rising head 009 to 015 BR DA
MW17 Falling head 21 to 22 DA KGS
220 Rising head 225 to 244 DA KGS
MW20 Falling head 22 to 37 BR DA HV
256 Rising head 06 to 32 BR DA
MW21 Falling head 073 to 123 BR DA
084 Rising head 054 to 084 BR DA
MW23 Falling head 088 to 162 BR DA
101 Rising head 031 to 122 BR DA
80607-1 REV1 30102017 PAGE 35
EPA REF 0524111 FINAL REPORT STAGE 1 ENVIRONMENTAL ASSESSMENT THEBARTON ASSESSMENT AREA
Groundwater Test Type Range of Estimated Applied Analytical Average Well Hydraulic Conductivity Solution Estimated
(mday) Hydraulic Conductivity
(mday)
MW25 Falling head 10 to 18 BR DA CBP HV
132 Rising head 049 to 17 BR DA
MW26 Falling head 019 to 036 BR DA
023 Rising head 010 to 029 BR DA
Overall average K (mday) 1028 Notes References BR = Bouwer and Rice (1976) CBP = Cooper et al (1967) DA = Dagan (1978) HV = Hvorslev (1951) KGS = Hyder et al (1994)
The monitoring wells that exhibited lower permeabilities (ie MW02 MW3 MW14 and MW26) were noted to be generally located in the up-gradient (south-eastern) portion of the Thebarton EPA Assessment Area whereas monitoring wells showing relatively higher permeabilities (ie MW7 MW17 MW20 MW21 MW23 and MW25) are generally located in the down-gradient (north-western) portion These results were considered by Arcadis to suggest a possible hydrogeologic transition from the south-east to the north-west AQTESOLV solution plots for each analysis are provided as Appendix A of the Arcadis report (Appendix O)
As slug test results can be influenced by a number of factors which are difficult to avoid when performing and analysing slug test results hydraulic conductivity estimates derived from slug tests should be considered to be the lower bound of the hydraulic conductivity of the formation in the vicinity of the well (Butler 1998) However Arcadis also noted that the results obtained for the Thebarton EPA Assessment Area were similar to those reported for other areas of Adelaide with average values of 1 and 27 mday (refer to Appendix O)
The slug test results were used by Arcadis in their groundwater fate and transport model (refer to Section 8)
733 Analytical results
Tables of groundwater analytical results are presented in Appendix L (Tables 4 and 5) and copies of certified laboratory reports are included in Appendix G
7331 Chlorinated hydrocarbon compounds
A table of CHC results is included in Appendix L (Table 4) and a plan showing their distribution in groundwater beneath the Thebarton EPA Assessment Area is included as Figure 5 Detectable CHC concentrations are summarised in Table 74 relative to the adopted potable and primary contact recreation criteria ndash the closest soil vapour bore locations are also detailed
PAGE 36 80607-1 REV1 30102017
EPA REF 0524111 FINAL REPORT STAGE 1 ENVIRONMENTAL ASSESSMENT THEBARTON ASSESSMENT AREA
Table 74 Detectable groundwater CHC results
Sample ID
Location CHC concentration (microgL) Closest soil vapour bore
TCE PCE cis-12shyDCE
trans-12-DCE
11-DCE VC Carbon tetrachloride
MW02 Admella Street 20000 38 7 15 SV5
MW3 Admella Street 69 SV1
MW5 Maria Street 29000 3 21 2 6 SV2 SV3
MW6 Maria Street 29 SV4
MW9 Albert Street 2 -
MW11 George Street 4900 3 4 1 7 SV6 SV7
MW12 George Street 700 SV8
MW14 Admella Street 1000 4 2 SV9
MW15 Albert Street 180 SV10
MW17 Chapel Street 24 -
MW18 Dew Street 5 -
MW20 Light Terrace 70 SV12
MW21 Light Terrace 23 SV13
MW23 Dew Street 21 -
MW25 Smith Street 2 5 -
MW26 Kintore Street 2 -
Potable 20 50 60 30 03 3
Primary contact recreation
30 500 600 300 30 30
Notes Shaded cells indicate concentrations were below the laboratory LOR Where (field) duplicate QC samples were analysed the maximum concentrations have been adopted for data interpretation purposes Concentrations in italics exceed adopted assessment criteria Chloroform was also detected in a number of wells (MW02 MW3 MW5 MW8 MW11 MW12 and MW19 to MW25) ndash refer to Table 4 in Appendix L Although no VC was detected the laboratory LOR (1 microgL) exceeded the adopted potable criterion NHMRCNRMMC (2011) Australian Drinking Water Guidelines TCE criterion from WHO (2017) Guidelines for Drinking-water Quality NHMRC (2008) Guidelines for Managing Risks in Recreational Water ndash based on NHMRCNRMMC (2011) Australian Drinking Water Guidelines TCE criterion from ANZECCARMCANZ (2000b) Australian and New Zealand Guidelines for Fresh and Marine Water Quality
The results indicate that the highest TCE concentrations (20000 to 29000 microgL) were measured in wells MW02 and MW5 located in the immediate vicinity of the former Austral property and that the TCE plume extends in a general north-westerly direction (ie consistent with the inferred groundwater flow direction
80607-1 REV1 30102017 PAGE 37
EPA REF 0524111 FINAL REPORT STAGE 1 ENVIRONMENTAL ASSESSMENT THEBARTON ASSESSMENT AREA
within the Q1 aquifer) Although lesser concentrations of PCE 12-DCE (cis- andor trans) andor 11-DCE were present in some wells no VC was detected and the main COPC was identified as TCE
A number of wells within the Thebarton EPA Assessment Area contained TCE concentrations that exceeded the adopted potable andor primary contact recreation criteria Although the extent of the TCE plume was not delineated to the north-west (but was delineated in all other directions) with detectable TCE concentrations (ie up to 21 microgL) identified beneath both Smith Street and Dew Street these concentrations were below the adopted primary contact recreation criterion (but not necessarily the adopted potable value ndash ie MW23)
The background well (MW4) located across James Congdon Drive (to the east of the southern portion of the Thebarton EPA Assessment Area) did not contain any measurable CHC concentrations
7332 Other measured groundwater parameters
Major cations and anions
The laboratory results obtained for the remaining groundwater analytes are summarised in Appendix L (Table 5)
The groundwater ionic data obtained from selected wells across the Thebarton EPA Assessment Area are graphically represented on a Piper diagram in Figure 71 The results indicate a relatively consistent groundwater composition across the area thereby indicating that the groundwater sampled from these wells is derived from a single aquifer Ionic charge balance ranged from 32 to 22 with the highest value (22) calculated for MW12 indicating that additional anions (ie not measured as part of this study) could be present
PAGE 38 80607-1 REV1 30102017
EPA REF 0524111 FINAL REPORT STAGE 1 ENVIRONMENTAL ASSESSMENT THEBARTON ASSESSMENT AREA
Figure 71 Piper diagram
Natural attenuation parameters
With respect to the measured natural attenuation parameters (ie DO nitrate iron sulfate CO2 and manganese) the following wells were selected based on their locations relative to the inferred extent of the CHC plume
MW26 located on Kintore Street to the south (and hydraulically up-gradient) of the former Austral property (ie the suspected source site)
MW02 and MW5 located within the immediate vicinity of the former Austral property and the area of maximum CHC contamination
MW9 MW12 and MW17 located on Albert Street George Street and Chapel Street respectively to the north-west (and hydraulically down-gradient) of the former Austral property
80607-1 REV1 30102017 PAGE 39
EPA REF 0524111 FINAL REPORT STAGE 1 ENVIRONMENTAL ASSESSMENT THEBARTON ASSESSMENT AREA
MW21 and MW22 located on Light Terrace and Cawthorne Street respectively to the northshywestnorth-north-west (and further hydraulically down-gradient) of the former Austral property and
MW8 and MW23 located on Smith Street and Dew Street respectively representing the furthest wells to the northnorth-west of the former Austral property
According to Wiedemeier et al (1998) the most important process in the degradation of CHC is the process of reductive dechlorination Although daughter products of TCE (ie 12-DCE) are present in groundwater (and soil vapour) at scattered locations within the Thebarton EPA Assessment Area they are not considered indicative of substantial breakdown of TCE ndash refer also to the Arcadis report in Appendix O as summarised in Section 8 In addition the analysis of the natural attenuation parameters data constituting physical and chemical indicators of biodegradation processes has not provided a definitive secondary line of evidence
74 Soil vapour bores A table of soil vapour bore analytical results is presented in Appendix L (Table 6) and a copy of the certified laboratory report is included in Appendix G
Of the soil vapour bores installed to 10 andor 30 m BGL within the Thebarton EPA Assessment Area the majority (ie with the exception of the 10 m deep bores installed as SV11 and SV13 and located on Light Terrace) returned measurable concentrations of CHC dominated by TCE and to a lesser extent (and only at some locations) PCE Detectable soil vapour CHC concentrations are summarised in Table 75 whereas CHC concentrations and inferred soil vapour TCE concentration contours are detailed on Figures 6 (1 m BGL) and 7 (3 m BGL)
The TCE results which have been used to predict indoor air concentrations as part of the VIRA (refer to Section 9) suggest the following
the highest concentration (1000000 microgL) was detected at 3 m BGL in soil vapour bore SV3 located in the vicinity of residential and commercialindustrial properties (including the former Austral property) on Maria Street
where nested wells were tested soil vapour CHC concentrations were higher at depth consistent with a groundwater source
TCE PCE and 11-DCE are all assumed to represent primary contaminants with 12-DCE representing a break-down product of TCE andor PCE
although no VC was detected the laboratory LOR in some samples (ie up to 490 microgm3 in samples with the highest measured TCE concentrations) was above the ASC NEPM (1999) interim soil vapour HIL for residential land use (30 microgm3) ndash refer to Table 53 and
although the extent of the soil vapour plume has apparently not been delineated (ie in any direction) by the existing soil vapour bores it extends in a north-westerly direction (and hydraulically down-
PAGE 40 80607-1 REV1 30102017
EPA REF 0524111 FINAL REPORT STAGE 1 ENVIRONMENTAL ASSESSMENT THEBARTON ASSESSMENT AREA
gradient) from the suspected source site (ie the former Austral property) and corresponds well with the groundwater TCE plume (refer to Figure 5)
A comparison of the results obtained for the WMStrade units (WMS 38 to WMS 41) deployed during the second round of sampling and the closest soil vapour bore data (10 m BGL) is provided in Table 76 Although the results indicate good correlation for TCE and PCE in SV5WMS 40 as well as TCE in SV7WMS 41 the remaining results were more variable ndash this supports the use of the WMStrade units as an initial (semishyquantitative) screening tool with follow-up soil vapour bore data considered to provide more quantitative results
Table 75 Detectable soil vapour bore CHC results for Thebarton EPA Assessment Area
Bore ID
Depth (m)
Location Closest land
uses
CHC concentration (microgm3)
TCE PCE cis-12shyDCE
trans-12-DCE
11-DCE VC
SV1 10 Admella Street CI and R 6300 78
30 21000 21
SV2 10 Maria Street CI and R 51000 39 21 39
30 940000
SV3 10 Maria Street CI and R 210000 6500 5900
30 1000000 15000 14000
SV4 10 Maria Street CI and R 17000 31
30 43000 90 30
SV5 10 Admella Street CI 100000 84
30 160000 310 20 33
SV6 10 George Street CI 22000 12
30 150000 56
SV7 10 George Street CI 22000 19
30 110000
SV8 10 George Street CI 2300 62
30 14000 19
SV9 10 Chapel Street CI 170
30 260
SV10 10 Albert Street CI 93
30 51
SV12 10 Light Terrace CI 16
30 55 ASC NEPM (1999) HIL - Residential 20 2000 80 - - 30 ASC NEPM (1999) HIL ndash Commercialindustrial 80 8000 300 - - 100
Notes Shaded cells indicate concentrations were below the laboratory LOR
80607-1 REV1 30102017 PAGE 41
EPA REF 0524111 FINAL REPORT STAGE 1 ENVIRONMENTAL ASSESSMENT THEBARTON ASSESSMENT AREA
Where (field andor laboratory) duplicate QC samples were analysed the maximum concentrations have been adopted for data interpretation purposes Concentrations in italics exceed adopted assessment criteria Closest land uses CI = commercialindustrial R = residential Chloroform was also detected in a number of samplesinterim soil vapour health investigation level (HIL)
Table 76 Comparison of CHC data for Round 2 WMStrade units and closest soil vapour bores
Bore ID
Depth (m)
Location CHC concentration (microgm3)
TCE PCE cis-12-DCE trans-12-DCE 11-DCE VC
SV2 10 Maria Street 51000 39 21 lt13 39 lt89
WMS 38 13000 56 lt11 lt11 lt25 lt41
Relative percentage difference 119 150 - - - -
SV4 10 Maria Street 17000 31 lt18 lt14 lt14 lt92
WMS 39 1300 lt52 lt11 lt11 lt25 lt41
Relative percentage difference 172 - - - - -
SV5 10 Admella Street 100000 84 lt44 lt33 lt33 lt22
WMS 40 110000 97 lt11 lt11 lt25 lt41
Relative percentage difference 95 14 - - - -
SV7 10 George Street 22000 19 lt37 lt27 lt27 lt18
WMS 41 18000 10 lt11 lt11 lt25 lt41
Relative percentage difference 20 62 - - - -Notes Shaded cells indicate concentrations were below the laboratory LOR
PAGE 42 80607-1 REV1 30102017
EPA REF 0524111 FINAL REPORT STAGE 1 ENVIRONMENTAL ASSESSMENT THEBARTON ASSESSMENT AREA
8 GROUNDWATER FATE AND TRANSPORT MODELLING
Arcadis were commissioned by Fyfe to undertake preliminary fate and transport modelling of the groundwater CHC impacts detected within the Thebarton EPA Assessment Area based on the recently obtained groundwater data The Arcadis report is included as Appendix O
The aim of the modelling was to provide a preliminary estimate of the future extent of CHC impacted groundwater within the Thebarton area in order that potential future groundwater restrictions could be applied by the EPA (ie via the potential future definition of a GPA) to protect human health
81 Groundwater flow modelling
The MODFLOW code a publicly-available groundwater flow simulation program developed by the United States Geological Survey (USGS) as described by McDonald and Harbaugh (1988) was used to construct a groundwater flow model It was developed for a horizontal area of approximately 25 km2 (ie to minimise possible boundary effects within the assessment area itself12) and was rotated 45deg counter-clockwise to align with the prevailing (north-westerly) groundwater flow direction The model extended approximately 23 km in a south-east to north-west direction and approximately 11 km in a south-west to north-east direction (ie perpendicular to groundwater flow) Whereas a 4 m grid spacing was used within the area of the plume and its migration pathway (ie to enhance model accuracy and precision) a broader 15 m grid was adopted outside the specific area of interest Vertically the model adopted a single 20 m thick layer as representative of the hydrostratigraphy of the Q1 aquifer sediments beneath the area but it was noted that only the bottom portion (ie few metres) of this model layer are actually saturated and therefore active in the model
An informal sensitivity analysis performed as part of the model calibration process indicated that the model was most sensitive to changes in hydraulic conductivity and recharge ndash this was not unexpected given the relatively flat hydraulic gradient and relatively narrow range of estimated values for both model parameters (ie based on reasonably low uncertainty) The final calibrated value for aquifer recharge adopted in the model was 295 mmyear consistent with results reported for nearby sites as well as regional estimates Likewise the final calibrated hydraulic conductivity values for the up-gradient (06 mday) and down-gradient (2 mday) zones were consistent with both the site-specific slug test data and results obtained for other nearby EPA assessment areas The final calibrated down-gradient constant head elevation was 15 m AHD It was concluded by Arcadis that the groundwater flow model was well calibrated and could therefore serve as an appropriate basis for the development of a site-specific solute transport model
82 Solute transport modelling
A site-specific (three-dimensional) solute transport model using the MT3DMS transport code of Zheng (1990) was developed by Arcadis to predict the fate and transport of groundwater contaminants (specifically
12 Further information regarding boundary effects is provided in the Arcadis report (Appendix O)
80607-1 REV1 30102017 PAGE 43
EPA REF 0524111 FINAL REPORT STAGE 1 ENVIRONMENTAL ASSESSMENT THEBARTON ASSESSMENT AREA
CHC) under current conditions over a period of 100 years This dual-domain mass transport model was used in conjunction with the groundwater flow model developed through the use of MODFLOW (as detailed above) assuming the following
The primary COPC is TCE ndash the initial concentration distribution of TCE in groundwater was based on the recent (July 2017) monitoring data
The age of the groundwater TCE plume was assumed to be up to about 90 years ndash ie based on the history of industrial land use (specifically the former Austral facility) in the area
Although lesser amounts of other CHC are present in groundwater the lack of significant daughter products of TCE has been interpreted to indicate that substantial biodegradation is not occurring (ie as a conservative approach)
Although a CHC source was not explicitly incorporated into the solute transport model the MT3DMS transport code indirectly accounts for on-going contaminant mass contribution to the dissolved-phase plume
The fate and transport of TCE within the area of interest involves the processes of advection adsorption dilution and diffusion ndash however given that recharge via the infiltration of precipitation was considered to be insignificant dilution effects were assumed to be minimal
Two porosity values (ie dual domain) are relevant to the movement of contaminants in the subshysurface with adopted values based on site-specific geology and Payne et al (2008) ndash whereby the two domains are in equilibrium
― mobile porosity that portion of the formation with the highest permeability where advective transport dominates ndash assumed to be 5 (high) 10 (intermediate) or 15 (low) for different mobility transport conditions and
― immobile porosity lower permeability portions of the formation where diffusion is dominant ndash assumed to be 15
As discussed in Section 732 hydraulic conductivity values of 06 mday (south-eastern approximate quarter of the modelling area) and 2 mday (northern approximate three-quarters of the modelling area) were adopted to reflect the hydrogeologic transition (ie from the south-east to the north-west) interpreted from the slug test data
The adopted TCE retardation factor of 147 for intermediate mobility transport conditions was based on the following
― an assumed organic carbon fraction of 01 (US EPA 1996 amp 2009) ndash this was varied to 005 and 2 to assess alternate (ie high versus low) mobility transport conditions
― an assumed organic carbon adsorption co-efficient of 61 Lkg (US EPA 2017a)
PAGE 44 80607-1 REV1 30102017
EPA REF 0524111 FINAL REPORT STAGE 1 ENVIRONMENTAL ASSESSMENT THEBARTON ASSESSMENT AREA
― a calculated partition co-efficient of 0061 Lkg ndash this was varied to 129 and 178 Lkg to assess alternate (ie high versus low) mobility transport conditions and
― an average soil bulk density of 192 gcm3 (based on measured geochemical data ndash refer to Table 1 Appendix L)
An optimum mass transfer co-efficient (MTC) was based on simulated flux distribution in the groundwater flow model whereby
― the calculated MTC in the model ranged from approximately 38E-08day-1 to 37E-05 day-1 and
― the average MTC was 185E-05day-1
The site-specific solute transport model was used in predictive mode to assess the long-term (eg 100 year) potential migration of the groundwater TCE plume and to support the EPA in the potential future definition of an appropriate GPA The model was calibrated against the current extent (ie concentrations of TCE above 1 microgL have migrated approximately 500 m from the suspected source site13) and expected age (ie up to about 90 years) of the plume The results indicate that the leading edge of the TCE (ie the 1 microgL contour) is estimated to migrate between approximately 400 and 620 m over a period of 100 years under low to high mobility transport conditions14 with intermediate transport conditions resulting in an estimated migration of 500 m By comparison no significant lateral plume expansion would be expected to occur Figures 5 to 17 of the Arcadis report (Appendix O) show the predicted extent of the TCE plume at 5 10 50 and 100 years under low to high mobility transport conditions
Figure 81 shows the predicted extent of the 1 microgL TCE boundary in 100 years under intermediate transport conditions ndash it is recommended that this information be used to support the EPA in establishing a potential future GPA
The Arcadis report notes that given the available site information (site history potential source area(s) and uncertainty associated with the current plume extent) and degree of model calibration (flow model parameter values are consistent with site-specific data as well as regionalnearby studies while transport parameter values are consistent with literatureindustry standards) the model-predicted migration of approximately 500 m over 100 years is considered to be a reasonable representation of future conditions
Key uncertainties associated with the modelling were identified as including the following
current plume extents (ie down-gradient delineation)
site-specific fraction organic values (or site-specific partition coefficient estimates) and
site-specific porosity estimates
13 although it was noted that there is uncertainty with respect to the current extent of the TCE plume since all three down-gradient monitoring wells (MW18 MW23 and MW25) have TCE concentrations above 1 μgL
14 ie assuming different values for mobileimmobile porosity the TCE distribution (sorption) coefficient and the TCE retardation factor
80607-1 REV1 30102017 PAGE 45
EPA REF 0524111 FINAL REPORT STAGE 1 ENVIRONMENTAL ASSESSMENT THEBARTON ASSESSMENT AREA
Lesser uncertainties were considered to include site-specific bulk hydraulic conductivity estimates and determination of the presence or absence of naturally-occurring TCE degradation
Additional site investigation and data collection (eg multi-well pumping tests for bulk hydraulic conductivity estimates site-specific fraction organic carbon andor distribution (sorption) coefficient additional down-gradient plume delineation) would help to further refine the model and increase confidence in the predictive results
Figure 81 Predictive TCE (1 microgL) plume extent after 100 years (ie shown in green) relative to the boundary of the Thebarton EPA Assessment Area (red) and the extent of the modelling area (purple)
PAGE 46 80607-1 REV1 30102017
EPA REF 0524111 FINAL REPORT STAGE 1 ENVIRONMENTAL ASSESSMENT THEBARTON ASSESSMENT AREA
9 VAPOUR INTRUSION RISK ASSESSMENT
Arcadis were commissioned by Fyfe to undertake a Vapour Intrusion Risk Assessment (VIRA) of the soil vapour CHC impacts detected within the Thebarton EPA Assessment Area based on the recently obtained (ie August 2017) permanent soil vapour bore data The Arcadis report is included as Appendix P
91 Objective
The main objective of the VIRA was to evaluate the potential risk to human health from vapour intrusion related to the concentrations of CHC identified in soil vapour within the Thebarton EPA Assessment Area
92 Areas of interest
The following areas of specific interest (ie located within the Thebarton EPA Assessment Area) were identified for the purpose of this VIRA
commercialindustrial properties (assumed slab on grade construction) including the former Austral property (ie the suspected source site) and
residential properties (slab on grade crawl space and basement constructions)
Potential exposure by trenchmaintenanceutility workers has also been considered (qualitatively)
93 Risk assessment approach
The VIRA was conducted in accordance with the ASC NEPM (1999) enHealth (2012a) and other relevant Australian guidance documents as well as guidance documents issued by the US EPA and other international regulatory agencies (where applicable)
The conduct of the risk assessment was based on a multiple lines of evidence approach using the available site-specific information collected as part of the scope of works detailed in Section 32
The following information was used as a basis for the VIRA
CHC including TCE PCE and DCE (11- cis-12- and trans-12-) have been identified within soil vapour andor groundwater within the Thebarton EPA Assessment Area ndash the analytical data indicate that TCE constitutes between about 95 and 100 of the CHC identified in groundwater and soil vapour
TCE has been considered as the risk driver for the VIRA (ie based on its toxicity and concentrations in soil vapour and groundwater) ndash although TCE PCE 12-DCE 11-DCE and VC have all been included as COPC for the Tier 1 screening assessment (Section 94) the Tier 2 assessment (Section 95) has
80607-1 REV1 30102017 PAGE 47
EPA REF 0524111 FINAL REPORT STAGE 1 ENVIRONMENTAL ASSESSMENT THEBARTON ASSESSMENT AREA
concentrated on TCE PCE and 11-DCE (ie due to their presence at concentrations that exceeded the adopted Tier 1 screening criteria)
The CHC identified within the Thebarton EPA Assessment Area are volatile chemicals and could potentially pose a risk to human health via the vapour intrusion pathway Although the source area has yet to be confirmed the CHC concentrations observed in groundwater and soil vapour are considered likely to have originated from the former Austral property (as discussed in Section 12)
The natural soils underlying the fill material (where present) in the Thebarton EPA Assessment Area are typified by the Quaternary age soils and sediments of the Adelaide Plains with the Pooraka Formation and Hindmarsh Clay units considered to dominate the upper soil profile
The soil geotechnical data and soil vapour results collected by Fyfe (as discussed in Sections 712 and 74 respectively) have been used for the VIRA
A two-tier approach was adopted for the VIRA The first tier (herein referred to as the Tier 1 assessment) was conducted by comparing the measured soil vapour TCE concentrations to published guideline values adjusted (conservatively) to account for attenuation from sub-slab soil into indoor air The second tier (herein referred to as the Tier 2 assessment) involved the comparison of predicted indoor air TCE concentrations to adopted indoor air criteria or response levels
94 Tier 1 assessment
As detailed in Section 74 the initial Tier 1 (screening risk) assessment involved comparing measured soil vapour COPC concentrations with the ASC NEPM (1999) interim soil vapour HILs for residential and commercialindustrial land uses (refer to Table 74) Given that the development of the interim soil vapour HILs was based on very conservative assumptions the initial Tier 1 assessment provided only a first-pass screening assessment of the data to determine if further risk assessment would be required
The interim soil vapour HILs are applicable for the assessment of soil vapour at 0 to 1 m beneath the floor of a building They were based on adopted toxicity reference values (TRV) and relevant exposure parameters (ie adjusted for different land uses) as well as an assumed soil vapour to indoor air attenuation factor of 01
The soil vapour to indoor air attenuation factor (01) was based on the US EPA (2002) recommended default attenuation factors for the generic screening step of a tiered vapour intrusion assessment process As discussed in the US EPA (2002) document the default attenuation factor of 01 for sub-slab soil vapour was based on a US EPA database of empirical attenuation factors calculated using measurements of indoor air and soil vapours from different sites In 2012 the US EPA provided an updated database which was accompanied by an evaluation and statistical analysis of attenuation factors for volatile CHC in residential buildings US EPA (2012) found the sub-slab to indoor air attenuation factor of 003 to be the 95th percentile In 2015 the revised sub-slab attenuation factor (003) was adopted by the US EPA
PAGE 48 80607-1 REV1 30102017
EPA REF 0524111 FINAL REPORT STAGE 1 ENVIRONMENTAL ASSESSMENT THEBARTON ASSESSMENT AREA
The revised sub-slab to indoor air attenuation factor of 003 was adopted to derive modified residential and commercialindustrial soil vapour HILs for the Tier 1 assessment The modified residential soil vapour HILs are presented in Table 91 relative to the maximum CHC concentrations obtained for soil vapour within the Thebarton EPA Assessment Area
The Tier 1 assessment based on a comparison of the COPC concentrations measured in soil vapour at various locations within the Thebarton EPA Assessment Area with the modified residential soil vapour HILs detailed in Table 91 indicated the following
TCE concentrations exceeded the adopted criterion in SV1 to SV9 whereas
the concentrations of PCE and 11-DCE exceeded the adopted criteria in SV3 only
These locations were identified as requiring further assessment (ie Tier 2 VIRA ndash refer to Section 95)15
Table 91 Tier 1 assessment ndash ASC NEPM (1999) and modified residential soil vapour HILs
Compound ASC NEPM (1999) HIL
(microgm3)
Modified Tier 1 HIL (microgm3)
(AF = 003)
Maximum measured soil vapour concentration (microgm3)
Acceptable
Location 1 m BGL Location 3 m BGL
11-DCE 7000 SV3 5900 SV3 14000 No ndash Tier 2 required
cis-12-DCE 80 265 SV2 21 SV4 30 Yes
trans-12-DCE 80 265 - ND SV5 20 Yes
PCE 2000 6650 SV3 6500 SV3 15000 No ndash Tier 2 required
TCE 20 65 SV3 210000 SV3 100000 0
No ndash Tier 2 required
VC 30 100 - ND - ND Yes Notes Values in bold exceed the modified residential soil vapour HILs cis-12-DCE HIL adopted as surrogate screening criterion based on US EPA (2017b) regional screening level for residential air elevated laboratory LOR (ie above modified Tier 1 HIL) also reported Abbreviations AF = attenuation factor HIL = health investigation level ND = non detect
95 Tier 2 assessment
951 Tier 2 assessment criteria
The Tier 2 VIRA criteria for the residential zone comprise HIL-based residential indoor air criteria for the COPC (refer to Section 94) along with the residential indoor air level response ranges for TCE that were
15 Note that all locations were subjected to the Tier 2 VIRA in this assessment
80607-1 REV1 30102017 PAGE 49
EPA REF 0524111 FINAL REPORT
STAGE 1 ENVIRONMENTAL ASSESSMENT
THEBARTON ASSESSMENT AREA
initially developed by the EPA and SA Health for the EPA Assessment Area at Clovelly Park and Mitchell
Park These screening criteria and indoor air response ranges as detailed in SA EPA (2014) and
reproduced in Figure 91 are now widely adopted in South Australia for the assessment of TCE relating
to indoor air exposure
Figure 91 TCE indoor air screening criteria and the corresponding site-specific response levels
Note The no action response level is applicable where a soil vapour concentration is below the laboratory LOR (ie ND or ldquonon-
detectrdquo assumed to be lt01 microgm3)
PAGE 50 80607-1 REV1 | 30102017
EPA REF 0524111 FINAL REPORT STAGE 1 ENVIRONMENTAL ASSESSMENT THEBARTON ASSESSMENT AREA
952 Vapour intrusion modelling
For this VIRA exposure point concentrations (EPCs) of COPC in the indoor air of buildings with a slab on grade crawl space or basement construction were estimated using conservative screening assumptions and the Johnson and Ettinger (1991) vapour transport and mixing model (ie the JampE model)
The algorithms applied in the JampE (1991) model are detailed in Appendix A of the Arcadis report whereas the modelling spreadsheets for each scenario are provided in Appendix B ndash the Arcadis report is attached to this report as Appendix P
9521 Input parameters
The input parameters adopted for the vapour intrusion modelling relate to the following
the construction type and details of existing or proposed buildings ndash refer to Table 92 for adopted building input parameters
the nature of the soil profile ndash refer to Table 93 for adopted soil input parameters (0 to 1 m BGL) and
the contaminant source concentrations ndash refer to Table 6 in Appendix L
Table 92 Tier 2 vapour intrusion modelling ndash building input parameters
Parameter Units Adopted value Reference
Residential Commercial industrial
Width of Building cm 1000 2000 Friebel and Nadebaum (2011)
Length of Building cm 1500 2000
Height of Room cm 240 300
Height of crawl space cm 30 - Assumption for crawl space
Attenuation from basement to ground floor air
- 01 01 Friebel and Nadebaum (2011)
Air Exchange Rate (AER)
Indoor per hour 06 083 Friebel and Nadebaum (2011)
Crawl space per hour 06 - Friebel and Nadebaum (2011)
Basement per hour 06 - As per residential (indoor)
Fraction of Cracks in Walls and foundation
- 0001 0001 Friebel and Nadebaum (2011)
Qsoil cm 3s 300 277 Calculated from QsoilQbuilding ratio of 0005 (residential) and 0001 (commercial)
80607-1 REV1 30102017 PAGE 51
EPA REF 0524111 FINAL REPORT STAGE 1 ENVIRONMENTAL ASSESSMENT THEBARTON ASSESSMENT AREA
Table 93 Tier 2 vapour intrusion modelling ndash soil input parameters
Parameter Units Adopted value Reference
Depth cm 100 Depth of shallow soil vapour data
Total porosity - 047 Site specific geotechnical data ndash ie averaged from MW3 and MW11 shallow samples (refer to Table 1 in Appendix L) Air filled porosity - 030
Water filled porosity - 017 Notes ie representing a conservative approach whereby data for the shallow samples with the highest total porosity and lowest degree of saturation (and therefore the highest air filled porosity) have been adopted
The site specific attenuation factors calculated within the vapour intrusion models (Appendix B of the Arcadis report) are summarised in Table 94 These are chemical and depth specific values applicable to each building construction scenario These attenuation factors have been applied to the soil vapour data measured across the Thebarton EPA Assessment Area to calculate indoor air concentrations (residential properties only) in proximity to each soil vapour location ndash for commercialindustrial properties (slab on grade) indoor air concentrations have only been calculated with respect to the soil vapour data obtained for SV3 (ie the soil vapour bore with the highest measured TCE concentrations)
Table 94 Adopted attenuation factors for TCE in soil vapour to indoor air
Scenario Attenuation factor
Residential ndash slab on grade 706 x 10-4
Residential ndash crawl space 209 x 10-3
Residential ndash basement 113 x 10-1
Commercial ndash slab on grade 408 x 10-4
Notes ie soil vapour intrusion to indoor air of residential living spaces refer to Section 953 for a discussion of potential vapour intrusion risks associated with commercialindustrial properties
The chemical parameters of the COPC adopted in the JampE model were updated with data from the chemical database in the Risk Assessment Information System (RAIS 2016) as detailed in Table 95
Table 95 Summary of chemical parameters adopted for vapour intrusion modelling
Chemical Diffusivity in Air Diffusivity in Water Solubility Henryrsquos Law Molecular weight (Dair) Water (Dwater) (S) Constant 25oC (gmol)
(cm2s) (cm2s) (mgL) (unitless)
11-DCE 00863 0000011 2420 107 969
PCE 00505 000000946 206 0724 166
TCE 00687 00000102 1280 0403 131
PAGE 52 80607-1 REV1 30102017
EPA REF 0524111 FINAL REPORT STAGE 1 ENVIRONMENTAL ASSESSMENT THEBARTON ASSESSMENT AREA
9522 Predicted indoor air concentrations
Residential The predicted indoor air concentrations for each soil vapour data point as calculated by Arcadis for the three residential building scenarios (ie slab on grade crawl space and basement) are presented in Appendix C of the Arcadis report (included in this report as Appendix P)
Table 96 provides a comparison of predicted indoor air concentrations against the EPA response levels detailed in Section 951 (Figure 91) ndash ie using the 1 m soil vapour data space for slab on grade and crawl space scenarios versus the 3 m soil vapour data for basements
It should be noted that if residential properties within the Thebarton EPA Assessment Area have basements however the vapour intrusion risks will increase whereas slab on grade construction will carry a lesser vapour intrusion risk (as detailed in Table 96)
Commercialindustrial The predicted indoor air concentrations as calculated by Arcadis for a commercialindustrial (ie slab on grade) land use scenario with respect to the soil vapour data obtained for SV3 (ie maximum measured soil vapour concentrations) are as follows
11-DCE 3 microgm3
PCE 19 microgm3 and
TCE 86 microgm3
As these values are not directly comparable to the EPA response levels developed for residential land use further discussion of potential vapour intrusion risks to human health under a commercialindustrial land use
scenario is included in Section 953
As discussed for residential properties the vapour intrusion risks may increase if basements are present
80607-1 REV1 30102017 PAGE 53
EPA REF 0524111 FINAL REPORT STAGE 1 ENVIRONMENTAL ASSESSMENT THEBARTON ASSESSMENT AREA
Table 96 Comparison of predicted residential indoor air concentrations with SA EPA response levels
Indoor Air Concentration Ranges (microgmsup3) SA EPA response levels
non-detect No action
gt non-detect to lt2 Validation
2 to lt20 Investigation
20 to lt200 Intervention
ge200 Accelerated Intervention
Soil vapour bore
Sample depth
(m)
Soil vapour TCE concentration
(microgmsup3)
Predicted indoor air concentration (microgmsup3)
Residential scenario
Slab on grade Crawl space Basement
Attenuation factor
7 x 10⁻⁴ 2 x 10⁻³ 1 x 10⁻¹
SV1 10 5700 4 11
SV1 30 21000 2100
SV2 10 51000 36 102
SV2 30 890000 89000
SV2 (FD) 30 940000 94000
SV3 10 210000 147 420
SV3 30 1000000 100000
SV4 10 17000 12 34
SV4 30 43000 4300
SV5 10 100000 70 200
SV5 30 160000 16000
SV6 10 22000 15 44
SV6 (FD) 10 22000 15 44
SV6 30 150000 15000
SV6 (FD) 30 140000 14000
SV7 10 22000 15 44
SV7 30 110000 11000
SV8 10 2300 2 5
SV8 30 14000 1400
SV9 10 170 012 030
SV9 30 260 26
SV10 10 9 0007 0019
SV10 30 51 51
SV11 10 lt18 - -
SV12 10 16 0011 0032
SV12 30 55 55
SV13 10 lt21 - -
PAGE 54 80607-1 REV1 30102017
EPA REF 0524111 FINAL REPORT STAGE 1 ENVIRONMENTAL ASSESSMENT THEBARTON ASSESSMENT AREA
Notes With respect to the predicted indoor air CHC concentrations in the Arcadis VIRA report (refer to Appendix P) the results in Table 5 were calculated for SV3 using the unrounded attenuation factors presented in Appendix B (and Table 94 of this report) whereas the TCE indoor air concentrations in Appendix C (as summarised in Table 96) were calculated using rounded attenuation factors ndash this does not change the overall interpretation of the results Abbreviations FD = field duplicate
9523 Sensitivity analysis
Table 97 presents a qualitative sensitivity analysis for some of the input variables used in the modelling ndash it includes the range of practical values for each variable the value used in the risk assessment the relative model sensitivity and the uncertainty associated with the variable
Although Arcadis note that a number of parameters used within the risk assessment have a moderate degree of uncertainty associated with them thereby suggesting that the modelling may be sensitive to changes in these parameters values used to define these parameters were selected to be conservative This is considered to have resulted in an assessment which is expected to be conservative and to over-estimate actual risk
Table 97 Summary of model input parameters subjected to sensitivity analysis
Input Range of values Value adopted Sensitivity of calculated input parameters variable
Soil physical parameters
Total porosity
Varies by soil type generally 03 to 05
047 Site-specific
Indoor air concentrations will decrease with increasing total porosity Moderate sensitivity parameter decreasing by 50 will increase predicted concentration by a factor of 4
Air filled porosity
Varies by soil type generally 015 to 03
03 Site-specific
Indoor air concentrations will increase with increasing air filled porosity Moderate to high sensitivity parameter reduction by 50 decreases concentration by a factor of 10
Water filled porosity
Varies by soil type from 005 (fill or
sand) to 03 (clay)
017 Site-specific
Negligible impact on predicted indoor air concentrations although may decrease with increasing moisture content Very low sensitivity parameter
Building parameters
Air exchange rate (AER)
Varies from 05 hr-1
in smaller buildings to gt2 hr-1
06 hr-1 for residential structures
083 hr-1 for commercial
Indoor air concentrations will decrease with increasing air exchange Moderate sensitivity parameter has linear relationship with predicted concentrations conservative assumptions used
80607-1 REV1 30102017 PAGE 55
EPA REF 0524111 FINAL REPORT STAGE 1 ENVIRONMENTAL ASSESSMENT THEBARTON ASSESSMENT AREA
Input Range of values Value adopted Sensitivity of calculated input parameters variable
Advective flow rates
Varies depending on building size and
AER
300 cm3sec Calculated from building AER and
ratio of 0005
Indoor air concentrations will increase with increasing advective flow Low sensitivity parameter particularly within normal range of potential values The assumption that advective flow is occurring into a building at all times is generally conservative for Australian settings Advection is unlikely to occur under a crawl space home and diffusive transport is the dominant transport mechanism
Building size Variable Variable consistent with
Friebel and Nadebaum (2011)
Indoor air concentrations decrease with increasing building volume
Very low sensitivity parameter
9524 Uncertainties
The following uncertainties were identified in the Arcadis report (Appendix P)
Vapour transport modelling
The use of a model to predict the migration of vapour from a sub-surface source to indoor air requires the simplification of many complex processes in the sub-surface as well as the potential for entry and dispersion within a building or outdoor air To address this simplification the vapour models available (and adopted in this assessment) are considered to be conservative such that uncertainties are addressed through the overshyestimation of likely concentrations
It should be noted that the vapour model used is designed to be a first tier screening tool and is considered likely to over-estimate air concentrations due to the incorporation of a number of conservative assumptions including the following
chemical concentrations in soil vapour were assumed to remain constant over the duration of exposure (ie it was assumed that the source was non-depleting and not subject to natural biodegradation processes)
the maximum reported soil vapour concentrations were assumed to be present beneath nearby dwellings and
the occurrence of steady well-mixed vapour dispersion within the enclosed or ambient mixing space
Overall the vapour modelling undertaken is expected to provide an over-estimation of the actual vapour exposure concentrations
PAGE 56 80607-1 REV1 30102017
EPA REF 0524111 FINAL REPORT STAGE 1 ENVIRONMENTAL ASSESSMENT THEBARTON ASSESSMENT AREA
Toxicological Data
In general the available scientific information involves the extrapolation of toxicity information from studies involving experimental laboratory animals with some validation of observable health effects obtained through epidemiological studies
This may introduce two types of uncertainties into the risk assessment as follows
those related to extrapolating from one species to another and
those related to extrapolating from the high exposure doses usually used in experimental animal studies to the lower doses usually estimated for human exposure situations
In order to adjust for these uncertainties toxicity values commonly incorporate safety factors that may vary from 10 to 10000
Overall the toxicological data presented in this assessment are considered to be current and adequate for the assessment of risks to human health associated with potential exposure to the COPC identified The uncertainties inherent in the toxicological values adopted are considered likely to result in an over-estimation of actual risk
953 Potential vapour intrusion risks associated with commercialindustrial properties
An assessment of potential vapour intrusion risks to workers at commercialindustrial properties (slab on grade construction) within the Thebarton EPA Assessment Area was undertaken by Arcadis using the methodology published by US EPA (2009) and incorporated into the ASC NEPM (1999) This approach recommends adjustment of the measured or estimated contaminant concentrations in air to account for site specific exposures by the relevant receptors as follows
Ca ET EF EDECinh = days hours AT 365 24 year day
Where
ECinh = Exposure Adjusted Air Concentration (mgm3) Ca = Chemical Concentration in Air (mgm3) ET = Exposure Time (hoursday) EF = Exposure Frequency (daysyear) ED = Exposure Duration (years) AT = Averaging Time (years)
= 70 years for non-threshold carcinogens = ED for chemicals assessed based on threshold effects
80607-1 REV1 30102017 PAGE 57
EPA REF 0524111 FINAL REPORT STAGE 1 ENVIRONMENTAL ASSESSMENT THEBARTON ASSESSMENT AREA
Exposure parameters were selected from Australian sources (enHealth 2012b ASC NEPM 1999) for the receptor groups evaluated or were based on site specific factors Table 98 presents an overview of the parameters used whereas adopted inhalation TRVs are presented in Table 99
Risk was characterised for threshold and non-threshold effects for the COPC ndash spreadsheets presenting the risk calculations are provided in Appendix B of the Arcadis report (as included in Appendix P) For commercialindustrial properties the non-threshold risk level was calculated to be 3 x 10⁻⁵ (compared to a target risk level of 1 x 10⁻⁵) whereas the threshold risk level was calculated to be 10 (compared to a target risk level of 1) ndash these results indicated a potentially unacceptable vapour intrusion risk to commercialindustrial workers in the vicinity of the maximum soil vapour CHC concentrations (ie at SV3 ndash worst-case scenario based on maximum soil vapour concentrations)
Table 98 Exposure parameters ndash Commercialindustrial workers
Exposure parameter Units Value Reference
Exposure frequency days year 365 ASC NEPM (1999)
Exposure duration years 30 ASC NEPM (1999)
Exposure time indoors hoursday 8 ASC NEPM (1999)
Averaging time
Non-threshold
threshold
Years
years
70
30 ASC NEPM (1999)
Table 99 Adopted inhalation toxicity reference values
COPC Toxicity reference values
Non-threshold (microgm3)
Reference Threshold (microgm3)
Reference
11-DCE NA - 80 ATSDR (1994)
PCE NA - 200 WHO (2006)
TCE 41 US EPA (2011) IRIS 2 US EPA (2011) IRIS Notes Abbreviations NA = not applicable
954 Potential risks to trenchmaintenanceutility workers
Although trenchmaintenanceutility workers may be exposed to soil vapour concentrations as measured at 1 m BGL due to the short-term nature of such works their total intakes of TCE and other CHC will be low Assuming that a trenchmaintenanceutility worker may be exposed to TCE for a limited number of working days throughout the year (eg 20 days of 8 hours duration within an excavation) their intake will be approximately one fiftieth of the intake of a resident (who is assumed to be exposed 21 hours a day for 365 days a year)
PAGE 58 80607-1 REV1 30102017
EPA REF 0524111 FINAL REPORT STAGE 1 ENVIRONMENTAL ASSESSMENT THEBARTON ASSESSMENT AREA
Therefore the management of exposures by trenchmaintenanceutility workers may be required in areas where TCE at 1 m BGL is greater than 100 microgm3 (or 50 times the acceptable concentration for indoor air)
96 Conclusions
On the basis of the available data and the assessment presented in the Arcadis VIRA report (Appendix P) the following conclusions were provided
Health risks for residents due to the intrusion of CHC in soil vapour into residential buildings with a slab on grade crawl space or basement construction were calculated to be above the adopted EPA response levels and risks to residents may therefore be unacceptable within some parts of the Thebarton EPA Assessment Area
Health risks for commercial workers due to the intrusion of CHC in soil vapour into buildings with a slab on grade construction were calculated to be above the adopted target risk levels and risks to workers may therefore be unacceptable within some parts of the Thebarton EPA Assessment Area
In the absence of specific information regarding building construction within the Thebarton EPA Assessment Area the predicted indoor air concentrations calculated from the 1 m BGL soil vapour data for a residential crawl space scenario are summarised in Table 910
Table 910 Summary of properties with predicted indoor air concentrations (residential crawl space) above adopted EPA response levels
EPA response level No of residential properties affected Indoor air concentration (microgm3) Response
non-detect to lt2 Validation 9
2 to lt20 Investigation 10
20 to lt200 Intervention 8
ge200 Accelerated intervention 3 Notes According to information provided by the EPA there are approximately 130 residential properties located in the Thebarton EPA Assessment Area calculated on the basis of cadastral boundaries ndash some properties host more than one residence whereas some have one residence across two properties andor also host a commercial facility ndash these data would therefore need to be confirmed via a property survey
80607-1 REV1 30102017 PAGE 59
EPA REF 0524111 FINAL REPORT STAGE 1 ENVIRONMENTAL ASSESSMENT THEBARTON ASSESSMENT AREA
10 CONCEPTUAL SITE MODEL
As detailed in Table 101 a CSM has been developed for the Thebarton EPA Assessment Area on the basis of historical information (as summarised in Section 12 as well as Appendices A and B) and the data obtained during the recent Fyfe investigation program
Table 101 Summary of existing information for the Thebarton EPA Assessment Area
Topic Summarised Information
Site Characterisation
Identification of Assessment Area
An approximately 27 ha Assessment Area located within the suburb of Thebarton has been defined by the EPA The boundaries of this area are detailed in Section 21 and illustrated on Figure 1
History of land use Properties located within the Thebarton EPA Assessment Area have been used for a mixture of commercialindustrial and low density residential land uses over time Current commercialindustrial properties include a beverage factory in the north-eastern portion of the assessment area a refrigeration equipment facility a car dealership two hotels (at least one of which has a cellarbasement) automotive and other workshops and the Ice Arena Former commercialindustrial activities have been identified as including a gas works a mechanicrsquos workshop sheet metal working facilities and a farm machinery manufacturer
Historical investigations
Reports provided to Fyfe by the EPA that pertain to previous investigations undertaken within the Thebarton EPA Assessment Area have been reviewed and summarised in Appendix A Additional historical information is included in Appendix B
Local geology Natural soils encountered from the surfacenear surface to the maximum drill depth of 19 m BGL across the Thebarton EPA Assessment Area were considered to be indicative of the Quaternary Pooraka and Hindmarsh Clay formations Whereas fill materials (ie sand gravelcrushed rock andor silt) were encountered to depths of up to 09 m BGL at a number of sampling locations underlying natural soils comprised mainly low to medium plasticity silty or sandy clays with variable gravel contents Geotechnical testing of subsurface soil samples collected from 10 drill cores indicated that the PSD comprised predominantly claysilt with lesser components of sand andor gravel ndash these soil samples were mostly classified as Clay although some were classified as Sandy Clay or Clayey Sand According to Stapledon (1971) the Hindmarsh Clay unit typically contains many structural features and defects which greatly influence its permeability thereby resulting in potential preferential pathways for the vertical and lateral movement of soil vapour and groundwater Such features were not specifically observed during the recent drilling and soil logging work although some gravel lenseslayers were identified
Hydrogeology In accordance with Gerges (2006) and his classification of the Adelaide metropolitan area into a number of zones based on their individual hydrogeological characteristics the Thebarton EPA Assessment Area is located within Zone 3 (subzone 3E) to the west of the Para Fault It contains five to six Quaternary aquifers and three or four Tertiary aquifers Based on the most recent investigations the depth to water within the Q1 aquifer in the Thebarton EPA Assessment Area ranges from approximately 123 to 159 m BGL and groundwater flows in a general north-westerly direction with a relatively flat hydraulic gradient (000062 to 00012) Salinity levels (based on field EC readings) range from approximately 1230 to 3620 mgL TDS and a groundwater flow velocity range of approximately 44 to 23 myear has
80607-1 REV1 30102017 PAGE 61
EPA REF 0524111 FINAL REPORT STAGE 1 ENVIRONMENTAL ASSESSMENT THEBARTON ASSESSMENT AREA
Topic Summarised Information
been inferred As detailed in Section 222 a search of the DEWNR (2017) WaterConnect database identified 59 bores within the general Thebarton area of which 18 are located within the Thebarton EPA Assessment Area Although (where recorded) bores were listed as having been installed primarily for monitoring investigation or observation purpose other purposes (for presumed Quaternary aquifer bores) included drainage domestic and industrial A BUA has identified realistic groundwater uses as potentially including potable residential irrigation and primary contact recreationaesthetics Based on proximity to the River Torrens freshwater ecosystem protection has also been considered ndash however since the River Torrens is considered to be either a recharge boundary (ie discharging to local groundwater) or not actually hydraulically connected to the Q1 aquifer in this area this may not be a realistic beneficial use Since volatile contaminants have been detected within the Q1 aquifer a potential vapour flux risk to future site users has also been considered
Hydrology No surface water bodies have been identified within the Thebarton EPA Assessment Area The closest surface water body is the River Torrens located approximately 03 km to the east and 07 km to the north and north-west Current stormwater run-off within the Thebarton EPA Assessment Area is expected to be collected by localised (and engineered) drainage systems
Fyfe Investigation Results
Groundwater impacts Contaminants identified in groundwater beneath the Thebarton EPA Assessment Area include TCE PCE 12-DCE (cis- and trans-) and 11-DCE Although TCE PCE and 11-DCE are all considered to represent primary contaminants TCE is considered to be the main COPC (ie with the highest concentrations and greatest distribution) By comparison cis- and trans-12-DCE which are considered to represent break-down (ie daughter) products of TCE andor PCE occur at relatively minor concentrations at scattered locations and were not considered indicative of significant TCE breakdown (ie via dechlorination) Although VC represents another (expected) daughter product of TCE it was not detected in any of the groundwater wells tested The groundwater TCE plume is considered to have migrated in a north-westerly direction from the suspected source site (ie the former Austral sheet metal works) in accordance with the predominant flow direction associated with the Q1 aquifer (refer to Figures 4 and 5) The plume has been traced as far west and north as Dew Street and Smith Street respectively within the Thebarton EPA Assessment Area (ie the extent of the monitoring well network installed by Fyfe) but its north-western extent has not yet been determined (whereas its extent has been defined in all other directions)
Soil vapour impacts Contaminants identified in soil vapour beneath the Thebarton EPA Assessment Area include TCE PCE 12-DCE (cis- and trans-) and 11-DCE The distribution of TCE in soil vapour at 1 and 3 m BGL generally correlates with the north-westerly groundwater flow direction (refer to Figures 6 and 7) and is therefore considered to be a product of volatilisation from the groundwater CHC plume ndash the consistent decrease in soil vapour concentrations with decreasing depth also supports this conclusion The soil vapour samples with the maximum TCE concentrations (ie SV3_10m and SV3_30m) also had the highest PCE and 11-DCE concentrations (or elevated LOR) thereby suggesting that they could represent co-contaminants (ie from a similar source areaactivity) These samples also had elevated LOR for 12-DCE (cis- and trans-) Although VC was not detected in any of the soil vapour samples the laboratory LOR for VC in most of the samples with the highest concentrations of TCE (ie SV2_30m SV3_10m SV3_30m and SV7_30m) exceeded the adopted HILs for residential andor commercialindustrial land use Although the absence of VC in soil vapour cannot therefore be confirmed its absence at detectable levels in groundwater suggests that (limited) TCE
PAGE 62 80607-1 REV1 30102017
EPA REF 0524111 FINAL REPORT STAGE 1 ENVIRONMENTAL ASSESSMENT THEBARTON ASSESSMENT AREA
Topic Summarised Information
degradation has not yet resulted in its production (ie at measureable levels) Although the extent of the soil vapour TCE plume has not yet been determined (ie in any direction) it is expected to have a similar extent to that of the identified groundwater plume (ie as the groundwater CHC impacts represent the source of the measured soil vapour CHC concentrations)
Potential Exposure Pathways
Contaminants of Based on the results of historical investigations the EPA identified a number of CHC as being of Potential Concern concern for the Thebarton EPA Assessment Area The main COPC was identified as TCE with
additional COPC including PCE 12-DCE (cis- and trans-) VC and 11-DCE Further detail is provided in Section 14 These COPC were confirmed by the Fyfe investigations with TCE identified as both the main contaminant in groundwater and soil vapour and the main driver in terms of potential human health risks associated with vapour intrusion into buildings within the Thebarton EPA Assessment Area (refer to Section 9)
Suspected source and The suspected source of the identified CHC groundwater (and soil vapour) impacts within the affected media Thebarton EPA Assessment Area is the former Austral sheet metal works located over multiple
allotments between George and Maria Streets from the 1920s until the 1960s-1970s Previous investigations (Appendix A) had identified groundwater CHC impacts on part of this suspected source site The Fyfe investigations have concentrated on impacts within groundwater and soil vapour across the Thebarton EPA Assessment Area both of which generally correlate with the inferred north-westerly groundwater flow direction and are considered to be related to the previously identified dissolved phase groundwater CHC impacts
Sensitive receptors The following sensitive receptors have been identified as potentially relevant to the Thebarton EPA Assessment Area Ecological groundwater ecosystems within the assessment area extending to at least Dew and Smith
Streets (ie as the north-western extent of the groundwater CHC plume has not yet been determined) and
the freshwater ecosystem of the River Torrens located at a distance of approximately 07 km in a hydraulically down-gradient (ie north-westerly) direction but not necessarily representing a groundwater receiving environment
Human current and future occupants of and visitors to residential properties current and future workers on the source site and other commercialindustrial properties
within the area current and future underground trenchmaintenanceutility workers and down-gradient groundwater bore users
Contaminant Possible contaminant transport mechanisms associated with the CHC-impacted groundwater transport identified within the Q1 aquifer beneath the Thebarton EPA Assessment Area include mechanisms flow through the aquifer to a hydraulically down-gradient surface water body andor down-
gradient groundwater bores vapour generation andor flow via subsurface preferential pathways (eg service trenches
more permeable soils) and downward movement into underlying aquifers (eg dense non-aqueous phase liquid
(DNAPL))
80607-1 REV1 30102017 PAGE 63
EPA REF 0524111 FINAL REPORT STAGE 1 ENVIRONMENTAL ASSESSMENT THEBARTON ASSESSMENT AREA
Topic Summarised Information
Exposure Possible exposure mechanisms associated with impacted groundwater within the Thebarton mechanisms EPA Assessment Area include
direct contact (eg during extractionuse of groundwater) incidental ingestion (eg during extractionuse of groundwater) and inhalation of vapours (eg during extractionuse of groundwater andor as a result of
vapour intrusion into buildings)
Assessment of Risk
Groundwater risks The recent groundwater analytical results have indicated that the Q1 aquifer beneath the Thebarton EPA Assessment Area contains measurable concentrations of CHC (mainly TCE but also including PCE 12-DCE andor 11-DCE at some locations) Measured concentrations of TCE exceeded the adopted assessment criteria for potable andor primary contact recreation in wells MW02 MW3 MW5 MW6 MW11 MW12 MW14 MW15 MW17 MW20 MW21 and MW23 located on Admella Maria George Albert and Dew Streets as well as Light Terrace with maximum concentrations corresponding to the ldquocorerdquo area of the plume One well (MW25) contained a concentration of carbon tetrachloride that exceeded the adopted potable criterion Although groundwater vapour flux has mainly been addressed by the VIRA it could also occur during the extraction of groundwater for domestic use and in terms of aesthetic considerations the CHC impacted groundwater could be odorous Additional parameters measured for the purpose of establishing general aquifer conditions (including whether conditions may be amenable to the breakdown of CHC) have also been reported ndash no clear secondary lines of evidence for the occurrence of natural attenuation have been identified
Groundwater fate Although scattered detectable concentrations of 12-DCE have been measured in groundwater and transport across the Thebarton EPA Assessment Area the absence of significant and ubiquitous TCE modelling daughter products has been interpreted to indicate that substantial dechlorination is not
occurring Groundwater fate and transport modelling (refer to Section 8 and Appendix O) has predicted that the likely extent of the dissolved phase groundwater TCE plume over the next 100 years will extend by another 500 m beyond the boundaries of the current Thebarton EPA Assessment Area However no significant lateral plume expansion is expected
Vapour intrusion risks A VIRA (refer to Section 9 and Appendix P) was undertaken to assess potential risks to human health from the intrusion of CHC vapours (primarily TCE) into indoor air from soil vapour The predicted indoor air concentrations of TCE within the residential portion (assuming crawl space construction in the absence of specific structural information) of the Thebarton EPA Assessment Area indicated that 21 (ie of approximately 130 residential properties) were predicted to have detectable levels of TCE in indoor air and therefore require further action as follows 10 properties within the investigation range (2 to lt20 microgm3) eight properties within the intervention range (20 to lt200 microgm3) and three properties within accelerated intervention range (ge200 microgm3) All remaining residential properties in the Thebarton EPA Assessment Area are considered to be safe from soil vapour intrusion with predicted indoor air concentrations of TCE below 2 microgm3
(assuming crawl space construction) Based on the results of the VIRA however substantially increased risks are likely to exist should cellarsbasements be present whereas risks may be lower for slab on grade construction premises Where permission has been granted by the ownersoccupiers indoor air monitoring of properties within the 20 to lt200 microgm3 and ge200 microgm3 response level ranges as well as
PAGE 64 80607-1 REV1 30102017
EPA REF 0524111 FINAL REPORT STAGE 1 ENVIRONMENTAL ASSESSMENT THEBARTON ASSESSMENT AREA
Topic Summarised Information
selected adjoining properties has been commissioned by the EPA to validate the results of the VIRA modelling (ie which are expected to be overly-conservative) ndash these results will be documented in a subsequent report Calculated vapour intrusion risks to workers within commercialindustrial properties (slab on grade construction) across at least part of the Thebarton EPA Assessment Area (ie based on the maximum soil vapour CHC concentrations in soil vapour bore SV3 located on Maria Street) are considered to be unacceptable Although a basementcellar is known to be present at one commercial property on George Street vapour intrusion risks to subsurface structures associated with commercialindustrial properties have not yet been assessed Management of exposures by trenchmaintenanceutility workers may be required in areas where TCE at 1 m BGL is greater than 100 microgm3 (ie corresponding to 50 times the acceptable concentration for indoor air)
Complete Exposure Pathways
Identified pathways and areas of potential risk
Based on the results of the recent Fyfe investigations (including the VIRA) and taking into account available historical information (Appendices A and B) and DEWNR (2017) WaterConnect bore information the following complete exposure pathways and associated risks are considered possible for the Thebarton EPA Assessment Area exposure (direct contact incidental ingestion andor inhalation of vapours) during use of
groundwater for domestic (eg drinking water plumbing garden irrigation) andor recreational (eg filling of swimming poolsspas) purposes
vapour intrusion into indoor air within 30 residential propertieslocated within the vicinity of soil vapour bores SV1 to SV9 (assuming crawl space construction) ndash although 19 of these properties are predicted to be in the validationinvestigation action level range 11 are predicted to be in the intervention action level range (with actual indoor air monitoring results for properties within the intervention action level range pending)
vapour intrusion into residential cellarsbasements (if present) in the vicinity of soil vapour bores SV1 to SV10 and SV12 and
vapour intrusion into the indoor air of commercialindustrial properties ndash although actual risks to site workers would require further specific considerationassessment
In addition although only assessed in a qualitative manner to date trenchmaintenanceutility workers may also be at risk where TCE at 1 m BGL is greater than 100 microgm3 (or 50 times the acceptable concentration for indoor air) Exposure management should involve the development of a site-specific HSP (prior to the commencement of work in the affected area) that details measures such as restricting personnel exposure times monitoring volatile compounds using a PID unit providing increased ventilation and using appropriate PPE (eg gas masks) as required
Notes calculated on the basis of cadastral boundaries and assuming crawl space construction ndash some properties host more than one residence whereas some have one residence across two properties andor also host a commercial premises a property survey would be required to confirm building construction details and the number of individual residences affected
80607-1 REV1 30102017 PAGE 65
EPA REF 0524111 FINAL REPORT STAGE 1 ENVIRONMENTAL ASSESSMENT THEBARTON ASSESSMENT AREA
11 CONCLUSIONS
Between May and August 2017 Fyfe undertook an investigation of groundwater and soil vapour CHC impacts within an EPA-designated Assessment Area located in Thebarton South Australia The results of the investigation have been used to assess potential vapour intrusion to indoor air risks within residential and commercialindustrial properties A CSM has been developed from the field analytical and modelling results as presented in Section 10
The following conclusions have been reached
Subsurface geological conditions are generally consistent across the Thebarton EPA Assessment Area and are dominated by the sediments (ie low to medium plasticity silty or sandy clays with variable gravel contents) of the Pooraka and Hindmarsh Clay formations While there is some potential for structural defects and coarser horizons to act as preferential pathways (lateral and vertical) for soil vapour movement no significant spatially-consistent features were identified during the recent soil drillinglogging work ndash although thin gravel lenses were present within the subsurface at some locations and a 15 m thick layer of gravel was encountered at 12 to 135 m in groundwater well MW17
Groundwater within the Q1 aquifer is located at a depth of approximately 123 to 159 m BGL and flows in a general north-westerly direction (refer to Figure 4) ndash the closest surface water receptor is the River Torrens located approximately 03 km to the east and 07 km to the north and north-west A groundwater flow velocity range of approximately 44 to 23 myear has been inferred16 and the groundwater gradient beneath the Thebarton EPA Assessment area is relatively flat (ie 000062 to 00012)
Beneficial uses for groundwater within the Q1 aquifer beneath the Thebarton EPA Assessment Area have been identified to include domestic irrigation primary contact recreationaesthetics human health in non-use scenarios (ie vapour flux as assessed by the VIRA) and possibly also potable Although freshwater ecosystem protection was also considered the River Torrens is thought to comprise either a recharge boundary (ie discharging to local groundwater) or to not actually be hydraulically connected to the Q1 aquifer in this area
Groundwater beneath parts of the Thebarton EPA Assessment Area contains detectable concentrations of various CHC and includes TCE and carbon tetrachloride (one location only) levels that exceed the adopted assessment criteria for potable use andor primary contact recreation ndash thereby indicating that groundwater would be unsuitable for drinking or the filling of swimming poolsspas In addition vapour flux could also occur during the extraction of groundwater for domestic use and in terms of aesthetic considerations the groundwater could be odorous
16 ie as calculated by Fyfe based on available data
80607-1 REV1 30102017 PAGE 67
EPA REF 0524111 FINAL REPORT STAGE 1 ENVIRONMENTAL ASSESSMENT THEBARTON ASSESSMENT AREA
The groundwater and soil vapour CHC impacts identified beneath parts of the Thebarton EPA Assessment Area are considered likely to have emanated from the former Austral sheet metal works located over multiple allotments between George and Maria Streets from the 1920s until the 1960sshy1970s The possible presence of on-going (primary andor secondary) source(s) at this property has not yet been investigated
As depicted on Figures 6 and 7 the current extent of the soil vapour CHC (ie dominated by TCE) impacts has been determined to correspond to the mapped distribution of the groundwater TCE impacts (Figure 5) and is considered to be directly related to groundwater (rather than soil) CHC impacts Although no soil vapour impacts were detected at 1 m BGL in SV11 and SV1317 located near the eastern and western ends of Light Terrace respectively the north-western extents of the groundwater and soil vapour CHC impacts have not yet been determined In addition although the extent of the groundwater TCE plume has been delineated in all other directions the soil vapour TCE plume has not been delineated in any direction
TCE is considered to be a primary contaminant as well as the dominant (ie in terms of concentration and extent) CHC in both groundwater and soil vapour ndash the presence of PCE and 11-DCE suggests however that more than one primary contaminant is present Although the detectable concentrations of 12-DCE (cis- and trans) are considered to have resulted from the breakdown of TCEPCE no VC has been detected in either groundwater or soil vapour ndash the scattered distribution and relatively low concentrations of 12-DCE as well as the absence of measurable VC have been interpreted to indicate that significant dechlorination of the primary contaminants has not occurred (despite the likely age of the plume ndash ie possibly up to about 90 years old)
Although the COPC adopted for the soil vapour assessment program included various CHC (ie with TCE identified as the dominant contaminant in groundwater and soil vapour) the Tier 1 VIRA confirmed that TCE PCE and 11-DCE all exceeded the adopted vapour intrusion HILs Based primarily on its greater toxicity however the risk driver for the Thebarton EPA Assessment Area is considered to be TCE
The VIRA (Tier 2) results for predicted indoor air concentrations of TCE within the residential portion (assuming crawl space construction) of the Thebarton EPA Assessment Area indicated that 21 (ie of approximately 130 residential properties) were predicted to have detectable levels of TCE in indoor air and that require further action as follows
― 10 properties within the investigation range (2 to lt20 microgm3)
― eight properties within the intervention range (20 to lt200 microgm3) and
― three properties within accelerated intervention range (ge200 microgm3)
All remaining residential properties in the Thebarton EPA Assessment Area are considered to be safe from soil vapour intrusion with predicted indoor air concentrations of TCE below 2 microgm3 (assuming
17 noting that the laboratory LOR for TCE was elevated as compared to the other soil vapour samples
PAGE 68 80607-1 REV1 30102017
EPA REF 0524111 FINAL REPORT STAGE 1 ENVIRONMENTAL ASSESSMENT THEBARTON ASSESSMENT AREA
crawl space construction) Based on the results of the VIRA however substantially increased risks are likely to exist should cellarsbasements be present whereas risks may be lower for slab on grade construction premises ndash refer to Table 96
Calculated vapour intrusion risks to workers within commercialindustrial properties (slab on grade construction) across at least part of the Thebarton EPA Assessment Area (ie based on the maximum soil vapour CHC concentration obtained for soil vapour bore SV3 located on Maria Street) are considered to be unacceptable Although a basementcellar is known to be present at one commercial property on George Street vapour intrusion risks to subsurface structures associated with commercialindustrial properties have not yet been assessed
Although only assessed in a qualitative manner trenchmaintenanceutility workers may be at risk in areas where TCE concentrations at 1 m BGL are greater than 100 microgm3 (or 50 times the acceptable concentration for indoor air) ndash in this case appropriate management measures would be required to be adopted This should involve the development of a site-specific HSP (prior to the commencement of work in the affected area) that details measures such as restricting personnel exposure times monitoring volatile compounds using a PID unit providing increased ventilation and using appropriate PPE (eg gas masks) as required
80607-1 REV1 30102017 PAGE 69
EPA REF 0524111 FINAL REPORT STAGE 1 ENVIRONMENTAL ASSESSMENT THEBARTON ASSESSMENT AREA
12 DATA GAPS
Based on the results obtained during the recent Fyfe investigations as well as available historical information (Appendices A and B) the following data gaps have been identified for the Thebarton EPA Assessment Area
property information assumed for the vapour intrusion modelling has not been confirmed (ie current land use (residential versus commercial) building construction type (slab crawl space presence of basements and cellars including cellarsbasements for commercial properties)
groundwater uses considered for the beneficial use assessment have not been confirmed (whether bores are registered or not)
the conclusions are based on a single sampling event meaning the understanding of temporal and spatial variation is limited for both groundwater and soil vapour and
the groundwater contamination has not been fully delineated in the hydraulically down-gradient direction (north-west) and hence the groundwater fate and transport modelling is not validated
80607-1 REV1 30102017 PAGE 71
EPA REF 0524111 FINAL REPORT STAGE 1 ENVIRONMENTAL ASSESSMENT THEBARTON ASSESSMENT AREA
13 REFERENCES
ANZECCARMCANZ (2000a) Australian Guidelines for Water Quality Monitoring and Reporting
ANZECCARMCANZ (2000b) Australian and New Zealand Guidelines for Fresh and Marine Water Quality
ASTM (2001) Standard Practice for Active Soil Gas Sampling in the Vadose Zone for Vapor Intrusion Evaluations ASTM Guide D7663-12
ASTM (2006) Standard Guide for Soil Gas Monitoring in the Vadose Zone ASTM Guide D5314-92
ATSDR (1994) Toxicological profile ndash 11-Dichloroethene httpswwwatsdrcdcgovToxProfilestpaspid=722amptid=130
AustralianNew Zealand Standard (1998) Water Quality Sampling Part 1 Guidance on the Design of Sampling Programs Sampling Techniques and the Preservation and Handling of Samples ASNZS 566711998
AustralianNew Zealand Standard (1998) Water Quality Sampling Part 11 Guidance on Sampling of Groundwaters ASNZS 5667111998
Bouwer H and Rice RC (1976) A Slug Test Method for Determining Hydraulic Conductivity of Unconfined Aquifers with Completely or Partially Penetrating Wells Water Resources Research vol 12 no 3 pp 423-428
Butler JJ Jr (1998) The Design Performance and Analysis of Slug Tests
Cooper HH Bredehoeft JD and Papadopulos SS (1967) Response of a Finite-Diameter Well to an Instantaneous Charge of Water Water Resources Research vol 3 no 1 pp 263-269
CRC CARE (2013) Petroleum Hydrocarbon Vapour Intrusion Assessment ndash Australian Guidance CRC CARE Technical Report No 23 July 2013
Dagan G (1978) A Note on Packer Slug and Recovery Tests in Unconfined Aquifers Water Resources Research vol 14 no 5 pp 929-934
Department of Environment Water and Natural Resources (DEWNR 2017) Water Connect Master Register of All Bores Primary Industries and Resources South Australia
Duffield G (2007) AQTESOLVreg Professional Version 45 Hydrosolve Inc
enHealth (2012a) Environmental Health Risk Assessment - Guidelines for assessing human health risks from environmental hazards enHealth Council
enHealth (2012b) Australian Exposure Factor Guidance Handbook enHealth Council
Environment Protection Act 1993
80607-1 REV1 30102017 PAGE 73
EPA REF 0524111 FINAL REPORT STAGE 1 ENVIRONMENTAL ASSESSMENT THEBARTON ASSESSMENT AREA
Environment Protection Regulations 2009
Friebel E and Nadebaum P (2011) Health Screening Levels for Petroleum Hydrocarbons in Soil and Groundwater CRC CARE Technical Report No 10
Gerges NZ (1999) The Geology and Hydrogeology of the Adelaide Metropolitan Area Flinders University (South Australia) PhD thesis (unpublished)
Gerges NZ (2006) Overview of the Hydrogeology of the Adelaide Metropolitan Area DWLBC Report 200610
Golder Associates (1994) Contamination Assessment George Street Thebarton SA Report to United Land dated 9 December 1994
Hvorslev MJ (1951) Time Lag and Soil Permeability in Ground-Water Observations Bulletin no 36 Waterways Exper Sta Corps of Engrs US Army Vicksburg Mississippi pp 1-50
Hyder Z Butler JJ Jr McElwee CD and Liu W (1994) Slug Tests in Partially Penetrating Wells Water Resources Research vol 30 no 11 pp 2945-2957
ITRC (2007) Vapor Intrusion Pathway - A Practical Guidance
Johnson PC and Ettinger RA (1991) Heuristic Model for Predicting the Intrusion Rate of Contaminant Vapors
into Buildings Environ Sci Technology 251445-1452
McDonald M G and Harbaugh A W (1988) A Modular Three-Dimensional Finite-Difference Ground-Water Flow Model Techniques of Water-Resources Investigations Book 6 Chapter A1 U S Geological Survey
NEPM (1999) National Environment Protection (Assessment of Site Contamination) Measure Schedules B1 to
B9 National Environment Protection Council Australia
NHMRC (2008) Guidelines for Managing Risks in Recreational Water
NHMRCNRMMC (2011) Australian Drinking Water Guidelines (as revised in 2016)
NJDEP (2013) Site Remediation Program Vapor Intrusion Technical Guidance (Version 31)
NSW DEC (2006) Guidelines for the NSW Site Auditor Scheme (2nd edition)
Payne FC Quinnan JA and Potter ST (2008) Remediation Hydraulics CRC Press Boca Raton FL
RAIS (2016) Chemical Specific Parameters for Trichloroethylene Risk Assessment Information System Office of Environmental Management US Department of Energy
REM (2005a) George St Thebarton Site ndash Stage 2 Investigations Report to Luca Group dated 26 August 2005
REM (2005b) Stage 3 Environmental Site Assessment George St Thebarton SA Report to Luca Group dated 23 November 2005
SA Department of Mines and Energy (1969) 1250000 Adelaide Geological Map Sheet Sheet S1 54-9
PAGE 74 80607-1 REV1 30102017
EPA REF 0524111 FINAL REPORT STAGE 1 ENVIRONMENTAL ASSESSMENT THEBARTON ASSESSMENT AREA
SA EPA (2007) Regulatory Monitoring and Testing Groundwater Sampling
SA EPA (2009) Guidelines for the Assessment and Remediation of Groundwater Contamination
SA EPA (2014) Clovelly Park Mitchell Park Project Management Team Assessment Program Flip Book November 2014
SA EPA (2015) Environment Protection (Water Quality) Policy
Standards Australia (1993) Geotechnical Site Investigations AS1726-1993
Standards Australia (2005) Guide to the Sampling and Investigation of Potentially Contaminated Soil Part 1 Non-Volatile and Semi-Volatile Compounds AS44821-2005
Stapledon DH (1971) Changes and Structural Defects Developed in some South Australian Clays and their Engineering Consequences Proceedings of Symposium on Soils and Earth Structures in Arid Climates Adelaide 1970
US EPA (1996) Soil Screening Guidance Technical Background Document Office of Emergency and Remedial Response Washington DC EPA540R95128
US EPA (1999) Compendium of Methods for the Determination of Toxic Organic Compounds in Ambient Air Second Edition Compendium Method TO-15 Determination Of Volatile Organic Compounds (VOCs) In Air Collected In Specially-Prepared Canisters And Analyzed By Gas Chromatography Mass Spectrometry (GCMS) EPA625R-96010b
US EPA (2002) OSWER Draft Guidance for Evaluating the Vapour Intrusion to Indoor Air Pathway from Groundwater and Soils (Subsurface Vapour Intrusion Guidance) EPA530-D-02-004
US EPA (2009) EPArsquos Risk-Screening Environmental Indicators (RSEI) Methodology Office of Pollution Prevention and Toxics Washington DC
US EPA (2011) IRIS (Integrated Risk Information System) Trichloroethylene Chemical Assessment Summary httpscfpubepagovnceairisiris_documentsdocumentssubst0199_summarypdf
US EPA (2012) EPArsquos Vapor Intrusion Database Evaluation and Characterization of Attenuation Factors for Chlorinated Volatile Organic Compounds and Residential Buildings
US EPA (2015) OSWER Technical Guide for Assessing and Mitigating the Vapour Intrusion Pathway from Subsurface Vapour Sources to Indoor Air
US EPA (2017a) Regional Screening Levels (RSLs) - Generic Tables (June 2017) httpswwwepagovriskregional-screening-levels-rsls-generic-tables-june-2017
US EPA (2017b) Regional Screening Levels for Chemical Contaminants at Superfund Sites httpwwwepagovreg3hwmdriskhumanrb-concentration_tableGeneric_Tablesindexhtm
80607-1 REV1 30102017 PAGE 75
EPA REF 0524111 FINAL REPORT STAGE 1 ENVIRONMENTAL ASSESSMENT THEBARTON ASSESSMENT AREA
WHO (2006) Air Quality Guidelines for Europe Second Edition WHO Regional Publications European Series No 91
WHO (2017) Guidelines for Drinking-water Quality Fourth edition (incorporating the first addendum)
Wiedemeier T Swanson M Moutoux D Gordon E Wilson J Wilson B Kampbell D Haas P Miller R Hansen J and Chapelle F (1998) Technical Protocol for Evaluating Natural Attenuation of Chlorinated Solvents in Ground Water National Risk Management Research Laboratory Office of Research and Development US EPA
Zheng C (1990) MT3D A Modular Three-Dimensional Transport Model for Simulation of Advection Dispersion and Chemical Reactions of Contaminants in Groundwater Systems Prepared for US EPA by Robert S Kerr Environmental Research Laboratory Ada Oklahoma developed by SS Papadopulos amp Associates Inc Rockville Maryland
PAGE 76 80607-1 REV1 30102017
EPA REF 0524111 FINAL REPORT STAGE 1 ENVIRONMENTAL ASSESSMENT THEBARTON ASSESSMENT AREA
14 STATEMENT OF LIMITATIONS
The opinions and conclusions presented in this report are specific to the conditions of the Thebarton EPA Assessment Area and the state of legislation currently enacted as at the date of this report Fyfe does not make any representation or warranty that the opinions and conclusions in this report will be applicable in the future as there may be changes in the condition of the Thebarton EPA Assessment Area applicable legislation or other factors that would affect the opinions and conclusions contained in this report
Fyfe has used the degree of skill and care ordinarily exercised by reputable members of our profession practising in the same or similar locality This report has been prepared for the South Australian Environment Protection Authority for the specific purpose identified in the report Fyfe accepts no liability or responsibility to any third party for the accuracy of any information contained in the report or any opinion or conclusion expressed in the report Neither the whole of the report nor any part or reference thereto may be in any way used relied upon or reproduced by any third party without Fyfersquos prior written approval This report must be read in its entirety including all tables and attachments
80607-1 REV1 30102017 PAGE 77
EPA REF 0524111 FINAL REPORT STAGE 1 ENVIRONMENTAL ASSESSMENT THEBARTON ASSESSMENT AREA
FIGURES
Figure 1 Site Location and Assessment Area
Figure 2 Assessment Point Locations
Figure 3 Waterloo Membrane Samplertrade TCE Concentration Plan
Figure 4 Groundwater Elevation Contour Plan
Figure 5 Groundwater Concentration Plan
Figure 6 Soil Vapour Concentration Plan (10m)
Figure 7 Soil Vapour Concentration Plan (30m)
80607-1 REV1 30102017 PAGE 79
JAM
ES CO
NG
DO
N D
RIV
E
JAM
ES CO
NG
DO
N D
RIV
E
DEW
STREET
DEW
STREET
CHAPEL STREETCHAPEL STREET
PAR
KER
STREET
PAR
KER
STREET
POR
T RO
AD
POR
T RO
AD
POR
T RO
AD
POR
T RO
AD
LIGHT TERRACELIGHT TERRACE
DEW
STREET
DEW
STREET
WA
LSH ST
WA
LSH ST
AD
MELLA
STREET
AD
MELLA
STREET
ALB
ERT STR
EETA
LBER
T STREET
HO
LLAN
D ST
REET
HO
LLAN
D ST
REET
RANDOLPH STREET
RANDOLPH STREET
JAM
ES STREET
JAM
ES STREET
DOVE STREET
DOVE STREET
SMITH STREETSMITH STREET
MARIA STREETMARIA STREET
GEORGE STREETGEORGE STREET
KINTORE STREET
KINTORE STREET
PORT ROAD
PORT ROAD
PORT ROAD
PORT ROAD
CAW
THO
RN
E STR
EETC
AWTH
OR
NE ST
REET
DEVON STREETDEVON STREET
KINTORE STREETKINTORE STREET
GOODENOUGH STREETGOODENOUGH STREET
LIVESTR
ON
G PATH
WAY
LIVESTR
ON
G PATH
WAY
CCAAWW
TTHHOO
RRNN
EE SSTTRR
EEEETT
HHOO
LLLLAANN
DD SSTT
RREEEETT
DE
DEW
SW
STREET
TREET
JJAM
EA
MES S
S STREET
TREET
DDOOVVEE SSTTRREEEETT
LLIIVVEESSTTRR
OONN
GG PPAATTHH
WWAAYY
LIGHT TERRLIGHT TERRAACECE
AD
MELLA
SA
DM
ELLA STR
EETTR
EET
CHAPEL SCHAPEL STREETTREET
AALLBB
EERRTT SSTTRR
EEEETT
GEGEORORGE SGE STREETTREET
PPOORRTT RROOAADD
PPOORRTT RROOAADD
DDEEWW
SSTTRREEEETT
MMAARRIIAA SSTTRREEEETT
JJAAMM
EESS CCOO
NNGG
DDOO
NN DD
RRIIVV
EE
WWAA
LLSSHH SSTT
SSMMIITTHH SSTTRREEEETT
RRANDOLPH S
ANDOLPH STREETTREET
PPOORR
TT RROO
AADD
PPOORR
TT RROO
AADD
KKIINNTTOORREE SSTTRREEEETT
KKIINNTTOORREE SSTTRREEEETT
PPAARR
KKEERR
SSTTRREEEETT
GGOOOODDEENNOOUUGGHH SSTTRREEEETT
DDEEVVOONN SSTTRREEEETT
ASSESSMENT AREA
CBD
750m
LEGEND
EPA ASSESSMENT AREA
CADASTRE
12500 A3
0 25 50 m
CLIENT
SA EPA
PROJECT
FIGURE 1 SITE LOCATION AND ASSESSMENT AREA
EPA THEBARTON ASSESSMENT AREA - STAGE 1
TITLE
FIGURE 1 SITE LOCATION AND ASSESSMENT AREA
PROJECT NO DATE CREATED
80607-1 290917
80607_Fig 1 - Site Location and Assessment Areaai REV 1 gt 290917
LE
VE
L 1
12
4 S
OU
TH
TE
RR
AC
E
AD
EL
AID
E S
A 5
00
0
P
H
(08
) 8
23
2 9
08
8
F
AX
(0
8)
82
32
90
99
EM
AIL
in
fo
fyfe
co
ma
u
W
EB
fy
fec
om
au
AB
N
57
00
8 1
16 1
30
JAM
ES CO
NG
DO
N D
RIV
E
JAM
ES CO
NG
DO
N D
RIV
E
DEW
STREET
DEW
STREET
CHAPEL STREETCHAPEL STREET
PAR
KER
STREET
PAR
KER
STREET
POR
T RO
AD
POR
T RO
AD
POR
T RO
AD
POR
T RO
AD
LIGHT TERRACELIGHT TERRACE
DEW
STREET
DEW
STREET
WA
LSH ST
WA
LSH ST
AD
MELLA
STREET
AD
MELLA
STREET
ALB
ERT STR
EETA
LBER
T STREET
HO
LLAN
D ST
REET
HO
LLAN
D ST
REET
RANDOLPH STREET
RANDOLPH STREET
JAM
ES STREET
JAM
ES STREET
DOVE STREET
DOVE STREET
SMITH STREETSMITH STREET
MARIA STREETMARIA STREET
GEORGE STREETGEORGE STREET
KINTORE STREET
KINTORE STREET
PORT ROAD
PORT ROAD
PORT ROAD
PORT ROAD
CAW
THO
RN
E STR
EETC
AWTH
OR
NE ST
REET
DEVON STREETDEVON STREET
KINTORE STREETKINTORE STREET
GOODENOUGH STREETGOODENOUGH STREET
LIVESTR
ON
G PATH
WAY
LIVESTR
ON
G PATH
WAY
SV1SV1
SV2SV2
SV3SV3SV4SV4
SV5SV5
SV6SV6
SV7SV7SV8SV8
SV9SV9
SV10SV10
SV11SV11SV12SV12
SV13SV13
MW1MW1
MW02MW02
MW3MW3
MW4MW4MW5MW5MW6MW6
MW7MW7
MW8MW8
MW9MW9
MW10MW10MW11MW11
MW12MW12MW13MW13
MW14MW14MW15MW15
MW16MW16
MW17MW17
MW18MW18
MW19MW19
MW20MW20
MW21MW21
MW22MW22
MW23MW23
MW24MW24
MW25MW25
MW26MW26
WMS2WMS2WMS1WMS1
WMS3WMS3WMS4WMS4WMS5WMS5
WMS6WMS6
WMS7WMS7WMS8WMS8
WMS9WMS9WMS10WMS10
WMS11WMS11
WMS12WMS12
WMS13WMS13WMS14WMS14
WMS15WMS15
WMS41WMS41
WMS40WMS40
WMS39WMS39WMS38WMS38
WMS16WMS16
WMS17WMS17
WMS18WMS18WMS19WMS19
WMS20WMS20
WMS21WMS21WMS22WMS22
WMS23WMS23WMS24WMS24
WMS25WMS25
WMS26WMS26
WMS27WMS27WMS28WMS28WMS29WMS29
WMS30WMS30
WMS31WMS31
WMS32WMS32
WMS33WMS33
WMS34WMS34
WMS35WMS35
WMS36WMS36
WMS37WMS37
WWAA
LLSSHHSSTT
SSMMIITTHH SSTTRREEEETT
RRANDOLPH S
ANDOLPH STREETTREET
PPOORR
TT RROO
AADD
PPOORR
TT RROO
AADD
CCAAWW
TTHHOO
RRNN
EE SSTTRR
EEEETT
JJAM
EA
MES S
S STREET
TREET
HHOO
LLLLAANN
DDSSTT
RREEEETT
DE
DEW
SW
STREET
TREET
DDOOVVEE SSTTRREEEETT
LLIIVVEESSTTRR
OONN
GGPPAATTHH
WWAAYY
LIGHT TERRLIGHT TERRAACECE
CHAPEL SCHAPEL STREETTREET
AALLBB
EERRTT SSTTRR
EEEETT
AD
MELLA
SA
DM
ELLA STR
EETTR
EET
GEGEORORGE SGE STREETTREET
PPOORRTT RROOAADD PPOORRTT RROOAADD
DDEEWW
SSTTRREEEETT MMAARRIIAA SSTTRREEEETT
JJAAMM
EESS CCOO
NNGG
DDOO
NN DD
RRIIVV
EE
KKIINNTTOORREE SSTTRREEEETT
KKIINNTTOORREE SSTTRREEEETT
PPAARR
KKEERR
SSTTRREEEETT
GGOOOODDEENNOOUUGGHH SSTTRREEEETT
DDEEVVOONN SSTTRREEEETT
FIGURE 2 ASSESSMENT POINT LOCATIONS
MMWW88
MW2MW244 WMS3WMS355
MW2MW255
WMS3WMS366
WMS3WMS377
WMS3WMS311
MW2MW222WMS34WMS34
MW2MW233 WMS3WMS322
WMS3WMS333
WMS2WMS277WMS2WMS299 WMS2WMS288
SSV12V12 SSVV1111 MW19MW19
MW18MW18 SSVV1133 MW2MW200 WMS3WMS300
MW2MW211 WMS2WMS255
WMS2WMS266
MW17MW17 WMS2WMS244
WMS2WMS233
WMS2WMS222 WMS2WMS211
SSVV99
SSV10V10WMS2WMS200 MW14MW14MW15MW15 WMS18WMS18
WMS19WMS19 MW16MW16
WMS13WMS13MW10MW10 WMS14WMS14MMWW1111SVSV77WMS15WMS15SSVV88WMS16WMS16
SVSV66WMS4WMS411MW13MW13 LEGENDMW12MW12
WATERLOO MEMBRANE SAMPLERTM - ROUND 1WMS17WMS17 WMS40WMS40 SSVV55 MW0MW022MW9MW9 GROUNDWATER MONITORING WELL
WMS11WMS11 WMS6WMS6 SOIL VAPOUR BORE
WATERLOO MEMBRANE SAMPLERTM - ROUND 2
SVSV22WMS8WMS8SVSVWMS12WMS12 44 WMS7WMS7 MW4MW4MMWW SVSV66 33 MW5MW5WMS3WMS388
WMS3WMS399 MW7MW7 EPA ASSESSMENT AREAWMS10WMS10 WMS9WMS9
SVSV11 CADASTRE
MW3MW3
MW1MW1 WMS3WMS3WMS4WMS4MW2MW266 WMS5WMS5 12500 A3
0 25 50 m
CLIENT
SA EPAWMS1WMS1
WMS2WMS2 PROJECT
EPA THEBARTON ASSESSMENT AREA - STAGE 1
TITLE
FIGURE 2 ASSESSMENT POINT LOCATIONS
PROJECT NO DATE CREATED
80607-1 280917
80607_Fig 2 - Assessment Point Locationsai REV 1 gt 280917
LE
VE
L 1
12
4 S
OU
TH
TE
RR
AC
E
AD
EL
AID
E S
A 5
00
0
PH
(0
8)
82
32
90
88
F
AX
(0
8)
82
32
90
99
E
MA
IL
info
fy
fec
om
au
W
EB
fy
fec
om
au
A
BN
5
7 0
08
116
13
0
JAM
ES CO
NG
DO
N D
RIV
E
JAM
ES CO
NG
DO
N D
RIV
E
DEW
STREET
DEW
STREET
CHAPEL STREETCHAPEL STREET
PAR
KER
STREET
PAR
KER
STREET
POR
T RO
AD
POR
T RO
AD
POR
T RO
AD
POR
T RO
AD
LIGHT TERRACELIGHT TERRACE
DEW
STREET
DEW
STREET
WA
LSH ST
WA
LSH ST
AD
MELLA
STREET
AD
MELLA
STREET
ALB
ERT STR
EETA
LBER
T STREET
HO
LLAN
D ST
REET
HO
LLAN
D ST
REET
RANDOLPH STREET
RANDOLPH STREET
JAM
ES STREET
JAM
ES STREET
DOVE STREET
DOVE STREET
SMITH STREETSMITH STREET
MARIA STREETMARIA STREET
GEORGE STREETGEORGE STREET
KINTORE STREET
KINTORE STREET
PORT ROAD
PORT ROAD
PORT ROAD
PORT ROAD
CAW
THO
RN
E STR
EETC
AWTH
OR
NE ST
REET
DEVON STREETDEVON STREET
KINTORE STREETKINTORE STREET
GOODENOUGH STREETGOODENOUGH STREET
LIVESTR
ON
G PATH
WAY
LIVESTR
ON
G PATH
WAY
WMS2WMS2WMS1WMS1
WMS3WMS3WMS4WMS4
WMS5WMS5
WMS6WMS6
WMS7WMS7WMS8WMS8
WMS9WMS9
WMS10WMS10
WMS11WMS11
WMS12WMS12
WMS13WMS13WMS14WMS14
WMS15WMS15 WMS41WMS41
WMS40WMS40
WMS39WMS39WMS38WMS38
WMS16WMS16
WMS17WMS17
WMS18WMS18WMS19WMS19WMS20WMS20
WMS21WMS21WMS22WMS22
WMS23WMS23WMS24WMS24
WMS25WMS25
WMS26WMS26
WMS27WMS27WMS28WMS28WMS29WMS29
WMS30WMS30
WMS31WMS31
WMS32WMS32WMS33WMS33
WMS34WMS34
WMS35WMS35
WMS36WMS36
WMS37WMS37
WWAA
LLSSHHSSTT
SSMMIITTHH SSTTRREEEETT
RRANDOLPH S
ANDOLPH STREETTREET
PPOORR
TT RROO
AADD
PPOORR
TT RROO
AADD
CCAAWW
TTHHOO
RRNN
EE SSTTRR
EEEETT
JJAM
EA
MES S
S STREET
TREET
HHOO
LLLLAANN
DDSSTT
RREEEETT
DE
DEW
SW
STREET
TREET
DDOOVVEE SSTTRREEEETT
LLIIVVEESSTTRR
OONN
GGPPAATTHH
WWAAYY
LIGHT TERRLIGHT TERRAACECE
AD
MELLA
SA
DM
ELLA STR
EETTR
EET
AALLBB
EERRTT SSTTRR
EEEETT
CHAPEL SCHAPEL STREETTREET
GEGEORORGE SGE STREETTREET
PPOORRTT RROOAADD PPOORRTT RROOAADD
DDEEWW
SSTTRREEEETT MMAARRIIAA SSTTRREEEETT
JJAAMM
EESS CCOO
NNGG
DDOO
NN DD
RRIIVV
EE
KKIINNTTOORREE SSTTRREEEETT
KKIINNTTOORREE SSTTRREEEETT
PPAARR
KKEERR
SSTTRREEEETT
GGOOOODDEENNOOUUGGHH SSTTRREEEETT
DDEEVVOONN SSTTRREEEETT
FIGURE 3 WATERLOO MEMBRANE SAMPLERTM
TCE CONCENTRATION PLAN
WMS3WMS355 TCE lt78
WMS3WMS366 TCE lt77WMS3WMS377
TCE 44
WMS3WMS311 TCE lt78
WMS34WMS34 TCE 11
WMS3WMS322WMS3WMS333 TCE lt78TCE lt79
WMS2WMS277WMS2WMS299 WMS2WMS288 TCE 64 TCE lt77 TCE lt8
WMS3WMS300 TCE lt8
WMS2WMS255
WMS2WMS266 TCE 1400(D)
WMS2WMS222 TCE 38 WMS2WMS211
TCE lt79
TCE lt78
WMS2WMS233 WMS2WMS244 TCE lt77
TCE 230
WMS2WMS200 WMS19WMS19TCE lt78 WMS18WMS18 TCE 11000
TCE 4200
WMS13WMS13 WMS14WMS14 TCE lt79
WMS4WMS411WMS15WMS15 TCE 46000WMS16WMS16 TCE 18000 LEGENDTCE lt8
TCE lt78WMS17WMS17 WATERLOO MEMBRANE SAMPLERTM - ROUND 1WMS40WMS40TCE lt79
TCE 110000 WATERLOO MEMBRANE SAMPLERTM - ROUND 2WMS11WMS11
TCE 71000WMS12WMS12 EPA ASSESSMENT AREA
CADASTRE
WMS6WMS6 TCE lt58 WMS8WMS8 WMS3WMS388 TCE 32WMS7WMS7WMS3WMS399
TCE 12000 TCE 13000 TCE 1900TCE 1300WMS9WMS9 TCE lt58 NotesWMS10WMS10
All concentrations are in μgm3 TCE lt58
D = Duplicate result
WMS3WMS3WMS4WMS4 12500 A3
LE
VE
L 1
12
4 S
OU
TH
TE
RR
AC
E
AD
EL
AID
E S
A 5
00
0
PH
(0
8)
82
32
90
88
F
AX
(0
8)
82
32
90
99
E
MA
IL
info
fy
fec
om
au
W
EB
fy
fec
om
au
A
BN
5
7 0
08
116
13
0
TCE lt57WMS5WMS5 TCE lt57 TCE lt58 0 25 50
m
CLIENT
SA EPA
WMS2WMS2 TCE lt56
WMS1WMS1 TCE lt56
PROJECT
EPA THEBARTON ASSESSMENT AREA - STAGE 1
TITLE
FIGURE 3 WATERLOO MEMBRANE SAMPLERTM
TCE CONCENTRATION PLAN
PROJECT NO DATE CREATED
80607-1 241017
80607_Fig 3 - WMS TCE Concentration Planai REV 1 gt 241017
JAM
ES CO
NG
DO
N D
RIV
E
JAM
ES CO
NG
DO
N D
RIV
E
DEW
STREET
DEW
STREET
CHAPEL STREETCHAPEL STREET
PAR
KER
STREET
PAR
KER
STREET
POR
T RO
AD
POR
T RO
AD
POR
T RO
AD
POR
T RO
AD
LIGHT TERRACELIGHT TERRACE
DEW
STREET
DEW
STREET
WA
LSH ST
WA
LSH ST
AD
MELLA
STREET
AD
MELLA
STREET
ALB
ERT STR
EETA
LBER
T STREET
HO
LLAN
D ST
REET
HO
LLAN
D ST
REET
RANDOLPH STREET
RANDOLPH STREET
JAM
ES STREET
JAM
ES STREET
DOVE STREET
DOVE STREET
SMITH STREETSMITH STREET
MARIA STREETMARIA STREET
GEORGE STREETGEORGE STREET
KINTORE STREET
KINTORE STREET
PORT ROAD
PORT ROAD
PORT ROAD
PORT ROAD
CAW
THO
RN
E STR
EETC
AWTH
OR
NE ST
REET
DEVON STREETDEVON STREET
KINTORE STREETKINTORE STREET
GOODENOUGH STREETGOODENOUGH STREET
LIVESTR
ON
G PATH
WAY
LIVESTR
ON
G PATH
WAY
MW1MW1
MW02MW02
MW3MW3
MW4MW4MW5MW5
MW6MW6
MW7MW7
MW8MW8
MW9MW9
MW10MW10MW11MW11
MW12MW12
MW13MW13
MW14MW14
MW15MW15
MW16MW16
MW17MW17
MW18MW18
MW19MW19MW20MW20
MW21MW21
MW22MW22
MW23MW23
MW24MW24
MW25MW25
MW26MW26
WWAA
LLSSHHSSTT
SSMMIITTHH SSTTRREEEETT
4
466
PPOORR
TT RROO
AADD
PPOORR
TT RROO
AADD
RRANDOLPH S
ANDOLPH STREETTREET 4455
DE
DEW
SW
STREET
TREET
JJAM
EA
MES S
S STREET
TREET
HHOO
LLLLAANN
DD SSTT
RREEEETT
CCAAWW
TTHHOO
RRNN
EE SSTTRR
EEEETT 4477
DDOOVVEE SSTTRREEEETT
4455
4488
LLIIVVEESSTTRR
OONN
GGPPAATTHH
WWAAYY
4455
LIGHT TERRLIGHT TERRAACECE
AD
MELLA
SA
DM
ELLA STR
EETTR
EET
4466
CHAPEL SCHAPEL STREETTREET
4477 AA
LLBBEERR
TT SSTTRREEEETT
4499
GR4466 OUND
FLOW DIREW
GEGEORORGE SGE STREETTREET ATER C
4488 TION
PPOORRTT RROOAADD PPOORRTT RROOAADD 55
00 DD
EEWW SSTTRR
EEEETT 4499
MMAARRIIAA SSTTRREEEETT
4477
5500
JJAAMM
EESS CCOO
NNGG
DDOO
NN DD
RRIIVV
EE
88 44
KKIINNTTOORREE SSTTRREEEETT
KKIINNTTOORREE SSTTRREEEETT
PPAARR
KKEERR
SSTTRREEEETT GGOOOODDEENNOOUUGGHH SSTTRREEEETT
5500
4499
DDEEVVOONN SSTTRREEEETT
FIGURE 4 GROUNDWATER ELEVATION CONTOUR PLAN
Groundwater SWL MMWW88 Monitoring Well (m AHD)
MW1 5011 MW2MW244
MW02 4786
MW3 484
MW2MW255 MW4 507
MW5 4833
MW6 4794
MW7 4703
MW8 4581
MW9 4728
MW10 4871
MW11 4785 MW2MW222
MW12 4689
MW13 4662
MW2MW233 MW14 4723
MW15 464
MW16 4577
MW17 4619
MW18 4538
MW19 4735
MW20 457
MW21 4531
MW22 4501
MW23 4497
MW24 4537
MW25 4469
MW26 4918
MW19MW19 MW2MW200
MW2MW211MW18MW18
MW17MW17
MW14MW14
MW15MW15
MW16MW16
MW10MW10 LEGEND MMWW1111
GROUNDWATER MONITORING WELLMW12MW12
50 INFERRED GROUNDWATER ELEVATION CONTOUR
MW13MW13
MW0MW022 INFERRED GROUNDWATER FLOW DIRECTION
EPA ASSESSMENT AREA
MW9MW9
MW5MW5 CADASTREMMWW66 MW4MW4
MW7MW7 Note This is one interpretation only Other interpretations possibleMW3MW3
12500 A3
0 25 50 m
CLIENT
SA EPA
PROJECT
EPA THEBARTON ASSESSMENT AREA - STAGE 1
TITLE
FIGURE 4 GROUNDWATER ELEVATION CONTOUR PLAN
PROJECT NO DATE CREATED
80607-1 290917
MW1MW1 MW2MW266
80607_Fig 4 - Groundwater Elevation Contour Planai REV 1 gt 290917
LE
VE
L 1
12
4 S
OU
TH
TE
RR
AC
E
AD
EL
AID
E S
A 5
00
0
PH
(0
8)
82
32
90
88
F
AX
(0
8)
82
32
90
99
E
MA
IL
info
fy
fec
om
au
W
EB
fy
fec
om
au
A
BN
5
7 0
08
116
13
0
JAM
ES CO
NG
DO
N D
RIV
E
JAM
ES CO
NG
DO
N D
RIV
E
DEW
STREET
DEW
STREET
CHAPEL STREETCHAPEL STREET
PAR
KER
STREET
PAR
KER
STREET
POR
T RO
AD
POR
T RO
AD
POR
T RO
AD
POR
T RO
AD
LIGHT TERRACELIGHT TERRACE
DEW
STREET
DEW
STREET
WA
LSH ST
WA
LSH ST
AD
MELLA
STREET
AD
MELLA
STREET
ALB
ERT STR
EETA
LBER
T STREET
HO
LLAN
D ST
REET
HO
LLAN
D ST
REET
RANDOLPH STREET
RANDOLPH STREET
JAM
ES STREET
JAM
ES STREET
DOVE STREET
DOVE STREET
SMITH STREETSMITH STREET
MARIA STREETMARIA STREET
GEORGE STREETGEORGE STREET
KINTORE STREET
KINTORE STREET
PORT ROAD
PORT ROAD
PORT ROAD
PORT ROAD
CAW
THO
RN
E STR
EETC
AWTH
OR
NE ST
REET
DEVON STREETDEVON STREET
KINTORE STREETKINTORE STREET
GOODENOUGH STREETGOODENOUGH STREET
LIVESTR
ON
G PATH
WAY
LIVESTR
ON
G PATH
WAY
MW1MW1
MW02MW02
MW3MW3
MW4MW4
MW5MW5
MW6MW6
MW7MW7
MW8MW8
MW9MW9
MW10MW10MW11MW11
MW12MW12
MW13MW13
MW14MW14
MW15MW15
MW16MW16
MW17MW17
MW18MW18
MW19MW19MW20MW20
MW21MW21
MW22MW22
MW23MW23
MW24MW24
MW25MW25
MW26MW26
WWAA
LLSSHHSSTT
SSMMIITTHH SSTTRREEEETT
ndnd
RRANDOLPH S
ANDOLPH STREETTREET
PPOORR
TTRR
OOAA
DD
PPOORR
TTRR
OOAA
DD
JJAM
EA
MES S
S STREET
TREET
HHOO
LLLLAANN
DDSSTT
RREEEETT
CCAAWW
TTHHOO
RRNN
EESSTT
RREEEETT
DE
DEW
SW
STREET
TREET
DDOOVVEE SSTTRREEEETT
LLIIVVEESSTTRR
OONN
GGPPAATTHH
WWAAYY
LIGHT TERRLIGHT TERRAACECE
AD
MELLA
SA
DM
ELLA STR
EETTR
EET
AALLBB
EERRTT SSTTRR
EEEETT
CHAPEL SCHAPEL STREETTREET
ndnd ndnd
100100
11000000
GEGEORORGE SGE STREETTREET
1010000000
PPOORRTT RROOAADD PPOORRTT RROOAADD
DDEEWW
SSTTRREEEETT
1010000000 11000000 MMAARRIIAA SSTTRREEEETT
100100
JJAAMM
EESSCC
OONN
GGDD
OONN
DDRR
IIVVEE
KKIINNTTOORREE SSTTRREEEETT ndnd
KKIINNTTOORREE SSTTRREEEETT
PPAARR
KKEERR
SSTTRREEEETT GGOOOODDEENNOOUUGGHH SSTTRREEEETT
DDEEVVOONN SSTTRREEEETT
FIGURE 5 GROUNDWATER CONCENTRATION PLAN
MW2MW244
MMWW88 TCE lt1
PCE lt1
11-DCE lt1TCE lt1
12-DCE lt1PCE lt1
11-DCE lt1MW2MW255 12-DCE lt1
TCE 2
PCE lt1
11-DCE lt1
12-DCE lt1
MW2MW222 TCE lt1
PCE lt1
11-DCE lt1MW2MW233 12-DCE lt1
TCE 21
PCE lt1
11-DCE lt1
12-DCE lt1
MW19MW19 TCE lt1
MW2MW200 TCE 70 PCE lt1MW2MW211 PCE lt1MW18MW18 11-DCE lt1
TCE 23 11-DCE lt1TCE 5 12-DCE lt1 PCE lt1 12-DCE lt1PCE lt1 11-DCE lt1
11-DCE lt1 12-DCE lt1
12-DCE lt1
MW17MW17 LEGENDTCE 24 MW14MW14
PCE lt1 TCE 1100 lt1 MW15MW15 GROUNDWATER MONITORING WELL11-DCE PCE lt1
12-DCE lt1 TCE 180 11-DCE 2MW16MW16 100 INFERRED TCE GROUNDWATERPCE lt1 12-DCE 4 CONCENTRATION CONTOURSTCE lt1 11-DCE lt1 PCE lt1 12-DCE lt1 11-DCE lt1
12-DCE lt1 MMWW1111
EPA ASSESSMENT AREAMW10MW10
TCE lt1 CADASTREMW12MW12 TCE lt14900 PCE
lt1 11-DCE lt1TCE 700 PCEMW13MW13 12-DCE lt1 TCE CONCENTRATIONS (μgL)lt1 11-DCE 7PCE
TCE lt1 lt1 12-DCE 511-DCE gtnd to lt100 100 to lt1000 1000 to lt10000
MW0MW022PCE lt1 12-DCE lt1 2100011-DCE lt1 MW9MW9 TCE
PCE lt112-DCE lt1 TCE 2(D) 11-DCE 15PCE lt1 MW5MW5
10000 to 29000
nd = non-detect (lt1)12-DCE 4511-DCE lt1 MMWW66 TCE 29000 MW4MW4 12-DCE lt1
PCE 3 TCE lt1 NotesTCE 29 11-DCE 6MW7MW7 PCE lt1PCE lt1 This is one interpretation only Other interpretations possible12-DCE 23TCE lt1 11-DCE lt111-DCE lt1 All concentrations are in μgL
12-DCE includes cis and trans PCE lt1 MW3MW3 12-DCE lt112-DCE lt1 11-DCE lt1
TCE 69 D = Duplicate result12-DCE lt1 PCE lt1
11-DCE lt1
12-DCE lt1 MW1MW1
12500 A3MW2MW266 TCE lt1
TCE 2 PCE lt1
PCE lt1 11-DCE lt1
11-DCE lt1 12-DCE lt1
12-DCE lt1
LE
VE
L 1
12
4 S
OU
TH
TE
RR
AC
E
AD
EL
AID
E S
A 5
00
0
PH
(0
8)
82
32
90
88
F
AX
(0
8)
82
32
90
99
E
MA
IL
info
fy
fec
om
au
W
EB
fy
fec
om
au
A
BN
5
7 0
08
116
13
0
0 25 50 m
CLIENT
SA EPA
PROJECT
EPA THEBARTON ASSESSMENT AREA - STAGE 1
TITLE
FIGURE 5 GROUNDWATER CONCENTRATION PLAN
PROJECT NO DATE CREATED
80607-1 280917
80607_Fig 5 - Groundwater TCE Concentration Plan r2ai REV 2 gt 280917
JAM
ES CO
NG
DO
N D
RIV
E
JAM
ES CO
NG
DO
N D
RIV
E
DEW
STREET
DEW
STREET
CHAPEL STREETCHAPEL STREET
PAR
KER
STREET
PAR
KER
STREET
POR
T RO
AD
POR
T RO
AD
POR
T RO
AD
POR
T RO
AD
LIGHT TERRACELIGHT TERRACE
DEW
STREET
DEW
STREET
WA
LSH ST
WA
LSH ST
AD
MELLA
STREET
AD
MELLA
STREET
ALB
ERT STR
EETA
LBER
T STREET
HO
LLAN
D ST
REET
HO
LLAN
D ST
REET
RANDOLPH STREET
RANDOLPH STREET
JAM
ES STREET
JAM
ES STREET
DOVE STREET
DOVE STREET
SMITH STREETSMITH STREET
MARIA STREETMARIA STREET
GEORGE STREETGEORGE STREET
KINTORE STREET
KINTORE STREET
PORT ROAD
PORT ROAD
PORT ROAD
PORT ROAD
CAW
THO
RN
E STR
EETC
AWTH
OR
NE ST
REET
DEVON STREETDEVON STREET
KINTORE STREETKINTORE STREET
GOODENOUGH STREETGOODENOUGH STREET
LIVESTR
ON
G PATH
WAY
LIVESTR
ON
G PATH
WAY
SV1SV1
SV2SV2SV3SV3SV4SV4
SV5SV5
SV7SV7SV8SV8
SV9SV9
SV10SV10
SV11SV11SV12SV12
SV13SV13
SV6SV6
WWAA
LLSSHHSSTT
SSMMIITTHH SSTTRREEEETT
RRANDOLPH S
ANDOLPH STREETTREET
PPOORR
TTRR
OOAA
DD
PPOORR
TTRR
OOAA
DD
CCAAWW
TTHHOO
RRNN
EESSTT
RREEEETT
HHOO
LLLLAANN
DDSSTT
RREEEETT
JJAM
EA
MES S
S STREET
TREET
DE
DEW
SW
STREET
TREET
DDOOVVEE SSTTRREEEETT
00
LLIIVVEESSTTRR
OONN
GGPPAATTHH
WWAAYY
LIGHT TERRLIGHT TERRAACECE
AD
MELLA
SA
DM
ELLA STR
EETTR
EET
CHAPEL SCHAPEL STREETTREET
00
AALLBB
EERRTT SSTTRR
EEEETT
1010
GEGEORORGE SGE STREETTREET
000000
PPOORRTT RROOAADD
100100000
000
1010
PPOORRTT RROOAADD
000000
DDEEWW
SSTTRREEEETT MMAARRIIAA SSTTRREEEETT
JJAAMM
EESSCC
OONN
GGDD
OONN
DDRR
IIVVEE
KKIINNTTOORREE SSTTRREEEETT 00
KKIINNTTOORREE SSTTRREEEETT
PPAARR
KKEERR
SSTTRREEEETT GGOOOODDEENNOOUUGGHH SSTTRREEEETT
DDEEVVOONN SSTTRREEEETT
FIGURE 6 SOIL VAPOUR CONCENTRATION PLAN (10m)
SSVV1111 SSV12V12 TCE lt18
SSVV1133 TCE 16
PCE lt54 TCE lt21
11-DCE lt29 PCE lt25
12-DCE lt39 11-DCE lt14
12-DCE lt18
PCE lt22
11-DCE lt12
12-DCE lt16
TCE 170
PCE lt54
11-DCE lt3
12-DCE lt39 LEGEND SSVV99
SSV10V10 SOIL VAPOUR BORE
TCE lt21 0 INFERRED TCE SOIL VAPOUR CONTOUR PCE lt25
TCE 2200011-DCE lt14 EPA ASSESSMENT AREA
PCE 1912-DCE lt18
11-DCE lt27 CADASTRE
12-DCE lt37 SVSV66SVSV77
SSVV88 TCE 22000
TCE 2300 PCE 12 SOIL VAPOUR TCE CONCENTRATIONS (μgmsup3)TCE 100000 PCE 62 11-DCE lt29PCE 84 0 to lt10000SSVV55lt2711-DCE 12-DCE lt2911-DCE lt33 10000 to lt100000
100000 to 210000 12-DCE lt36 12-DCE lt44
TCE 17000 SVSV44 SVSV22SVSV33 NotePCE 31 TCE 51000TCE 210000 This is one interpretation only Other interpretations possible11-DCE lt14 PCE 39PCE 650012-DCE lt18 39 Estimated extent of plume has utilised groundwater11-DCE11-DCE 5900 12-DCE 21 concentration data12-DCE lt71
SVSV11 All concentrations are in (μgmsup3)
TCE 6300(LD) 12-DCE includes cis and trans PCE 78 LD = Laboratory duplicate result 11-DCE lt29
12-DCE lt38
12500 A3
0 25 50 m
CLIENT
SA EPA
PROJECT
EPA THEBARTON ASSESSMENT AREA - STAGE 1
TITLE
FIGURE 6 SOIL VAPOUR CONCENTRATION PLAN (10m)
PROJECT NO DATE CREATED
80607-1 290917
80607_Fig 6 - Soil Vapour TCE Concentration Plan - 1mai REV 2 gt 290917
LE
VE
L 1
12
4 S
OU
TH
TE
RR
AC
E
AD
EL
AID
E S
A 5
00
0
PH
(0
8)
82
32
90
88
F
AX
(0
8)
82
32
90
99
E
MA
IL
info
fy
fec
om
au
W
EB
fy
fec
om
au
A
BN
5
7 0
08
116
13
0
JAM
ES CO
NG
DO
N D
RIV
E
JAM
ES CO
NG
DO
N D
RIV
E
DEW
STREET
DEW
STREET
CHAPEL STREETCHAPEL STREET
PAR
KER
STREET
PAR
KER
STREET
POR
T RO
AD
POR
T RO
AD
POR
T RO
AD
POR
T RO
AD
LIGHT TERRACELIGHT TERRACE
DEW
STREET
DEW
STREET
WA
LSH ST
WA
LSH ST
AD
MELLA
STREET
AD
MELLA
STREET
ALB
ERT STR
EETA
LBER
T STREET
HO
LLAN
D ST
REET
HO
LLAN
D ST
REET
RANDOLPH STREET
RANDOLPH STREET
JAM
ES STREET
JAM
ES STREET
DOVE STREET
DOVE STREET
SMITH STREETSMITH STREET
MARIA STREETMARIA STREET
GEORGE STREETGEORGE STREET
KINTORE STREET
KINTORE STREET
PORT ROAD
PORT ROAD
PORT ROAD
PORT ROAD
CAW
THO
RN
E STR
EETC
AWTH
OR
NE ST
REET
DEVON STREETDEVON STREET
KINTORE STREETKINTORE STREET
GOODENOUGH STREETGOODENOUGH STREET
LIVESTR
ON
G PATH
WAY
LIVESTR
ON
G PATH
WAY
SV1SV1
SV2SV2SV3SV3SV4SV4
SV5SV5
SV7SV7SV8SV8
SV9SV9
SV10SV10
SV12SV12
SV6SV6
WWAA
LLSSHHSSTT
SSMMIITTHH SSTTRREEEETT
RRANDOLPH S
ANDOLPH STREETTREET
PPOORR
TTRR
OOAA
DD
PPOORR
TTRR
OOAA
DD
CCAAWW
TTHHOO
RRNN
EESSTT
RREEEETT
HHOO
LLLLAANN
DDSSTT
RREEEETT
DE
DEW
SW
STREET
TREET
JJAM
EA
MES S
S STREET
TREET
DDOOVVEE SSTTRREEEETT
00
LIGHT TERRLIGHT TERRAACECE
LLIIVVEESSTTRR
OONN
GGPPAATTHH
WWAAYY
AD
MELLA
SA
DM
ELLA STR
EETTR
EET
CHAPEL SCHAPEL STREETTREET
00
1010000000
AALLBB
EERRTT SSTTRR
EEEETT
100100 000
000 GEGEORORGE SGE STREETTREET
PPOORRTT RROOAADD 11000000000
000 PPOORRTT RROOAADD
DDEEWW
SSTTRREEEETT MMAARRIIAA SSTTRREEEETT
100100000000
JJAAMM
EESSCC
OONN
GGDD
OONN
DDRR
IIVVEE
1010000000
KKIINNTTOORREE SSTTRREEEETT
00
KKIINNTTOORREE SSTTRREEEETT
PPAARR
KKEERR
SSTTRREEEETT GGOOOODDEENNOOUUGGHH SSTTRREEEETT
DDEEVVOONN SSTTRREEEETT
FIGURE 7 SOIL VAPOUR CONCENTRATION PLAN (30m)
SSV12V12 TCE 55
PCE lt45
11-DCE lt24
12-DCE lt32
TCE 260
PCE lt51
11-DCE lt28
12-DCE
SSVV99
lt37 LEGEND
SSV10V10 SOIL VAPOUR BORE
TCE 51 0 INFERRED TCE SOIL VAPOUR CONTOURPCE lt53
TCE 11000011-DCE lt29
EPA ASSESSMENT AREAPCE lt13012-DCE lt39
11-DCE lt69
CADASTRE12-DCE lt92 SVSV66SVSV77
SSVV88 TCE 150000
TCE 14000 56 SOIL VAPOUR TCE CONCENTRATIONS (μgmsup3)PCETCE 160000 PCE 19 11-DCE lt30PCE 310 0 to lt10000SSVV5511-DCE lt26 12-DCE lt3911-DCE 33 10000 to lt100000
100000 to lt1000000 1000000
12-DCE lt35 12-DCE 20
TCE 43000 SVSV44 SVSV22SVSV33 NotePCE 90 TCE 940000(FD)TCE 1000000 This is one interpretation only Other interpretations possible11-DCE lt15 PCE 15000PCE 1500012-DCE 30 14000 Estimated extent of plume has utilised groundwater11-DCE11-DCE 14000 12-DCE lt930 concentration data12-DCE lt930
All concentrations are in (μgmsup3) 12-DCE includes cis and trans
SVSV11 TCE 21000
FD = Field Duplicate resultPCE 21
11-DCE lt57
12-DCE lt76
12500 A3
0 25 50 m
CLIENT
SA EPA
PROJECT
EPA THEBARTON ASSESSMENT AREA - STAGE 1
TITLE
FIGURE 7 SOIL VAPOUR CONCENTRATION PLAN (30m)
PROJECT NO DATE CREATED
80607-1 290917
80607_Fig 7 - Soil Vapour TCE Concentration Plan - 3m r2ai REV 2 gt 290917
LE
VE
L 1
12
4 S
OU
TH
TE
RR
AC
E
AD
EL
AID
E S
A 5
00
0
PH
(0
8)
82
32
90
88
F
AX
(0
8)
82
32
90
99
E
MA
IL
info
fy
fec
om
au
W
EB
fy
fec
om
au
A
BN
5
7 0
08
116
13
0
- THEBARTON ASSESSMENT AREA STAGE 1 ENVIRONMENTAL ASSESSMENT FINAL REPORT | EPA REF 0524111 30 OCTOBER 2017 VOLUME 1 REPORT13
- This report is formatted to print Double Sided
- TITLE PAGE13
- CONTENTS13
- LIST OF ACRONYMS13
- EXECUTIVE SUMMARY13
- 1 INTRODUCTION
-
- 11 Purpose
- 12 General background information
- 13 Definition of the assessment area
- 14 Identification of contaminants of potential concern
- 15 Objectives
-
- 2 CHARACTERISATION OF THE ASSESSMENT AREA
-
- 21 Site identification
- 22 Regional geology and hydrogeology
- 23 Data quality objectives
-
- 3 SCOPE OF WORK
-
- 31 Preliminary work
- 32 Field investigation and laboratory analysis program
- 33 Data interpretation
-
- 4 METHODOLOGY
-
- 41 Field methodologies
- 42 Laboratory analysis
-
- 5 QUALITY ASSURANCE AND QUALITY CONTROL
-
- 51 Field QAQC
- 52 Laboratory QAQC
- 53 QAQC summary
-
- 6 ASSESSMENT CRITERIA
-
- 61 Groundwater
- 62 Soil vapour
-
- 7 RESULTS
-
- 71 Surface and sub surface soil conditions
- 72 Waterloo Membrane Samplerstrade
- 73 Groundwater
- 74 Soil vapour bores
-
- 8 GROUNDWATER FATE AND TRANSPORT MODELLING
-
- 81 Groundwater flow modelling
- 82 Solute transport modelling
-
- 9 VAPOUR INTRUSION RISK ASSESSMENT
-
- 91 Objective
- 92 Areas of interest
- 93 Risk assessment approach
- 94 Tier 1 assessment
- 95 Tier 2 assessment
- 96 Conclusions
-
- 10 CONCEPTUAL SITE MODEL
- 11 CONCLUSIONS
- 12 DATA GAPS
- 13 REFERENCES
- 14 STATEMENT OF LIMITATIONS
- FIGURES13
- FIGURE 1 SITE LOCATION AND ASSESSMENT AREA
- FIGURE 2 ASSESSMENT POINT LOCATIONS
- FIGURE 3 WATERLOO MEMBRANE SAMPLERTM TCE CONCENTRATION PLAN13
- FIGURE 4 GROUNDWATER ELEVATION CONTOUR PLAN
- FIGURE 5 GROUNDWATER CONCENTRATION PLAN
- FIGURE 6 SOIL VAPOUR CONCENTRATION PLAN (10m)
- FIGURE 7 SOIL VAPOUR CONCENTRATION PLAN (30m)
-