Forces Causing Future Development Demographics Income & Wealth Tastes.

The World Wealth & Income Database
(WID, www.wid.world)
Thomas Piketty LSE, October 28 2015

The World Wealth & Income Database (WID): four components
• 1. Top income shares (World Top Incomes Database, since january 2011) • 2. Wealth-income ratios & structure of capital assets (WID, november 2015) • 3. Top wealth shares • 4. Full distribution of income and wealth by
percentile, age and gender (Distributional national accounts)
(WID, 2016-2017)

• Combines income tax data (top income numerator) and
national accounts date (total income denominator) in order to compute long-run series on top income shares
• Follows and extends Kuznets 1953, who contructed top
income shares for the US over 1913-1948 period
• World Top Incomes Database created in januery 2011; relatively large impact on global inequality debate
• We now cover many more countries: over 90 researchers
covering nealy 70 countries (about 30 countries already in database, 40 others are under construction)
1. Top income shares


25%
30%
35%
40%
45%
50%
1910 1920 1930 1940 1950 1960 1970 1980 1990 2000 2010
Sha
re o
f top
dec
ile in
nat
iona
l inc
ome
The top decile share in U.S. national income dropped from 45-50% in the 1910s-1920s to less than 35% in the 1950s (this is the fall documented by Kuznets); it then rose from less than 35% in the 1970s to 45-50% in the 2000s-2010s.
Sources and series: see
Figure I.1. Income inequality in the United States, 1910-2012
Share of top decile in total income (including capital gains)
Excluding capital gains

25%
30%
35%
40%
45%
50%
1900 1910 1920 1930 1940 1950 1960 1970 1980 1990 2000 2010
Share
of to
p inco
me d
eci
le in t
ota
l pre
tax
inco
me (
dece
nnia
l ave
rages)
The share of total income accruing to top decile income holders was higher in Europe than in the U.S. around 1900-1910; it is a lot higher in the U.S. than in Europe around 2000-2010.
Sources and series: see piketty.pse.ens.fr/capital21c (fig.9,8)
Figure 1. Income inequality: Europe and the U.S., 1900-2010
Top 10% income share: Europe
Top 10% income share: U.S.

25%
30%
35%
40%
45%
50%
1900 1910 1920 1930 1940 1950 1960 1970 1980 1990 2000 2010
Shar
e of
top
deci
le in
tota
l inc
ome
The top decile income share was higher in Europe than in the U.S. in 1900-1910; it is a lot higher in the U.S. in 2000-2010. Sources and series: see piketty.pse.ens.fr/capital21c.
Top 10% Income Share: Europe, U.S. and Japan, 1900-2010
U.S.
Europe
Japan

• The rise in US inequality in recent decades is mostly
due to rising inequality of labor income • It is due to a mixture of reasons: changing supply and
demand for skills; race between education and technology; globalization; more unequal to access to skills in the US (rising tuitions, insufficient public investment); unprecedented rise of top managerial compensation in the US (changing incentives, cuts in top income tax rates); falling minimum wage in the US
institutions and policies matter


• Combines national wealth data (national balance sheets
describing assets and liabilities owned by private individuals, governement, corporations, rest of the world) and national income data in order to compute series on wealth-income ratios & the structure of capital assets
• Follows and extends Goldsmith 1985, who first collected
historical national balance sheets • First version of WID to be released in november 2015 covering
about 20 countries; extension of Piketty-Zucman 2014 wealth-income database (core database used in Capital in the 21st century, together with WTID)
2. Wealth-income ratios & structure of capital assets


100%
200%
300%
400%
500%
600%
700%
800%
1970 1975 1980 1985 1990 1995 2000 2005 2010
Val
ue o
f priv
ate
capi
tal (
% o
f nat
iona
l inc
ome)
Private capital almost reached 8 years of national income in Spain at the end of the 2000s (ie. one more year than Japan in 1990). Sources and series: see piketty.pse.ens.fr/capital21c.
Figure S5.2. Private capital in rich countries: from the Japanese to the Spanish bubble
U.S.A Japan
Germany France
U.K. Italy
Canada Australia
Spain


Capital & inequality in America • Inequality in America = a different structure as in Europe:
more egalitarian in some ways, more inegalitarian in others • The New World in the 19th century: the land of opportunity
(capital accumulated in the past matters less than in Europe; perpetual pop. growth as a way to reduce the level of inherited wealth and wealth concentration)… and also the land of slavery: extreme form of property relation
• Northern US were in many ways more egalitarian than Old Europe; but Southern US were more inegalitarian
• We still have the same ambiguous relationship of America with inequality today: in some ways more merit-based; in other ways more violent (« meritocratic extremism »)


Capital & inequality in Germany • Lower market values of capital assets in Germany: lower real
estate prices, and lower stock market cap of corporations • Stakeholder capitalism: shareholders have to share power
with worker representatives, regional govt, etc., so that the market value is much less than book value of corporation
• This can be an efficient way to involve workers in firm strategy • 50% of board members are worker representatives in
Germany; 30% in Sweden; 10% in France (since 2014) • This clearly illustrates that market and social values of capital
can differ; property relations are socially, legally and historically determined


• Combines income tax data (income capitalization method),
inheritance tax data (mortality multiplier method), and other available data sources on wealth (including billionaire rankings and household wealth surveys)
• Follows and extends Atkinson-Harrison 1978, who combine
all these sources to study UK top income shares 1920-1975 • Continuation of Saez-Zucman 2014 US • Lack of transparency about wealth measurement. Need to
reconcile all the different data sources in a transparent way.
3. Top wealth shares


• The final objective of WID is to combine all previous data
sources in order to produce series on full distribution (from bottom to top percentiles) of income and wealth, broken down by age and gender, consistent with national income and wealth accounts: « Distributional national accounts »
• WID project developed under joint supervision of F. Alvaredo (PSE), T. Atkinson (Oxford & LSE), T. Piketty (PSE & LSE), E. Saez (Berkeley), G. Zucman (Berkeley), co-financed by PSE, ERC, Ford Foundation, INET, CEG, etc.
4. Full distribution of income and wealth by percentile, age and gender

1.00
1.10
1.20
1.30
1.40
1.50
1.60
1.70
1.80
25 30 35 40 45 50 55 60 65
Gender gap: ratio average labor income men/women labor by age (entire population, incl. non participants), France 2010

1.00
1.50
2.00
2.50
3.00
3.50
4.00
4.50
25 30 35 40 45 50 55 60 65
Gender gap: ratio average labor income men/women labor by age (entire population, incl. non participants), France 1970-2010
1970
1975
1984
1990
1997
2000
2006
2010
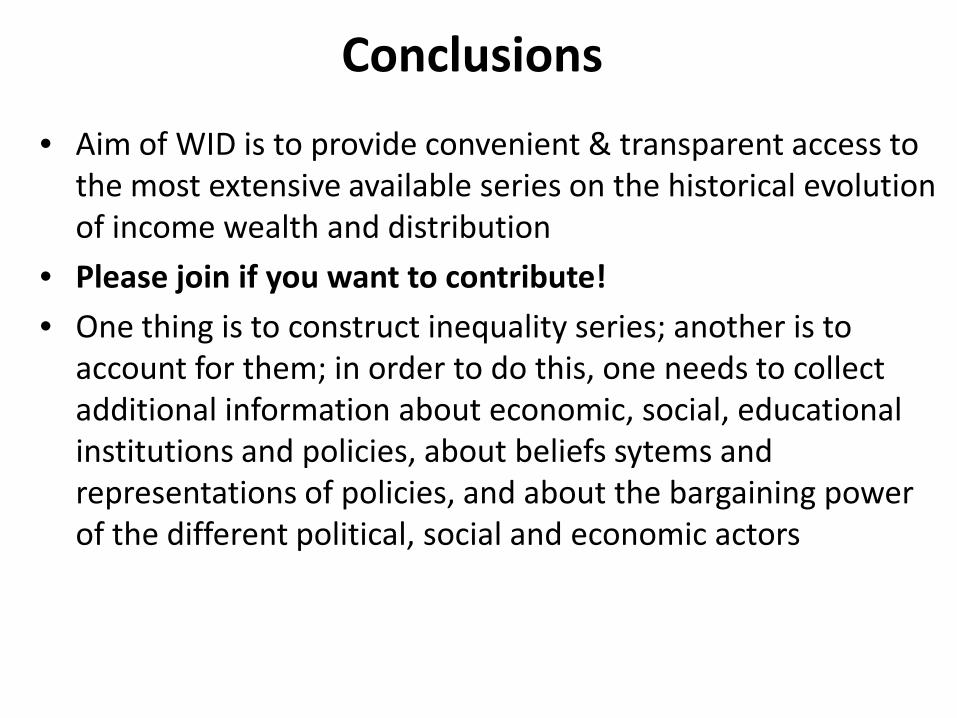
Conclusions • Aim of WID is to provide convenient & transparent access to
the most extensive available series on the historical evolution of income wealth and distribution
• Please join if you want to contribute! • One thing is to construct inequality series; another is to
account for them; in order to do this, one needs to collect additional information about economic, social, educational institutions and policies, about beliefs sytems and representations of policies, and about the bargaining power of the different political, social and economic actors