
The Vigileo monitor by Edwards Lifesciences supports both
21
1
Transcript of The Vigileo monitor by Edwards Lifesciences supports both

1

2

The Vigileo monitor by Edwards Lifesciences supports both the FloTrac Sensor for continuous cardiac output and the Edwards PreSep oximetry catheter for continuous central venous oximetry (ScvO2)
3

The Vigileo monitor continuously displays and updates Continuous Cardiac Output, Cardiac Index, Stroke Volume, Stroke Volume Index, Systemic Vascular Resistance*, Systemic Vascular Resistance Index*, and Stroke Volume Variation every 20 seconds when used with the FloTrac Sensor. DO2 and DO2I are also available for manual calculation.** These parameters help guide the clinician in optimizing stroke volume through precision guided management of preload, afterload, and contractility.
Vascular tone = vessel compliance and resistance
The Vigileo monitor then helps identify the adequacy of cardiac output by monitoring central venous (ScvO2) or mixed venous (SvO2) oxygen saturation when used with Edwards venous oximetry technologies.y g
* These parameters require the CVP value to be slaved from bedside monitor for continuous monitoring. SVR/SVRI can also be assessed on the Derived Value Calculator for intermittent calculations using either slaved or manually entered MAP, CVP, and CO values.
4
**These parameters require the SpO2 and PaO2 values to be manually entered. If CO is being continuously monitored, the calculator will default to the existing CO value. Otherwise, the user may override the continuous value to manually enter CO.

The Vigileo monitor uses the patient’s arterial pressure waveform to continuously measure cardiac output. With inputs of height, weight, age and gender, patient-specific vascular compliance is determined.
The FloTrac Sensor measures the variations of the arterial pressure which is proportional to stroke volume. Vascular compliance and changes in vascular resistance are internally compensated for.
Cardiac output is displayed on a continuous basis by multiplying the pulse rate and calculated stroke volume as determined from the pressure waveform.
The FloTrac Sensor is easily setup and calibrated at the bedside using the familiar skills sed in press re monitoringskills used in pressure monitoring.
5

6

In a normal individual who is breathing spontaneously, blood pressure decreases on inspiration. The range of normal peak decreases in systolic pressure have been reported between 5 – 10 mmHg.
The exaggeration of this phenomenon, called pulsus paradoxus, was initially reported by Adolf Kussmal in constrictive pericarditis and was described as a “pulse disappearing during inspiration and returning during expiration” despite the continued presence of the cardiac activity during both respiratory phases.
Michard F. Changes in Arterial Pressure During Mechanical Ventilation. Anesthesiology 2005; 103:419-28.Swami A. Pulsus Paradoxus in Cardiac Tamponade: A Pathophysiologic Continuum Clinical Cardiology 2003; 26 215-217Continuum, Clinical Cardiology 2003; 26, 215 217
7

A phenomenon that is the reverse of the conventional pulsus paradoxus has been reported during positive pressure breathing.
The inspiratory increase in arterial blood pressure followed by a decrease on expiration has been called at different times:• Reversed pulsus paradoxus
Paradoxical pulsus paradoxus• Paradoxical pulsus paradoxus• Respirator paradox• Systolic pressure variation (SPV)• Pulse pressure variation
At least 12 peer reviewed English language studies have demonstrated theAt least 12 peer-reviewed English-language studies have demonstrated the usefulness of the respiratory variation in arterial pressure (or its surrogates) in answering a crucial clinical question; “Can we improve cardiac output and hence hemodynamics by giving fluid?”
Michard F. Changes in Arterial Pressure During Mechanical Ventilation. Anesthesiology 2005; 103:419 28
8
Anesthesiology 2005; 103:419-28.

Mechanical ventilation induces cyclic changes in vena cava blood flow, pulmonary artery blood flow, and aortic blood flow. At the bedside, respiratory changes in aortic blood flow are reflected by “swings” in blood pressure whose magnitude is highly dependent on volume status. (Michard)
The left ventricular stroke volume increases during inspiration because left ventricular preload increases while left ventricular afterload decreases. In contrast, the right ventricular stroke volume decreases during inspiration because right ventricular preload decreasesstroke volume decreases during inspiration because right ventricular preload decreases while right ventricular afterload increases. Because of the long (approximately 2 sec) pulmonary transit time of blood, the inspiratory decrease in right ventricular filling and output only a few heartbeats later, i.e., usually during the expiratory period. (Michard)
In healthy patients undergoing neurosurgery, a SVV value of 9.5% was found to predict a positive (=5%) increase in stroke volume in response to only 100ml of plasma expander
ith 79% iti it d 93% ifi it (B k t dt)with a 79% sensitivity and 93% specificity. (Berkenstadt)
Currently, the majority of clinical literature supports the use of SVV in patients who are only mechanically ventilated.
9

The above equation is the conventional method by which SVV is calculated. The difference between the maximum and minimum stroke volumes within a given time are divided by the mean of the maximum and minimum SVs. The SVV is displayed as a percent value.
10

These two studies demonstrate that SVV has a high sensitivity and specificity in determining if a patient will respond (increasing stroke volume) when giving additional volume. This is referred to as “preload responsiveness”.
SVV values used to guide preload responsiveness have varied between 10 and 15%.
Using SVV allows us to answer the question “Can we use fluid to improve hemodynamics?”
11

The above case is an exploratory laparotomy with tumor removal. The FloTrac Sensor was used in addition to traditional vital signs.
The patient experienced a sudden loss of blood during the procedure and was volume resuscitated (packed red blood cells and Normal Saline). SVV was used as a guide for starting and stopping volume resuscitation at the points shown by the arrows. The following slides demonstrate the patient’s response to resuscitation at the point highlighted by the second arrow above.
12
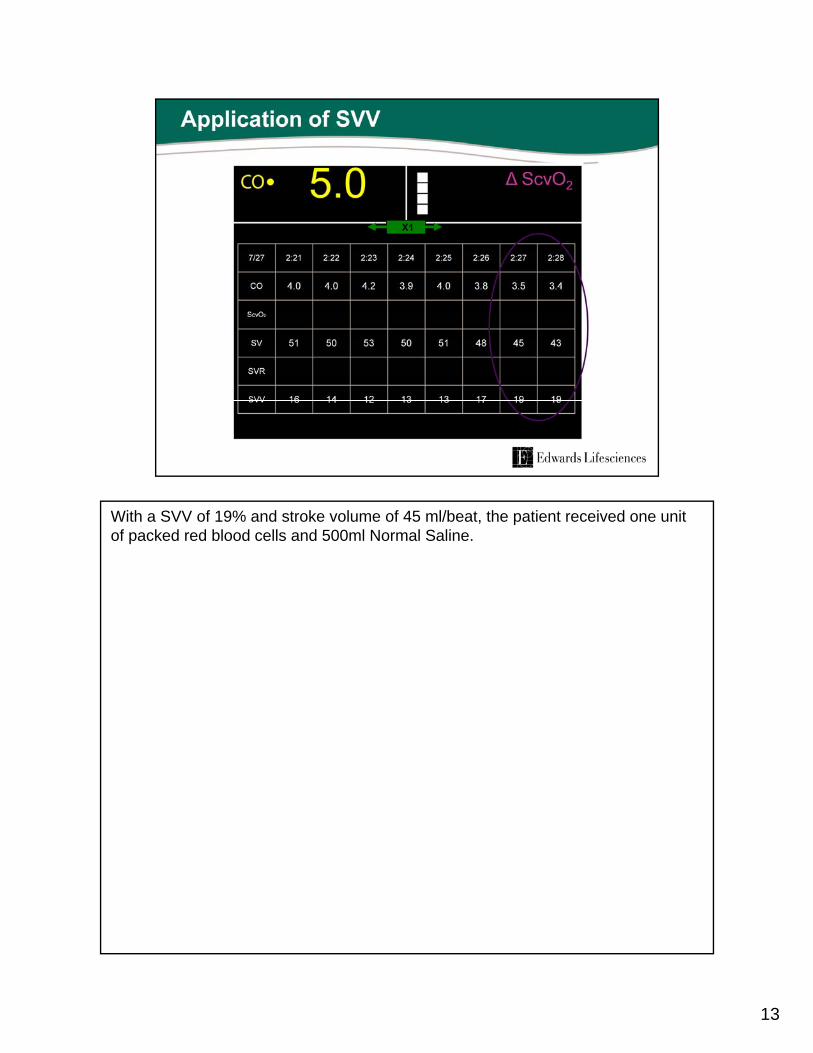
With a SVV of 19% and stroke volume of 45 ml/beat, the patient received one unit of packed red blood cells and 500ml Normal Saline.
13

After resuscitation the SVV decreased to between 9 - 6% with a Stroke Volume increase to approximately 60 ml/beat. One aberrant reading of 25% (at 2:32 p) was due to an arrhythmia.
14

As displayed in the numerical trend screen, the graphical trend screen also shows an increase in cardiac output in response to volume resuscitation.
15

Although a powerful tool managing your patients volume resuscitation, SVV has limitations. Mechanical Ventilation:Current literature supports the use of SVV on patients who are 100% mechanically (control mode) ventilated with tidal volumes of more than 8cc/kg and fixed respiratory rates.Spontaneous Ventilation:Spontaneous Ventilation:Currently, literature does not support the use of SVV with patients who are spontaneously breathing. Spontaneous breaths uses negative pressure ventilation with small, varying tidal volumes.Arrhythmias:Arrhythmias can dramatically affect SVV. Thus, SVVs utility as a guide for volume res scitation is greatest in absence of arrh thmiasresuscitation is greatest in absence of arrhythmias.SVR:The effects of vasodilatation therapy on SVV should be considered before treatment with additional volume
16

The deleterious hemodynamic effects of PEEP are caused by an increase in pleural pressure (reducing right ventricular filling) and an increase in Transpulmonary pressure (increasing right ventricular afterload).
When cardiac output decreases with PEEP the arterial pressure variation increases.If PEEP des not affect cardiac output the arterial pressure variation is similarly unaffected by PEEPunaffected by PEEP.
The arterial pressure waveform analysis is useful to predict and prevent the deleterious effects of PEEP in mechanical ventilation.
Michard F. Changes in Arterial Pressure During Mechanical Ventilation. Anesthesiology 2005; 103:419-28.
17

Edwards Vigileo monitor when used with the FloTrac Sensor, easily measures and displays SVV at the bedside.SVV is a very reliable indicator of the patients preload responsiveness with a high sensitivity and specificity
When used within its limitations, it is a powerful tool that can correctly answer that important questionimportant question…..“Can we use fluid to improve hemodynamics”
18

19

20

21


![Edwards EV1000 Clinical Platform - Edwards Lifesciencesht.edwards.com/ccfiles/AR06594_ EV1000_V1 2_SET-UP_PRES [Recovered].pdfThe EV1000 clinical platform from Edwards Lifesciences](https://static.fdocuments.net/doc/165x107/5e3a4283f3216b667d5b5f79/edwards-ev1000-clinical-platform-edwards-ev1000v1-2set-uppres-recoveredpdf.jpg)