The Variation of Profile Drag with Mach Number up to the...
20
R° & M. No. 3520 MINISTRY OF TECHNOLOGY AERONAUTICAL RESEARCH COUNCIL REPORTS AND MEMORANDA ., ~ ~ ~11,;i,¸ ~'i The Variation of Profile Drag with Mach Number up to the Critical Value; a Comparison of Recent Predictions with Early Flight and Wind-tunnel Measurements and a Comment en an Earlier Prediction By J. OSBORNE, B.Sc. LONDON: HER MAJESTY'S STATIONERY OFFICE 1968 PRICE NINE SHILLINGS NET
Transcript of The Variation of Profile Drag with Mach Number up to the...
R° & M. No. 3520
M I N I S T R Y O F T E C H N O L O G Y
AERONAUTICAL RESEARCH COUNCIL
REPORTS AND MEMORANDA ., ~ ~ ~ 11,;i,̧ ~'i
The Variation of Profile Drag with Mach Number up to the Critical Value; a Comparison of Recent Predictions with Early Flight and Wind-tunnel Measurements and a Comment en an Earlier
Prediction By J. OSBORNE, B.Sc.
LONDON: HER MAJESTY'S STATIONERY OFFICE
1968
PRICE NINE SHILLINGS NET
The Variation of Profile Drag with Mach Number up to the Critical Value; a Comparison of Recent Predictions with Early Flight and Wind-tunnel Measurements and a Comment on an Earlier
Prediction By J. OSBORNE, B.Sc.
Reports and Memoranda No. 3520* June, 1966
Summary. Flight measurements made by Mair in 1942, with the wake-traverse method, are used to extend to
high Reynolds numbers (2 x 10⁷) and a thick section (18 per cent t/c) the verification that the sub-critical creep (slow increase with increasing Mach number) in profile-drag coefficient can now be predicted accurately. Good agreement is also obtained between the absolute magnitude (as distinct from creep) of the measured drag and of that predicted on the basis of boundary-layer transition having occurred near the leading edge. Similar agreement is obtained with a drag coefficient measured on a two- dimensional aerofoil (R = 1.6 x 10⁶) of an almost identical section with transition positions now known to have been at 39 per cent chord.
The analysis shows that predicted profile drag, particularly at high sub-critical Mach numbers, is sensitive to the actual compressible-flow pressure distribution used in its derivation, and that the errors due to inaccuracies of the older compressibility laws can be especially important for sections of this thickness, with the particular type of velocity distribution involved. This last point is shown to be the probable reason for the failure of the analysis of Young and Winterbottom 6 to predict any significant sub-critical drag creep.
Section
1.
2.
3.
4.
5.
LIST OF CONTENTS
Introduction
Basis of the Method for Calculating Profile Drag
Mair's Flight Tests on a Tornado Aircraft
Derivation of Pressure Distributions Appropriate to the Flight Tests
Comparisons Between Predicted and Measured Drag Coefficients; Flight
*Replaces N.P.L. Aero Report l197--A.R.C. 28 107.
LIST OF CONTENTS--continued
6. Effect on Predicted Profile Drag of Using a Different Compressibility Correction
7. Comparison Between a Predicted and Measured Drag Coefficient ; Wind Tunnel
8. Comparisons Between Various Predictions for an 18½ per cent thick Symmetrical Joukowski Aerofoil at Zero Incidence
8.1. Different predictions for the velocity distributions at M o = 0 and M0 = 0.685
8.2. Profile drags derived from the different velocity distributions
9. Concluding Remarks
10. Acknowledgement
List of Symbols
References
Appendix : The Weber Law for Velocity Distributions
Tables 1 and 2
Illustrations--Figs. 1 to 9
1. Introduction.
In Ref. 1, Nash, Moulden and Osborne introduced a theoretical analysis to demonstrate that, for a given Reynolds number and position of boundary-layer transition, significant increases in profile-drag coefficient should be expected with increase of Mach number up to the critical. They showed that the predicted variation agreed well with the variation observed on a symmetrical aerofoil at zero incidence and relatively low Reynolds number.
From the point of view of accurate prediction of the absolute magnitude of drag, certain assumptions implicit in their method for the calculation of boundary-layer growth (see Section 2) are open to question, and have since been improved upon (Ref. 2). Nevertheless it has been established empirically that their method does predict drags that agree well with experiment whenever tested within the range of validity of the method, i.e. for conditions of Mach number, lift coefficient and Reynolds number for which shock-wave drag is absent and the flow remains attached. At low Mach numbers the accuracy of the prediction has been verified (Refs. 3 and 4) for a wide range of aerofoil shapes, thickness-chord ratios (6 per cent to 18 per cent), lift coefficients and transition positions for Reynolds numbers up to 2-6 × 10⁷. For high Mach numbers (Refs. 2, 3 and 4) the verification again included a wide range of aerofoil shapes, thickness-chord ratios (4 per cent to 14 per cent), lift coefficients and transition positions, but excluded the all-important high Reynolds numbers*.
It has now been realised that the careful and well-documented flight measurements made by Mair 5 on a Tornado aircraft in 1942 (see Section 3) provide the basis for extending the verification at high Mach numbers to flight Reynolds numbers. In this connection it is significant that Mair in fact reported
*Ref. 2 also includes the comparison established in Section 5 of this Report.
an increase of 8 per cent in drag coefficient as Mach number increased from 0.4 to 0.655, the value assumed at that time to be critical for the wing section (see below).
In contrast, calculations by Young and Winterbottom 6 had previously indicated that an increase of only about 2 per cent would be expected on a 18½ per cent thick symmetrical Joukowski aerofoil at zero incidence. This led to the suggestion that the increases in CD with Mach number observed in wind- tunnel tests at low Reynolds number ctmld be attributed to a forward movement of boundary-layer transition, which was plausible since Reynolds number nearly always increased simultaneously with Mach number in such tests and it was not customary to fix transition artificially. On the other hand, Mair put forward strong arguments that transition occurred near the leading edge for all his tests. It is thus also of interest to re-examine the case treated by Young and Winterbottom in the light of the more accurate methods now available for estimating the effect of Mach number on both boundary-layer growth and pressure distribution. In the latter context, it is important to note that the direct calculation of pressure distribution for the prescribed aerofoil shape, lift coefficient and Mach number is implicit in the current method (if the prediction is to be entirely on the basis of theory), and that the extension of the calculations to aerofoils with thickness/chord ratios of the order of 18 per cent is likely to be particularly revealing in relation to the influence of the differences recently introduced in allowing for the effect of compressibility on the pressure distribution.
Further interest is added by the extension of the comparisons to a drag measurement made by Pearcey (Ref. 7) in 1943 in a high-speed wind tunnel at a relatively low Reynolds number on a two-dimensional aerofoil with a section (NACA 2218) almost identical to that of the Tornado wing. The comparison is relevant for one measurement from his set of several, because the transition position can now be derived (Ref. 8) from a direct-shadow photograph that he obtained at that time.
2. Basis of the Method for Calculatin9 Profile Drag. Briefly the method of Ref. 1 calculates the boundary-layer momentum thickness at the trailing edge
using Thwaites' incompressible formula in the laminar region and Spence's expression in the turbulent region with the Stewartson-Illingworth transformation to relate compressible and incompressible flows. In the wake, the momentum thickness at the trailing edge and at infinity downstream are related by a factor dependent on trailing-edge velocity, again modified using the Stewartson-Illingworth transforma- tion. Finally CD is obtained from the fundamental result that
20oo CD ~-
C
where 0~o is the asymptotic momentum thickness of the wake and c is the aerofoil chord. Profile drag can thus readily be derived, via the appropriate pressure distribution, in terms of the
four relevant variables, namely, Mach number, lift coefficient (or incidence), Reynolds number and position of boundary-layer transition (on upper and lower surface separately).
3. Mair's Flight Tests on a Tornado Aircraft. Mair derived his profile-drag measurements from the readings of a pitot-static rake, 0-1c downstream
of a section at 31 per cent semi-span out from the body-side. He quotes the aircraft lift coefficient and the Reynolds number for each Mach number; these are tabulated in Table la together with his drag coefficients.
His purpose was to investigate the effects of compressibility on drag for Mach numbers up to and just beyond the critical value. Some of his results therefore include an element of shock-wave drag and are thus beyond the limit of applicability of the prediction method.
This limit, the estimated critical Mach number, is indicated by a horizontal line in this and a later Table.
Of the four variables relevant to drag prediction, the position of boundary-layer transition was the least certain in the flight measurements. Mair argued that transition was probably provoked very near
the leading edge at the measuring station by the slight waviness that remained after the filling of spaces around metal gun-hole covers, rubbing down and painting. His drag results also indicate that transition position was not sensitive to variation in Reynolds number.
The aerofoil section upstream of the wake rake differed only slightly from the NACA 2218 section, but he quotes the actual ordinates and these are used in the prediction of profile drags to compare with his measurements.
4. Derivation of Pressure Distributions Appropriate to the Flight Tests.
In certain of the earlier checks on the drag-calculation method it has been possible to make the comparison in two stages, namely, to verify first the accuracy of the prediction of the pressure distri- bution at the correct Mach number and lift coefficient and then the accuracy of the drag prediction from this pressure distribution. Here, however, since pressure distributions were not measured in flight or wind tunnel, comparison can be made only at the final stage without separate assessments of the accuracy of the pressure distributions and of the boundary-layer calculations. Some consideration, based on experience, should therefore be given to possible sources of inaccuracy in the prediction of pressure distribution and to their likely influence on the accuracy of the final drag prediction.
Squire and Young 9, and Nash, Moulden and Osborne 1 indicate that for symmetrical aerofoils at zero incidence the inviscid pressure distribution can be used with reasonable accuracy because this distribution and that appropriate for viscous flow, although differing considerably as the trailing edge is approached, give differences in trailing-edge momentum thickness and trailing-edge velocity that are self-compensating. Inviscid pressure distributions are therefore used here, but at the appropriate lift coefficient, rather than at any particular incidence, to allow for the effect of viscosity on lift-curve slope.
It is known however that the accuracy of the drag calculations is far more sensitive to inaccuracies in predicted velocity at points further forward on the aerofoil, especially in the region of maximum velocity. In this respect, the method of allowing for the effects of compressibility is of great importance (see Sections 6 and 8). For this reason, the Weber 1°,11,12 method has been used with compressibility factors modified empirically by Wilby 13,14 (see Appendix); this method incorporates a 'second-order' com- pressibility term depending on the thickness distribution which, with the Wilby modification, gives the best general agreement with available exact solutions and experiment. Although the justification for this procedure is based on empirical evidence that is reasonably well substantiated for small lift coeffici- ents, it is realised that it is no real substitute for the more accurate solutions for compressible viscous flow that are still being sought. The importance of this is underlined by the demonstration in Sections 6 and 8 of the sensitivity of predicted drag to the compressibility factor used in predicting velocity distribution.
Since in Mair's flight tests the lift coefficient at the measuring station was not measured, it is assumed that it did not differ appreciably from the quoted total aircraft CL. For this low value of CL and with a straight wing of the planform of the Tornado this is not an unreasonable assumption, but additional calculations were carried out at two Maeh numbers to check that small changes in section CL at each Mach number would have only a small effect on drag and therefore that the uncertainty in local C L would not invalidate the comparisons.
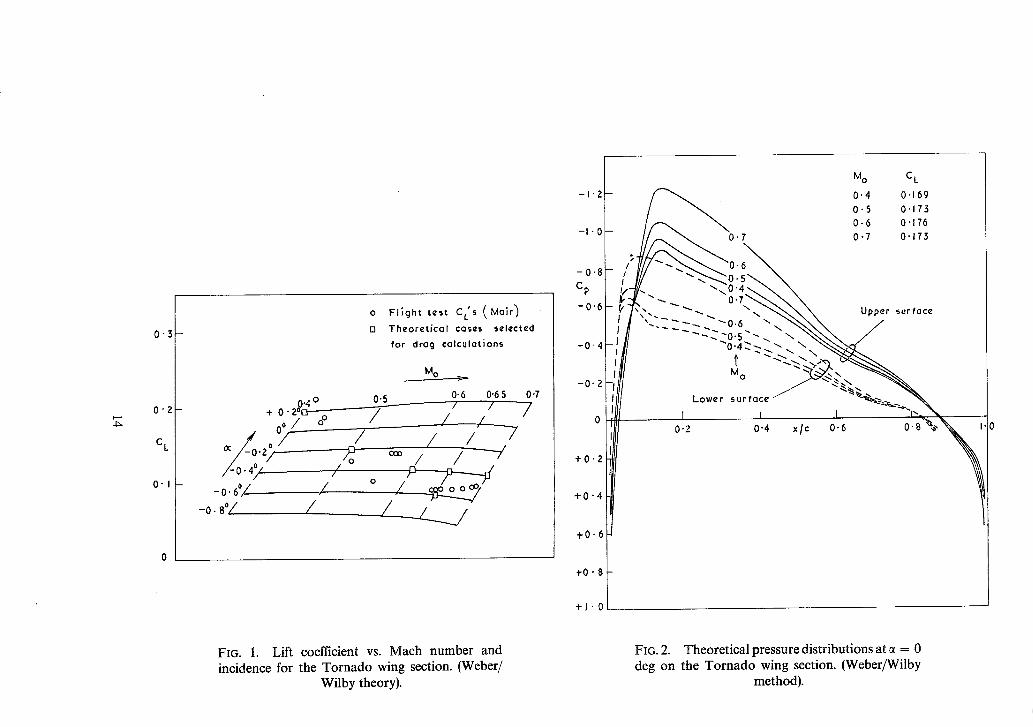
Compressible-flow pressure distributions covering a range of Mach number and incidence were calculated by the Weber/Wilby method: a carpet plot of the variation of calculated CL with Mach number and incidence is shown in Fig. 1. Included in this figure are the measured flight lift coefficients and those for which Co has been calculated and which were selected to match as nearly as possible the pattern of the flight tests. At M 0 -- 0.65, two incidences were chosen in order to ensure that the variation of calculated C o with CL could be examined. Comparison of C o estimates based on these six cases with flight measurements are described in Section 5.
At first sight, the theoretical variation of CL with M o at constant ~ shown in Fig. 1 seems somewhat surprising, being very different from the Glauert variation (CL proportional to (1 -M~) -~) commonly expected; the reasons can be inferred from the pressure distribution shown in Fig. 2. This and other
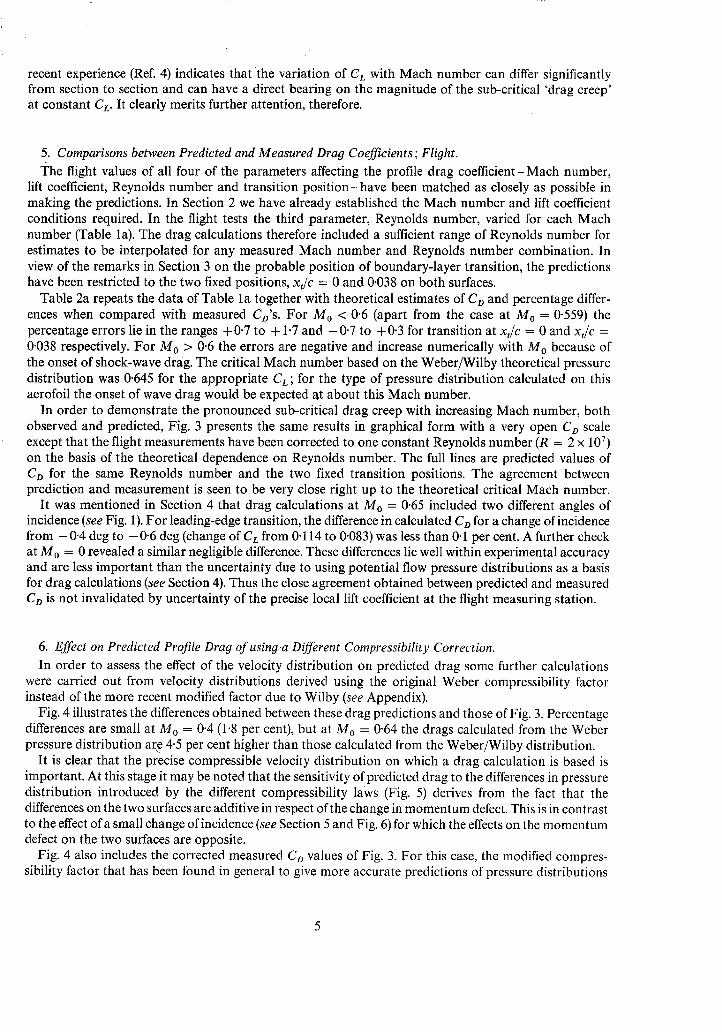
recent experience (Ref. 4) indicates that the variation of CL with Mach number can differ significantly from section to section and can have a direct bearing on the magnitude of the sub-critical 'drag creep' at constant Cz. It clearly merits further attention, therefore.
5. Comparisons between Predicted and Measured Drag Coefficients; Flight. The flight values of all four of the parameters affecting the profile drag coefficient-Mach number,
lift coefficient, Reynolds number and transition pos i t ion-have been matched as closely as possible in making the predictions. In Section 2 we have already established the Math number and lift coefficient conditions required. In the flight tests the third parameter, Reynolds number, varied for each Mach number (Table la). The drag calculations therefore included a sufficient range of Reynolds number for estimates to be interpolated for any measured Mach number and Reynolds number combination. In view of the remarks in Section 3 on the probable position of boundary-layer transition, the predictions have been restricted to the two fixed positions, x]c = 0 and 0.038 on both surfaces.
Table 2a repeats the data of Table la together with theoretical estimates of Co and percentage differ- ences when compared with measured Co's. For M 0 < 0.6 (apart from the case at M 0 = 0-559) the percentage errors lie in the ranges + 0.7 to + 1.7 and -0"7 to + 0"3 for transition at x]c = 0 and x]c = 0.038 respectively. For M 0 > 0.6 the errors are negative and increase numerically with M o because of the onset of shock-wave drag. The critical Mach number based on the Weber/Wilby theoretical pressure distribution was 0-645 for the appropriate CL; for the type of pressure distribution calculated on this aerofoil the onset of wave drag would be expected at about this Mach number.
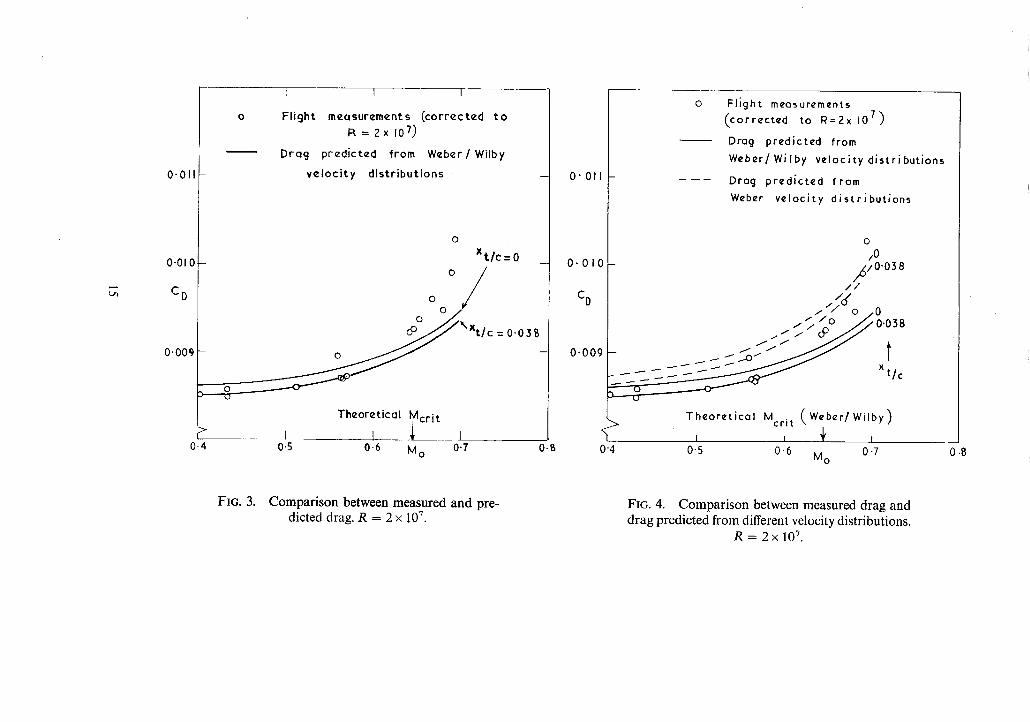
In order to demonstrate the pronounced sub-critical drag creep with increasing Math number, both observed and predicted, Fig. 3 presents the same results in graphical form with a very open Co scale except that the flight measurements have been corrected to one constant Reynolds number (R = 2 x 10⁷) on the basis of the theoretical dependence on Reynolds number. The full lines are predicted values of Co for the same Reynolds number and the two fixed transition positions. The agreement between prediction and measurement is seen to be very close right up to the theoretical critical Mach number.
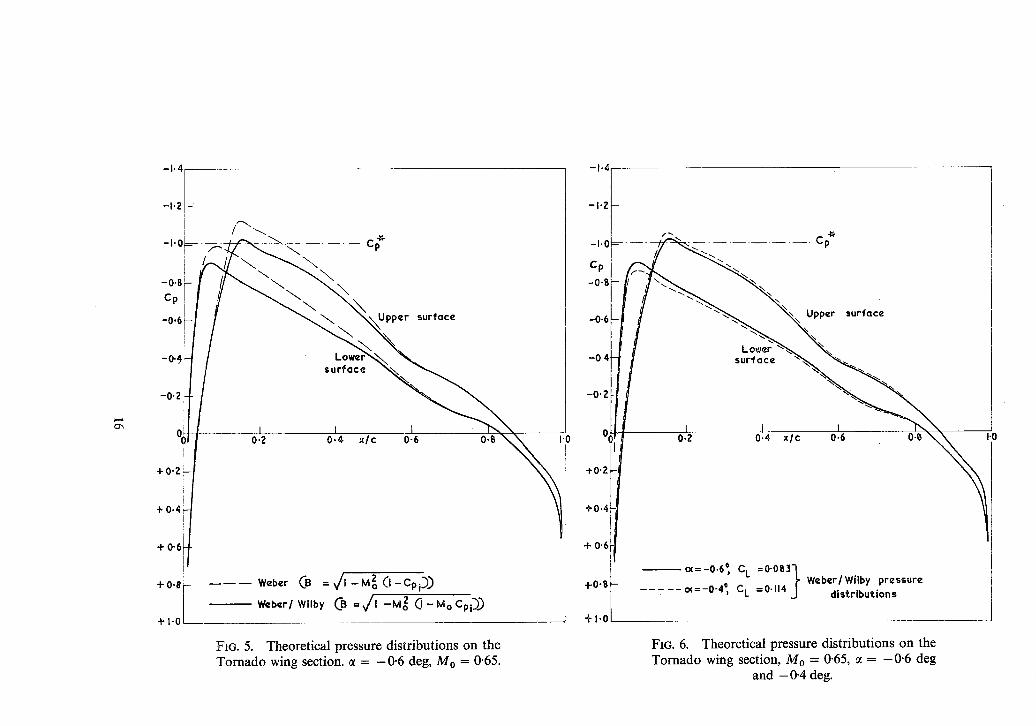
It was mentioned in Section 4 that drag calculations at M o = 0.65 included two different angles of incidence (see Fig. 1). For leading-edge transition, the difference in calculated Co for a change of incidence from - 0.4 deg to - 0.6 deg (change of CL from 0"114 to 0"083) was less than 0.1 per cent. A further check at M 0 = 0 revealed a similar negligible difference. These differences lie well within experimental accuracy and are less important than the uncertainty due to using potential flow pressure distributions as a basis for drag calculations (see Section 4). Thus the close agreement obtained between predicted and measured Co is not invalidated by uncertainty of the precise local lift coefficient at the flight measuring station.
6. Effect on Predicted Profile Drag of using.a Different Compressibility Correction. In order to assess the effect of the velocity distribution on predicted drag some further calculations
were carried out from velocity distributions derived using the original Weber compressibility factor instead of the more recent modified factor due to Wilby (see Appendix).
Fig. 4 illustrates the differences obtained between these drag predictions and those of Fig. 3. Percentage differences are small at M o -- 0"4 (1.8 per cent), but at Mo = 0-64 the drags calculated from the Weber pressure distribution are 4.5 per cent higher than those calculated from the Weber/Wilby distribution.
It is clear that the precise compressible velocity distribution on which a drag calculation is based is important. At this stage it may be noted that the sensitivity of predicted drag to the differences in pressure distribution introduced by the different compressibility laws (Fig. 5) derives from the fact that the differences on the two surfaces are additive in respect of the change in momentum defect. This is in contrast to the effect of a small change of incidence (see Section 5 and Fig. 6) for which the effects on the momentum defect on the two surfaces are opposite.
Fig. 4 also includes the corrected measured Co values of Fig. 3. For this case, the modified compres- sibility factor that has been found in general to give more accurate predictions of pressure distributions

seems to give the more accurate prediction of drag, bearing in mind that the measured drags from M0 = 0.645 onwards probably contain an element of shock-wave drag.
A further example of the sensitivity of predicted drag to the prediction of velocity distribution is given in Section 8.
7. Comparison Between a Predicted and Measured Drag Coefficient; Wind Tunnel.
In the wind-tunnel measurements that Pearcey v made on a two-dimensional aerofoil (NACA 2218) closely resembling that of the Tornado aircraft, boundary-layer transition was not fixed nor was its position in general determined. The comparison between tunnel and flight was therefore confined to the broad picture and to the conditions for the onset of shock-wave drag. However a direct-shadow photograph was taken for one particular condition, just on the point of the shock-wave drag rise, from which it is now possible to derive the transition position by the method of Ref. 8. A relevant comparison can therefore now be made between the drag 'measured' at that condition (~ = - 0 . 5 deg, Mo = 0.65, R = 1.6 x 10 6) and that predicted by the method of Ref. 1 for corresponding transition positions (x,/c = 0"39 on both surfaces).
Unfortunately Pearcey does not record an actual drag measurement at this precise Mach number, and so a value has been read from the curve he drew through his measured points. Unfortunately, also, there was a small element of shock-wave drag in the measurements, as indicated by an extrapolation to M 0 = 0-65 of the well-defined pre-wave-drag part of his curve. A value has therefore also been read on this extrapolated curve for M0 = 0-65. These values from Pearcey's graphs are included in Table lb and the comparison with prediction in Table 2b. It will be seen that, taking the straight comparison between 'measured' drag and prediction, the order of agreement is the same as that for the much higher flight Reynolds numbers at the same Mach number; in both cases the prediction lies between 2 and 3 per cent lower than the measurement, and in both cases the measurements almost certainly included a small element of shock-wave drag. The comparison between prediction and the value given by extra- polation of Pearcey's pre-wave-drag curve is almost exact, although this is probably co-incidental in view of possible experimental and prediction errors.
8. Comparisons Between Various Predictions for an 18½ per cent Thick Symmetrical Joukowski AeroJoil at Zero Incidence.
This Joukowski aerofoil, of similar thickness to the section of the Tornado wing, is that for which Young and Winterbottom 6 had estimated only a very small 'creep' in drag (2 per cent) as Mach number increased up to 0.685 apparently in conflict with 6 to 8 per cent creep measured and now calculated for the Tornado section as Mach number increased up to 0.645.
Young and Winterbottom estimated the profile drag of the Joukowski aerofoil from velocity distri- butions derived in 1938 by Kaplan (Ref. 15) for M 0 = 0 and M 0 = 0.685 (the critical Mach number he estimated). Their drag calculation method was an adaptation to compressible flow of the method of Squire and Young 9.
In reconsidering this case, both stages are of interest. The methods now available for estimating velocity distributions for compressible flow are likely to give answers that differ quite significantly from those derived by Kaplan, and as we have seen, this is likely to have a significant influence on the predicted drag creep whatever method is used to calculate the momentum defect (drag) from the velocity distri- butions ; it is here illustrated by applying the method of Ref. 1 to the Kaplan velocity distributions and to those calculated by the Weber and Weber/Wilby methods. The drag calculation method of Ref. 1 is compared with that of Young and Winterbot tom by applying it to the Kaplan velocity distributions.
8.1. D!fferent predictions for the velocity distribution at M o = 0 and Mo = 0'685.
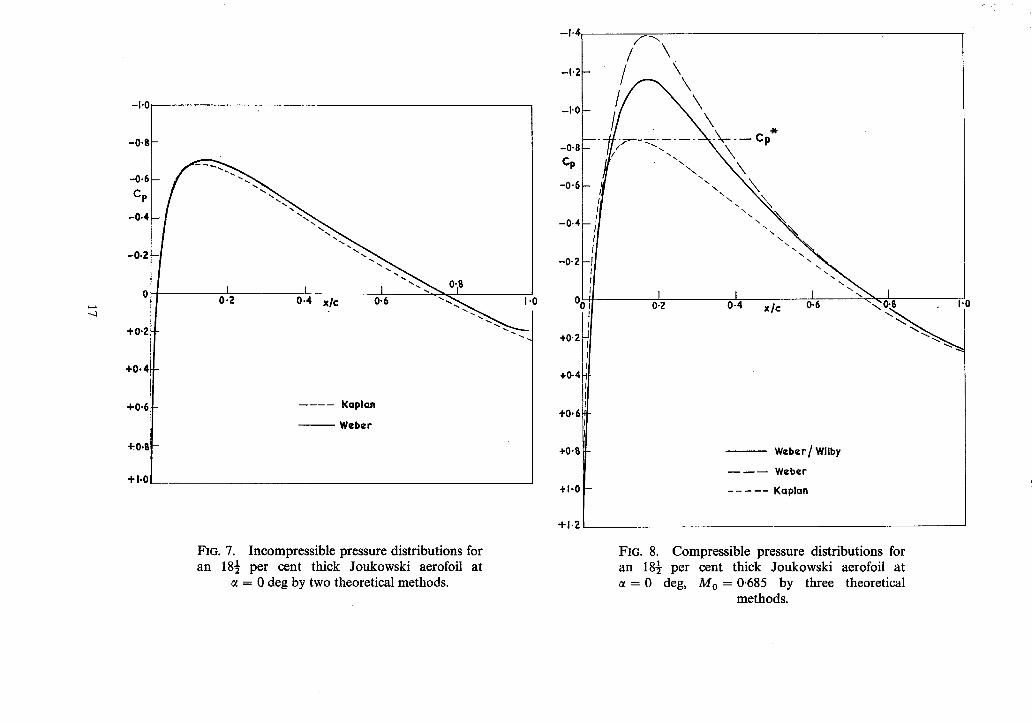
In Fig. 7 are compared the incompressible chordwise C~ distributions as calculated by Kaplan and by the Weber method. The latter produces slightly lower pressures over the adverse gradient region with an almost constant difference of about 0-04 in Cp for much of the chord. On the other hand, Fig. 8,
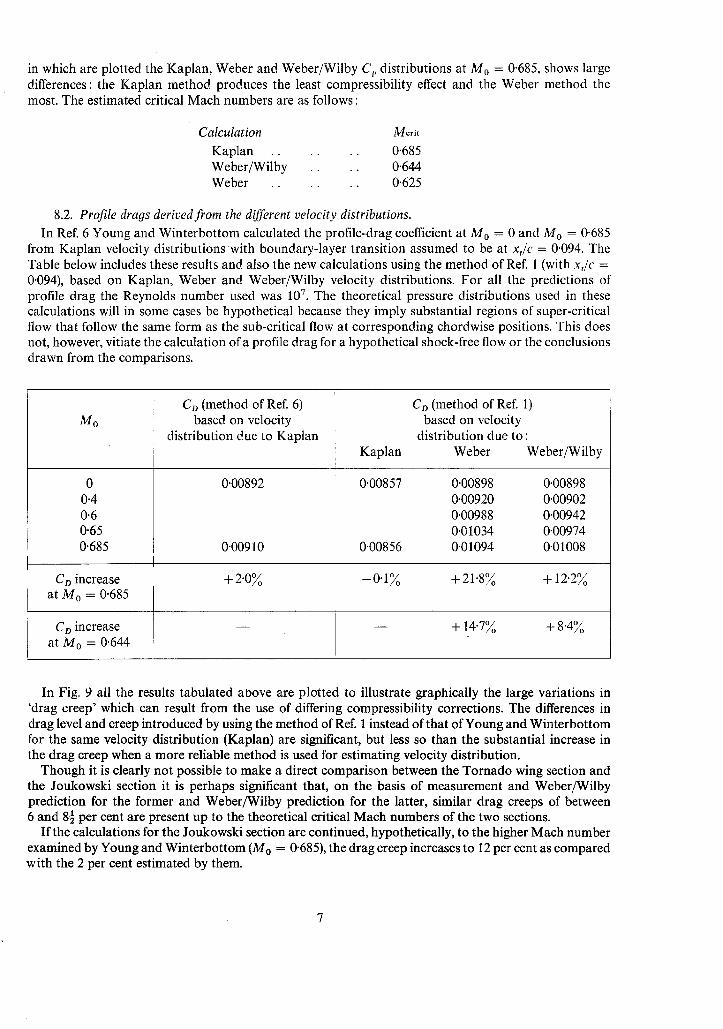
in which are plotted the Kaplan, Weber and Weber/Wilby Cp distributions at Mo = 0"685, shows large differences: the Kaplan method produces the least compressibility effect and the Weber method the most. The estimated critical Mach numbers are as follows :
Calculation Kaplan . . . . Weber/Wilby .. Weber . . . .
M e r i t
0"685 0.644 0.625
8.2. Profile drags derived from the different velocity distributions. In Ref. 6 Young and Winterbottom calculated the profile-drag coefficient at M 0 = 0 and M 0 = 0.685
from Kaplan velocity distributions with boundary-layer transition assumed to be at xt/c = 0.094. The Table below includes these results and also the new calculations using the method of Ref. 1 (with x,/c = 0.094), based on Kaplan, Weber and Weber/Wilby velocity distributions. For all the predictions of profile drag the Reynolds number used w a s 10 7 . The theoretical pressure distributions used in these calculations will in some cases be hypothetical because they imply substantial regions of super-critical flow that follow the same form as the sub-critical flow at corresponding chordwise positions. This does not, however, vitiate the calculation of a profile drag for a hypothetical shock-free flow or the conclusions drawn from the comparisons.
Mo
0 0.4 0.6 0"65 0"685
Co (method of Ref. 6) based on velocity
distribution due to Kaplan
0.00892
0"00910
C D increase q52-0~ at Mo = 0.685
CD increase at Mo = 0.644
Kaplan
Co (method of Ref. 1) based on velocity
distribution due to : Weber Weber/Wilby
0.00857 0-00898 0.00898 ~00920 0.00902 0.00988 0.00942 0.01034 0.00974
0.00856 0.01094 0.01008
- 0 . 1 ~ +21 .8~ +12.2~
+14 .7~ +8 .4 ~
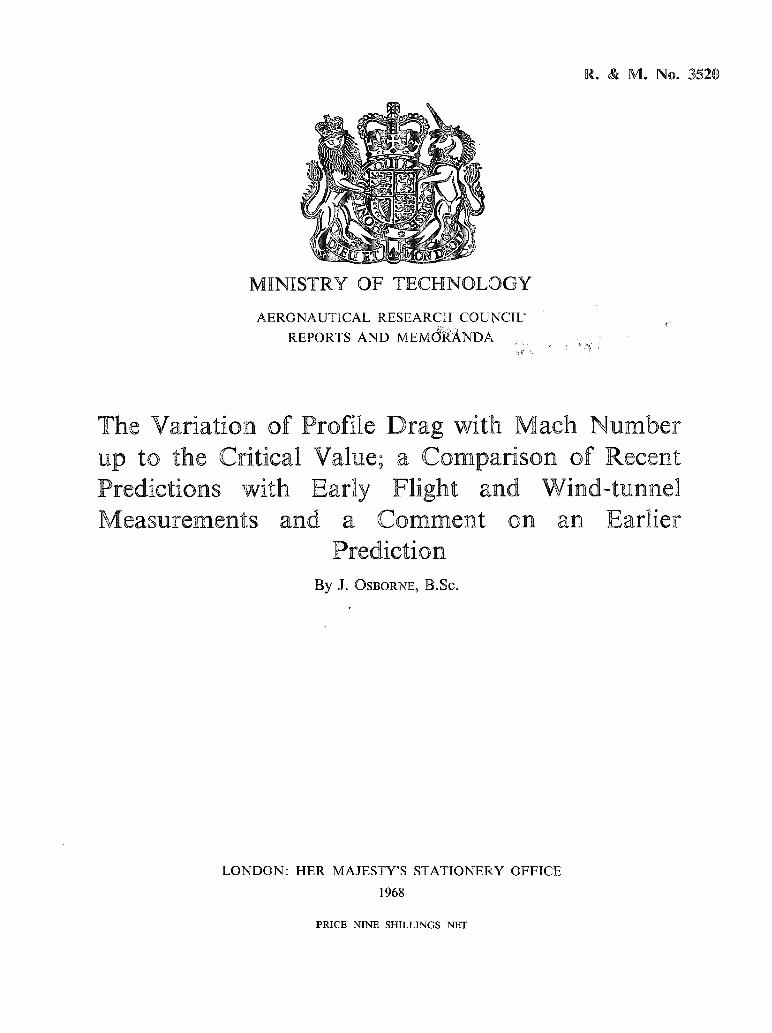
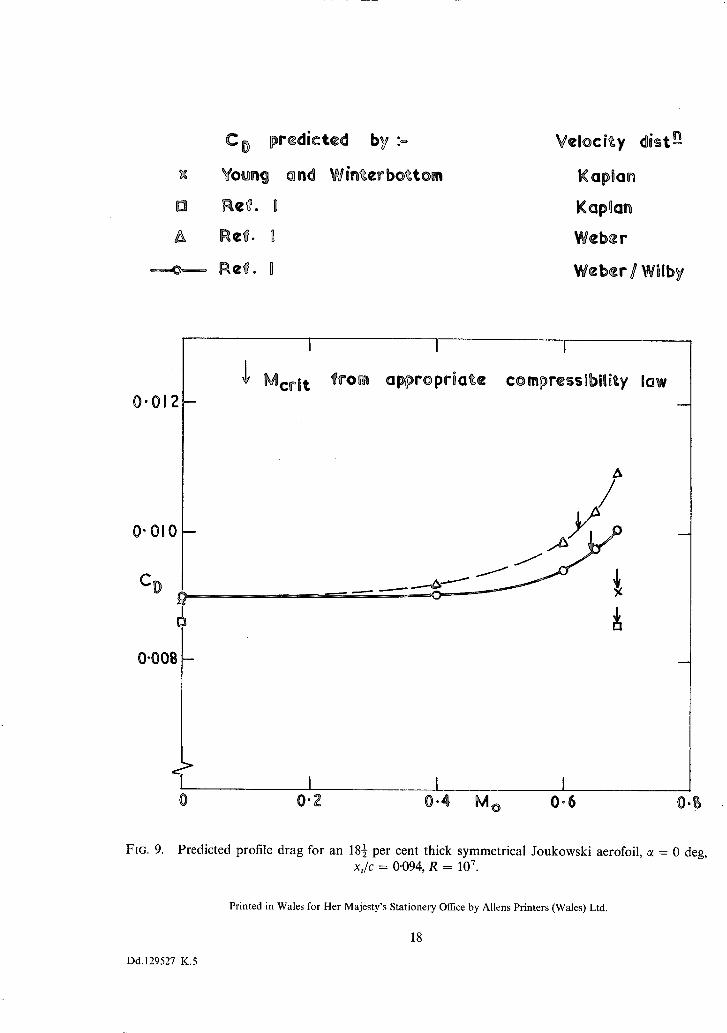
In Fig. 9 all the results tabulated at~ove are plotted to illustrate graphically the large variations in ~drag creep' which can result from the use of differing compressibility corrections. The differences in drag level and creep introduced by using the method of Ref. 1 instead of that of Young and Winterbottom for the same velocity distribution (Kaplan) are significant, but less so than the substantial increase in the drag creep when a more reliable method is used for estimating velocity distribution.
Though it is clearly not possible to make a direct comparison between the Tornado wing section and the Joukowski section it is perhaps significant that, on the basis of measurement and Weber/Wilby prediction for the former and Weber/Wilby prediction for the latter, similar drag creeps of between 6 and 8½ per cent are present up to the theoretical critical Mach numbers of the two sections.
If the calculations for the Joukowski section are continued, hypothetically, to the higher Mach number examined by Young and Winterbottom (M o = 0.685), the drag creep increases to 12 per cent as compared with the 2 per cent estimated by them.
9. Concluding Remarks. It has been shown that the sub-critical increase in profile drag coefficient as predicted by the method
of Ref. 1 for the appropriate wing section agrees well with the increase measured in flight in 1942 at Reynolds numbers of the order of 2 × 10⁷. Good agreement is also obtained between the magnitude of the measured drag and of that predicted on the basis of boundary-layer transition having occurred near the leading edge. Similar agreement is obtained with a drag coefficient measured in a high-speed wind tunnel (Ref. 7) on a two-dimensional aerofoil (R = 1.6 x 10⁶) of almost identical section (NACA 2218) with boundary-layer transition now known to have been at 39 per cent chord on both surfaces.
This provides an important extension to the range of conditions for which the method of Ref. 1 has been verified to embrace the combination of high Reynolds number and high Mach number, and a wide range of Reynolds number on a thick section.
The variation of Co with C± for the range of CL of interest has been shown to be negligible in this case; the uncertainty in the exact value of section CL in the tests does not therefore invalidate the comparisons.
The predicted values of the profile-drag coefficients, and in particular the variation with Mach number, are shown to be markedly dependent on the precise assumption made for the variation of pressure distribution with Mach number. It is shown that this has a direct bearing on the calculations made in 1940 by Young and Winterbottom for a Joukowski aerofoil of 18½ per cent thickness/chord ratio. Using the best methods that are now available for allowing for the effect of compressibility on velocity distri- bution this aerofoil would be expected to give a sub-critical drag creep of the same order (8 per cent) as that predicted and measured for the section of the Tornado wing.
It is clear that the final complete confidence in methods of profile drag prediction for all conditions will depend on the derivation of a reliable method for estimating simultaneously the effects of com- pressibility and viscosity for Mach numbers up to the critical value. In fact, for this and other reasons, research on these aspects has assumed great importance in the overall aim of providing the aircraft designer with a real opportunity of optimising at an early stage his wing section shape according to his performance and off-design requirements.
10. Acknowledgement. The author is indebted to Mr. H. H. Pearcey for much helpful criticism and advice during the
preparation of this paper.
C
Ca
CI.
C~
Mo
R
X
Xt
LIST OF SYMBOLS
Aerofoil chord
Profile-drag coefficient
Lift coefficient
Pressure coefficient
Free-stream Maeh number
Reynolds number (based on chord length)
Chordwise position (origin at leading edge)
Chordwise position of boundary-layer transition (origin at leading edge)

LIST OF SYMBOLS- - - con t inued
Angle of incidence
0~ Asymptotic momentum thickness of the aerofoil wake
V Local velocity
Vo
s t~ (x)
Free-stream velocity
An integral derived from the thickness distribution of the aerofoil~°
S ~2~ (x) dz-z where z~ is the local thickness ordinate ~° dx ' (Note : the subscript t refers here to thickness and not to transition position as in the main
part of this paper)
S ~ (x) An integral representing the cross-coupling effects of aerofoil thickness and the incidence- induced contribution to local velocity 1°
S ~*~ (x) An integral allowing for the effect of camber on local velocity 1~
S ~ (x) dz----z~ where z~ is the local camber ordinate 1 dx '
Cp, Incompressible pressure coefficient for the thickness distribution at zero incidence
It should be stated here that C a , the local pressure coefficient in compressible flow is calculated from the compressible form of Bernoulli's equation,
) ' -1
_2 [, where ~ is the ratio of specific heats (taken as 1.4 for air).
(2~

APPENDIX
The Weber Law for Velocity Distributions
The Weber equation for the velocity distribution takes the following form for compressible flow:
(V(x)~ 2 {(I'Sti)(x)'S(4)(X) t T t T ) sins
\ Vo / = s ' ' ' (x) , (1)
where the compressibility factors can be identified as
fl = ~ l - M o 2
and B = ~f l -M02( l - Cp,), according to the original Kiichemann-Weber derivation 16
or ~fl -M~(1 -MoCp, ) , accordin~ to the empirical modification introduced by Wilby 13.
It will be seen from the definitions of symbols, that the/3 factor governs the main contributions to the velocity due to lift whereas the B factor is applied principally to the thickness terms.
No. Author(s)
1 J.F. Nash, T. H. Moulden and J. Osborne . . . .
2 J. F. Nash, J. Osborne and A. G. J. Macdonald
4 H.H. Pearcey and .. J. Osborne
5 W.A. Mair . . . .
6 A.D. Youngand .. N. E. Winterbottom
REFERENCES
Title, etc.
On the variation of profile drag coefficient below the critical Mach number.
A.R.C.C.P. 758. November, 1963.
A note on the prediction of aerofoil profile drag at subsonic speeds.
A.R.C. 28 075. June, 1966.
Note on profile drag of aerofoil sections. Royal Aeronautical Society Aerodynamics Committee Paper A.72.
December, 1964. (Unpublished).
On estimating two-dimensional section drag. A.R.C. 27 872. March, 1966.
Flight measurements of profile drag at high speeds. A.R.C.R. & M. 2555. July, 1942.
Note on the effect of compressibility on the profile drag of aero- foils at subsonic Mach numbers in the absence of shock waves.
A.R.C.R. & M. 2400. May, 1940.
10

No. Author(s)
7 H.H. Pearcey
8 H.H. Pearcey
9 H.B. Squire and .. A. D. Young
10 J. Weber . . . .
11 J. Weber . . . .
12 J.A. Bagley . . . .
13 P.G. Wilby . . . .
14 P.G. Wilby . . . .
15 C. Kaplan . . . .
16 D. Kiichemann and J. Weber
REFERENCES--continued
~tle, etc.
Drag measurements on N.A.C.A. 2218 section at compressibility speeds for comparison with flight tests and theory.
A.R.C.R. & M. 2093. April, 1943.
The indication of boundary-layer transition on aerofoils in the N.P.L. 20 in. × 8 in. high-speed wind tunnel.
A.R.C.C.P.10. December, 1948.
The calculation of the profile drag on aerofoils. A.R.C.R. & M. 1838. November, 1937.
The calculation of the pressure distribution over the surface of two-dimensional and swept wings with symmetrical aerofoil sections.
A.R.C.R. & M. 2918. July, 1953.
The calculation of the pressure distribution on the surface of thick cambered wings and the design of wings with given pressure distribution.
A.R.C.R. & M. 3026. June, 1955.
Some aerodynamic principles for the design of swept wings. Progress in Aero. Sciences, Vol. 3, p.1. Pergamon Press, 1962.
Subsonic compressibility corrections. Royal Aeronautical Society Transonic Aerodynamics Committee Paper T.83. 1964. (Un- published).
A comparison of theoretical and experimental pressure distri- butions for the N.P.L. 1211 aerofoil.
Royal Aeronautical Society Transonic Aerodynamics Committee Paper T.146. April, 1965. (Unpublished).
Compressible flow about symmetrical Joukowski profiles. N.A.C.A. Report 621.1938.
The subsonic flow past swept wings at zero lift without and with body.
A.R.C.R. & M. 2908. 1953.
11

TABLE 1
(a) FlightMeasurements ~ProfileDragCoefficientona ~rnadoAircraft(Re[5)
M o R × 10-7 CL Co
0.403 0-434 0.434 0.512 0.559 0-561 0.565 0.568 0.641
0.646 0.653 0.667 0.680 0.690 0.694
1.63 0.210 1"76 0.180 1-75 0.186 2.11 0.129 2'45 0.I01 1"88 0.138 1.88 0.138 1"88 0-138 2.46 0.089
2-44 2.41 2.39 2"37 2-33 2.28
0.089 0-090 0.090 0.090 0.092 0.094
0-00882 0.00876 0.00868 0.00852 0.00866 0.00880 0.00879 0.00881 0-00891
0.00896 0.00910 0-00936 0.00925 0.00968 0.01009
(b) Wind Tunnel Measurement of Profile Drag Coefficient on a NACA 2218 Section (Ref. 7)
Mo R × 10 -6 C L C/)
0"65 1"61 0"13 0"0096 tl~ 0.0093t2~
(1) From Pearcey's graph, including element of wave drag. (2) From extrapolation of Percey's pre-wave-drag curve.
12
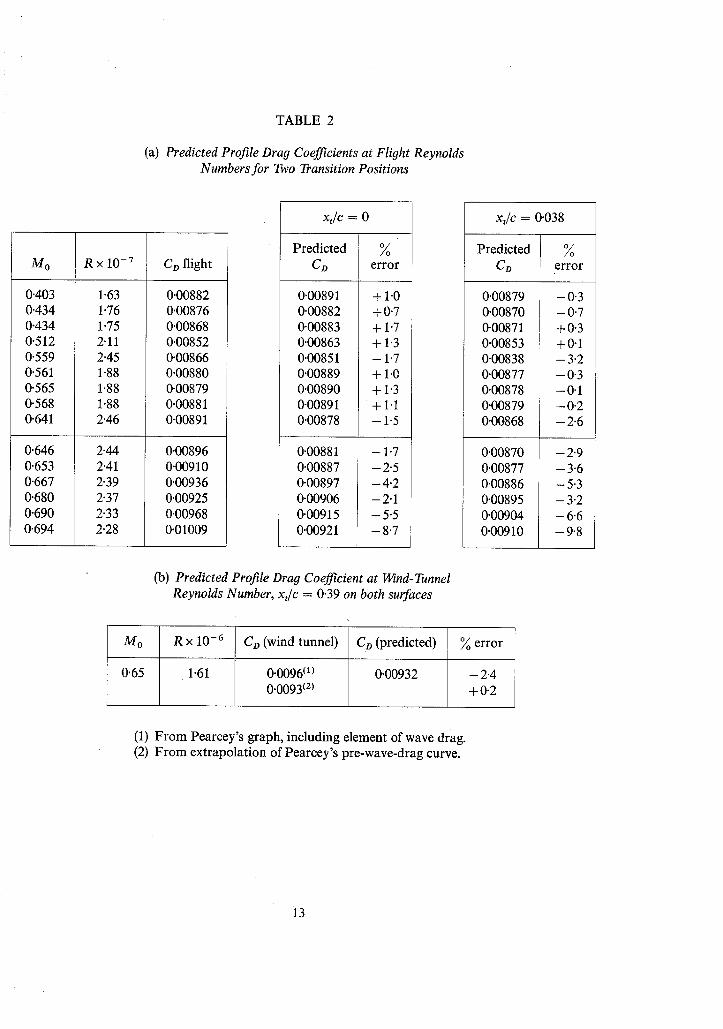
TABLE 2
(a) Predicted Profile Drag Coefficients at Flight Reynolds Numbers for 7"~vo Transition Positions
Mo
0"403 0"434 0"434 0"512 0"559 0"561 0"565 0"568 0"641
0"646 0"653 0"667 0"680 0"690 0"694
R x 10 -7
1"63 1"76 1"75 2"11 2"45 1"88 1"88 1"88 2"46
2"44 2"41 2"39 2"37 2"33 2"28
CD flight
0.00882 0.00876 0.00868 0.00852 0.00866 0-00880 0.00879
E 0.00881 0.00891
0'00896 0'00910 0.00936 0.00925 0"00968 0.01009
x , /c = 0
Predicted % Co error
0"00891 + 1.0 0.00882 +0-7 0.00883 +1.7 0.00863 +1.3 0"00851 - 1.7 0.00889 +1.0 0"00890 +1.3 0-00891 + 1 . 1 0.00878 -1 .5
0.00881 - 1-7 0.00887 -2 .5 0"00897 - 4 . 2 0.00906 -2 .1 0.00915 -5"5 0"00921 - 8 . 7
xdc= 0"038
Predicted % Co error
0.00879 -0 .3 0"00870 -0"7 0-00871 +0-3 0"00853 +0"1 0"00838 -3"2 0"00877 -0"3 0"00878 -0"1 0"00879 -0"2 0"00868 -2"6
0"00870 -2"9 0"00877 -3"6 0"00886 -5"3 0"00895 -3"2 0"00904 -6"6 0"00910 -9"8
(b) Predicted Profile Drag Coefficient at Wind-Tunnel Reynolds Number, xJc = 0.39 on both surfaces
Mo R × 10 -6
0.65 1-61
Co (wind tunnel)
0.0096 (1) 0-0093 (2)
Co (predicted)
0"00932
error
- 2 . 4 +0.2
(1) From Pearcey's graph, including element of wave drag. (2) From extrapolation of Pearcey's pre-wave-drag curve.
13
- 1 " 2
- I ' 0 0"7
M o
0 ' 4
0 - 5
0 - 6
0 -7
C L 0"169 0"173 0"176 0"173
0"3
0"?
C L
0"1
F,;g.t t ,s, c,'s (Ma~rJ Theoretical cases selected for drag calculations
M o
0"5 0-6 0"6 5 0-7 0"4 o / / + 0 • Z o ~ / 7
0 / o ° / / . / / / - - 7
~ / -y / -~ / ---7' / - 0 . 4 ~ / /
-0.6'/ ./ o / ' ~ o o~--~/ -o.e/ / / __/______/
-0"8 Cp
-0"6
- 0 ' 4
- 0 " 2
0
+0"2 1 ~r0.4
t - | .
0.7
x~._~ ~"0.6 -. ~\
M o
L o w e r s u r f a c e f
I I I
Upper surface
0"? 0"4 xlc 0-6 0'8
FIG. 1. Lift coefficient vs. Mach number and incidence for the Tornado wing section. (Weber/
Wilby theory).
FIG. 2. Theoretical pressure distributions at ~ = 0 deg on the Tornado wing section. (Weber/Wilby
method).
O-Oil
0"010
u, C D
0-009
I I I
Flight measurements (corrected to R = 2x I07~
Drag predicted from Weber lWi lby
ve loc i t y d ls t r ibut ions -
Xtlc=O
0"4
° o
L3
1 Theoreticall ~ Acrit I
0.5 0-6 Mo 0-7
=0-033
0-~
0"011
0 ,010
C D
0'009
Flight measurements Ccorrected to R=2x 10 7)
Drag predicted from Weber/Wilby velocity distr ibutions
Drag pred ic ted from Weber veloci ty dis trJbutlon5
o /0 /0"038
, , , /
.- "//°/o - - 0 1 1 ~ . ~oo. ~ O'03B
~ ~ X t
Theoretical Mcrit (Weber /Wilby)
0-4 0"5 0 -6 Mo 0 -T 0.8
FIG. 3. Comparison between measured and pre- dicted drag. R = 2 × 10⁷.
FIG. 4. Comparison between measured drag and drag predicted from different velocity distributions.
R = 2 x t 0 7.
-I.4[
! i
- I . o ~ - -
-0.8~- Cp
-0'6~- tri
-o-,41~
-0.2
i i
+ o . z ~
+0.4~
+ 0-6~
+0.8~ - - - - - -
+ 1 - 0 ~
Lower" surface
Upper surface
0-2 0-4. x/c 0-6 O-B
Weber ~B = V/I -M2o ~I-Cpi~ - - Weber/ Wilby CB =~1 --MO 2 0-MoCp|~..~
FIG. 5. Theore t ica l pressure d i s t r ibu t ions on the T o r n a d o wing section. ¢ = - 0 . 6 deg, Mo = 0.65.
-0-6
-0.4
-O'Z
I'0 ÷o.Oz
t +0.4
+0,6
+O.B, . . . . .
+1.0
c;
Upper surface
Lower s u r ' f a e e
I I 0-Z 0.4 x/e 0.6 0-S
o¢=-0.6°~ C L =0-083-~ m=-0"4*, C L =0.114 J Weber/WilbYdistributionsPressure
FIG. 6. Theore t ica l pressure d i s t r ibu t ions on the T o r n a d o wing section, Mo = 0.65, ~ = - 0 . 6 deg
and - 0.4 deg.
I'0
-I'0
- 0 . 8
-0.6 Cp
- 0 .4
-o.z
+0"2
+0.4
+0'6
+1,0
0"2 0.4 X/c 0"6 " ~ 0
. . . . Kaplan
- - W e b e r
FIG. 7. Incompressible pressure distributions for an 18½ per cent thick Joukowski aerofoil at
= 0 deg by two theoretical methods.
--1"4
-1'2 t
f - " x / \
// \ \
\ .
I I °l o-z 0-4 x/¢ 0.6
I
"1"0"2
+0.4
+0.6
+0.~,
+1"0
+1"2
Weber/Wilby
- - - - - - Weber
. . . . . Kaplan
I
FIG. 8. Compressible pressure distributions for an 18½ per cent thick Joukowski aerofoil at
= 0 deg, M o = 0.685 by three theoretical methods.
X
D
A
O
C D predicted by := VeBocity dist n
Young and Wint.¢rbo~.tom KGplan
Aef. I Kaplan
Ae~. ! Weber
Ref. A Weber/Wffby
0.012
0 " 0 1 0 - -
C D
0 - 0 0 8 -
I I I
McrOt from appropriate cempressibiUity law
I I I 0 0"Z 0.4 M o 0.6 0.~
FIG. 9. Predicted profile drag for an 18½ per cent thick symmetrical Joukowski aerofoil, a = 0 deg, xt/c = 0'094, R = 10 7.
Dd.129527 K.5
Printed in Wales for Her Majesty's Stationery Office by Aliens Printers (Wales) Ltd.
18
R. & M. No.
((?) Crown coflyright 1968
Published by HER MAJESTY'S STATIONEP.Y OFFICE
To be purchased from 49 High Holborn; London w.c.l 423 Oxford Street, London w.1 13A Castle Street, Edinburgh 2
109 St. Mary Street~ CardiffCFl IJW Brazennose StreeL Manchester 2
50 Fairfax Street, Bristol 1 258 259 Broad Street, Birmingham 1
7 11 Linenhall StreeL Belfast BT2 SAY or through any bookseller
R° & M° NOo
S.O. Code No. 23