The Value of Offshore Secrets: Evidence from the Panama...
50
The Value of Offshore Secrets: Evidence from the Panama Papers James O’Donovan † Hannes F. Wagner ‡ Stefan Zeume †‡ INSEAD Bocconi University University of Michigan First Draft: April 19, 2016 This Draft: May 29, 2017 We thank John Barrios (discussant), Morten Bennedsen, Jennifer Blouin (discussant), Art Cockfield (discussant), Alexander Dyck (discussant), Julian Franks, John Gallemore, Nicola Gennaioli, Jim Hines, Niels Johannesen, Karl Lins, Colin Mayer, Tom Neubig (discussant), Kasper Meisner Nielsen (discussant), Bastian Obermayer (Süddeutsche Zeitung), Marco Ottaviani, Paolo Pasquariello, Kai Petainen, Uday Rajan, Fabiano Schivardi, Andrei Shleifer, Tyler Shumway, Joel Slemrod, Sheridan Titman, and Luigi Zingales for insights that benefitted this paper. We also thank participants at ABFER 2017, the Texas Finance Festival 2017, the Drexel Corporate Governance Conference 2017, the Texas/Waterloo Tax Symposium 2016, the National Tax Association Annual Conference 2016, the Italian Economic Association Annual Conference 2016, and seminar participants at American University, Bonn University, Carnegie Mellon University, Concordia University, McGill University, and the University of Michigan (Finance, Public Finance). We are indebted to the International Consortium of Investigative Journalists for providing access to the Panama Papers data. Zeume gratefully acknowledges financial support from the Mitsui Life Financial Research Center. † Department of Finance, INSEAD, [email protected]. ‡ Department of Finance, Bocconi University, [email protected]. ‡† Department of Finance, University of Michigan, [email protected].
Transcript of The Value of Offshore Secrets: Evidence from the Panama...

The Value of Offshore Secrets: Evidence from the Panama Papers
James O’Donovan† Hannes F. Wagner‡ Stefan Zeume †‡
INSEAD Bocconi University University of Michigan
First Draft: April 19, 2016
This Draft: May 29, 2017
We thank John Barrios (discussant), Morten Bennedsen, Jennifer Blouin (discussant), Art Cockfield (discussant), Alexander Dyck (discussant), Julian Franks, John Gallemore, Nicola Gennaioli, Jim Hines, Niels Johannesen, Karl Lins, Colin Mayer, Tom Neubig (discussant), Kasper Meisner Nielsen (discussant), Bastian Obermayer (Süddeutsche Zeitung), Marco Ottaviani, Paolo Pasquariello, Kai Petainen, Uday Rajan, Fabiano Schivardi, Andrei Shleifer, Tyler Shumway, Joel Slemrod, Sheridan Titman, and Luigi Zingales for insights that benefitted this paper. We also thank participants at ABFER 2017, the Texas Finance Festival 2017, the Drexel Corporate Governance Conference 2017, the Texas/Waterloo Tax Symposium 2016, the National Tax Association Annual Conference 2016, the Italian Economic Association Annual Conference 2016, and seminar participants at American University, Bonn University, Carnegie Mellon University, Concordia University, McGill University, and the University of Michigan (Finance, Public Finance). We are indebted to the International Consortium of Investigative Journalists for providing access to the Panama Papers data. Zeume gratefully acknowledges financial support from the Mitsui Life Financial Research Center. † Department of Finance, INSEAD, [email protected]. ‡ Department of Finance, Bocconi University, [email protected]. ‡† Department of Finance, University of Michigan, [email protected].

The Value of Offshore Secrets: Evidence from the Panama Papers
Abstract
We use the data leak of the Panama Papers on April 3, 2016 to study whether and how the use of offshore shelters affects firm value. We find that the leak erases $135 billion in market capitalization among 397 public firms that we trace as users of offshore vehicles exposed in the leak. These firms use offshore vehicles to finance corruption and aggressively avoid taxes, which increases firm value, but also to expropriate shareholders. Firms implicated by the leak consequently show lower sales from perceptively corrupt regions and lower tax aggressiveness. On net, offshore sheltering enhances firm value by promoting potentially illegal activities that go beyond tax avoidance. Offshore service providers facilitate such activities.
JEL Classification: G32, G38, H25, H26 Keywords: Panama Papers, tax havens, offshore vehicles, corruption, tax evasion.
1
“The archetypal tax haven may be a palm-fringed island, but […] there is nothing small about offshore finance. If you define a tax haven as a place that tries to attract non-resident funds by offering
light regulation, low (or zero) taxation and secrecy, then the world has 50-60 such havens. These serve as domiciles for more than 2m companies and thousands of banks, funds and insurers. Nobody really knows
how much money is stashed away.”
The Economist Feb 13, 2013
Tax haven sheltering is a significant global phenomenon. Estimates of global offshore
assets range from $7-9 trillion (Zucman 2015, BCG 2014) to $21-32 trillion (Tax Justice Network
2012). Among the routine users of tax havens are multinational corporations. In our sample of
23,540 global public firms, almost one in four have subsidiaries in tax havens. For the largest 1,000
global firms, this number increases to three in four. S&P 500 firms are believed to hold $2.4 trillion
offshore.1
Despite their wide-spread use among corporations, little is known about whether corporate
offshore vehicles create firm value or not. Desai, Dyck, and Zingales (2007) provide a theoretical
framework for the costs and benefits of offshore vehicles. In their model, the veil of secrecy
associated with offshore vehicles can reduce value by allowing insiders to divert corporate
resources, for which prominent cases such as Enron and Parmalat provide anecdotal evidence.2 At
the same time, secret offshore vehicles can also create value because they may help reduce
corporate taxes and facilitate making hidden bribe payments to win business.
Providing evidence on the value created by secret offshore activities is challenging
because such activities are inherently unobservable. To tackle this observability problem, we
exploit one of the largest data leaks to date, the 2016 leak of the Panama Papers. On April 3, 2016,
1 Zucman (2015) and BCG (2014) provide estimates for 2014 and 2013, respectively. Estimates by the Tax Justice Network (2010) are for 2010. S&P 500 firms’ cash holdings are estimates from the Economic Policy Institute (2016) for 2015. 2 Enron’s CFO used a sophisticated offshore web to tunnel $42 million out of the firm. Similarly, Parmalat’s founder used offshore entities to expropriate $620 million from the firm.

2
the news media started reporting a leak of confidential documents concerning the business
activities of Mossack Fonseca & Co., a Panama-based law firm and provider of corporate services.
These so-called Panama Papers comprise 11.5 million documents and provide insights into the
operations of roughly 214,000 shell companies that were incorporated in tax havens around the
world over the past 45 years. Thousands of news reports published by over 100 media
organizations with access to the Panama Papers data stress that the use of these offshore vehicles
goes well beyond tax avoidance.3
We use the leaked data to identify publicly listed firms as users of offshore vehicles. In an
event study, we then compare the returns of these firms to those of other firms around dates
relevant to the leak. If sheltering is used for bribe payments or tax evasion, the unexpected leak
should be associated with negative returns among firms exposed to the leak because the leak may
reduce future cash flows from such activities or result in costly regulatory fines for past activities.
If instead offshore structures are used to divert resources out of the firm at shareholders’ expense,
the leak should lead to an increase in value because the transparency brought about by the leak
reduces such activities.
Our empirical analysis is based on a data set of publicly traded firms that we connect to the
Panama Papers. Specifically, we start with 23,540 publicly traded firms from 73 countries. These
firms, obtained from Orbis, have more than 1.3 million subsidiaries across 211 sovereign and non-
sovereign territories and more than 1.8 million directors. We then match the subsidiaries, directors,
and directors of subsidiaries of public firms to the leaked data, which cover 212,845 vehicles, their
144,791 officers, and 12,599 intermediaries. Our matching process, which we describe in detail
3 See, for example, “The Panama Papers: How the world’s rich and famous hide their money offshore,” April 3, 2016, The Guardian (retrieved April 14, 2016).

3
below, identifies 397 public firms as users of offshore vehicles incorporated by Mossack Fonseca
& Co. These firms are spread across the globe and operate in a wide range of industries. The firms
tend to be large, have more international operations, and are more exposed to perceptively corrupt
countries, particularly where country leaders are implicated by name in the leaked data.
Our results show that the 397 firms connected to the Panama Papers experience
significantly negative returns around three event dates associated with the leak. These event dates
are April 3, 2016 (news organizations start reporting the leak), April 26, 2016 (the International
Consortium of Investigative Journalists (ICIJ) announces a database of the leaked data will be
made public), and May 9, 2016 (the database is made public). In economic terms, the leak wiped
out $135 billion in market capitalization among firms with exposure to the revelations in the
Panama Papers.4 This reflects a drop in firm value of 0.7% relative to same-country and same-
industry firms without such exposure. We find that the decline in value is driven by firms for whom
the leak uncovers secret (as opposed to observable) offshore activities and by firms whose offshore
activities are intense and recent.5 Our results also hold in several alternative event study tests.
Next, we examine potential drivers of the change in firm value associated with tax haven
sheltering. Judging from the news reports following the Panama Papers leak, the most prevalent
uses of secret offshore vehicles among publicly traded firms are the financing of corrupt activities
and tax evasion.6 Two examples of large public firms that were linked to corruption by the Panama
Papers received particularly wide news coverage. One firm, a German conglomerate, used offshore
4 For this calculation, we multiply each firm’s market valuation at the end of 2015 by its cumulative abnormal return during our event windows. We obtain quantitatively similar results when we instead multiply firms’ market value at the end of 2015 by the average percentage drop in firm value net of country and industry fixed effects. 5 A further explanation for the drop in firm value might be that firms’ cost of capital increases. However, we do not find evidence of changes in equity betas in firms with Panama Papers exposure. 6 Outside the scope of our paper, the Panama Papers also contain data on the use of offshore vehicles by individuals and legal entities other than publicly traded firms (such as private firms and governing bodies).

4
vehicles, some of them operated by Mossack Fonesca & Co., to run slush accounts that were used
to bribe government officials. Another firm, an Italian contractor, used shell companies
incorporated by Mossack Fonseca & Co. to pay close to $300 million in bribes to win contracts
for oil and gas pipelines. In addition to these cases of violations of anti-bribery regulations, the
leaked data have prompted thousands of national tax evasion investigations and the creation of an
international taskforce involving tax agencies from 30 countries, highlighting that the role of
offshore shelters in reducing taxes goes beyond tax avoidance.7
Considering the corruption channel first, firms may use secret offshore vehicles to finance
bribe payments to win contracts tendered by corruptible government agents, and thereby create
firm value (Beck and Maher 1986, 1989). The leak may result in fines for past violations of anti-
bribery regulations, and the increased threat of discovery may discourage corporations from future
bribes. We find that returns of firms connected to the leak are more negative when firms are also
exposed to perceptively corrupt countries, and to countries where country leaders are identified as
users of secret offshore vehicles in the leaked data. For instance, firms connected to the leak and
with a subsidiary in one of the 13 countries where country leaders are implicated by name are 0.9%
more negatively affected than other firms connected to the leak.
Second, we examine the potential role of taxes. Tax aggressive firms may use secret
offshore vehicles to evade taxes, and thereby create firm value. The leak may result in fines for
past actions or lead to lower future tax aggressiveness. We measure tax aggressiveness as that part
of the statutory tax rate less firms’ effective tax rates that is unexplained by firms’ performance,
7 In January 2017 this taskforce, involving most OECD member countries, met to share results on thousands of investigations sparked by the Panama Papers. No details have been disclosed (see e.g. icij.org/blog/2017/01/tax-agencies-draw-target-list-offshore-enablers). Authorities from 16 countries have publicly stated to have launched civil and criminal tax evasion investigations in relation to the leaked data (as of October 2016: Australia, Canada, Denmark, France, Germany, India, Israel, Malta, Norway, Pakistan, Singapore, Spain, Sri Lanka, Sweden, Thailand, and the United States).

5
as well as industry and country association. Due to the breadth of our sample—over 23,000 firms
headquartered in 73 countries—this metric is general and may capture both tax avoidance and tax
evasion. However, the surge in tax evasion investigations in relation to the leaked data suggests
that the leaked data reveals instances of tax evasion rather than merely instances of legal tax
avoidance.8 We find that tax aggressive firms connected to the Panama Papers are significantly
more negatively affected by the leak.
Having shown how offshore shelters can create firm value, we next examine the potential
of expropriation to destroy value. In poorly governed firms, managers may find it easier to extract
resources for their own gain. If offshore shelters are indeed used to expropriate shareholders, we
expect the leak to reduce such activities, particularly in weakly governed firms. We find precisely
this result: For a range of firm-level governance variables, the negative valuation effect of the leak
diminishes when governance is weak. Further, offshore sheltering should be more costly to
shareholders in countries that feature high expropriation risk. Consistent with this, the negative
effect on firms with exposure to the leak is less pronounced among firms headquartered in such
countries. These results suggest that shareholders benefit from the additional transparency
provided by the leak.
Our interpretation of the overall drop in the value of implicated firms is that offshore
sheltering allows for value enhancing activities such as bribery and tax evasion. The leak destroys
some of that value. Of course, at least some of the negative market response around the leak might
be explained by regulatory fines for past actions. At the same time, we find that the drop in value
also seems to reflect reduced future cash flows: Following the leak, firms with Panama Papers
8 We use the term tax evasion broadly, to include the whole spectrum of actions aimed at reducing taxes, ranging from less aggressive and more likely legal tax avoidance to more aggressive and more likely illegal tax evasion. As Hanlon and Heitzman (2010) note, the degree of legality of tax transactions is often determined after the fact.

6
exposure reduce their tax aggressiveness significantly and experience a reduction in their activities
in perceptively corrupt regions. Sales from perceptively corrupt regions, for instance, decline by 5
to 6% for exposed firms vis-à-vis unexposed control firms.
We also consider two alternative interpretations for the negative market response by firms
exposed in the data leak. First, firms exposed to the Panama Papers are larger and more likely to
have activities in more corrupt countries. These firms may experience negative returns for reasons
related to these characteristics but unrelated to the data leak. Alleviating this concern, our results
are robust in a sub-sample of firms matched on observable firm characteristics. Second, at the time
of the leak, firms’ exposure to tax havens as a risk factor may become more salient for outside
investors. However, we find that firms that have publicly observable offshore subsidiaries in major
tax havens but that are not implicated by the leak are less adversely affected than firms that are
directly implicated by the leaked data.
We contribute to several strands of the literature. To our knowledge, we are the first to
identify almost 400 international corporations, or 1.7 percent of all listed firms, as users of
Mossack Fonseca & Co.’s offshore vehicles. For the vast majority of these—almost four in five—
the existence of these vehicles was likely entirely secret. Prior work has focused on observable
offshore activities, using data on multinational affiliates of firms (Faulkender and Smith 2016),
subsidiaries of U.S. firms from 10-Ks (Dyreng and Lindsey 2009), subsidiaries of global firms
(Bennedsen and Zeume 2017), or detected tax shelter cases from news reports (Graham and Tucker
2006). While self-reported or detected offshore activities help identify costs and benefits
associated with tax haven activity, such observable activities may differ from secret ones along
dimensions that correlate with whether and how they create firm value. We rely on firms that are
detected for an exogenous reason, a leak of the offshore service provider’s data.

7
Additionally, self-reported data generally do not allow analyzing specific illegal activities,
such as financing corruption. The bribery literature has so far documented the effect of bribes on
firms from detected cases (e.g., Karpoff, Lee, and Martin 2008, 2017, Karpoff et al. 2017, and
Cheung, Rau, and Stouraitis 2012) and regulatory changes in the U.K. (e.g., Zeume 2017). We
establish that offshore shelters are one tool that is used to finance bribe payments, in addition to
serving tax motives.9
More broadly, we can estimate the true extent to which firms use secret offshore vehicles.
We provide two illustrations. First, among the world’s largest 1,000 firms, at least 8.4% use secret
offshore vehicles, or one in twelve such firms. Second, since Mossack Fonseca & Co. is not the
only offshore service provider, any estimate of the users of offshore vehicles from the leaked data
will be conservative. One way to address this to consider the relative size of Mossack Fonseca &
Co. Even though estimates of the size of the offshore service market differ, sources agree that the
company held a mere 5-10% of the global market for shell companies at the time of the leak.10 If
firms use offshore service providers mutually exclusively, the use of secret offshore vehicles
therefore lies in between 13% and 26%.11 For comparison, Dyck, Morse, and Zingales (2014)
estimate that roughly one in seven U.S. corporations likely engage in accounting fraud, and
Karpoff, Lee, and Martin (2017) associate one in four U.S. firms with corruption.
9 Hanlon and Heitzman (2010) provide a literature review on tax avoidance, including the use of tax havens. Along similar lines, Tax Information Exchange Agreements (TIEAs), which allow tax authorities to exchange information with tax havens, have been shown to affect round-trip tax evasion (Hanlon, Maydew, and Thornock 2015) and bank deposits (Johannesen and Zucman 2014). Others have documented that tax avoidance, measured by the book-tax gap, is positively associated with firm value among strongly governed firms (Desai and Dharmapala 2005). Hanlon, Lester and Verdi (2015) show that offshore cash holdings of multinational U.S. corporations are associated with suboptimal acquisitions. Individual tax evasion is examined by Slemrod (1985), among others. 10 See, for example, "A torrential leak, " April 9, 2016, The Economist (retrieved April 14, 2016). No revenue data of any type are available for Mossack Fonseca. The global market for corporate services in 2014 was estimated to be roughly $6 billion (EUR 5.6 billion, see Intertrust IPO prospectus, 5 October 2015, p. 120). 11 1.3%/10%=13% and 1.3%/5%=26%. Relaxing the assumption that offshore vehicles are used mutually exclusively would lower the estimate.

8
Finally, our paper contributes to quantifying the economic impact of data leaks. In recent
years, corporate data breaches have increased dramatically in scope and size. Estimating the cost
of a leak is often challenging, especially since the value of affected firms may change due to other
idiosyncratic news. The Panama Papers are unusual in that they affect hundreds of firms through
a leak in an offshore service provider.12 The overall losses of $135 billion in market capitalization
in response to the leak far exceed those attributed to recent major data leaks involving Anthem,
Citigroup, Ebay, Home Depot, JPMorgan Chase, Sony, Target, and Yahoo. The results highlight
that the costs of data breaches can be economically significant.
Taken together, in this paper, we provide novel large-scale evidence on the use of secret
offshore vehicles. Our analysis highlights the role played by offshore service providers, such as
Mossack Fonseca & Co., in facilitating some illegal firm activities. In this highly specialized
market, one determinant of firms’ willingness to pay for offshore services may be that such
services typically create shareholder value when undetected.
1. Institutional setting, data, and methodology
In this section, we discuss the institutional background of the Panama Papers leak. We then explain
our empirical methodology and data sources.
1.1 The Panama Papers data leak
On April 3, 2016, the news media started reporting about a leak of confidential documents
concerning the business activities of Mossack Fonseca & Co., a Panamanian law firm and provider
of corporate services. Known as the Panama Papers, the leak includes 2.6 terabytes of data, or 11.5
12 The literature on whistle blowers, for instance, has relied on collecting information about many individual leaks affecting one firm at a time (e.g., Dyck, Morse, and Zingales 2010). One recent paper has made use of the features of the Panama Papers leak to show that offshore incorporation activity is associated with OECD information exchange initiatives (Omartian 2017).
9
million confidential documents. This makes it one of the largest data leaks to date. The documents
provide insights into the uses of more than 214,000 shell companies in tax havens around the world
over the past 45 years. Of the 214,000 vehicles that appear in Mossack Fonseca & Co.’s files, 90%
were incorporated in just four tax havens: the British Virgin Islands (114,000 firms), Panama
(48,000), the Bahamas (16,000), and the Seychelles (15,000). The remaining entities were
incorporated in Niue (9,600), Samoa (5,300), British Anguilla (3,200), Nevada (1,300), Hong
Kong (450), the United Kingdom (150), and a few other countries.
In our empirical analysis, which we describe in detail below, we consider April 3 as the
earliest of three event dates associated with the leak. It is important to verify whether information
about the leaked data was available to investors prior to April 3, which might cause an
understatement of the economic impact. News stories suggest that the public was unaware of the
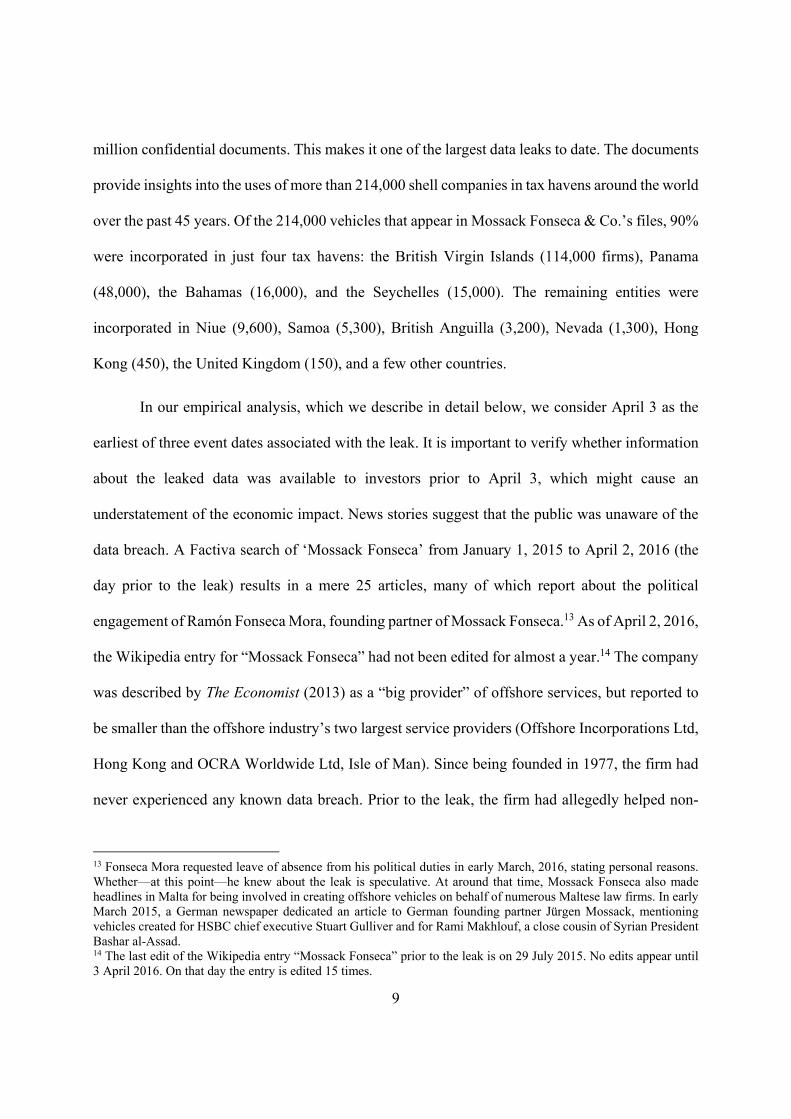
data breach. A Factiva search of ‘Mossack Fonseca’ from January 1, 2015 to April 2, 2016 (the
day prior to the leak) results in a mere 25 articles, many of which report about the political
engagement of Ramón Fonseca Mora, founding partner of Mossack Fonseca.13 As of April 2, 2016,
the Wikipedia entry for “Mossack Fonseca” had not been edited for almost a year.14 The company
was described by The Economist (2013) as a “big provider” of offshore services, but reported to
be smaller than the offshore industry’s two largest service providers (Offshore Incorporations Ltd,
Hong Kong and OCRA Worldwide Ltd, Isle of Man). Since being founded in 1977, the firm had
never experienced any known data breach. Prior to the leak, the firm had allegedly helped non-
13 Fonseca Mora requested leave of absence from his political duties in early March, 2016, stating personal reasons. Whether—at this point—he knew about the leak is speculative. At around that time, Mossack Fonseca also made headlines in Malta for being involved in creating offshore vehicles on behalf of numerous Maltese law firms. In early March 2015, a German newspaper dedicated an article to German founding partner Jürgen Mossack, mentioning vehicles created for HSBC chief executive Stuart Gulliver and for Rami Makhlouf, a close cousin of Syrian President Bashar al-Assad. 14 The last edit of the Wikipedia entry “Mossack Fonseca” prior to the leak is on 29 July 2015. No edits appear until 3 April 2016. On that day the entry is edited 15 times.

10
Panamanian citizens to circumvent tax legislation, yet these allegations were not very specific.
Online sources report that Mossack Fonseca & Co. may have informed some of its clients about
the data breach on Friday, April 1.15 It is unknown who this information may have been passed to;
in any case, we include April 1 in our event period.
Following the leak on April 3, we identify two additional event dates relevant for our
analysis: April 26 and May 9. On Tuesday, April 26, the ICIJ announces that a searchable database
of the leaked data will be made public. On this day, parties who hold any amount of inside
information about the exposure of specific firms learn that this exposure will be revealed to the
public in the near future. On Monday, May 9, 2016, the searchable database is then made available
through ICIJ’s website. The database contains information on all entities incorporated by Mossack
Fonseca, as well as relationship information between entities, and individuals such as shareholders
and directors attached to the entities. We use these data to trace connections to publicly traded
firms, and thus uncover users of offshore vehicles around the world.
1.2 Data and variable construction
We link firms to the Panama Papers leak by combining the ICIJ database with subsidiary
and director data of all publicly listed firms in Bureau van Dijk’s Orbis database as of 2015. Firm
financials and market data are obtained from Datastream/Worldscope and Orbis. We additionally
rely on data from Bloomberg, BNY Mellon, FactSet (Lionshares), KPMG, ICRG, Transparency
International, and the World Bank, among others. We focus on the main variables of interest and
15 Online sources (e.g. https://goo.gl/vS1EHR, accessed on 15 May 2017) report that Mossack Fonseca on Friday 1 April 2016 sent an email to an unknown distribution list. It stated, in English and Spanish, that the firm believed to have been subject to “an unauthorized breach of our email server”. The message did not mention confidential data other than email. Note that the email on 1 April was sent at 3:32pm local time in Panama (Eastern Standard Time), equivalent to 4:32pm local time in New York (Eastern Daylight Time) and therefore 32 minutes after NYSE and Nasdaq market close.

11
provide a complete list with variable definitions in Appendix 1. All firm-level characteristics are
based on pre-April 2016 data to ensure that they are unaffected by the leak.
1.3.1 Exposure to the Panama Papers
The Panama Papers are unique with respect to the opportunity they provide to identify
users of secret offshore vehicles. We use multiple data sets made available by the ICIJ on May 9,
2016, in particular, an "entities" data set containing information on companies, trusts, or funds
created in offshore jurisdictions by Mossack Fonseca & Co., an "officers" data set, with data on
individuals who play a role in the aforementioned entities as directors, investors, or beneficiaries,
and an "intermediaries" data set, with data on middlemen, such as law firms or accountants, who
facilitate the creation and operation of offshore entities. Using Orbis data, we connect these three
ICIJ data sets to publicly listed firms in three ways: to a public firm’s subsidiaries, to a public
firm’s directors, and to the directors of a public firm’s subsidiaries.
We use fuzzy string matching algorithms to match directors and subsidiaries in Orbis to
potentially corresponding data in the three Mossack Fonseca & Co. databases. We require that
subsidiaries and directors in Orbis and in the leaked data share the same headquarters/home
country, while allowing for variations in the spelling of names across data sources. Specifically,
we proceed in two steps, dealing with Orbis subsidiary and officer names separately. First, we
match the Orbis subsidiaries of publicly listed firms to the Mossack Fonseca & Co. data using the
subsidiary name and location. Second, we match directors of publicly listed firms from Orbis to
the Mossack Fonseca & Co. data using the director name and country as identifying information.
We repeat the matching of director names for directors of subsidiaries of publicly listed firms.
After limiting ourselves to data with available address information, this match starts out with

12
212,845 entities, 144,791 officers, and 12,599 intermediaries from ICIJ’s databases and on
1,311,643 subsidiaries and 1,879,048 directors from Orbis.
Next, we aggregate any matches between publicly available data and the leaked data at the
firm level. Our first key variable of interest, Has Panama Papers Exposure, indicates whether (1)
or not (0) any entity, intermediary, or person listed in the leaked documents is connected to a
subsidiary of a firm, a director of a firm, or a director of a firm’s subsidiary. In additional tests, we
disaggregate Has Panama Papers Exposure into Exposure of Observable Activities and Exposure
of Secret Activities. The former requires being connected to an entity listed in the leaked
documents; such links are potentially observable by investors prior to the leak since we can match
the name of the offshore entity with the name of a subsidiary of a listed firm in Orbis. The latter
measure, Exposure of Secret Activities, indicates a more opaque connection: either a subsidiary of
a listed firm is an intermediary or officer in the Panama Papers which is then connected to an entity
(one degree of separation), or a director of a publicly listed company or its subsidiary is recorded
as an intermediary or officer in the Panama Papers which is connected to an entity (two degrees of
separation). Here we consider secrecy to be a function of the number of layers separating a firm
from an offshore vehicle or entity, that is, the number of ways in which a firm can obscure its links
to offshore vehicles.
1.3.2 Measures of firm value
We measure the impact of the data leak on firm value using several alternative models. In
our main specification, we use daily returns for [-1;3] event windows around each of the three
event days of the leak. For Sunday, April 3, a non-trading day, we move the event date to the next
trading day, Monday, April 4.
We obtain daily stock prices from Datastream and apply standard data filters of dropping

13
penny stocks (prices below $0.10), stocks not actively traded (no price changes between March
31, 2016 and April 6, 2016), and firms with assets below $5 million. We winsorize returns at the
1 and 99 percentiles to remove outliers. Besides using raw returns, we calculate one-factor alphas
(i.e., stock returns in excess of market returns after controlling for firms’ exposure to the market
index). Alphas are obtained from a one-factor model estimated for March 4, 2015 to March 3,
2016, i.e., for the year ending one month before the first event date. We require stocks to have at
least 100 non-missing return observations during that period. Local market indices and risk-free
rates are not available for all of the 73 countries in our sample. We therefore obtain stock prices in
U.S. dollars and use the U.S. market index (CRSP Value-Weighted Return) and U.S. T-bill as
market index and risk-free rate, respectively. For additional robustness tests, we expand this to 3-
and 5-factor alphas using data from Kenneth French’s data library.
1.3.3 Other Firm Characteristics
Finally, we construct measures of firms’ exposure to corruption, firms’ tax aggressiveness,
as well as the potential for expropriation.
Has Political 1St Layer Exposure indicates whether (1) or not (0) a firm has at least one
subsidiary in any of the 13 countries where current and former heads of state and heads of
government were implicated by name in the leak by May 9, our last event date. We use subsidiary
data for 2015 from Orbis to identify subsidiaries from Argentina, Georgia, Iceland, Iraq, Italy,
Jordan, Moldova, Pakistan, Qatar, Saudi Arabia, Sudan, Ukraine, and the United Arab Emirates.16
16 As of May 1, 2017, the list of potentially implicated individuals below the level of heads of state/government include politicians, their family members and associates from over 50 countries, including Algeria, Andorra, Angola, Argentina, Azerbaijan, Botswana, Brazil, Cambodia, Canada, Chile, China, Congo (Democratic Republic), Congo (Republic), Ecuador, Ecuador, Egypt, France, Ghana, Greece, Guinea, Honduras, Hungary, Iceland, India, Ireland, Israel, Italy, Ivory Coast, Kazakhstan, Kenya, Malaysia, Malta, Mexico, Morocco, Nigeria, North Korea, Pakistan, Panama, Peru, Poland, Russia, Rwanda, Saudi Arabia, Senegal, South Africa, South Korea, Spain, Sweden, Syria, the U.K., the U.S., Venezuela, and Zambia.
14
To capture the idea that firms exposed to perceptively corrupt countries are more likely to
face corrupt government officials that may request bribe payments, we construct Corruption
Exposure, a dummy variable that is equal to one if a firm is exposed to the most perceptively
corrupt tercile of countries using Transparency International’s Corruption Perception Index.
Tax Aggressiveness is the residual of a regression of firm’s Tax Aggressiveness (Unadj.
Floor) on return on assets where Tax Aggressiveness (Unadj. Floor) is the statutory tax rate at the
country level less a firm’s effective tax rate. The effective tax rate is defined as tax over EBIT;
observations with negative EBIT are denoted as missing. A variation of this measure additionally
controls for industry and country fixed effects when constructing the residual. This metric accounts
for profitability, and industry- and country-specific tax treatments, but as noted earlier, it is
necessarily general as it likely captures both tax avoidance and tax evasion.17
Expropriation can be facilitated by weak institutions and by lack of monitoring. At the
country level, we measure expropriation risk with commonly used indices, including protection of
property rights (Djankov et al. 2010), ICRG country risk ratings (PRS Group), the rule of law (La
Porta et al. 1998), and protection of minority shareholders (The World Bank). These measures
capture the extent to which individuals are protected from expropriation by the government and
insiders. For each index, we construct a dummy variable equal to one if a country ranks above the
median, i.e., has high expropriation risk. All results are robust to using continuous measures
instead.
At the firm level, we use measures of firm governance to capture the degree to which
monitoring affects conflicts of interest between principals and shareholders. We use Foreign
17 Our results are robust to several alternative specifications: i) measuring tax aggressiveness as the statutory tax rate at the country level less a firm’s effective tax rate, ii) controlling for country times industry fixed effects, and iii) using ten-year averages of effective tax rates and profitability to construct our tax aggressiveness measure.
15
Institutional Ownership, shown by Aggarwal et al. (2011) to promote governance, and the
Governance score provided by Bloomberg’s ESG database, a score that aggregates, for a subset
of our sample, governance quality. Further, we measure firms’ exposure to U.S. regulations and
potential enforcement actions. We obtain cross-listings from BNY Mellon, which subject firms to
U.S. regulations (Coffee 1999, 2002, Stulz 1999, Doidge 2004, Doidge, Karolyi, and Stulz 2004
and 2010, and Lel and Miller 2008). We split ADRs into those that are unsponsored (Has
unsponsored ADR) and hence subject to less stringent regulatory requirements and those that are
sponsored (Has sponsored ADR) and hence subject to more stringent requirements. Finally, we
capture exposure to U.S. regulation and enforcement arising from having any U.S. subsidiaries
(Has U.S. Subsidiary).
1.3 Methodology
We use event study techniques to analyze the market response of firms connected to the
Panama Paper data leak around the announcement of the leak. For our baseline results, we run the
following regression:
CARi = α + βPanamaPapersExposurei + γ`Xi + εi , (1)
where CARi denotes the cumulative abnormal return (CAR) of firm i around the three event days
relevant to the leak, PanamaPapersExposurei indicates whether (1) or not (0) our data identify
firms as users of offshore vehicles exposed in the Panama Papers, and Xi contains controls
measured before April 2016, including country and industry fixed effects. The coefficient of
interest, ß, captures whether exposure in the leaked documents impacts firm value. In parts of our
analysis, we augment equation (1) with additional firm characteristics and their interaction with
PanamaPapersExposurei to test whether certain types of activities are priced. We use two-way
clustering (country and industry), and alternative clustering dimensions do not produce more
16
conservative standard errors. To alleviate concerns that event-time clustering may bias coefficient
estimates, we alternatively use calendar time portfolio and Fama-MacBeth approaches as in, for
instance, Schipper and Thompson (1983) and Karpoff and Malatesta (1989).18
To analyze the real implications of the data leak we estimate:
Yi,t = αi + αt + β1 PanamaPapersExposurei x PostLeak + γ`Xi,t + εi,t , (2)
where Yi,t is an outcome for firm i at time t (such as regional sales or tax aggressiveness), αi and αt
denote firm and time fixed effects, and PostLeak is a dummy variable set equal to one for
observations that are made after April 2016. Standard errors are two-way clustered (country and
time).
2. Descriptive statistics
Table 1 provides summary statistics for firms with and without exposure to the leak. Panel
A of Table 1 shows the number of firms identified as users of offshore vehicles, and whether they
are connected to specific vehicles through an entity, a person, or an intermediary. We find that 397
firms, or 1.7% of listed firms worldwide, are users of offshore vehicles associated with Mossack
Fonseca & Co.
-- -- Table 1 about here -- --
Disaggregating the connections, 89 firms (0.4% of the sample) are connected to an entity,
296 firms (1.3% ) are connected to a person, and 86 firms (0.4%) are connected to an intermediary.
Some firms are implicated by the leak through multiple types of connections.
18 Specifically, we construct daily abnormal returns of portfolios of firms that are exposed and unexposed to the Panama Papers over days [-20;144] relative to April 3. We then explain these portfolio returns using date fixed effects, a control for Panama Papers exposure, and event date dummies interacted with Panama Papers exposure. Alternatively, we run seemingly unrelated regressions following equation (1) for every event date in [-20;144] and then establish whether the resulting Panama Papers exposure coefficients are different on relevant event dates.

17
Panel B of Table 1 provides a breakdown by country, with countries ranked in declining
order by fraction of implicated firms. To show the full coverage of the Panama Papers, we also
report the number of times an address in that country appears in the entire leaked data. This allows
for a rough comparison of how frequently offshore vehicles in a given country are used by publicly
traded firms as identified by us, and how frequently offshore vehicles are used in a given country
overall. 19
There is substantial cross-country variation in the fraction of firms that have Panama Papers
exposure. At the top are Hong Kong, with almost one in four firms, and the U.K., with one in nine
firms being offshore vehicle users. Firms from Russia, Belgium, and Austria have user rates of
roughly 5%, while U.S. firms rank around the middle of the class with 2.1% of firms using offshore
vehicles through Mossack Fonseca & Co.
These estimates of how frequently listed firms use offshore vehicles will be conservative
for several reason. First, Mossack Fonseca & Co. is not the only offshore service provider—
sources agree that the company held a mere 5-10% of the global market for shell companies at the
time of the Panama Papers leak—and users of offshore vehicles might therefore go undetected.
The firm’s market share may also have differed across countries. Second, even the Mossack
Fonseca & Co. data, which are virtually perfectly suited for identifying the true owners and users
of secret offshore vehicles, do not always allow identifying ultimate beneficial owners. Offshore
vehicles may use nominee directors, or nominee shareholders, or both, making finding
19 The number of addresses reported in Panel B—240,754—exceed the number of roughly 214,000 vehicles contained in the leaked data. The difference occurs for two reasons. First, we consider addresses of vehicles as well as addresses of officers (144,791) and intermediaries (12,599). Second, 129,481 of these addresses are in territories that are not home to any public firm (mostly tax havens). We exclude those from the Table. Note though that in our analysis, we use these 129,481 addresses to search for connections to public firms, via public firms’ directors, subsidiaries, and directors of subsidiaries. See also Appendix 1.

18
connections to listed firms difficult or impossible.20 Further, we will also be unable to identify
listed firms that are connected to offshore vehicles by specific individuals if those individuals are
not reported in the Orbis data (such as lower level managers). Underestimating the number of
implicated firms might bias our analysis against finding significant announcement returns of the
leak. This is because firms that use secret offshore vehicles but cannot be identified by us will
become part of the control group.
Keeping these data limitations in mind, three alternative rankings that use the data from
Panel B in Table 1 yield additional insights. First, when we alternatively consider the raw address
count of how frequently offshore vehicles in a given country are used (last Column), the countries
ranked at the top are Hong Kong (53,482 addresses), Switzerland (43,411), China (28,104), and
the U.K. (15,909). The U.S. are the 5th highest ranked country with 7,302 addresses. We interpret
this as a rough measure of Mossack Fonseca & Co.’s success in selling offshore services in a
specific country to any type of user, including wealthy individuals and private firms.
Second, we consider the Number of listed firms with Panama Papers Exposure divided by
Number of Panama Papers addresses. This is a rough measure of the fraction of offshore vehicles
that are used by publicly traded firms. Not surprisingly, this ratio is generally low, ranging from
0% in all countries where we find no firms connected to the Panama Papers to roughly 2% in
Norway, Sweden, Austria, and Germany. The U.S. at 1.0% are roughly in the middle again. What
then accounts for the other 98% to 100% of Panama Papers addresses? These are individuals and
(their) private firms: For example, news reports have described hundreds of prominent cases,
20 Offshore vehicles can use nominee directors (i.e., individuals that stand in for the true owners but exercise no real power over the firm since they have separately pre-agreed to act upon instruction of another party), and nominee shareholders (i.e., individuals or companies that stand in for the true shareholders but have no real power, since they have separately pre-agreed to transfer ownership to another party). A package of nominee directors and nominee shareholders, combined with a third party, such as a private bank, handling all interactions with Mossack Fonseca & Co., can hide the identity of the beneficial owner even from Mossack Fonseca itself.

19
including politicians (as mentioned earlier), government officials and their families, athletes,
sports executives, actors and other members of the entertainment industry, business people, and
members of organized crime.21
Third, we consider the number of potential users in a country per 1,000 listed firms
(Number of Panama Papers addresses/Number of listed firms x 1,000). This is a simple measure
of how frequent offshore vehicles are in a country relative to the size of public markets, and could
be interpreted as how deliberately opaque business transactions are structured in an economy.
According to this metric, the top ranked countries are Hong Kong (with 332,186 connections per
1,000 listed firms), Switzerland (206,719 connections), Russia (83,910 connections), and
Argentina (25,603 connections). On this metric, the U.S. are below the global average with 2,083
connections per 1,000 listed firms.
The use of offshore vehicles extends across virtually all the industries, shown in Appendix
2. It is particularly pervasive in Trading, Mining, Restaurants and Hotels, Aircraft Manufacturing,
and Real Estate. Yet, only 5 out of 47 populated Fama-French industries in our sample are free of
offshore vehicle users in the leaked data.
Next, we compare the characteristics of firms with and without a link to the data leak in
Table 2. Firms connected to the leak are substantially larger, have more subsidiaries, and are more
exposed to foreign countries, tax havens, and more corrupt countries. Exposed firms are better
governed, but are not different with respect to measures of tax aggressiveness.
-- -- Table 2 about here -- --
Since firms implicated by the leak are substantially larger, both by assets and market cap,
21 Two of the more prominent collections of individuals connected to the Panama Papers are provided by Wikipedia (Entry: “List of people named in the Panama Papers”) and the ICIJ (panamapapers.icij.org/the_power_players).

20
we match firms by headquarter country and size (nearest neighbor, discarding firms that cannot be
matched within 30% of their respective size). For this matched sample, shown in the last Column
of Table 2, firms with exposure to the Panama Papers are no longer different in terms of foreign
institutional ownership and propensity to be cross-listed. Yet such firms still have substantially
more subsidiaries, and more foreign ones, have more tax haven activity, and are more exposed to
corruption. To alleviate concerns that our results might be explained by firm size, we control for
size throughout our analysis and ensure that our results are robust for matched samples.
3. Market response to the Panama Papers data leak
In this section, we begin by documenting our baseline effect of the leak on firm value,
using cumulative raw and abnormal returns around the leak in an event study and a range of
robustness tests. We next investigate whether this baseline effect of the use of offshore vehicles is
related to these vehicles likely being secret or not, and whether the effect is separate from exposure
to tax havens in general.
3.1 Main result
Table 3 shows the results of our examination of firms’ exposure in the Panama Papers. The
dependent variables in the regressions are Cumulative raw return (Raw Return) and Cumulative
abnormal return (Alpha) around the event dates of the leak. The control variable of interest is Has
Panama Papers Exposure that indicates whether (1) or not (0) a firm is connected to the Panama
Papers. All specifications include country and industry (49 Fama-French industries) fixed effects.
--- Table 3 about here ---
Our analysis shows that firms connected to the Panama Papers have negative cumulative
raw returns during the event window. In Column 1, the raw returns are 1.6% lower for such firms

21
than for same-country, same-industry firms without a connection. Controlling for firm size reduces
the coefficient to 1.0%, but does not affect statistical significance (Column 2).
Firms with Panama Papers exposure tend to have higher market risk, and high-beta firms
may have lower returns during the event period for other reasons. We therefore use Cumulative
abnormal returns (alphas) as our dependent variable; Columns 3 and 4 show that firms exposed in
the leaked data are significantly negatively affected. The economic magnitude is lower at 0.8%
and 0.7%, respectively, and we conservatively treat the lowest estimate of abnormal performance,
0.7%, as our baseline estimate.
Overall, firms connected to Mossack Fonseca & Co. are adversely affected by the
revelations of the Panama Papers, indicating that the offshore vehicles set up by Mossack Fonseca
& Co. generate firm value on average.
3.2 Robustness
We perform a number of robustness tests in Table 4. First, as shown in Panel A Column 1,
results are very similar when we repeat the analysis using a matched sample, alleviating the
concern that large firms might have more negative returns around the event dates (note that we
already control for size in Table 3). Second, to address concerns about event date clustering—all
firms with exposure are affected on the same three dates—we repeat our analysis using a portfolio
approach. We continue to find that exposed firms earn economically and statistically significant
negative returns (Column 2). The economic magnitude of -1.9% is somewhat larger than our
baseline effect, but this method does not control for country and industry fixed effects, and firm
size. Third, we implement a Fama-MacBeth approach, using seemingly unrelated regressions for
abnormal one-day returns for 165 days around relevant event dates. In Column 3 we find that the

22
coefficient for firms with Panama Papers exposure is significantly negative at -1.0% on relevant
event dates. Fourth, our results are robust to not including any control variables (Column 4) and
to using returns adjusted for multiple risk factors (Columns 5 and 6).22
--- Table 4 about here ---
Our analysis so far may not capture the full economic effect of the data leak if we are
missing potentially relevant event dates. Similarly, some or all of the negative event day effect
might revert later. We therefore study CARs before the first and after the last relevant event date.
We also decompose event date CARs into the market response on our three event dates, referring
to them as Day 1, Day 2, and Day 3. The results, shown in Panel B, reveal no significant market
response before the first and after the last event date, and a negative market reaction on all three
days. Day 2, the day on which the ICIJ announced the future publication of a database of the leaked
documents, has the economically largest negative return (0.4%). This result could be related to
parties with (some) inside information about specific firms’ exposure acting on that information
or to outside investors correctly assessing the probabilities that specific firms will be exposed in
the ICIJ database on Day 3.23
In this subsection, we have shown that our results are robust to a range of standard event
study robustness tests. Specifically, our results are not driven by differences between firms with
and without exposure to the leak, event date clustering, or other factors associated with returns.
Also, we are not capturing an effect that reverses subsequent to the event dates. Further unreported
robustness tests, in which we discard firms operating in the financial sectors and match firms
22 While we report results using U.S. factor mimicking portfolios, these results are robust to using several alternative specifications, such as using local factor-mimicking portfolios where available to construct 3- and 5-factor alphas. 23 In (unreported) additional robustness tests, we use annual Tobin’s Q as a long-run measure of firm value from 2010 to 2017. Using panel regressions with year and firm fixed effects, we find that firms with exposure to the leak experience a reduction in Tobin’s Q subsequent to the event.

23
additionally on the number of subsidiaries, reconfirm our insights.
With these robustness tests in mind, we use the specification in Table 3 (Column 4) as our
main specification.
3.3 Characteristics of firms’ connections to offshore activities
Most but not all offshore activities revealed through the Panama Papers were unobservable
prior to the leak. We therefore further investigate whether our main effect—the drop in firm value
with exposure in the Panama Papers—is driven by observable or secret offshore activities. For
these tests, reported in Panel A of Table 5, we distinguish how firms are connected to offshore
vehicles. We capture whether the offshore activities revealed by the leak are likely to have been
entirely secret prior to the leak, or whether outside investors plausibly could have inferred the
existence of these activities from data that is available to all investors prior to the leak.
--- Table 5 about here ---
The results show that the loss in firm value is driven by the revelation of secret activities.
Using the full specification, firms whose secret activities are revealed by the leak lose 0.9% in firm
value, while observable activities do not contribute to a loss in firm value (Column 4). Overall,
this is consistent with investors pricing new information about offshore activities previously
unknown to them.
In an extension to this analysis, we also test whether firms that have more intense ties to
the offshore world are differentially affected (summary statistics are in Appendix 3). For instance,
according to Mossack Fonseca & Co.’s internal data, many vehicles had been “deactivated” at
some point in the past prior to the leak: 62% of firms exposed to the leaked data have active links,
while the remaining 38% of firms deactivated their offshore vehicles an average 7.5 years ago.

24
The use of some offshore vehicles appears to go back decades, and even though the median firm
has exactly one connection to the leaked data, some firms are much more tightly linked. The
average firm has 8.6 connections and one firm has 591 connections. The average firm has 3.3
active connections at the time of the leak. For the average firm these connections go to several
distinct offshore vehicles, but they are almost always established by one or a small number of
officers of the firm, suggesting that specific individuals handle a number of vehicles
simultaneously.
Returning to Table 5, in Panel B we analyze whether the dynamics of these connections
influence the market response. We find that firms with stronger ties to the offshore world (more
connections, more officers involved, more vehicles used) have more negative returns around the
leak. The market response, however, does not significantly depend on whether the vehicle is in
active use (or has been deactivated), or how long ago the use of the offshore vehicle presumably
stopped. This suggests that at least some of the share price decline is driven by expected fines for
actions that these offshore vehicles were used for in the past.
3.4 Panama Papers vs. tax haven exposure
Around the dates relevant to the data leak, exposure to tax havens as a risk factor may have
become more salient for outside investors. Thus, firms with any exposure to tax havens may be
adversely affected around the leak as investors factor in a larger premium for offshore risk. In
Table 6, we show that while there is such a general negative market reaction by firms with tax
haven exposure, the negative market impact on firms exposed in the Panama Papers is statistically
and economically distinct from this general market reaction.
--- Table 6 about here ---

25
Specifically, we create four portfolios for our 23,540 sample firms: (1) firms with Panama
Papers exposure but no actual subsidiaries in any of the top four tax havens used by Mossack
Fonseca & Co. (Panama, British Virgin Islands, Bahamas, and Seychelles); (2) firms that have
such top four tax haven subsidiaries but no exposure to the Panama Papers; (3) firms that have
both top four tax haven subsidiaries and exposure to the Panama Papers, and (4) the vast majority
of firms that have neither. All coefficients have negative signs, but only the Panama Papers
exposure coefficient is statistically significant (Panama Papers exposure and top four tax havens
exposure is larger but not statistically significant). Overall, this is consistent with investors around
the leak discounting exposure to tax havens heavily used by the firm at the center of the leak, but
discounting firms with specific exposure to the Panama Papers even more.
4. Benefits of using secret offshore vehicles
We have so far established that firms exposed to the Panama Papers experience negative
returns around the leak. Next, we examine two possible channels that may explain this negative
market response. Specifically, the leak may negatively affect firm value by diminishing the net
benefits of using offshore vehicles to finance corruption or by decreasing firms’ ability to reduce
their tax burden.
4.1 Financing corruption
On the basis of the Panama Papers, news reports have pointed out that some firms have
used secret offshore vehicles to bribe foreign government officials. We use event study techniques
to test whether corporations use offshore vehicles to finance corruption and whether such activities
create shareholder value.
The results in Panel A of Table 7 show that among firms connected to the Panama Papers,

26
having a subsidiary in a country where government leaders are implicated by name in the data leak
is associated with more negative abnormal returns. The effect is economically significant in the
subset of firms connected to the Panama Papers (Column 1) and additionally statistically
significant in the full sample. Firms with both subsidiaries in countries where government leaders
are implicated and exposure to the Panama Papers experience a reduction in firm value of 1.3%
(Columns 2 and 3).
-- Table 7 about here --
In Columns 4 to 6, we use an alternative measure of exposure to corruption. Firms with
Panama Papers exposure and subsidiaries in the most perceptively corrupt countries are again more
negatively affected. Specifically, having subsidiaries in perceptively corrupt countries and being
exposed to the leak is associated with a 0.9% more negative share price response (Column 6).
The decline in value for firms with exposure to both corrupt countries and the leak may be
explained by expectations that firms will be fined for past violations of anti-bribery regulations,
such as the Foreign Corrupt Practices Act or the U.K. Bribery Act. Indeed, anti-corruption
authorities around the world have started using the leaked data to investigate individuals and firms.
Along similar lines, the leaked data may provide additional information about ongoing anti-bribery
investigations. The two large public firms linked to corruption we cite in the introduction are
examples of this. In both cases, the Panama Papers have provided additional information about
offshore entities already under investigation by anti-corruption authorities, since those vehicles
had been created by Mossack Fonseca & Co.
An additional, but not mutually exclusive, explanation for the decline in value is that
investors expect firms to reduce their future bribery efforts in certain countries. Firms would
plausibly do so since the leak increases the probability of such efforts being detected, or because

27
the leak forces firms to close the offshore vehicles previously used specifically to channel bribe
payments. In this case, we would expect firms implicated by the leak to experience lower sales in
more corrupt regions after the event. We test this possibility by estimating equation (2) using
quarterly data on subsidiaries and their revenues.24
Results are shown in Panel B of Table 7. In a nutshell, we find that after the leak, firms
with exposure to the Panama Papers experience a reduction in economic activity in countries where
country leaders are implicated by the leak and in the most perceptively corrupt countries. For
instance, relative to firms not implicated by the leak, implicated firms lose 5 to 6% of sales in these
regions (Columns 1 and 4). Implicated firms also reduce their subsidiary presence in countries
where country leaders are implicated by the leak (Columns 2 to 3). These estimates of real effects
may be conservative if the impact on firms’ operations is not instantaneous.
Overall, our results are in line with investors’ beliefs that secret offshore vehicles may have
been used to bypass anti-corruption regulations, likely leading to regulatory fines. The leak also
has real implications for revenues from geographies prone to corruption, suggesting the leak
reduces firms’ ability to win business in such countries.
4.2 Tax aggressiveness
Next, we examine whether offshore vehicles create value by helping firms aggressively
avoid taxes. Again, we use event study techniques to test whether tax aggressive firms with
exposure to the leak are differentially affected around the leak. The results are shown in Table 8.
--- Table 8 about here ---
24 The sample consists of 7,538 firms for whom quarterly data on subsidiaries and their revenues are available at least once prior to the data leak (2014Q2 to 2016Q1) and at least once after the data leak (2016Q2 to 2017Q1), that is after the data leak.

28
We find that, among firms connected to the Panama Papers, the ones that are also more tax
aggressive have significantly more negative returns around the leak (Column 1). When we extend
our analysis to the full sample of firms, this effect is still present and statistically significant
(Columns 2 and 3). This latter test alleviates concerns that tax aggressive firms are negatively
affected around the leak for reasons unrelated to the leak. Our results are similar when we use an
alternative tax aggressiveness measure that also incorporates industry- and country characteristics
(Columns 4-6). Economically, a one standard deviation increase in tax aggressiveness is associated
with a 0.7% (=28.6%*2.49%) more negative firm value response in Column 4, and this effect is
similar for the full sample of firms.
These results are consistent with firms being expected to be fined for past tax evasion or
overly aggressive tax avoidance. Indeed, some of the firms that we identify as users of offshore
vehicles have a history of evading or avoiding taxes, and the leaked data provide additional
insights. For instance, in order to avoid high taxes in its home country, one sample firm attributed
profits to offshore vehicles so aggressively that Mossack Fonseca & Co. internally flagged that
firm as a high risk client.
An additional, and again not mutually exclusive, explanation for the documented decline
in value is that firms respond to the leak by becoming less tax aggressive. Firms might do so if,
for instance, the leak makes it easier for tax authorities to question certain tax avoidance schemes.
In this case, we would expect that firms implicated by the leak become less tax aggressive after
the leak. We test this possibility by estimating equation (2) using annual tax aggressiveness data
as the dependent variable.25
25This sample includes 9,163 firms for whom yearly data is available to construct our measures of tax aggressiveness at least once prior to the data leak (fiscal year end before 2016Q2) and at least once after the leak.

29
The results, shown in Panel B of Table 8, confirm the idea that part of the drop in value
reflects a reduction in future tax aggressiveness. To illustrate, using estimates in Column 2, tax
aggressiveness declines by 17% (=4.4%/26.6%) of one standard deviation (by construction the tax
aggressiveness measures have a mean of zero, making the expression of economic effects relative
to the mean less useful) .
In sum, the results suggest that offshore vehicles appear to have been used for aggressive
tax avoidance or even tax evasion. Some of the documented negative share price reaction is
explained by firms becoming less tax aggressive after the leak.
5. Costs of using secret offshore vehicles
In the previous section, we have established two possible channels through which secret
offshore vehicles may create firm value. We now turn to expropriation as the possible cost of using
secret offshore vehicles. In weakly governed firms, we expect expropriation to offset some of the
previously documented benefits, at the expense of shareholders.
5.1 Firm-level evidence
We use measures of firm governance to capture the degree to which monitoring efforts
reduce conflicts of interest between principals and shareholders. In poorly governed firms
managers find it easier to extract resources for their own gain. If offshore shelters are indeed used
to expropriate shareholders, we expect the leak to reduce such activities, particularly in weakly
governed firms. Thus, we expect weakly governed firms to be less negatively affected by the leak.
Repeating the regressions from Section 4 above, we interact Panama Papers exposure with
the five governance characteristics described earlier. Note that for all of our governance measures
lower values indicate weaker governance, and we therefore expect a negative (rather than positive)

30
sign for the interaction term. All results are reported in Panel A of Table 9. Generally, better
governance is associated with more negative returns for firms connected to the Panama Papers. In
Column 1, firms with high foreign institutional ownership are significantly more negatively
affected when implicated in the leaked data, with Aggarwal et al. (2011), among others, showing
that foreign institutional ownership improves governance.
--- Table 9 about here ---
In Column 2, for the subsample for which Bloomberg governance scores are available,
firms with exposure to the leak and high governance scores are more adversely affected by the
leak.26 This, again, is in line with an interpretation in which weakly governed firms are less
adversely affected because the leak shuts down expropriation, while some of the value created
offshore by strongly governed firms is destroyed by the leak. Further, the negative market reaction
is larger for offshore vehicle users that are cross-listed with sponsored ADRs, and that have U.S.
subsidiaries, while there is no incremental effect for firms with unsponsored ADRs (Columns 3-
5).27 Interpreting such U.S. exposure as a sign of better governance that makes expropriation less
likely, this goes in line with our previous results. An alternative interpretation could be the greater
exposure such firms have to potential U.S. regulatory enforcement actions in the wake of the leak.
Examples include fines for violations of the 1977 Foreign Corrupt Practices Act and the 2002
Sarbanes-Oxley Act.
26 Bloomberg, one of the main CSR firm-level data providers, covers around 11,000 listed firms worldwide, of which roughly 3,500 have governance scores and 2,696 overlap with our sample. 27 In line with prior work, we run additional tests where we further distinguish sponsored OTC-traded (Level I) from sponsored exchange-traded (Level II/III) ADRs. As expected, economically, the effect is strongest among firms with exposure to the leaked data and exchange-traded sponsored ADRs. However, the number of firms with both exposure to the Panama Papers and Level II/III ADRs is too small to allow for meaningful statistical tests.
31
Taken together, the results of this subsection are consistent with the view that weakly
governed firms may benefit from the data leak because the leak reduces expropriation.
5.2 Country-level evidence
To support our interpretation of the firm-level results, we next turn to country-level
evidence. We hypothesize that the use of offshore shelters comes at a particularly high cost in
countries where investors face high expropriation risk and low levels of investor protection. The
leak should make expropriation observable and harder to maintain in the future, and therefore
benefit outside shareholders, more so in countries that feature high expropriation risk. We test this
by augmenting our main specification by several country-level measures associated with
expropriation risk and investor protection. This setup allows us to compare firms implicated by
the leak to other firms headquartered in the same country.
The results confirm that the negative effect on firms with exposure to the leak is less
pronounced in countries with high expropriation risk and low investor protection. Specifically,
firms both implicated by the leak and headquartered in countries with weak property rights, low
ICRG score, weak rule of law, and substantial executive transfers are less adversely affected (Table
9 Columns 1 to 4). We do not find a differential effect on firm value for firms in countries with
higher economic development (Column 5), suggesting that our measures of expropriation risk and
investor protection do not merely reflect economic development.
In sum, the results of this subsection suggest that offshore shelters are used for
expropriation, at the cost of shareholders. The leak reduces some of that cost.

32
6. Conclusion
Consistent with the notion that firms use secret offshore vehicles to create shareholder
value, we find that the leak of the Panama Papers on April 3, 2016 erased $135 billion in market
capitalization among 397 firms that can be directly linked to offshore vehicles in tax haven. The
decline in firm value is more pronounced among firms that are exposed to perceptively corrupt
countries and tax aggressive firms. This suggests that offshore vehicles are used to finance
corruption and to aggressively reduce taxes, which, on its own, creates firm value. Firms
implicated in the leak consequently show reduced economic activity in perceptively corrupt
countries and less tax aggressive behavior. However, some of the benefits of using offshore
shelters are offset by diversion of firm resources by insiders, who appear to take advantage of the
deliberately opaque structures that offshore vehicles create.
Overall, our paper provides support for anecdotal evidence about the use of secret offshore
vehicles for activities that are at least partially illegal. Offshore service providers—such as
Mossack Fonseca & Co.—play an important role in facilitating such activities. A natural extension
of this research agenda is to analyze spillover effects of the leak on direct competitors of implicated
firms. The use of secret offshore vehicles may also have important welfare implications.
Ultimately, even though tax havens may foster regional growth (Desai, Foley, and Hines 2004),
their role in facilitating hidden bribe payments, for example, may contribute to the substantial costs
of corruption.28
28 Corruption is estimated to cost $2.6 trillion or 5% of global GDP per year (2001-2002 survey data, World Bank Institute) and has been shown to reduce investment and growth (Mauro 1995). Shleifer and Vishny (1993), Bardhan (1997), and Svensson (2005) provide reviews of the corruption literature.
33
References
Aggarwal, Reena, Isil Erel, Miguel A. Ferreira, and Pedro Matos. 2011. Does governance travel around the world? Evidence from institutional investors. Journal of Financial Economics 100, 154-181.
Bardhan, Pranab. 1997. Corruption and development: A review of issues. Journal of Economic Literature 35, 1320-1346.
BCG. 2014. Global Wealth 2014: Riding a Wave of Growth. Boston Consulting Group.
Beck, Paul J., and Michael W. Maher. 1986. A comparison of bribery and bidding in thin markets. Economic Letters 20, 1–5.
Beck, Paul J., and Michael W. Maher. 1989. Competition, regulation and bribery. Managerial and Decision Economics 10, 1–12.
Bennedsen, Morten and Stefan Zeume. 2017. Corporate Tax Havens and Transparency. University of Michigan Working Paper.
Cheung, Yan Leung, P. Raghanvendra Rau, and Aris Stouraitis. 2012. How much do firms pay as bribes and what benefits do they get? Evidence from corruption cases worldwide. NBER Working Paper.
Coffee, John. 1999. The future as history: The prospects for global convergence in corporate governance and its implications. Northwestern University Law Review 93, 641–708.
Coffee, John. 2002. Racing towards the top? The impact of cross-listings and stock market competition on international corporate governance. Working paper, Columbia University.
Desai, Mihir A. and Dhammika Dharmapala. 2005. Corporate Tax Avoidance and Firm Value. NBER Working Paper.
Desai, Mihir A., Alexander Dyck, and Luigi Zingales. 2007. Theft and taxes. Journal of Financial Economics 84, 591–623.
Desai, Mihir A., C. Fritz Foley, and James R. Hines. 2004. Economic Effects of Regional Tax Havens. NBER Working Paper.
Djankov, Simeon, Tim Ganser, Caralee McLiesh, Rita Ramalho, and Andrei Shleifer. 2010. The effect of corporate taxes on investments and entrepreneurship. American Economic Journal: Macroeconomics 2, 31-64.
Doidge, Craig. 2004. U.S. cross-listings and the private benefits of control: Evidence from dual-class firms. Journal of Financial Economics 72, 519–553.
Doidge, Craig, G. Andrew Karolyi, and Rene M. Stulz. 2004. Why are foreign firms listed in the U.S. worth more? Journal of Financial Economics 71, 205–238.

34
Doidge, Craig, G. Andrew Karolyi, and Rene M. Stulz. 2010. Why Do Foreign Firms Leave U.S. Equity Markets? Journal of Finance 65, 1507–1553.
Dyck, Alexander, Adair Morse, and Luigi Zingales. 2010. Who Blows the Whistle on Corporate Fraud? Journal of Finance 65, 2213-2253.
Dyck, Alexander, Adair Morse, and Luigi Zingales. 2014. How Pervasive is Corporate Fraud? NBER Working Paper.
Dyreng, Scott D., and Bradley P. Lindsey. 2009. Using financial accounting data to examine the effect of foreign operations located in tax havens and other countries on U.S. multinational firms’ tax rates. Journal of Accounting Research 47, 1283–1316.
Economic Policy Institute. 2016. Corporate tax chartbook. Economic Policy Institute.
Economist, The. 2013. The missing $20 trillion. 16 February 2013, The Economist.
Faulkender, Michael, and Jason Smith. 2016. Taxes and leverage at multinational corporations. Journal of Financial Economics 122, 1-20.
Graham, John R., and Alan L. Tucker. 2006. Tax shelters and corporate debt policy. Journal of Financial Economics 81, 563–594.
Hanlon, Michelle, and Shane Heitzman. 2010. A review of tax research. Journal of Accounting and Economics 50, 127–178.
Hanlon, Michelle, Rebecca Lester, and Rodrigo S. Verdi. 2015. The effect of repatriation tax costs on U.S. multinational investment. Journal of Financial Economics 116, 179-196.
Hanlon, Michelle, Edward L. Maydew, and Jacob R. Thornock. 2015. Taking the long way home: U.S. tax evasion and offshore investments in U.S. equity and debt markets. Journal of Finance 70, 257–287.
Johannesen, Niels, and Gabriel Zucman. 2014. The end of bank secrecy? An evaluation of the G20 tax crackdown. American Economic Journal: Economic Policy 6, 65–91.
Karpoff, Jonathan M., Allison Koester, D. Scott Lee, and Gerald S. Martin. 2017. Proxies and Databases in Financial Misconduct Research. The Accounting Review, forthcoming.
Karpoff, Jonathan M., D. Scott Lee, and Gerald S. Martin. 2008. The Cost to Firms of Cooking the Books. Journal of Financial and Quantitative Analysis 43, 581-612.
Karpoff, Jonathan M., D. Scott Lee, and Gerald S. Martin. 2017. The value of foreign bribery to bribe-paying firms. University of Washington Working Paper.
Karpoff, Jonathan M. and Paul H. Malatesta. 1989. The wealth effects of second-generation state takeover legislation. Journal of Financial Economics 25, 291-322.

35
Lel, Ugur, and Darius P. Miller. 2008. International Cross-Listing, Firm Performance, and Top Management Turnover: A Test of the Bonding Hypothesis. Journal of Finance 63, 1897–1937.
La Porta, Rafael, Florencio Lopez-de-Silanes, Andrei Shleifer, and Robert W. Vishny. 1998. Law and Finance. Journal of Political Economy 1998. 1113-1155.
Mauro, Paolo. 1995. Corruption and growth. Quarterly Journal of Economics 110, 681-712.
Mironov, Maxim. 2013. Taxes, theft, and firm performance. Journal of Finance 68, 1441–1472.
Omartian, James. 2017. Tax Information Exchange and Offshore Entities: Evidence from the Panama Papers. UNC Working Paper.
Schipper, Katherine and Rex Thompson. 1983. The impact of merger-related regulations on the shareholders of acquiring firms. Journal of Accounting Research 21, 184-221.
Shleifer, Andrei and Robert W. Vishny. 1993. Corruption. Quarterly Journal of Economics 108, 599-617.
Slemrod, Joel. 1985. An Empirical Test for Tax Evasion. Review of Economic and Statistics 67, 232-238.
Stulz, Rene. 1999. Globalization, corporate finance, and the cost of capital. Journal of Applied Corporate Finance 26, 3–28.
Svensson, Jakob. 2005. Eight questions about corruption. Journal of Economic Perspectives 19, 19-42.
Zeume, Stefan. 2017. Bribes and Firm Value. Review of Financial Studies 30, 1457-1489.
Zucman, Gabriel. 2015. The Hidden Wealth of Nations. University of Chicago Press.

36
Table 1
Summary statistics
This table provides summary statistics of firms implicated by the leak. Panel A shows the number of firms connected to the Panama Papers by legal entity, person, or intermediary. Details on the procedure to establish these connections are in Appendix 1. Panel B provides the number and fraction of firms by country along with the total number of legal entities, persons, or intermediaries in the leak with address in each country for countries with at least 50 firms; countries with fewer than 50 firms are aggregated to Rest of the World. All variables are defined in Appendix 1.
Panel A: Firms implicated by the leak
Firm is connected to offshore vehicle via N Firms N Firms w/exposure % w/exposureA legal entity (shell) 23,540 89 0.38% A person 23,540 296 1.26% An intermediary 23,540 86 0.37% Any of the three 23,540 397 1.69% Panel B: Firms implicated by the leak by country
Country N Firms
N Panama Papers
Exposure
Fraction Panama Papers
Exposure
N Panama Papers
Addresses
Country N Firms
N Panama Papers
Exposure
Fraction Panama Papers
Exposure
N Panama Papers
Addresses
Hong Kong 161 37 23.0 53,482 Turkey 279 1 0.4 774U.K. 1,080 124 11.5 15,909 Poland 352 1 0.3 305Russia 100 5 5.0 8,391 Japan 3,442 1 0.0 432Belgium 108 5 4.6 386 Argentina 63 0 0.0 1,613Austria 66 3 4.6 132 Brazil 251 0 0.0 3,806Italy 216 7 3.2 1,493 Bulgaria 83 0 0.0 164France 551 17 3.1 1,233 Chile 111 0 0.0 384Australia 587 15 2.6 1,232 Croatia 71 0 0.0 36Greece 81 2 2.5 632 Egypt 89 0 0.0 349Germany 493 12 2.4 526 Finland 115 0 0.0 111Spain 124 3 2.4 2,122 Indonesia 56 0 0.0 1,080Singapore 305 7 2.3 6417 Korea 1,681 0 0.0 188Philippines 90 2 2.2 424 Kuwait 73 0 0.0 231U.S. 3,506 75 2.1 7,302 N. Zealand 90 0 0.0 411Netherlands 107 2 1.9 487 Pakistan 129 0 0.0 226Israel 326 6 1.8 1,752 Peru 91 0 0.0 1,725Norway 127 2 1.6 113 Romania 55 0 0.0 104Sweden 257 4 1.6 225 S. Africa 179 0 0.0 2,082Canada 696 9 1.3 1267 Sri Lanka 117 0 0.0 28China 2,269 28 1.2 28,104 Switzerland 210 0 0.0 43,411Mexico 109 1 0.9 344 Thailand 206 0 0.0 1,923Denmark 111 1 0.9 74 Vietnam 385 0 0.0 112Malaysia 602 4 0.7 1,534 Rest of world 637 10 1.6 40,779Taiwan 1,120 7 0.6 6,467 India 1,583 6 0.4 432 Total 23,540 397 1.7 240,754

37
Table 2
Univariate analysis
This table shows characteristics of firms with and without exposure to the Panama Papers. The Column labeled Difference all captures the difference in means between the two groups for the full sample of firms. The Column labeled Difference matched captures the difference in means between firms with exposure and matched firms (with replacement). Firms are matched by country and closest neighbor by size. Firms without match within 30% of size are discarded. All variables are defined in Appendix 1. All continuous variables are winsorized at the 1% and 99% levels. *,**, and *** indicate statistical significance at the 10%, 5%, and 1% levels, respectively.
Firms with Panama
Papers Exposure Firms without Panama Papers
Exposure
Difference all
Difference matched
N Firms Mean N Firms Mean Firm characteristics Total assets ($mn) 397 91,642 23,143 5,421 86,200*** 13,830 N subsidiaries 397 155.0 23,143 20.3 134.7*** 89.0*** Has foreign subsidiary (1/0) 397 0.914 23,143 0.439 0.475*** 0.21*** Perc. foreign subsidiaries 397 0.478 23,143 0.204 0.274*** 0.16*** N foreign subsidiaries 397 16.9 23,143 2.9 14.0*** 9.16*** Has TOP4 Tax Haven Exposure 397 0.335 23,143 0.041 0.294*** 0.19*** Corruption exposure measures Corruption Exposure (1/0) 396 0.449 23,083 0.146 0.304*** 0.24*** Political 1st Layer Exposure (1/0) 397 0.320 23,143 0.060 0.259*** 0.18*** Tax Aggressiveness Measures Tax Aggressiveness (Unadj. Floor) 310 0.176 15,508 0.173 0.004 0.01 Tax Aggressiveness (no FE) 310 -0.003 15,508 0.000 -0.003 -0.01 Tax Aggressiveness (FE) 310 -0.012 15,508 0.000 -0.012 -0.01
Governance measures Foreign institutional ownership 324 0.132 17,434 0.055 0.077*** 0.01 Governance score 168 56.6 2,528 49.1 7.5*** 3*** Has sponsored ADR (1/0) 397 0.191 23,143 0.037 0.155*** 0.02 Has unsponsored ADR (1/0) 397 0.164 23,143 0.049 0.115*** 0.04 Has U.S. subsidiary (1/0) 397 0.413 23,143 0.176 0.237*** 0.10***

38
Table 3
Abnormal returns of firms implicated by the leak
This table provides returns of listed firms around the leak. The dependent variable is Cumulative raw return (Raw Return) in Columns 1 and 2 and Cumulative abnormal return (Alpha) in Columns 3 and 4. Returns are cumulated over days around three dates related to the data leak, the event window is [-1;3] with respect to each date. Has Panama Papers Exposure indicates whether (1) or not (0) any entity, intermediary, or person listed in the leaked Mossack Fonseca & Co. documents is connected to a subsidiary of a firm in our sample, an officer of a firm in our sample, or an officer of a sample firm’s subsidiary. Size is the natural logarithm of a firm’s assets in $000s. Appendix 1 provides variable definitions. All continuous variables are winsorized at the 1% and 99% levels. Country and industry fixed effects (49 Fama–French industries ) are included as indicated. Standard errors are clustered at the country and industry level (2-way cluster). t-statistics are in parentheses; *, **, and *** denote significance at the 10%, 5%, and 1% levels, respectively. (1) (2) (3) (4)Dependent variable Raw Return Raw Return Alpha Alpha Has Panama Papers Exposure -1.601*** -0.999*** -0.820* -0.694*** (-2.89) (-2.58) (-1.95) (-2.62) Size -0.263*** -0.055 (-3.23) (-0.56) Country FE Yes Yes Yes YesIndustry FE Yes Yes Yes YesN 23,540 23,540 23,540 23,540Adj. R2 0.167 0.170 0.094 0.094

39
Table 4
Robustness
This table provides results of a range of robustness tests of the main specification (Table 3, Column 4). Has Panama Papers Exposure (PPE) indicates whether (1) or not (0) a firm is connected to the Panama Papers, as defined in Table 3. In Panel A, Column 1 matches firms exposed to the Panama Papers to non-exposed firms by country and size with replacement. Column 2 uses a portfolio approach. Portfolios of PPE firms and non-PPE firms are formed on day [-20] relative to April 3 and returns are calculated for all dates through to day 144. The resulting daily returns of the two portfolios are regressed on PPE fixed effects, calendar day fixed effects, and the interaction between PPE and event dates. In square brackets is the economic magnitude, obtained by multiplying the coefficients by 15, the number of days in the event period. Column 3 uses a Fama-MacBeth approach, where the specification from Table 3 Column 4 is run individually for each day [-20;144] around the main event date. The resulting PPE coefficients are then regressed on dummy variables indicating relevant event days. In Column 4, the main specification is estimated without controls. The dependent variables in Columns 5 and 6 are alphas obtained from 3- and 5-factor models based on U.S. factor-mimicking portfolios (from Kenneth French’s Data Library). In Panel B, the dependent variable is the Cumulative abnormal return (Alpha) for various event windows. In Columns 2 to 4, Cumulative abnormal returns are calculated over trading days [-1;3] around April 3, April 26, and May 9, 2016, respectively. Before and After denote event windows that comprise the three trading weeks before Event Day 1 and the three trading weeks after Event Day 3. Appendix 1 provides detailed variable definitions. All continuous variables are winsorized at the 1% and 99% levels. Fixed effects as well as a size control are included as indicated. Standard errors are clustered at country and industry level (2-way cluster) with the exceptions of the portfolio approach and the Fama MacBeth approach (robust standard errors). t-statistics are in parentheses; *, **, and *** denote significance at the 10%, 5%, and 1% levels, respectively.
Panel A: Alternative models
(1) (2) (3) (4) (5) (6) Model Matched
Sample Portfolio Approach
Fama-MacBeth 1-Factor Alpha
3-Factor Alpha
5-Factor Alpha
Has PPE x Event day -0.642** -0.127** -0.066** -1.247** -0.932*** -1.105*** (-2.33) (-2.33) (-2.11) (-2.01) (-3.00) (-3.31) [-1.900%] [-0.985%] Controls Yes No No No Yes Yes PPE FE No Yes No No No No Day FE No Yes No No No No Country FE No No No No Yes Yes Industry FE No No No No Yes Yes N 754 330 165 23,540 23,540 23,540Adj. R2 0.014 0.369 0.021 0.000 0.175 0.151 Panel B: Alternative subsamples
(1) (2) (3) (4) (5) Dependent var. 1-Factor alpha 1-Factor alpha 1-Factor alpha 1-Factor alpha 1-Factor alpha Period Before Event Event
Day 1 Event Day 2
Event Day 3
After Event
Has PPE -0.001 -0.156 -0.408* -0.142 0.059 (-0.00) (-0.87) (-1.66) (-1.16) (0.18) Controls Yes Yes Yes Yes Yes Country FE Yes Yes Yes Yes Yes Industry FE Yes Yes Yes Yes Yes N 23,500 23,540 23,091 22,980 23,365 Adj. R2 0.078 0.086 0.050 0.140 0.060

40
Table 5
Secret and observable offshore activities
This table provides returns of listed firms around the leak. In Panel A, the dependent variable is Cumulative raw return in Columns 1 and 2 and Cumulative abnormal return in Columns 3 and 4 as defined in Table 3. Exposure of Secret Activity [Exposure of Observable Activity] is a dummy variable that takes a value of 1 if a person or an intermediary [an entity] listed in the leaked data is connected to a subsidiary of a firm in our sample, an officer of a firm in our sample, or an officer of a sample firm’s subsidiary, but if no entity [person or intermediary] in the leaked data is connected to a subsidiary of a firm in our sample, an officer of a firm in our sample, or an officer of a sample firm’s subsidiary. Both Types of Exposure is a dummy variable that takes a value of 1 if both an entity and a person or an intermediary in the leaked data are connected to one of our sample firms. In Panel B, the dependent variable is Cumulative abnormal return as defined in Table 3. Has Panama Papers Exposure (PPE) indicates whether (1) or not (0) a firm is connected to the Panama Papers, as defined in Table 3, Interaction denotes the interaction between Has PPE and characteristics of the firm’s connection to the Panama Papers. In Columns 1-3, the characteristics are, respectively, the natural logarithm of one plus the number of distinct connections between firm and leaked data, the number of distinct firm officers connected to the leaked data, and the number of distinct vehicles a firm is connected to. In Column 4, Has PPE is interacted with a Dummy variable equal to one if a firm has at least one connection to an offshore vehicle that has not been deactivated, and in Column 5, with the natural logarithm of one plus the number of years since the last vehicle was deactivated (zero if at least one connection is still active). Appendix 1 provides detailed variable definitions. All continuous variables are winsorized at the 1% and 99% levels. Country and industry fixed effects (Fama–French 49) as well as a control for size are included as indicated. Standard errors are clustered at country and industry level (2-way cluster). t-statistics are given in parentheses; *, **, and *** denote significance at the 10%, 5%, and 1% levels, respectively.
Panel A: Secret and observable connections (1) (2) (3) (4) Dependent variable Raw Return Raw Returns Alpha Alpha
Exposure of Observable Activity -0.005 0.465 0.399 0.496 (-0.01) (0.76) (0.61) (0.73)
Exposure of Secret Activity -1.937*** -1.322*** -1.068** -0.941*** (-3.52) (-3.62) (-2.42) (-3.63)
Both Types of Exposure -1.244 -0.528 -0.641 -0.493 (-1.03) (-0.53) (-0.92) (-0.90)
Size -0.262*** -0.054 (-3.23) (-0.56)
Country FE Yes Yes Yes Yes Industry FE Yes Yes Yes Yes N 23,540 23,540 23,540 23,540 Adj. R2 0.167 0.170 0.094 0.094
Panel B: Type and strength of connection (1) (2) (3) (4) (5) Number
of connections (Log)
Number of distinct officers connected (Log)
Number of distinct vehicles connected (Log)
Connection is active (1/0)
Years since deactivation (Log)
Has PPE 0.041 -0.269 0.047 -0.076 -0.638 (0.13) (-1.10) (0.14) (-0.15) (-1.61)
Interaction -1.088*** -0.878*** -1.102*** -1.003 -0.058 (-2.98) (-3.74) (-2.99) (-1.24) (-0.21)
Controls Yes Yes Yes Yes Yes Industry FE Yes Yes Yes Yes Yes Country FE Yes Yes Yes Yes Yes N 23,540 23,540 23,540 23,540 23,540 Adj. R2 0.094 0.094 0.094 0.094 0.094

41
Table 6
Exposure to the data leak and tax haven use
This table provides returns of publicly listed firms around the leak. The dependent variable is Cumulative raw return in Columns 1 and 2 and Cumulative abnormal return in Columns 3 and 4 as defined in Table 3. Has Panama Papers Exposure indicates whether (1) or not (0) a firm is connected to the Panama Papers, as defined in Table 3. TOP4 Tax Haven indicates whether (1) or not (0) a firm has at least one subsidiary in any of the four main tax havens used by Mossack Fonseca & Co. (Panama, British Virgin Islands, Bahamas, Seychelles). Has Panama Papers, no TOP4 Tax Haven is a dummy variable equal to 1 if a firm is connected to the Panama Papers but has no subsidiary in any TOP4 tax haven. No Panama Papers Exposure, has TOP4 Tax Haven is a dummy variable equal to 1 if a firm is not connected to the Panama Papers but has a subsidiary in a TOP4 haven. Has Panama Papers Exposure, has TOP4 Tax Haven is a dummy variable equal to 1 if a firm is both connected to the Panama Papers and has a subsidiary in a TOP4 tax haven. Appendix 1 provides detailed variable definitions. All continuous variables are winsorized at the 1% and 99% levels. Country and industry fixed effects (49 Fama–French industries), as well as a control for size are included as indicated. Standard errors are clustered at country and industry level (2-way cluster). t-statistics are given in parentheses; *, **, and *** denote significance at the 10%, 5%, and 1% levels, respectively.
(1) (2) (3) (4) Dependent variable Raw
Returns Raw
Returns Alpha Alpha
Has Panama Papers Exposure -1.055*** -0.728*** (-2.64) (-2.69)
Has Panama Papers Exposure, no TOP4 Tax Haven -0.964*** -0.616*** (-3.35) (-2.59)
No Panama Papers Exposure, has TOP4 Tax Haven -0.403 -0.407 -0.243 -0.248 (-1.50) (-1.50) (-1.08) (-1.10)
Has Panama Papers Exposure, has TOP4 Tax Haven -1.246 -0.963 (-1.27) (-1.27)
Controls Yes Yes Yes Yes Industry FE Yes Yes Yes Yes Country FE Yes Yes Yes Yes N 23,540 23,540 23,540 23,540 Adj. R2 0.170 0.170 0.094 0.094
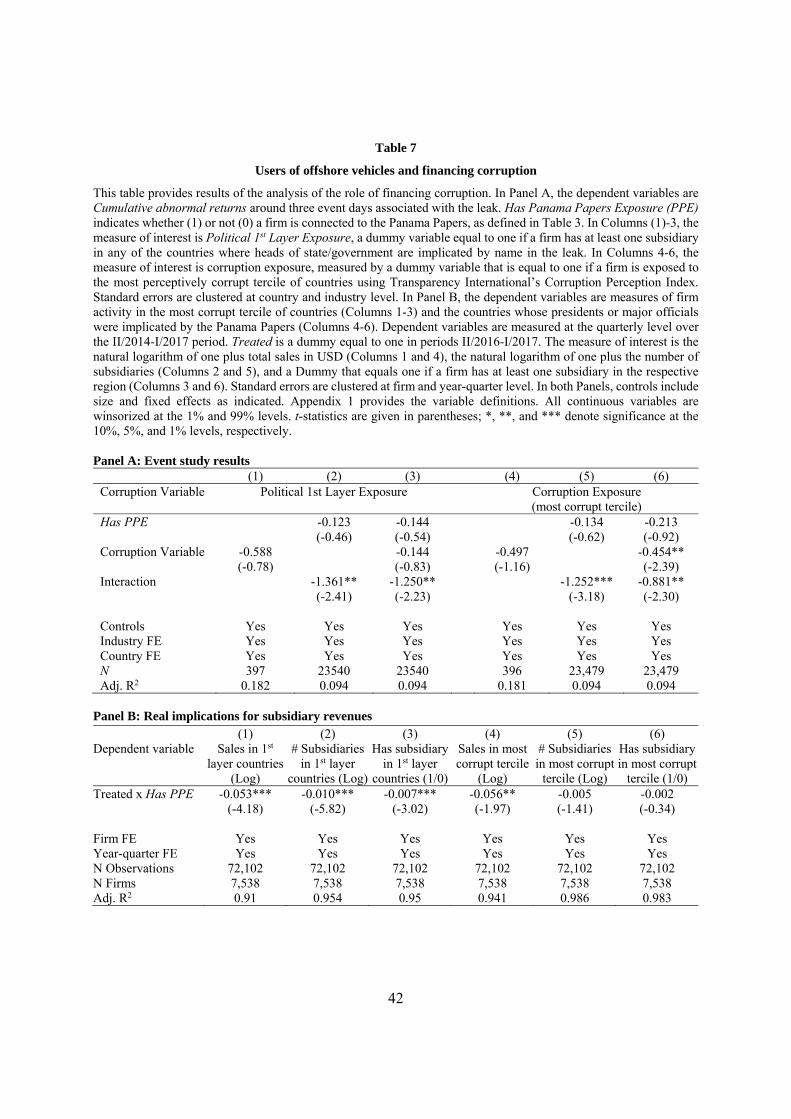
42
Table 7
Users of offshore vehicles and financing corruption
This table provides results of the analysis of the role of financing corruption. In Panel A, the dependent variables are Cumulative abnormal returns around three event days associated with the leak. Has Panama Papers Exposure (PPE) indicates whether (1) or not (0) a firm is connected to the Panama Papers, as defined in Table 3. In Columns (1)-3, the measure of interest is Political 1st Layer Exposure, a dummy variable equal to one if a firm has at least one subsidiary in any of the countries where heads of state/government are implicated by name in the leak. In Columns 4-6, the measure of interest is corruption exposure, measured by a dummy variable that is equal to one if a firm is exposed to the most perceptively corrupt tercile of countries using Transparency International’s Corruption Perception Index. Standard errors are clustered at country and industry level. In Panel B, the dependent variables are measures of firm activity in the most corrupt tercile of countries (Columns 1-3) and the countries whose presidents or major officials were implicated by the Panama Papers (Columns 4-6). Dependent variables are measured at the quarterly level over the II/2014-I/2017 period. Treated is a dummy equal to one in periods II/2016-I/2017. The measure of interest is the natural logarithm of one plus total sales in USD (Columns 1 and 4), the natural logarithm of one plus the number of subsidiaries (Columns 2 and 5), and a Dummy that equals one if a firm has at least one subsidiary in the respective region (Columns 3 and 6). Standard errors are clustered at firm and year-quarter level. In both Panels, controls include size and fixed effects as indicated. Appendix 1 provides the variable definitions. All continuous variables are winsorized at the 1% and 99% levels. t-statistics are given in parentheses; *, **, and *** denote significance at the 10%, 5%, and 1% levels, respectively. Panel A: Event study results
(1) (2) (3) (4) (5) (6) Corruption Variable Political 1st Layer Exposure Corruption Exposure
(most corrupt tercile) Has PPE -0.123 -0.144 -0.134 -0.213 (-0.46) (-0.54) (-0.62) (-0.92) Corruption Variable -0.588 -0.144 -0.497 -0.454** (-0.78) (-0.83) (-1.16) (-2.39) Interaction -1.361** -1.250** -1.252*** -0.881** (-2.41) (-2.23) (-3.18) (-2.30) Controls Yes Yes Yes Yes Yes Yes Industry FE Yes Yes Yes Yes Yes Yes Country FE Yes Yes Yes Yes Yes Yes N 397 23540 23540 396 23,479 23,479 Adj. R2 0.182 0.094 0.094 0.181 0.094 0.094
Panel B: Real implications for subsidiary revenues (1) (2) (3) (4) (5) (6) Dependent variable Sales in 1st
layer countries (Log)
# Subsidiaries in 1st layer
countries (Log)
Has subsidiary in 1st layer
countries (1/0)
Sales in most corrupt tercile
(Log)
# Subsidiaries in most corrupt
tercile (Log)
Has subsidiary in most corrupt
tercile (1/0) Treated x Has PPE -0.053*** -0.010*** -0.007*** -0.056** -0.005 -0.002 (-4.18) (-5.82) (-3.02) (-1.97) (-1.41) (-0.34) Firm FE Yes Yes Yes Yes Yes Yes Year-quarter FE Yes Yes Yes Yes Yes Yes N Observations 72,102 72,102 72,102 72,102 72,102 72,102 N Firms 7,538 7,538 7,538 7,538 7,538 7,538 Adj. R2 0.91 0.954 0.95 0.941 0.986 0.983

43
Table 8
Users of offshore vehicles and tax aggressiveness
This table provides results of the analysis of the role of tax aggressiveness. In Panel A, the dependent variables are Cumulative abnormal returns around three event days associated with the leak. Has Panama Papers Exposure (PPE) indicates whether (1) or not (0) a firm is connected to the Panama Papers, as defined in Table 3. In Columns 1-3, Tax Aggressiveness (constructed without FE) is the residual of a regression of firm’s Tax Aggressiveness (Unadj. Floor) on return on assets where Tax Aggressiveness (Unadj. Floor) is the statutory tax rate at the country level less a firm’s effective tax rate. The effective tax rate is defined as tax over EBIT; observations with negative EBIT are set to missing. In Columns 4-6, Tax Aggressiveness (constructed with FE) is the residual of a regression of firm’s Tax Aggressiveness (Unadj. Floor) on return on assets, country fixed effects, and industry fixed effects. Standard errors are clustered at country and industry level (2-way cluster). In Panel B, the dependent variable is Tax Aggressiveness (constructed without FE) in Column 1 and Tax Aggressiveness (constructed with FE) in Column 2, both constructed as in Panel A. Dependent variables are measured annually over the 2010-2017 period. Treated is a dummy equal to one for observations based on fiscal year ends after III/2016. Standard errors are clustered at firm and year level (2-way cluster). In both Panels, controls include size and fixed effects as indicated. Appendix 1 provides the variable definitions. All continuous variables are winsorized at the 1% and 99% levels. t-statistics are given in parentheses; *, **, and *** denote significance at the 10%, 5%, and 1% levels, respectively. Panel A: Event study results
(1) (2) (3) (4) (5) (6) Tax Variable Tax Aggressiveness
(constructed without FE) Tax Aggressiveness
(constructed with FE) Has PPE -0.518* -0.519* -0.529* -0.532* (-1.80) (-1.80) (-1.84) (-1.85) Tax Variable -2.518*** 0.231 -2.493*** 0.233 (-2.98) (1.23) (-2.99) (1.28) Interaction -1.640*** -1.855** -1.672** -1.890** (-2.71) (-2.51) (-2.23) (-2.18) Controls Yes Yes Yes Yes Yes Yes Industry FE Yes Yes Yes Yes Yes YesCountry FE Yes Yes Yes Yes Yes Yes N 310 15,818 15,818 310 15,818 15,818 Adj. R2 0.180 0.112 0.112 0.180 0.112 0.112
Panel B: Real implications for tax aggressiveness (1) (2) Dependent variable Tax Aggressiveness
(constructed without FE) Tax Aggressiveness
(constructed with FE) Treated x Has PPE -0.059*** -0.044*** (-4.80) (-3.28) Firm FE Yes Yes Fiscal Year Fixed Effects Yes Yes N Observations 51,044 51,044 N Firms 9,163 9,163 Adj. R2 0.220 0.275

44
Table 9
Users of offshore vehicles and expropriation
This table investigates the role of expropriation measured at the firm (Panel A) and country (Panel B) level in explaining returns of publicly listed firms around the leak. The dependent variables are Cumulative abnormal returns around three event days associated with the leak. Has Panama Papers Exposure (PPE) indicates whether (1) or not (0) a firm is connected to the Panama Papers, as defined in Table 3. Interaction denotes the interaction between Has PPE and the respective firm- and country-level measures. In Panel A, Foreign Institutional Ownership is the fraction of outstanding shares held by foreign institutional owners in 2015. Governance is the logged governance score from Bloomberg’s ESG database in 2015. Has Sponsored ADR is a dummy variable equal to 1 if a non-U.S. firm has a sponsored ADR (Level II or III) in 2015, Has Unsponsored ADR indicates an unsponsored or Level I ADR in 2015. Has U.S. Subsidiary whether a non-U.S. firm has a U.S. subsidiary in 2015. In Panel B, the focus is on country-level expropriation measures. Countries are split into those with above-median and below-median scores. Measures include Property Rights, ICRG index, Rule of Law index, and Minority Shareholder Protection. In Column 5, the country-level measure of interest is a Dummy equal to one if a firm is headquartered in a country with below-median GDP per capita. All regressions include firm size and fixed effects as indicated. Appendix 1 provides detailed variable definitions. All continuous variables are winsorized at the 1% and 99% levels. Standard errors are clustered at country and industry level (2-way cluster). t-statistics are in parentheses; *, **, and *** denote significance at the 10%, 5%, and 1% levels, respectively. Panel A: Firm-level governance
(1) (2) (3) (4) (5) Governance Variable Foreign
Institutional Ownership
Governance Has Sponsored ADR
Has Unsponsored ADR
Has U.S. Subsidiary
Has PPE 0.317 -0.085 -0.503* -0.751** -0.076 (0.70) (-0.14) (-1.82) (-2.57) (-0.23)
Governance Variable -1.762 1.279** -0.614*** -0.395 -0.404*** (-1.37) (2.36) (-3.10) (-1.13) (-3.73)
Interaction -6.097** -8.848*** -0.819** 0.344 -1.420** (-2.44) (-4.37) (-1.98) (0.73) (-2.46)
Controls Yes Yes Yes Yes Yes Industry FE Yes Yes Yes Yes Yes Country FE Yes Yes Yes Yes Yes N 17,758 2,696 23,540 23,540 23,540 Adj. R2 0.105 0.106 0.094 0.094 0.094
Panel B: Home-country expropriation measures
(1) (2) (3) (4) (5) Weak Property
Rights Low ICRG Weak Rule
of Law Weak Minority
Shareholder Protection
LN(GDP per capita)
Dummy Dummy Dummy Dummy Dummy
Has PPE -1.021*** -0.937*** -0.978*** -2.883** -0.722** (-4.75) (-4.67) (-4.44) (-2.46) (-2.00)
Interaction 2.551*** 1.677* 1.846** 4.531*** 0.037 (3.29) (1.84) (2.13) (4.04) (0.06)
Controls Yes Yes Yes Yes Yes Industry FE Yes Yes Yes Yes Yes Country FE Yes Yes Yes Yes Yes N 22,009 23,486 23,484 4,756 23,486 Adj. R2 0.095 0.094 0.094 0.138 0.094

45
Appendix 1: Data Appendix
Variable Description (detailed) Source
Types of Panama Papers links Has Panama Papers
Exposure (Has PPE) A dummy variable equal to 1 if any entity, intermediary, or person listed in the leaked Mossack Fonseca & Co. documents is connected to a subsidiary of a firm in our sample, an officer of a firm in our sample, or an officer of a sample firm’s subsidiary, and 0 otherwise. Persons are matched using exact home country matches and fuzzy name matches. Entities and intermediaries are matched using exact incorporation country matches and fuzzy name matches. All fuzzy matches have been hand-checked.
ICIJ, Orbis
Has entity link A dummy variable equal to 1 if a firm has Panama Papers Exposure to a legal entity listed in the leaked Mossack Fonseca & Co. documents.
Has person link A dummy variable equal to 1 if a firm has Panama Papers Exposure to a person listed in the leaked Mossack Fonseca & Co. documents.
Has intermediary link A dummy variable equal to 1 if a firm has Panama Papers Exposure to an intermediary listed in the leaked Mossack Fonseca & Co. documents.
Panama Papers Address The home country of a person, or the headquarter country of an entity/intermediary included in the leaked Mossack Fonseca & Co. documents where non-missing.
ICIJ
Exposure of Observable Activity
A dummy variable equal to 1 if an entity in the leaked Mossack Fonseca & Co. documents is connected to a subsidiary of a firm in our sample, an officer of a firm in our sample, or an officer of a sample firm’s subsidiary, but if no person and no intermediary in the leaked Mossack Fonseca documents is connected to a subsidiary of a firm in our sample, an officer of a firm in our sample, or an officer of a sample firm’s subsidiary.
ICIJ, Orbis
Exposure of Secret Activity A dummy variable equal to 1 if a person or an intermediary listed in the leaked Mossack Fonseca documents is connected to a subsidiary of a firm in our sample, an officer of a firm in our sample, or an officer of a sample firm’s subsidiary, but if no entity in the leaked Mossack Fonseca & Co. documents is connected to a subsidiary of a firm in our sample, an officer of a firm in our sample, or an officer of a sample firm’s subsidiary.
ICIJ, Orbis
Both Types of Exposure A dummy variable equal to 1 if both an entity and a person or an intermediary in the leaked Mossack Fonseca & Co. documents is connected to a subsidiary of a firm in our sample, an officer of a firm in our sample, or an officer of a sample firm’s subsidiary.
ICIJ, Orbis
Dummy (Has active link) A Dummy variable equal to one if a firm has PPE to at least one vehicles that has not been inactivated as of April 2016.
ICIJ
Years since first link Years since first link denotes the number of years that have passed since the first link to one of the Mossack Fonseca vehicles was established (activation years are missing for some firms) using 2016 as the base year.
ICIJ
Years since last link Years since last link denote the number of years that have passed since the last Mossack Fonseca vehicle was deactivated, using 2016 as the base year.
ICIJ
Number of links The number of distinct links between a firm and the leaked data. ICIJ Number of active links The number of distinct links between a firm and the leaked data that are still active, i.e.,
that have not been inactivated as of April 2016. ICIJ
Number of distinct active officer links
The number of a firm’s distinct officers linked to the leaked data, ignoring inactive links.
ICIJ
Number of distinct active vehicles linked to
The number of distinct offshore entities a firm is exposed to. ICIJ
Measures of firm value Alpha [a;b] Cumulative daily abnormal returns in % from closing on day a-1 to closing of day b
relative to some event date. Daily abnormal returns are obtained from parameters of a one-factor model estimated over days [−294; −41] relative to event dates. The factor is the excess return on the market of the local index in U.S. dollars over and above the U.S. risk-free rate.
Datastream
Cumulative raw returns [a;b]
Cumulative daily stock returns in % from closing on day a-1 to closing of day b relative to some event date.
Datastream
Measures of propensity to face corruption Political 1st Layer Exposure A dummy variable equal to 1 if a firm has at least one subsidiary in any of the countries
whose presidents or major officials were implicated by the Panama Papers (Argentina, Orbis

46
Georgia, Iceland, Iraq, Jordan, Qatar, Saudi Arabia, Sudan, Ukraine, United Arab Emirates).
Exposure to Most Corrupt Tercile
A dummy variable that is equal to one if a firm is exposed to the most perceptively corrupt tercile of countries using Transparency International’s Corruption Perception Index.
Orbis, Transparency International
Revenues from region A firm’s revenues generated from subsidiaries headquartered in a certain region.Measured quarterly. Regressions use the natural logarithm.
# subsidiaries from region A firm’s number of subsidiaries headquartered in a certain region. Measured quarterly. Regressions use the natural logarithm.
Has subsidiary in region A Dummy equal to one if a firm has at least one subsidiary headquartered in a certain region. Measured quarterly.
Tax aggressiveness measures Tax aggressiveness (unadj.
floor) The statutory tax rate at the country level less a firm’s effective tax rate. The effective tax rate is defined as tax over EBIT. Observations with negative EBIT are denoted as missing. Used to construct other measures of tax aggressiveness.
KPMG, Orbis
Tax aggressiveness (no FE) The residual of a regression of firm’s Tax Aggressiveness (Unadj. Floor) on return on assets. High values denote high tax aggressiveness.
KPMG, Orbis
Tax aggressiveness (FE) The residual of a regression of firm’s Tax Aggressiveness (Unadj. Floor) on return on assets, country fixed effects, and industry fixed effects. High values denote high tax aggressiveness.
Firm-level governance Foreign institutional
ownership Fraction of shares held by foreign owners. FactSet
ownership (Lionshares)
Governance Log(1+Overall governance score), in 2015. Bloomberg ESG database
Has sponsored ADR A dummy variable equal to 1 if a firm is not headquartered in the U.S. and has a sponsored ADR in 2015.
BNY Mellon
Has unsponsored ADR A dummy variable equal to 1 if a firm is not headquartered in the U.S. and has an unsponsored ADR in 2015.
BNY Mellon
Has U.S. subsidiary A dummy variable equal to 1 if a firm is not headquartered in the U.S. and has a U.S. subsidiary in 2015.
Orbis
Country-level expropriation Property rights An assessment of the ability of individuals to accumulate private property, secured by
clear laws that are fully enforced by the state, as in Djankov, Ganser, McLiesh, Ramalho, and Shleifer (DGMRS; 2010). Regressions use Dummy equal to one if country scores among the 50% of countries with weakest property rights.
DGMRS 2010
ICRG Country risk as per the International Country Risk Guide. Takes value between 0 and 100. Obtained using average values over the 2006-2015 period. Regressions use Dummy equal to one if country scores among the 50% of countries with lowest ICRG.
ICRG
Rule of law Rule of Law rescaled to 0-10 from La Porta, Lopez-de-Silanes, Shleifer, and Vishny (LLSV; 1998). Regressions use Dummy equal to one if country scores among the 50% of countries with weakest property rights.
LLSV 1998
Minority Shareholder Protection index
A measure of the strength of minority shareholder protections against misuse of corporate assets by directors, of shareholder rights, of governance safeguards, and transparency. Regressions use Dummy equal to one if country scores among the 50% of countries with the lowest index.
Firm characteristics Total assets Total assets. Regressions use the natural logarithm. Datastream Number of subsidiaries Number of domestic and foreign subsidiaries. Orbis Has foreign subsidiary Dummy variable equal to 1 if a firm has at least one subsidiary outside of its parent
headquarter country. Orbis
% Foreign subsidiaries Fraction of a firm’s subsidiaries headquartered outside of its parent headquarter country.
Orbis
Has TOP4 haven exposure A dummy variable equal to 1 if a firm has at least one subsidiary in any of the four main tax havens used by Mossack Fonseca & Co. (Panama, British Virgin Islands, Bahamas, Seychelles).
Orbis
Other controls GDP per capita Country-level GDP per capita measured in 2015. Regressions use the natural logarithm. World Bank
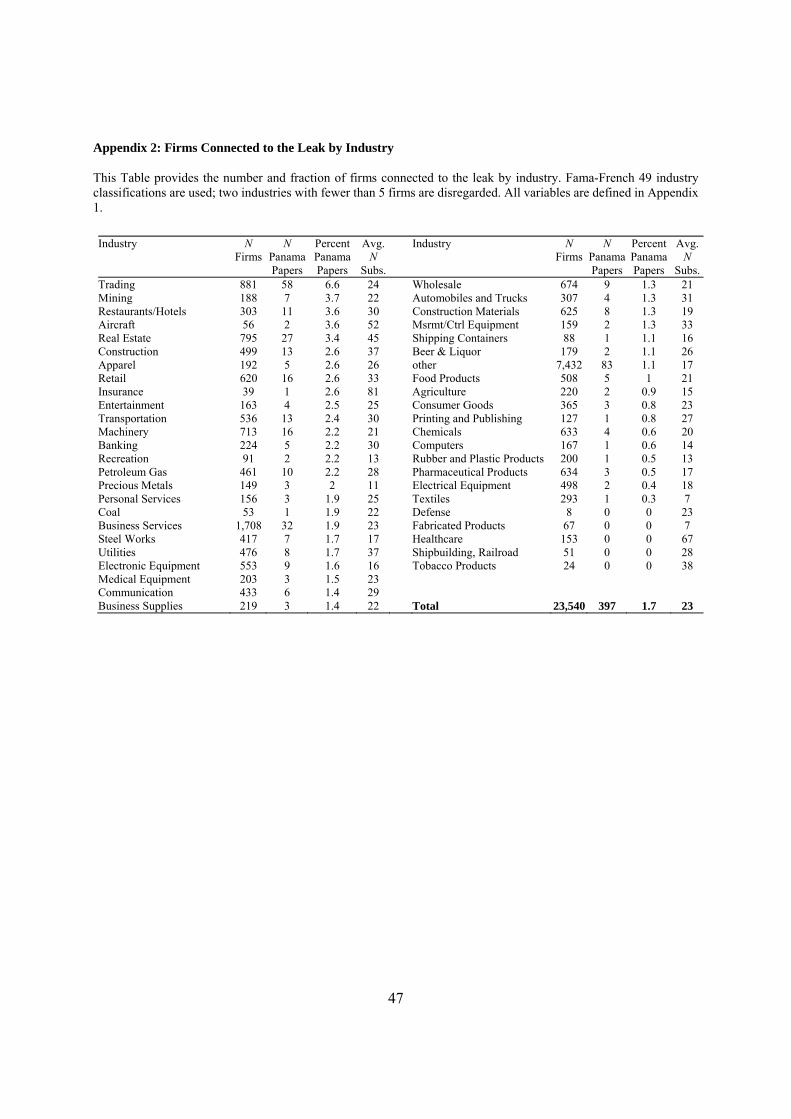
47
Appendix 2: Firms Connected to the Leak by Industry
This Table provides the number and fraction of firms connected to the leak by industry. Fama-French 49 industry classifications are used; two industries with fewer than 5 firms are disregarded. All variables are defined in Appendix 1.
Industry N
Firms N
Panama Papers
Percent Panama Papers
Avg. N
Subs.
Industry N Firms
N Panama Papers
Percent Panama Papers
Avg. N
Subs.Trading 881 58 6.6 24 Wholesale 674 9 1.3 21 Mining 188 7 3.7 22 Automobiles and Trucks 307 4 1.3 31 Restaurants/Hotels 303 11 3.6 30 Construction Materials 625 8 1.3 19 Aircraft 56 2 3.6 52 Msrmt/Ctrl Equipment 159 2 1.3 33 Real Estate 795 27 3.4 45 Shipping Containers 88 1 1.1 16 Construction 499 13 2.6 37 Beer & Liquor 179 2 1.1 26 Apparel 192 5 2.6 26 other 7,432 83 1.1 17 Retail 620 16 2.6 33 Food Products 508 5 1 21 Insurance 39 1 2.6 81 Agriculture 220 2 0.9 15 Entertainment 163 4 2.5 25 Consumer Goods 365 3 0.8 23 Transportation 536 13 2.4 30 Printing and Publishing 127 1 0.8 27 Machinery 713 16 2.2 21 Chemicals 633 4 0.6 20 Banking 224 5 2.2 30 Computers 167 1 0.6 14 Recreation 91 2 2.2 13 Rubber and Plastic Products 200 1 0.5 13 Petroleum Gas 461 10 2.2 28 Pharmaceutical Products 634 3 0.5 17 Precious Metals 149 3 2 11 Electrical Equipment 498 2 0.4 18 Personal Services 156 3 1.9 25 Textiles 293 1 0.3 7 Coal 53 1 1.9 22 Defense 8 0 0 23 Business Services 1,708 32 1.9 23 Fabricated Products 67 0 0 7 Steel Works 417 7 1.7 17 Healthcare 153 0 0 67 Utilities 476 8 1.7 37 Shipbuilding, Railroad 51 0 0 28 Electronic Equipment 553 9 1.6 16 Tobacco Products 24 0 0 38 Medical Equipment 203 3 1.5 23 Communication 433 6 1.4 29 Business Supplies 219 3 1.4 22 Total 23,540 397 1.7 23

48
Appendix 3: Summary statistics for Panama Paper Exposure types
This Table is based on all firms exposed to the leak and provides summary statistics for types of Panama Paper exposure. Dummy (Has active link) is a Dummy variable equal to one if a firm has at least one link to a Mossack Fonseca vehicle that has not been inactivated by April 2016. Years since first link and Years since last link denote the number of years that have passed since the first link to one of the Mossack Fonseca vehicles was established (activation years are missing for some firms), and the number of years since the last Mossack Fonseca vehicle was deactivated (excluded if at least one link is still active), using 2016 as the base year. Further variables of interest include the number of distinct links between firm and leaked data, the number of such links that are still active, the number of distinct firm officers linked to the leaked data, and the number of distinct Mossack Fonseca vehicles a firm is linked to.
N Mean SD Min Median Max Dummy (Has active link) 397 0.622 0.486 0 1 1 Years since first link 394 13.7 6.9 1 13 32 Years since last link 150 7.5 5.7 1 7 27 Number of links 397 8.6 44.1 1 1 591 Number of active links 397 3.3 13.9 0 1 143Number of distinct active officer links 397 1.2 3.4 0 0 39 Number of distinct active vehicles linked to 397 3.2 13.5 0 1 143