The Use of Copper in Cathodes of Aluminium Reduction...
12
The Use of Copper in Cathodes of Aluminium Reduction Cells René von Kaenel 1 , Louis Bugnion 2 , Laure von Kaenel 3 Gualtiero Spinetti 4 and Markus Pfeffer 5 1. CEO 2. Manager Sales and Project 3. Executive Assistant KAN-NAK Ltd., Sierre, Switzerland 4. CEO Die & Form Engineering S.r.l., Brescia, Italy 5. Technical Service Manager SGL CFL CE GmbH, Meitingen, Germany Corresponding author: [email protected] Abstract The use of copper inside the cathodes of aluminium reduction cells is becoming a standard. The advantages are numerous if used in a correct manner. This paper is reviewing the main features that can be achieved when using copper in the most efficient way as a final component of a ready- to-be-used cathode. Industrial applications have demonstrated the possibility of increasing the current as well as decreasing the specific energy significantly. Modelling work, measurements as well as industrial achievements are discussed. Keywords: Cell design; Energy saving; Current increase; Current efficiency; Measurements 1. Introduction More and more smelters are implementing copper in the cathode of the electrolysis cells. Some aspects have been reported in References [1, 2, 3]. The use of copper is strongly linked to the cathode design [4, 5]. Reference [6] presents possible use of direct copper inserts in the cathode. This paper is highlighting the impact of copper in the cathode on the key operating parameters for two technologies. Thermal and magneto-hydrodynamic effects allow operating with different levels of line current and cell voltage. The impact on the cell productivity and specific energy consumption may be significant. Moreover, cell life and recycling may be improved when compared to traditional collector bars design. 1.1 Copper Bars Copper bars vary in shape, in weight and in the way they are implemented in the cathode. Two examples of copper bars cross-section are shown in Figure 1. Figure 1. Example of copper bar cross-sections. Many parameters are important to achieve the desired effects. The cross-section of copper bar, the length, the position inside the carbon cathode, the type of cathode (graphitic, graphitized, etc.), the positions of the anodes, the cathode current density, the external busbars, the metal Travaux 46, Proceedings of 35th International ICSOBA Conference, Hamburg, Germany, 2 – 5 October, 2017. 879
Transcript of The Use of Copper in Cathodes of Aluminium Reduction...

The Use of Copper in Cathodes of Aluminium Reduction Cells
René von Kaenel1, Louis Bugnion2, Laure von Kaenel3 Gualtiero Spinetti4 and Markus Pfeffer5
1. CEO 2. Manager Sales and Project
3. Executive Assistant KAN-NAK Ltd., Sierre, Switzerland
4. CEO Die & Form Engineering S.r.l., Brescia, Italy
5. Technical Service Manager SGL CFL CE GmbH, Meitingen, Germany
Corresponding author: [email protected]
Abstract The use of copper inside the cathodes of aluminium reduction cells is becoming a standard. The advantages are numerous if used in a correct manner. This paper is reviewing the main features that can be achieved when using copper in the most efficient way as a final component of a ready- to-be-used cathode. Industrial applications have demonstrated the possibility of increasing the current as well as decreasing the specific energy significantly. Modelling work, measurements as well as industrial achievements are discussed. Keywords: Cell design; Energy saving; Current increase; Current efficiency; Measurements 1. Introduction More and more smelters are implementing copper in the cathode of the electrolysis cells. Some aspects have been reported in References [1, 2, 3]. The use of copper is strongly linked to the cathode design [4, 5]. Reference [6] presents possible use of direct copper inserts in the cathode. This paper is highlighting the impact of copper in the cathode on the key operating parameters for two technologies. Thermal and magneto-hydrodynamic effects allow operating with different levels of line current and cell voltage. The impact on the cell productivity and specific energy consumption may be significant. Moreover, cell life and recycling may be improved when compared to traditional collector bars design. 1.1 Copper Bars
Copper bars vary in shape, in weight and in the way they are implemented in the cathode. Two examples of copper bars cross-section are shown in Figure 1.
Figure 1. Example of copper bar cross-sections.
Many parameters are important to achieve the desired effects. The cross-section of copper bar, the length, the position inside the carbon cathode, the type of cathode (graphitic, graphitized, etc.), the positions of the anodes, the cathode current density, the external busbars, the metal
Travaux 46, Proceedings of 35th International ICSOBA Conference, Hamburg, Germany, 2 – 5 October, 2017.
879

height, the cell lining, etc. In other words, the full cell design must be in good balance with the use of copper bars. A large copper cross-section may lead to low cathode voltage drop (CVD) but can generate ledge at the cathode surface (ridge) leading to a higher cell voltage. A low CVD is aimed at saving energy but the opposite can take place. A poorly magnetically compensated cell (old technology) may be significantly upgraded by using copper bars. The electrical current will flow more vertically inside the cathode, impacting on the metal surface contour and the velocity field. The magneto-hydrodynamic (MHD) fields such as metal velocity and current density will interact with the magnetic field in a different manner and the cell may become more stable from an MHD point of view. An improved MHD stability allows operating at lower anode to cathode distance (ACD) and/or at higher line current. This leads to lower specific energy consumption and/or increased production. Last but not least, the improved current density distribution at cathode surface minimizes the electro-erosion of the cathode blocks, leading to a longer cell life. 1.2 Ready-to-Use Cathode The ready-to-use cathode or RuC® refers to the use of copper bars in the cathode in such a way that there is no need for cast iron sealing of the collector bars. It fully avoids a first pre-heating of the carbon cathode. RuC technology shows all benefits of other copper bars and adds a number of advantages such as allowing a much lower bar height inside the cathode giving the option of either increasing the cell life or using a lower carbon cathode. A lower carbon cathode increases the cell cavity that can help using higher anodes and/or improving the cell thermal insulation on top of the anodes. When using RuC technology no rodding operation and no pre-heating are necessary. The difficult handling of cast iron is suppressed. Copper can be easily recovered at the end of the cell life and the degrees of freedom for the cell lining design are considerably increased. Figure 2 shows examples of RuC copper bars. The shape and cross-section of the copper bars are determined to optimize the positive effects of the bars and realize a simple connection to the outside aluminium flexes.
Figure 2. Examples of RuC copper bars.
The validation of the concept has been done with a number of cell technologies and the impact is presented in the next chapters for two specific cell technologies (Technology 1 and Technology 2). Figure 3 shows a set of RuC cathodes, first as model and second real before implementation.
Travaux 46, Proceedings of 35th International ICSOBA Conference, Hamburg, Germany, 2 – 5 October, 2017.
880

Figure 3. RuC cathodes, left: model, right real as built.
1.3 Modeling Work In a first stage, the impact of copper is modelled. A full three dimensional thermal-electrical-magneto-hydrodynamic model is applied [4, 5] for one specific cell in a line. In such an analysis all cells of the plant are considered to determine the following fields:
• Thermal field in the cell and the busbars, • Ledge profile in the cell, • Electrical potential field in the cell and the busbars, • Current density field in the cell and the busbars, • Magnetic field inside the liquid metal (ferro-magnetic effects and induced currents are taken
into account) and all other materials, • Velocity field of the liquid metal (free liquid bath surface), • Metal surface contour (metal upheaval or bath-metal interface), • Anode current distribution when all anodes have the same ACD (the mean anode to cathode
distance is automatically adjusted to obtain the total cell voltage, the shape of each anode is following the metal surface),
• Collector bar current distribution, • Heat losses, • Specific energy consumption, • Cell stability (wave perturbation analysis).
Figure 4 shows a set of cells represented by a wire frame system. Wireframe is used for each cell in the plant. The studied cell and its neighbouring cells (in green) are modelled in full three-dimensions (3D) for the determination of all above fields and MHD quantities with good accuracy.
Figure 4. Example of cells as wireframe. The analysed cell is shown in red.
Travaux 46, Proceedings of 35th International ICSOBA Conference, Hamburg, Germany, 2 – 5 October, 2017.
881

1.4 Measurements Many parameters can be measured to evaluate a cell technology. In this paper the cathode voltage drop (CVD) measured from the liquid metal to the end of each collector bar, the current in collector bars as function of time measured over the collector bar flexes, the cell magneto-hydrodynamic stability characterized by the potential of decreasing the anode to cathode distance (ACD) before the cell is showing voltage oscillations and operating parameters are reported. 2. Cathode Voltage Drop and Current Density 2.1 Calculated CVD and Current Density The CVD and the current distribution are two important parameters to be analyzed when implementing copper inside the cathode. A good current distribution contributes to increasing the cell current efficiency. Figure 5 shows the calculated current density and the calculated CVD for a RuC cell of Technology 1 operated at rather high cathode current density (0.9 A/cm2). In this example, the CVD or cathode resistance decreases by 23 % when using RuC. Most important is the current density at the cathode surface which is drastically improving when using copper. The maximum current density decreases from 1.9 A/cm2 to 1.0 A/cm2 at constant current. The level of optimization depends also drastically on the design. From a theoretical point of view, one could achieve a quasi-constant current density at the cathode surface although this may not be very economical. In practice it is almost impossible to measure the existing current density at the cathode surface or inside the liquid metal. However, the electrical potential in the collector bars can be measured and reflects the cathode surface current density [8].
Figure 5. Calculated CVD and cathode current density (Vertical cross-section, middle of one cathode block).
• Reference cell (no copper): • CVD = 274 mV • Graphitized cathode • Average surface cathode current density 0.9
A/cm2 • Maximum surface current density 1.9 A/cm2
• Ready-to-use cathode or RuC cell (copper bars):
• CVD = 210 mV • Graphitized cathode • Average surface cathode current
density 0.9 A/cm2 • Maximum surface current density
1.0 A/cm2
Travaux 46, Proceedings of 35th International ICSOBA Conference, Hamburg, Germany, 2 – 5 October, 2017.
882

2.2 Measured CVD and Collector Bar Current Distribution Figure 6 shows the collector bar current distribution measured on a Reference cell and RuC cell for Technology 1. Both cells show a variance close to 6 %. The RuC cell is operated with 10 % more current.
Reference Technology 1 RuC Technology 1
Figure 6. Measured collector bar current distribution.
Figure 7 shows the cathode resistance as function of cell age for young cells. A decrease of 0.2 µΩ is achieved in favour of the RuC design.
Figure 7. Measured cathode resistance.
Figure 8 shows the collector bar current distribution measured on a Reference cell and RuC cell for Technology 2. Here again both cells show a variance close to 6 %. The variance is most likely essentially related to the busbar system and not to each cathode resistance.
Travaux 46, Proceedings of 35th International ICSOBA Conference, Hamburg, Germany, 2 – 5 October, 2017.
883
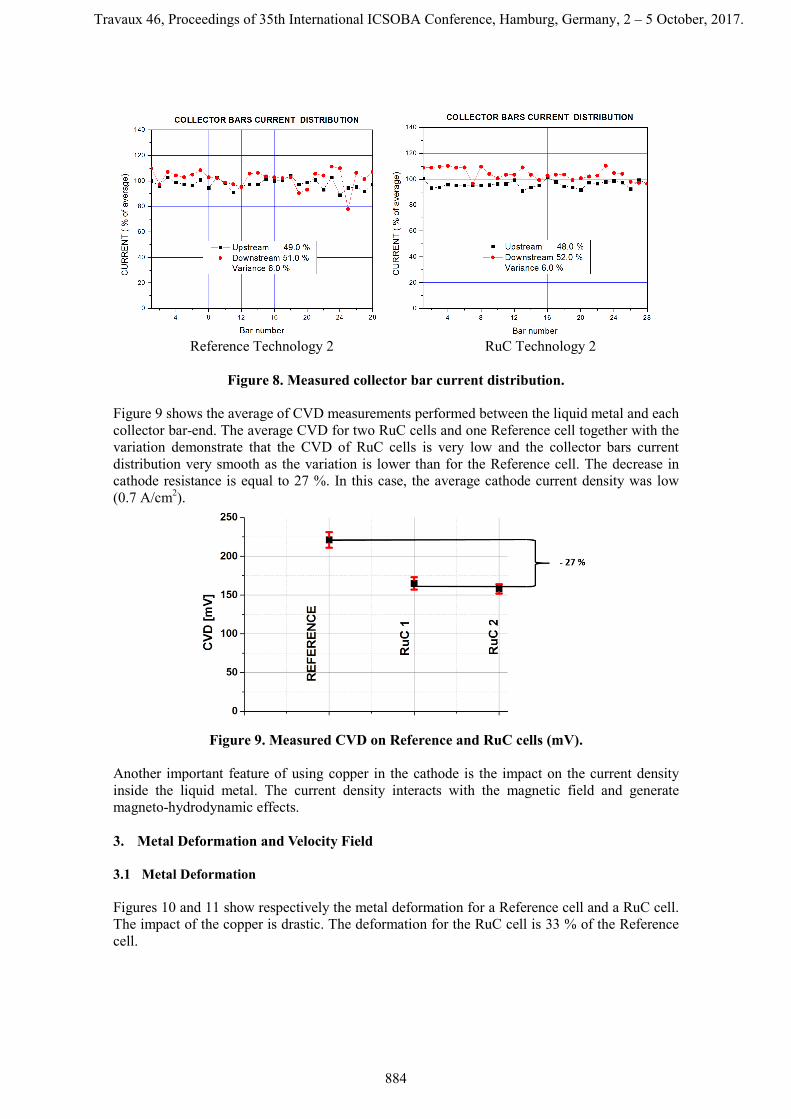
Reference Technology 2 RuC Technology 2
Figure 8. Measured collector bar current distribution.
Figure 9 shows the average of CVD measurements performed between the liquid metal and each collector bar-end. The average CVD for two RuC cells and one Reference cell together with the variation demonstrate that the CVD of RuC cells is very low and the collector bars current distribution very smooth as the variation is lower than for the Reference cell. The decrease in cathode resistance is equal to 27 %. In this case, the average cathode current density was low (0.7 A/cm2).
Figure 9. Measured CVD on Reference and RuC cells (mV).
Another important feature of using copper in the cathode is the impact on the current density inside the liquid metal. The current density interacts with the magnetic field and generate magneto-hydrodynamic effects. 3. Metal Deformation and Velocity Field
3.1 Metal Deformation Figures 10 and 11 show respectively the metal deformation for a Reference cell and a RuC cell. The impact of the copper is drastic. The deformation for the RuC cell is 33 % of the Reference cell.
Travaux 46, Proceedings of 35th International ICSOBA Conference, Hamburg, Germany, 2 – 5 October, 2017.
884

Figure 10. Metal deformation of the Reference cell.
Figure 11. Metal deformation of the RuC cell.
3.2 Metal Velocity Figures 12 and 13 show respectively the metal velocity for a Reference cell and a RuC cell. The impact of the copper is drastic and the order of magnitude in the changes is similar to the impact on the metal deformation. Copper reduces the velocity by a factor of 2.
Travaux 46, Proceedings of 35th International ICSOBA Conference, Hamburg, Germany, 2 – 5 October, 2017.
885
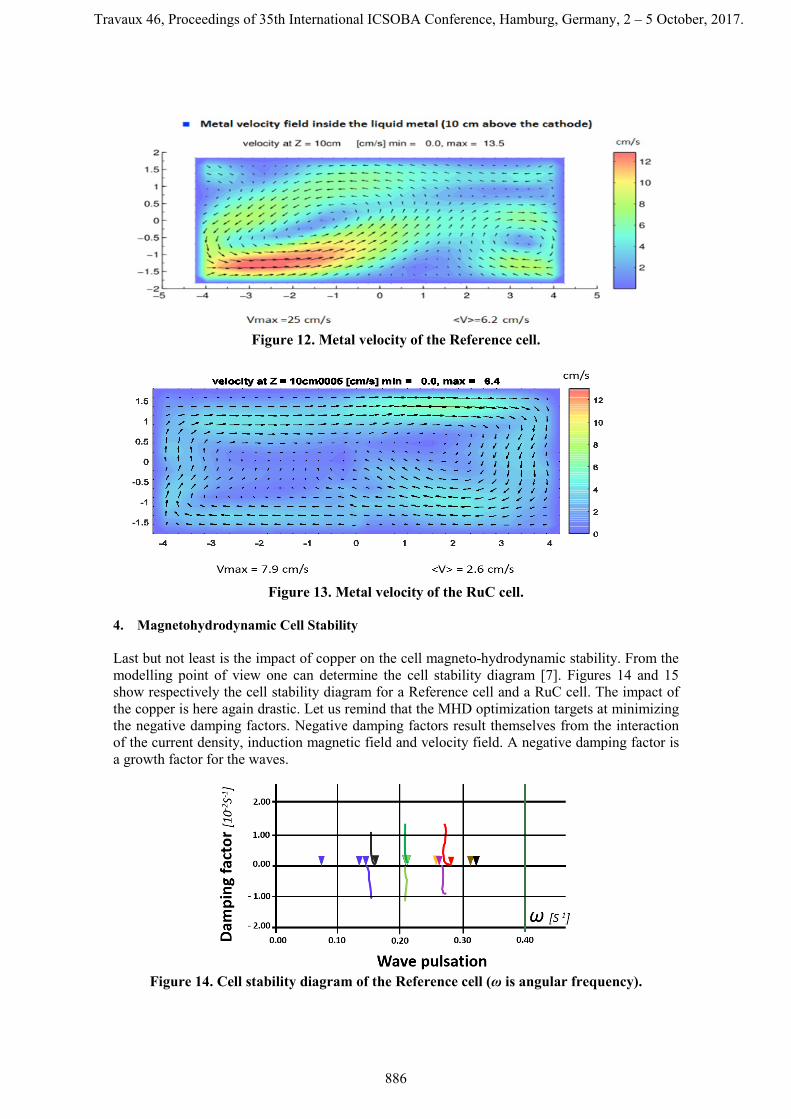
Figure 12. Metal velocity of the Reference cell.
Figure 13. Metal velocity of the RuC cell.
4. Magnetohydrodynamic Cell Stability Last but not least is the impact of copper on the cell magneto-hydrodynamic stability. From the modelling point of view one can determine the cell stability diagram [7]. Figures 14 and 15 show respectively the cell stability diagram for a Reference cell and a RuC cell. The impact of the copper is here again drastic. Let us remind that the MHD optimization targets at minimizing the negative damping factors. Negative damping factors result themselves from the interaction of the current density, induction magnetic field and velocity field. A negative damping factor is a growth factor for the waves.
Figure 14. Cell stability diagram of the Reference cell (ω is angular frequency).
Travaux 46, Proceedings of 35th International ICSOBA Conference, Hamburg, Germany, 2 – 5 October, 2017.
886

Figure 15. Cell stability diagram of the RuC cell. Stability diagram can be validated by measurements by analysing the behaviour of the cell when decreasing the ACD and recording the cell voltage fluctuations. Wave pulsations can be observed and their amplitude is correlated to the damping factor. Figure 16 shows the cell voltage as function of time for a Reference cell. The ACD is decreased by steps of 2 mm every 7 minutes. The Reference cell is operated with 10 % less current than the RuC cell and its starting voltage was 4.23 V. The Reference cell shows the first MHD instabilities at 3.8 V. The instability is defined as a noise level above 20 mV.
Figure 16. Cell voltage as function of ACD for a Reference cell.
The same signal analysis is shown for a RuC cell in Figure 17. The starting cell voltage was close to 4.00 V (230 mV lower) and the level of stability better than for the Reference cell. One should also take into account that the cell was on the low side concerning the bath temperature when the measurements were performed and this is detrimental to the cell MHD stability.
Figure 17. Cell voltage as function of ACD decrease for a RuC cell.
Travaux 46, Proceedings of 35th International ICSOBA Conference, Hamburg, Germany, 2 – 5 October, 2017.
887
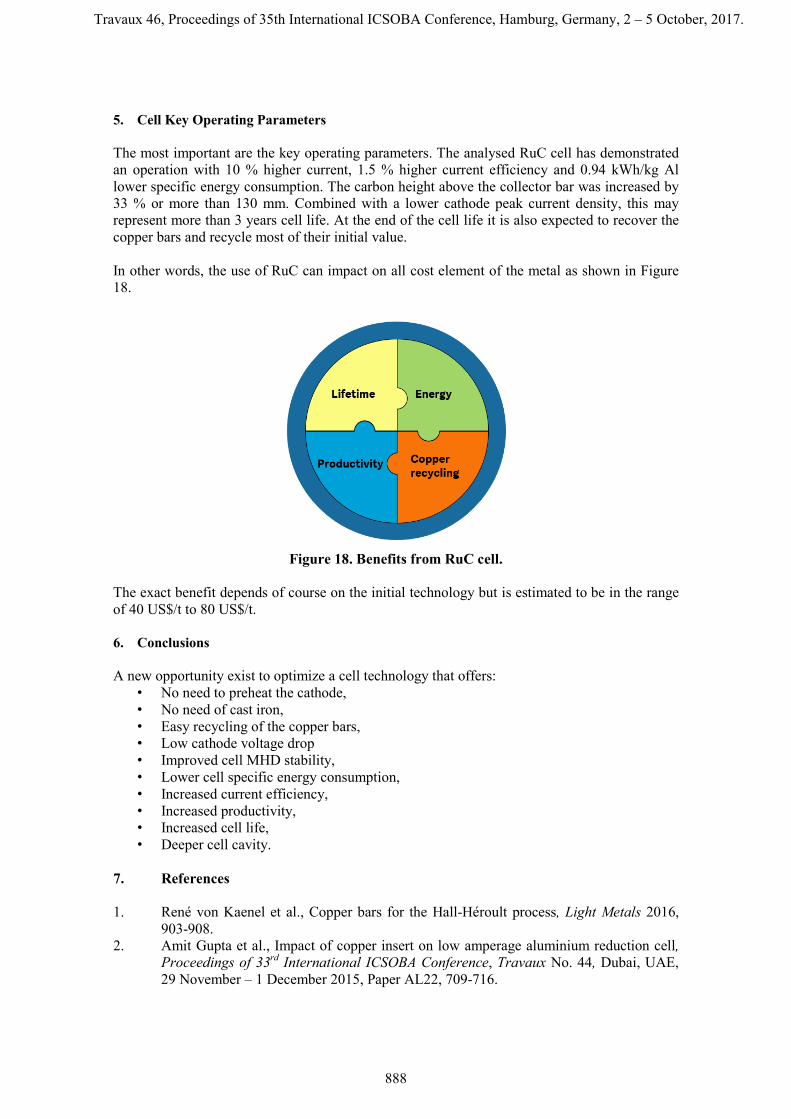
5. Cell Key Operating Parameters The most important are the key operating parameters. The analysed RuC cell has demonstrated an operation with 10 % higher current, 1.5 % higher current efficiency and 0.94 kWh/kg Al lower specific energy consumption. The carbon height above the collector bar was increased by 33 % or more than 130 mm. Combined with a lower cathode peak current density, this may represent more than 3 years cell life. At the end of the cell life it is also expected to recover the copper bars and recycle most of their initial value. In other words, the use of RuC can impact on all cost element of the metal as shown in Figure 18.
Figure 18. Benefits from RuC cell.
The exact benefit depends of course on the initial technology but is estimated to be in the range of 40 US$/t to 80 US$/t. 6. Conclusions A new opportunity exist to optimize a cell technology that offers:
• No need to preheat the cathode, • No need of cast iron, • Easy recycling of the copper bars, • Low cathode voltage drop • Improved cell MHD stability, • Lower cell specific energy consumption, • Increased current efficiency, • Increased productivity, • Increased cell life, • Deeper cell cavity.
7. References
1. René von Kaenel et al., Copper bars for the Hall-Héroult process, Light Metals 2016,
903-908. 2. Amit Gupta et al., Impact of copper insert on low amperage aluminium reduction cell,
Proceedings of 33rd International ICSOBA Conference, Travaux No. 44, Dubai, UAE, 29 November – 1 December 2015, Paper AL22, 709-716.
Travaux 46, Proceedings of 35th International ICSOBA Conference, Hamburg, Germany, 2 – 5 October, 2017.
888

. 3. Marc Dupuis et al., Low Energy Consumption Cell Designs involving copper inserts
and innovative busbar network layout, Light Metals 2017, 693-703. 4. René von Kaenel, Jacques Antille, Shaped cathode for the minimization of the Hall-
Héroult process specific energy consumption, Proceedings of 16th International Conference on Non-ferrous Metals, New Delhi, India, 13 – 14 July, 2012.
5. René von Kaenel, Jacques Antille, Energy savings by using new cathode designs, Proceedings of 15th International Conference on Non-ferrous Metals, Kolkata, India, 8 – 9 July, 2011.
6. René von Kaenel, Jacques Antille, Modeling of Energy saving by using Cathode design and Inserts, Light Metals 2011, 569-574.
7. Jacques Pierre Antille et al., Busbar optimisation using cell stability criteria and its impact on cell performance, Light Metals 1999, 333-338.
8. René von Kaenel et al., Impact of copper inserts in collector bars, Light Metals 2015, 807-812.
Travaux 46, Proceedings of 35th International ICSOBA Conference, Hamburg, Germany, 2 – 5 October, 2017.
889

Travaux 46, Proceedings of 35th International ICSOBA Conference, Hamburg, Germany, 2 – 5 October, 2017.
890