The U.S. Food Marketing System, 2002--AER-811
46
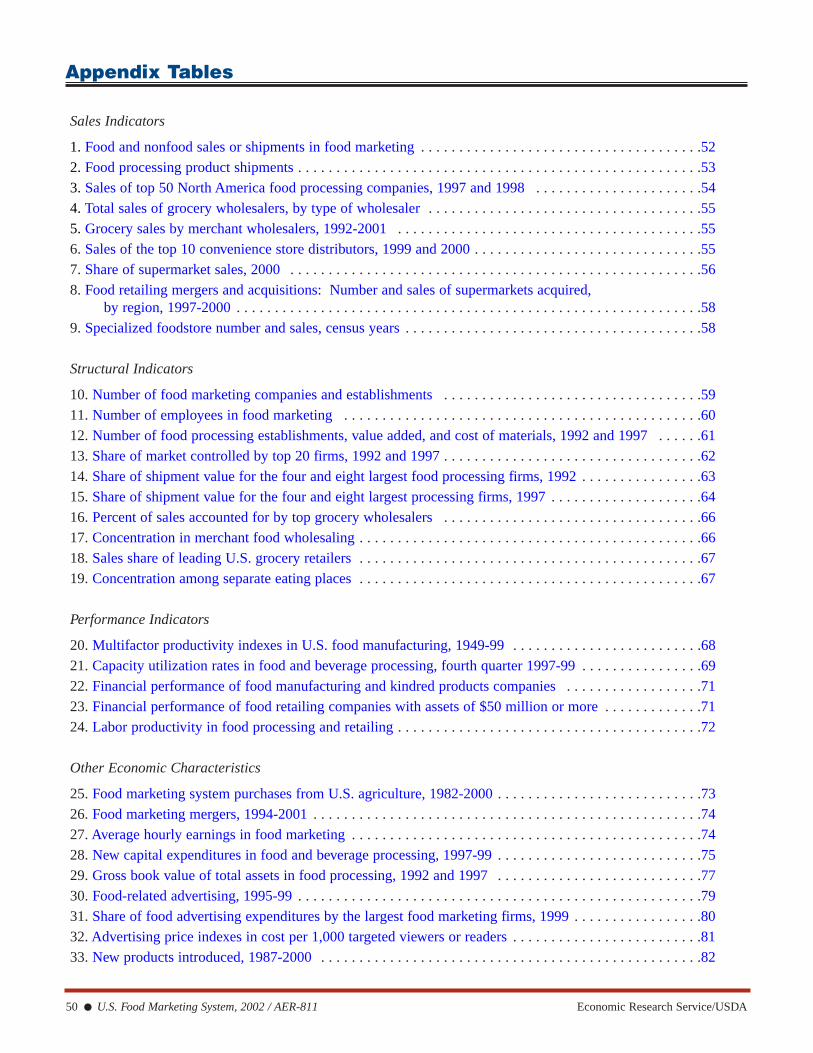
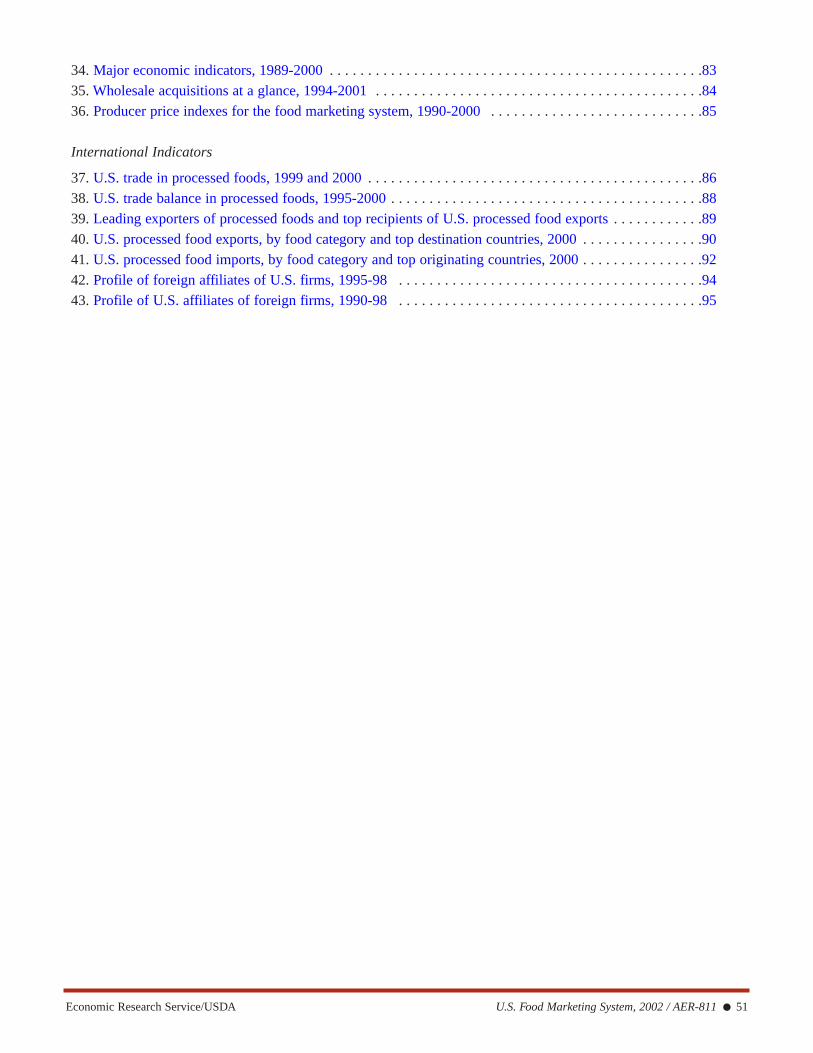
50 ● U.S. Food Marketing System, 2002 / AER-811 Economic Research Service/USDA Appendix Tables Sales Indicators 1. Food and nonfood sales or shipments in food marketing . . . . . . . . . . . . . . . . . . . . . . . . . . . . . . . . . . . . .52 2. Food processing product shipments . . . . . . . . . . . . . . . . . . . . . . . . . . . . . . . . . . . . . . . . . . . . . . . . . . . . .53 3. Sales of top 50 North America food processing companies, 1997 and 1998 . . . . . . . . . . . . . . . . . . . . . .54 4. Total sales of grocery wholesalers, by type of wholesaler . . . . . . . . . . . . . . . . . . . . . . . . . . . . . . . . . . . .55 5. Grocery sales by merchant wholesalers, 1992-2001 . . . . . . . . . . . . . . . . . . . . . . . . . . . . . . . . . . . . . . . .55 6. Sales of the top 10 convenience store distributors, 1999 and 2000 . . . . . . . . . . . . . . . . . . . . . . . . . . . . . .55 7. Share of supermarket sales, 2000 . . . . . . . . . . . . . . . . . . . . . . . . . . . . . . . . . . . . . . . . . . . . . . . . . . . . . .56 8. Food retailing mergers and acquisitions: Number and sales of supermarkets acquired, by region, 1997-2000 . . . . . . . . . . . . . . . . . . . . . . . . . . . . . . . . . . . . . . . . . . . . . . . . . . . . . . . . . . . . .58 9. Specialized foodstore number and sales, census years . . . . . . . . . . . . . . . . . . . . . . . . . . . . . . . . . . . . . . .58 Structural Indicators 10. Number of food marketing companies and establishments . . . . . . . . . . . . . . . . . . . . . . . . . . . . . . . . . .59 11. Number of employees in food marketing . . . . . . . . . . . . . . . . . . . . . . . . . . . . . . . . . . . . . . . . . . . . . . .60 12. Number of food processing establishments, value added, and cost of materials, 1992 and 1997 . . . . . .61 13. Share of market controlled by top 20 firms, 1992 and 1997 . . . . . . . . . . . . . . . . . . . . . . . . . . . . . . . . . .62 14. Share of shipment value for the four and eight largest food processing firms, 1992 . . . . . . . . . . . . . . . .63 15. Share of shipment value for the four and eight largest processing firms, 1997 . . . . . . . . . . . . . . . . . . . .64 16. Percent of sales accounted for by top grocery wholesalers . . . . . . . . . . . . . . . . . . . . . . . . . . . . . . . . . .66 17. Concentration in merchant food wholesaling . . . . . . . . . . . . . . . . . . . . . . . . . . . . . . . . . . . . . . . . . . . . .66 18. Sales share of leading U.S. grocery retailers . . . . . . . . . . . . . . . . . . . . . . . . . . . . . . . . . . . . . . . . . . . . .67 19. Concentration among separate eating places . . . . . . . . . . . . . . . . . . . . . . . . . . . . . . . . . . . . . . . . . . . . .67 Performance Indicators 20. Multifactor productivity indexes in U.S. food manufacturing, 1949-99 . . . . . . . . . . . . . . . . . . . . . . . . .68 21. Capacity utilization rates in food and beverage processing, fourth quarter 1997-99 . . . . . . . . . . . . . . . .69 22. Financial performance of food manufacturing and kindred products companies . . . . . . . . . . . . . . . . . .71 23. Financial performance of food retailing companies with assets of $50 million or more . . . . . . . . . . . . .71 24. Labor productivity in food processing and retailing . . . . . . . . . . . . . . . . . . . . . . . . . . . . . . . . . . . . . . . .72 Other Economic Characteristics 25. Food marketing system purchases from U.S. agriculture, 1982-2000 . . . . . . . . . . . . . . . . . . . . . . . . . . .73 26. Food marketing mergers, 1994-2001 . . . . . . . . . . . . . . . . . . . . . . . . . . . . . . . . . . . . . . . . . . . . . . . . . . .74 27. Average hourly earnings in food marketing . . . . . . . . . . . . . . . . . . . . . . . . . . . . . . . . . . . . . . . . . . . . . .74 28. New capital expenditures in food and beverage processing, 1997-99 . . . . . . . . . . . . . . . . . . . . . . . . . . .75 29. Gross book value of total assets in food processing, 1992 and 1997 . . . . . . . . . . . . . . . . . . . . . . . . . . .77 30. Food-related advertising, 1995-99 . . . . . . . . . . . . . . . . . . . . . . . . . . . . . . . . . . . . . . . . . . . . . . . . . . . . .79 31. Share of food advertising expenditures by the largest food marketing firms, 1999 . . . . . . . . . . . . . . . . .80 32. Advertising price indexes in cost per 1,000 targeted viewers or readers . . . . . . . . . . . . . . . . . . . . . . . . .81 33. New products introduced, 1987-2000 . . . . . . . . . . . . . . . . . . . . . . . . . . . . . . . . . . . . . . . . . . . . . . . . . .82
Transcript of The U.S. Food Marketing System, 2002--AER-811
50 ● U.S. Food Marketing System, 2002 / AER-811 Economic Research Service/USDA
Appendix Tables
Sales Indicators
1. Food and nonfood sales or shipments in food marketing . . . . . . . . . . . . . . . . . . . . . . . . . . . . . . . . . . . . .52
2. Food processing product shipments . . . . . . . . . . . . . . . . . . . . . . . . . . . . . . . . . . . . . . . . . . . . . . . . . . . . .53
3. Sales of top 50 North America food processing companies, 1997 and 1998 . . . . . . . . . . . . . . . . . . . . . .54
4. Total sales of grocery wholesalers, by type of wholesaler . . . . . . . . . . . . . . . . . . . . . . . . . . . . . . . . . . . .55
5. Grocery sales by merchant wholesalers, 1992-2001 . . . . . . . . . . . . . . . . . . . . . . . . . . . . . . . . . . . . . . . .55
6. Sales of the top 10 convenience store distributors, 1999 and 2000 . . . . . . . . . . . . . . . . . . . . . . . . . . . . . .55
7. Share of supermarket sales, 2000 . . . . . . . . . . . . . . . . . . . . . . . . . . . . . . . . . . . . . . . . . . . . . . . . . . . . . .56
8. Food retailing mergers and acquisitions: Number and sales of supermarkets acquired,by region, 1997-2000 . . . . . . . . . . . . . . . . . . . . . . . . . . . . . . . . . . . . . . . . . . . . . . . . . . . . . . . . . . . . .58
9. Specialized foodstore number and sales, census years . . . . . . . . . . . . . . . . . . . . . . . . . . . . . . . . . . . . . . .58
Structural Indicators
10. Number of food marketing companies and establishments . . . . . . . . . . . . . . . . . . . . . . . . . . . . . . . . . .59
11. Number of employees in food marketing . . . . . . . . . . . . . . . . . . . . . . . . . . . . . . . . . . . . . . . . . . . . . . .60
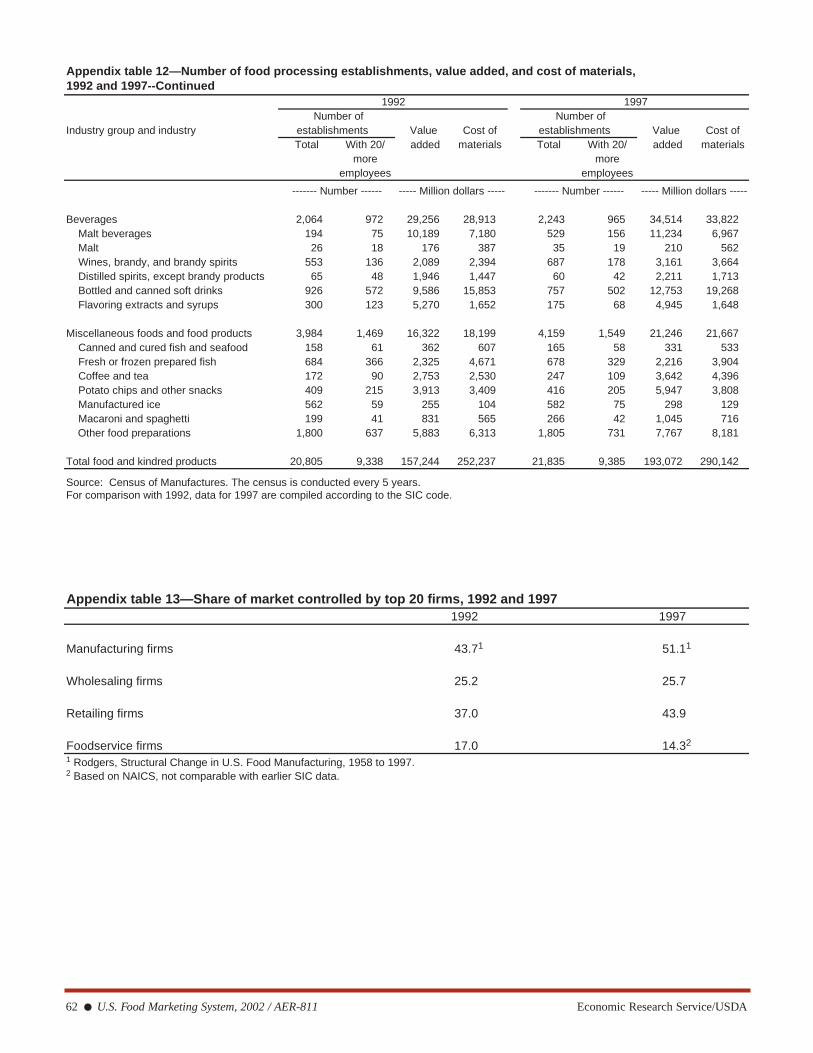
12. Number of food processing establishments, value added, and cost of materials, 1992 and 1997 . . . . . .61
13. Share of market controlled by top 20 firms, 1992 and 1997 . . . . . . . . . . . . . . . . . . . . . . . . . . . . . . . . . .62
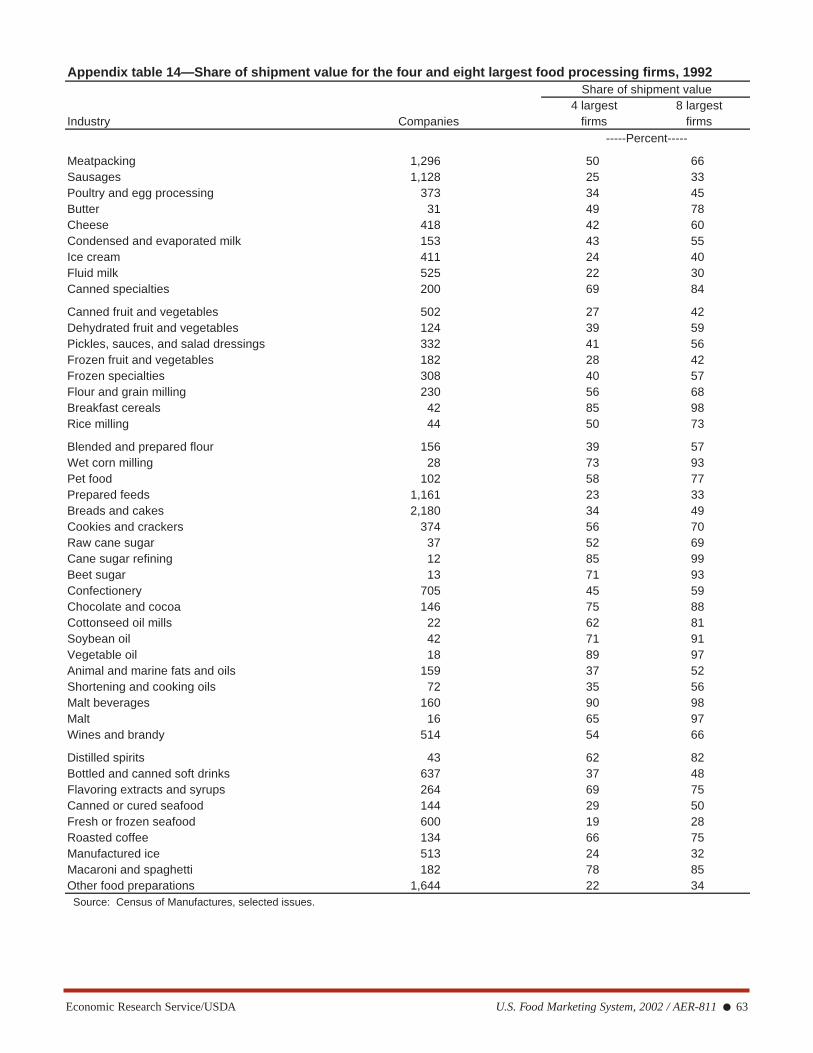
14. Share of shipment value for the four and eight largest food processing firms, 1992 . . . . . . . . . . . . . . . .63
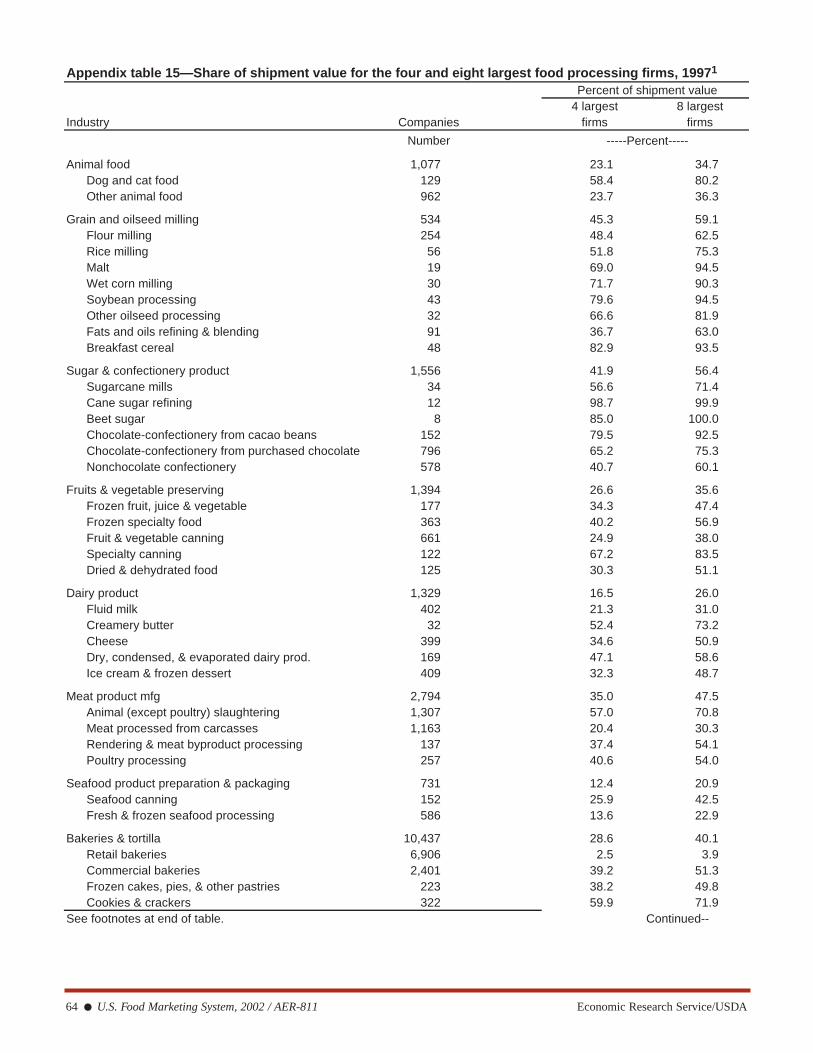
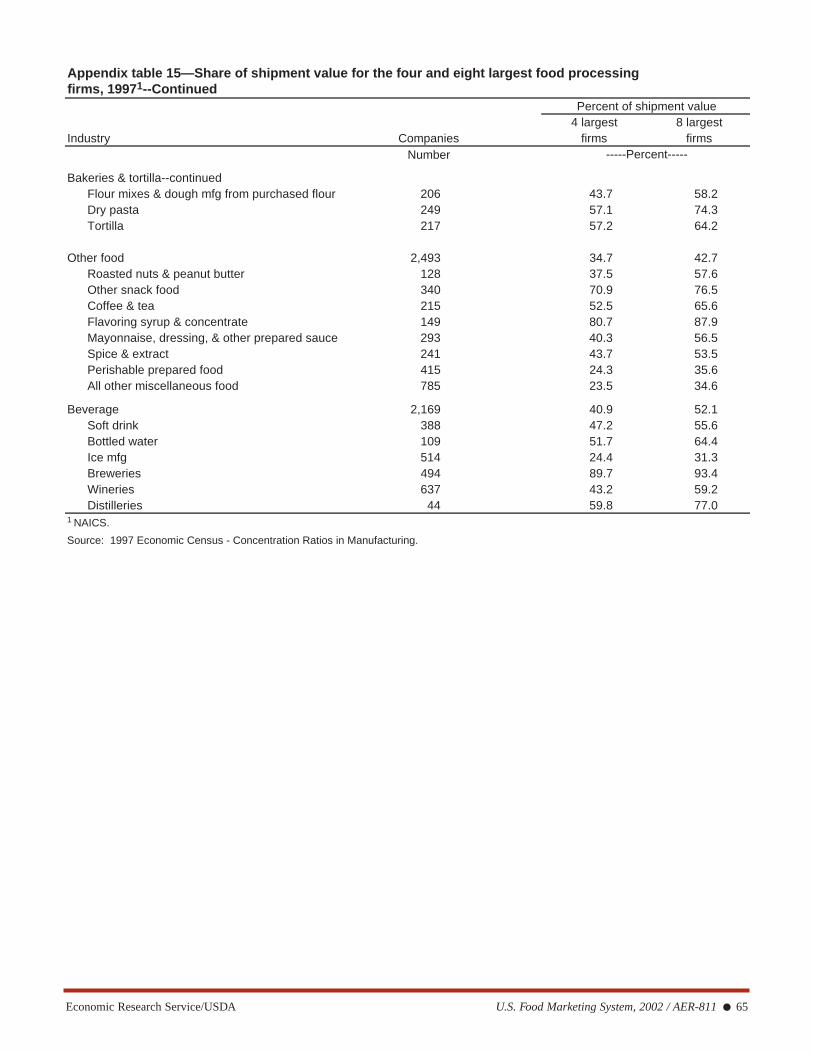
15. Share of shipment value for the four and eight largest processing firms, 1997 . . . . . . . . . . . . . . . . . . . .64
16. Percent of sales accounted for by top grocery wholesalers . . . . . . . . . . . . . . . . . . . . . . . . . . . . . . . . . .66
17. Concentration in merchant food wholesaling . . . . . . . . . . . . . . . . . . . . . . . . . . . . . . . . . . . . . . . . . . . . .66
18. Sales share of leading U.S. grocery retailers . . . . . . . . . . . . . . . . . . . . . . . . . . . . . . . . . . . . . . . . . . . . .67
19. Concentration among separate eating places . . . . . . . . . . . . . . . . . . . . . . . . . . . . . . . . . . . . . . . . . . . . .67
Performance Indicators
20. Multifactor productivity indexes in U.S. food manufacturing, 1949-99 . . . . . . . . . . . . . . . . . . . . . . . . .68
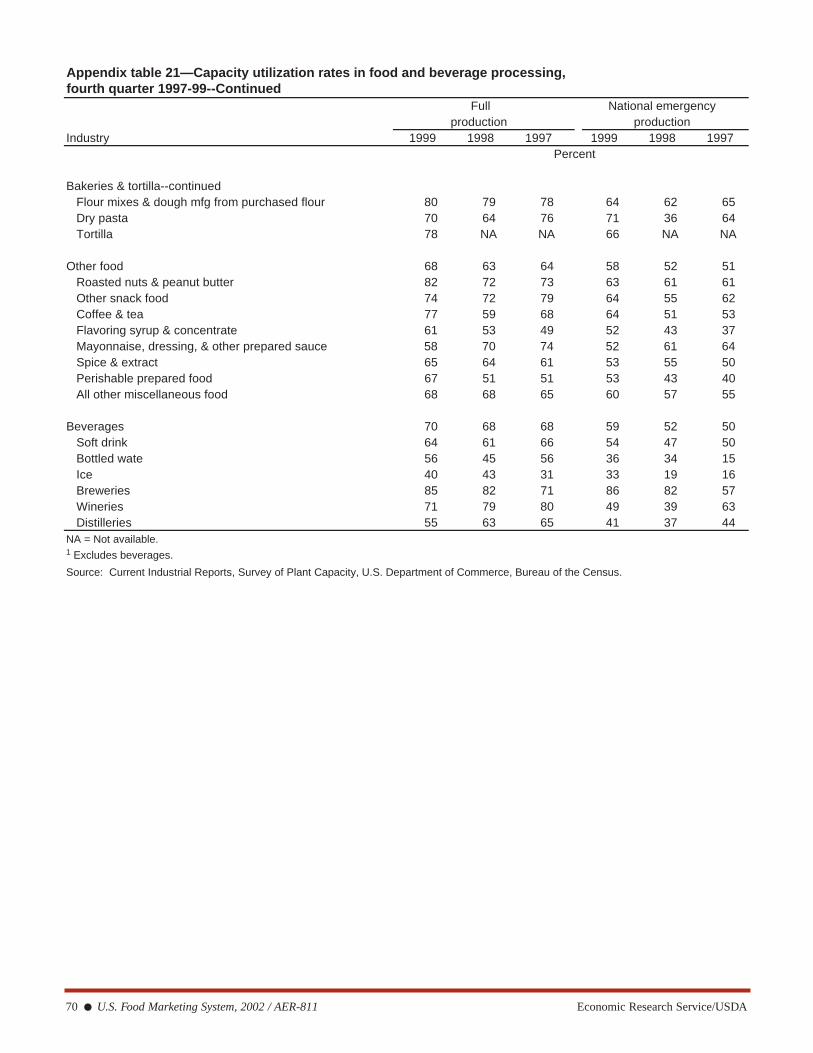
21. Capacity utilization rates in food and beverage processing, fourth quarter 1997-99 . . . . . . . . . . . . . . . .69
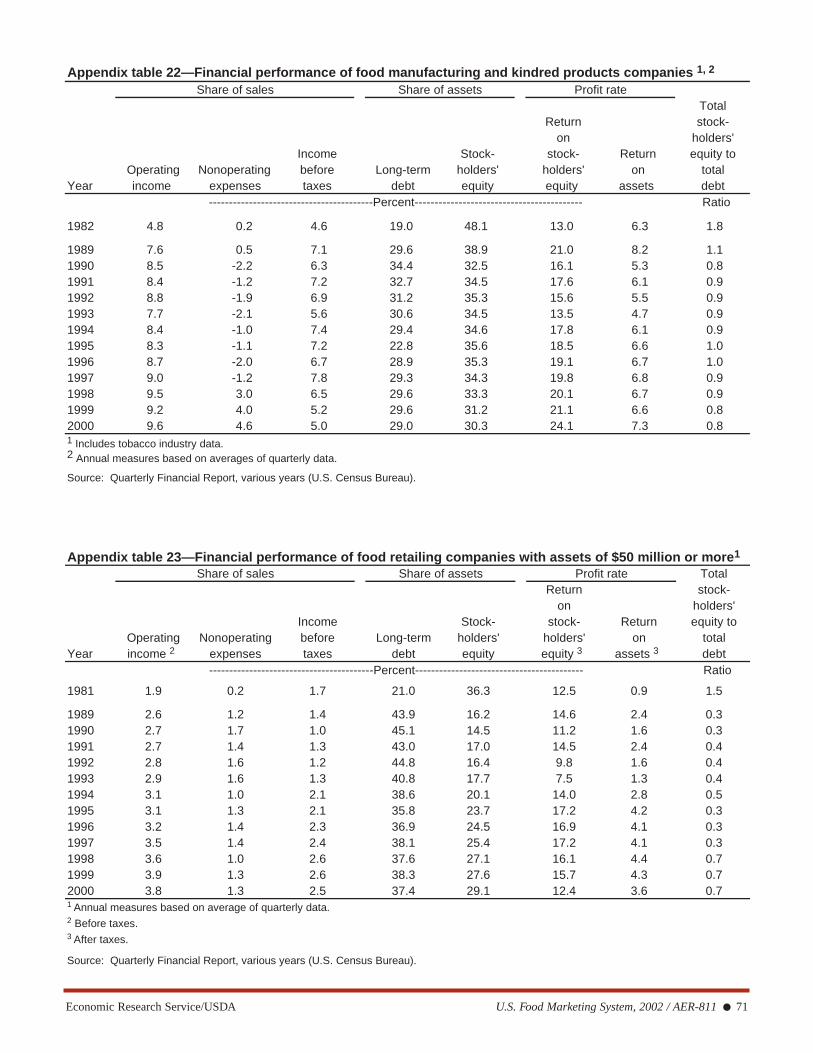
22. Financial performance of food manufacturing and kindred products companies . . . . . . . . . . . . . . . . . .71
23. Financial performance of food retailing companies with assets of $50 million or more . . . . . . . . . . . . .71
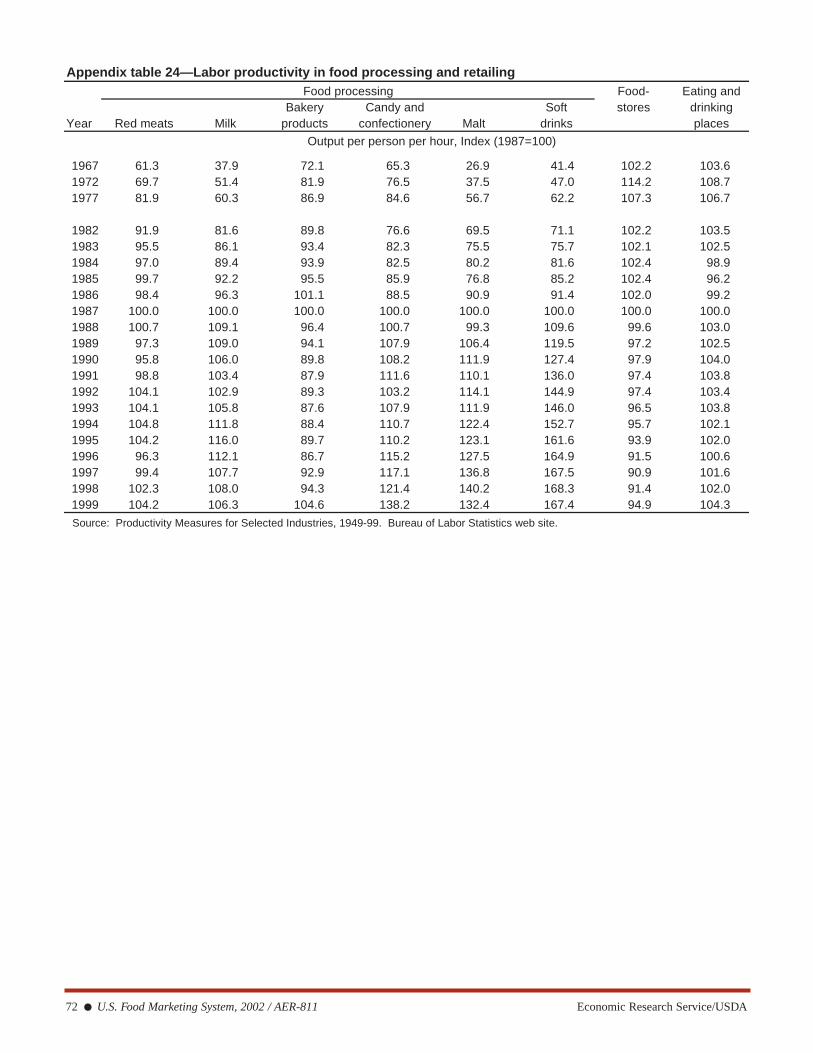
24. Labor productivity in food processing and retailing . . . . . . . . . . . . . . . . . . . . . . . . . . . . . . . . . . . . . . . .72
Other Economic Characteristics
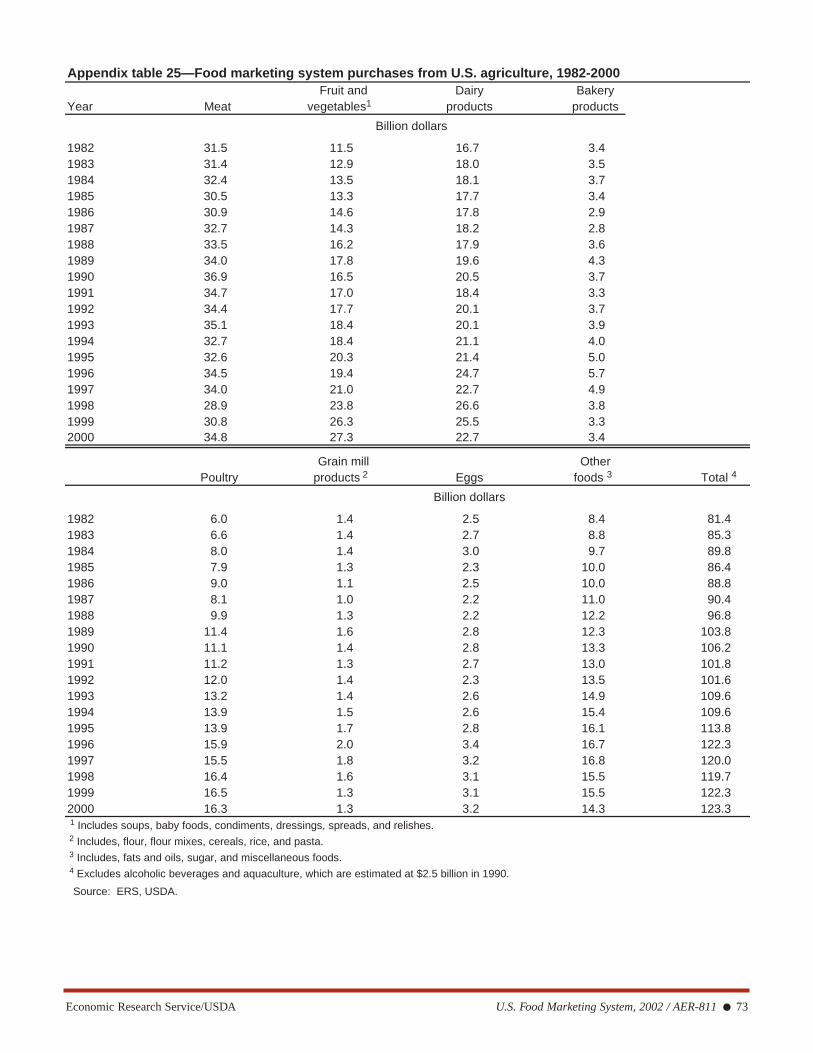
25. Food marketing system purchases from U.S. agriculture, 1982-2000 . . . . . . . . . . . . . . . . . . . . . . . . . . .73
26. Food marketing mergers, 1994-2001 . . . . . . . . . . . . . . . . . . . . . . . . . . . . . . . . . . . . . . . . . . . . . . . . . . .74
27. Average hourly earnings in food marketing . . . . . . . . . . . . . . . . . . . . . . . . . . . . . . . . . . . . . . . . . . . . . .74
28. New capital expenditures in food and beverage processing, 1997-99 . . . . . . . . . . . . . . . . . . . . . . . . . . .75
29. Gross book value of total assets in food processing, 1992 and 1997 . . . . . . . . . . . . . . . . . . . . . . . . . . .77
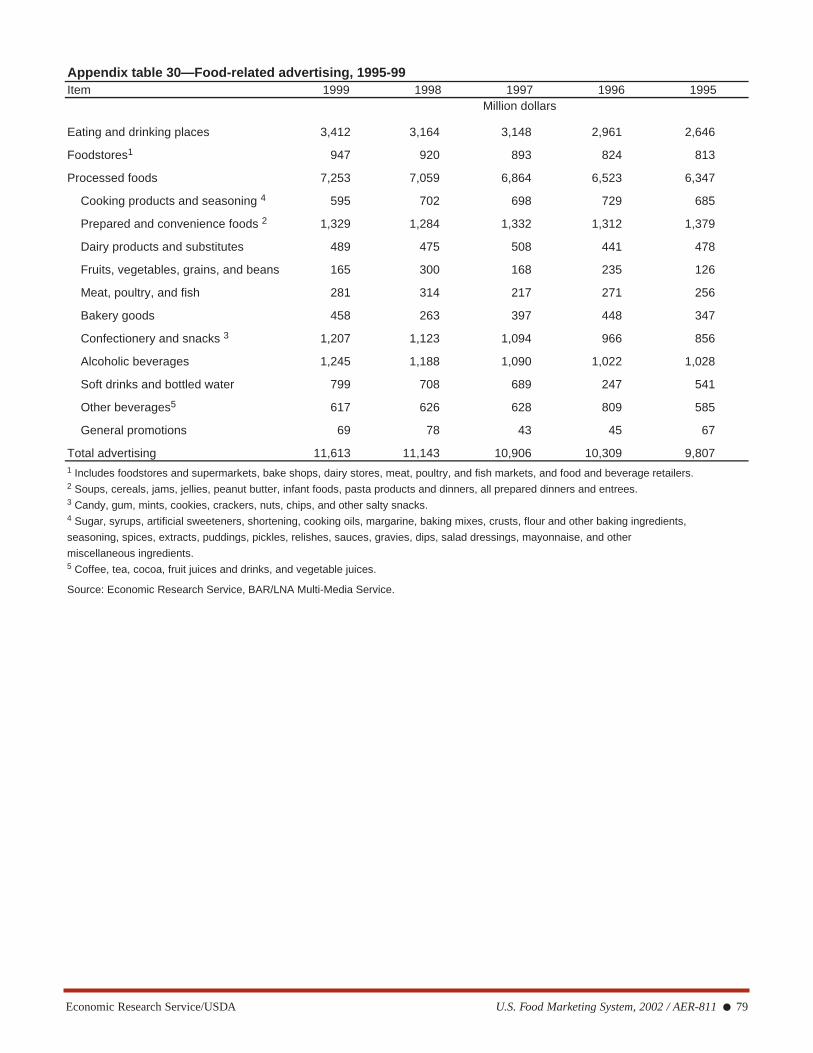
30. Food-related advertising, 1995-99 . . . . . . . . . . . . . . . . . . . . . . . . . . . . . . . . . . . . . . . . . . . . . . . . . . . . .79
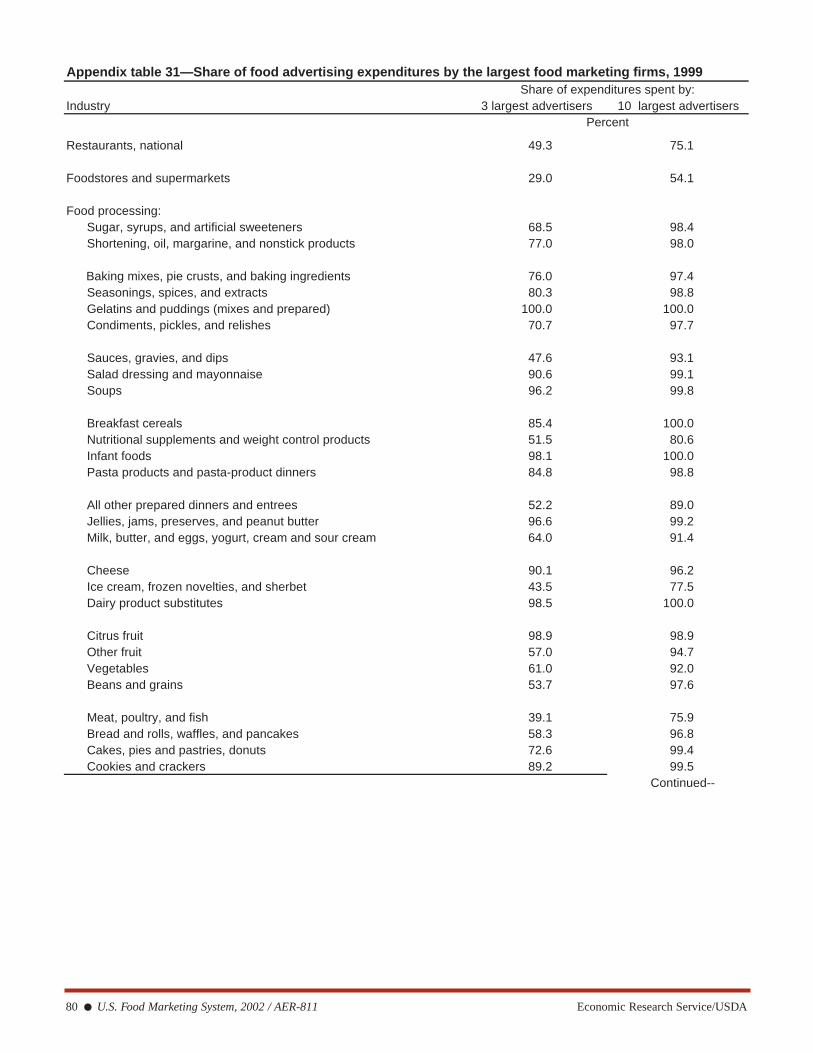
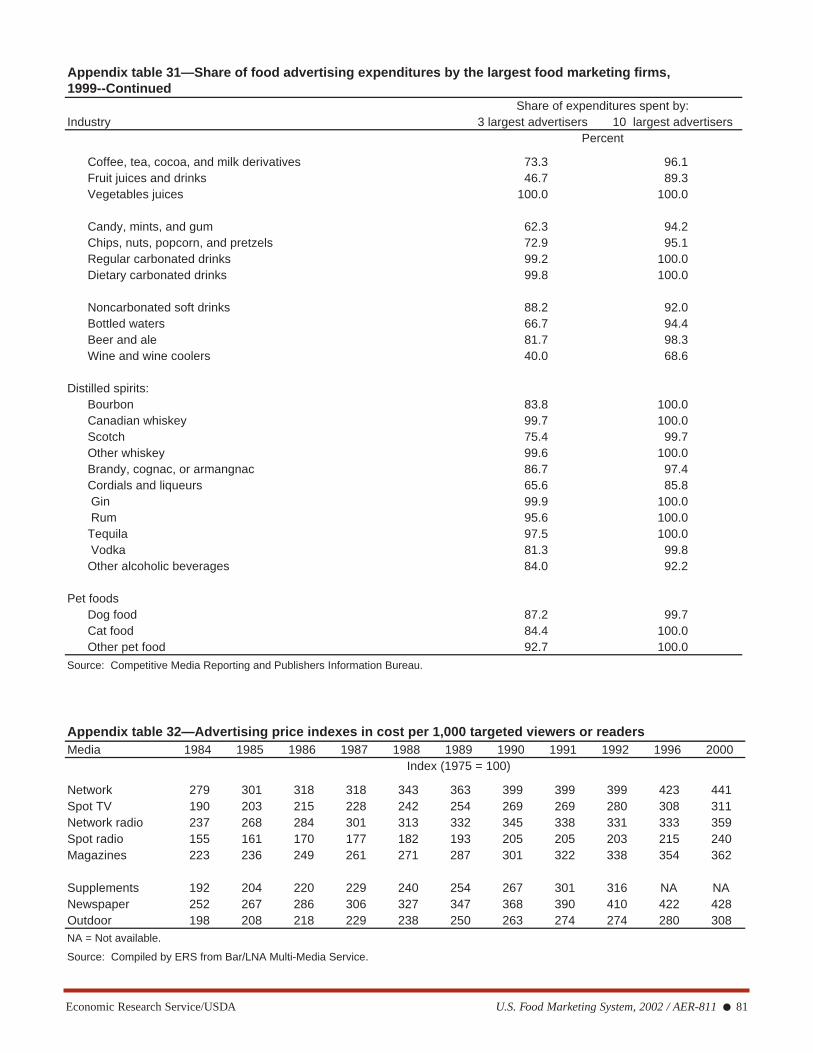
31. Share of food advertising expenditures by the largest food marketing firms, 1999 . . . . . . . . . . . . . . . . .80
32. Advertising price indexes in cost per 1,000 targeted viewers or readers . . . . . . . . . . . . . . . . . . . . . . . . .81
33. New products introduced, 1987-2000 . . . . . . . . . . . . . . . . . . . . . . . . . . . . . . . . . . . . . . . . . . . . . . . . . .82
Economic Research Service/USDA U.S. Food Marketing System, 2002 / AER-811 ● 51
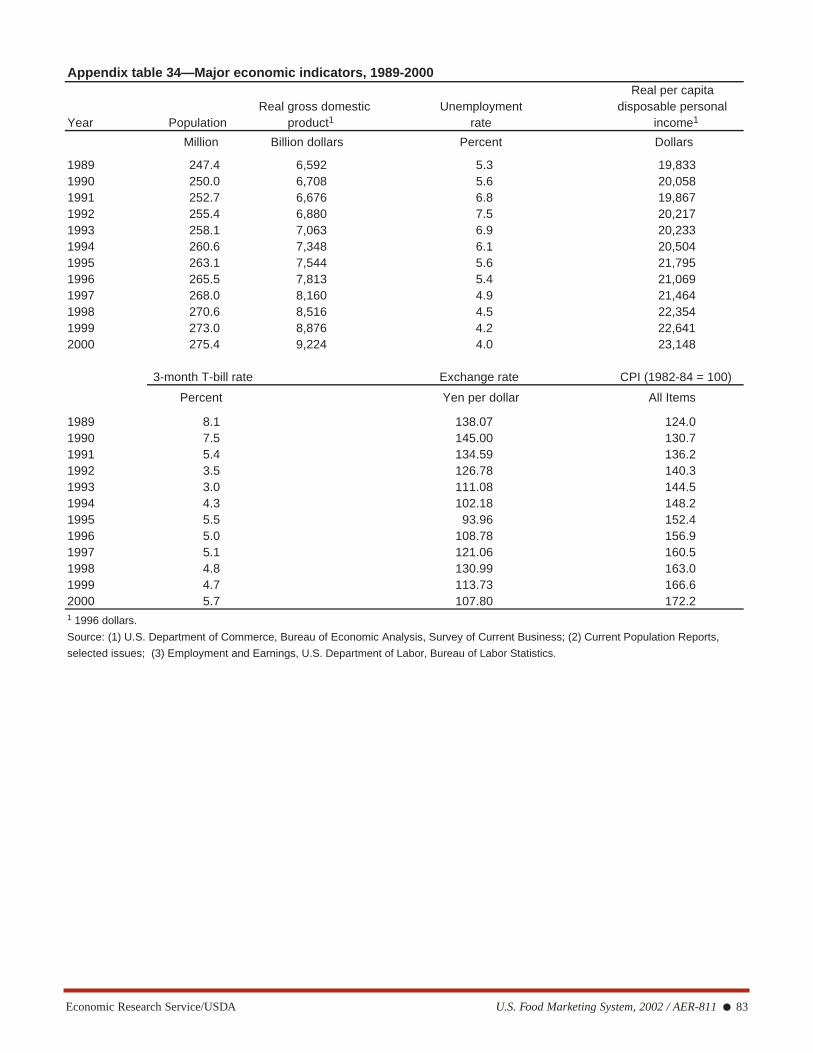
34. Major economic indicators, 1989-2000 . . . . . . . . . . . . . . . . . . . . . . . . . . . . . . . . . . . . . . . . . . . . . . . . .83
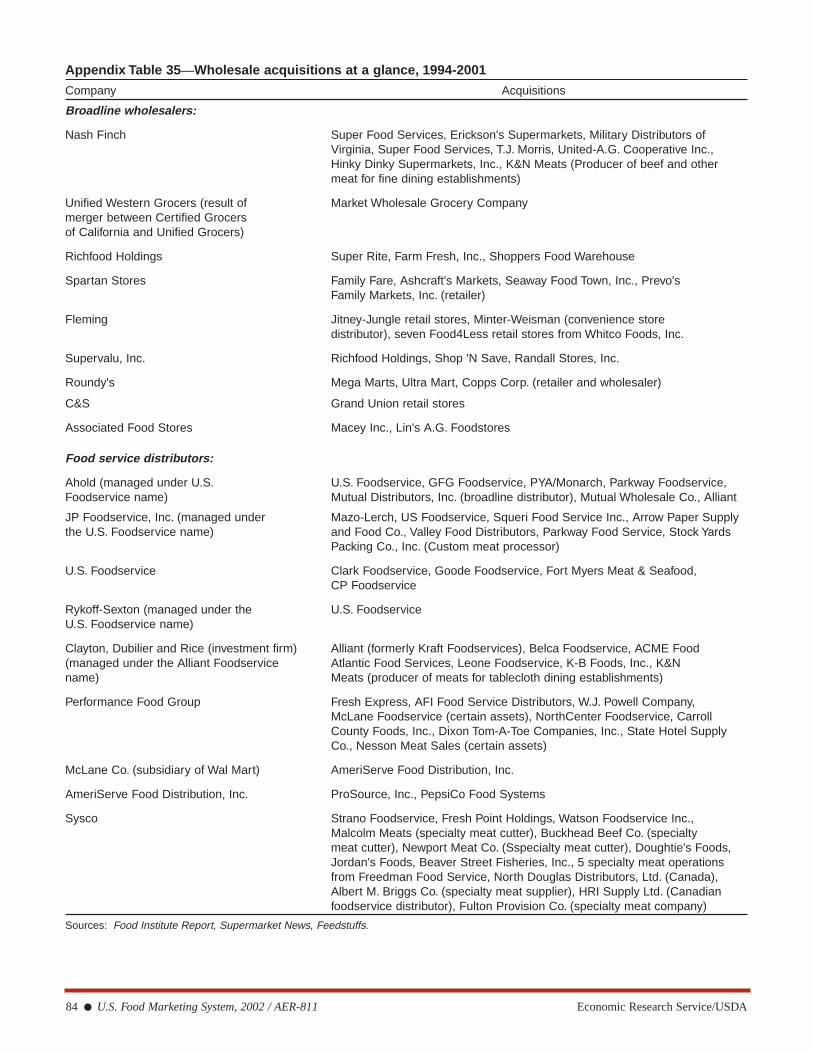
35. Wholesale acquisitions at a glance, 1994-2001 . . . . . . . . . . . . . . . . . . . . . . . . . . . . . . . . . . . . . . . . . . .84
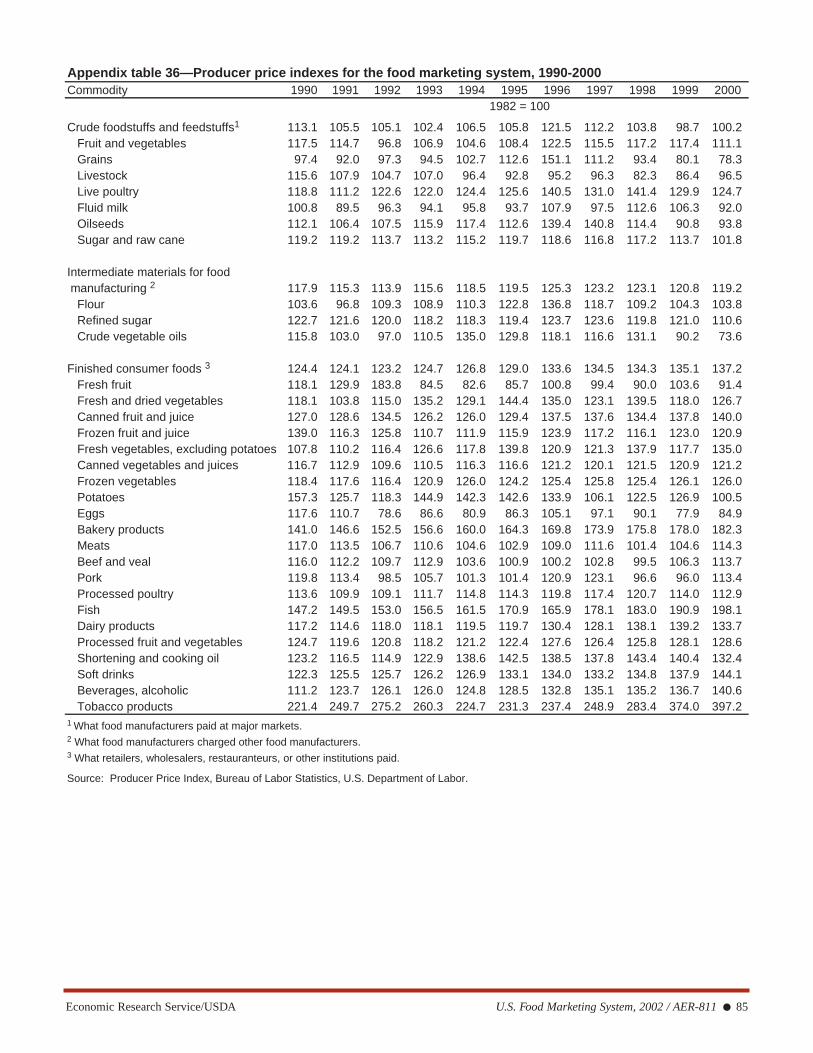
36. Producer price indexes for the food marketing system, 1990-2000 . . . . . . . . . . . . . . . . . . . . . . . . . . . .85
International Indicators
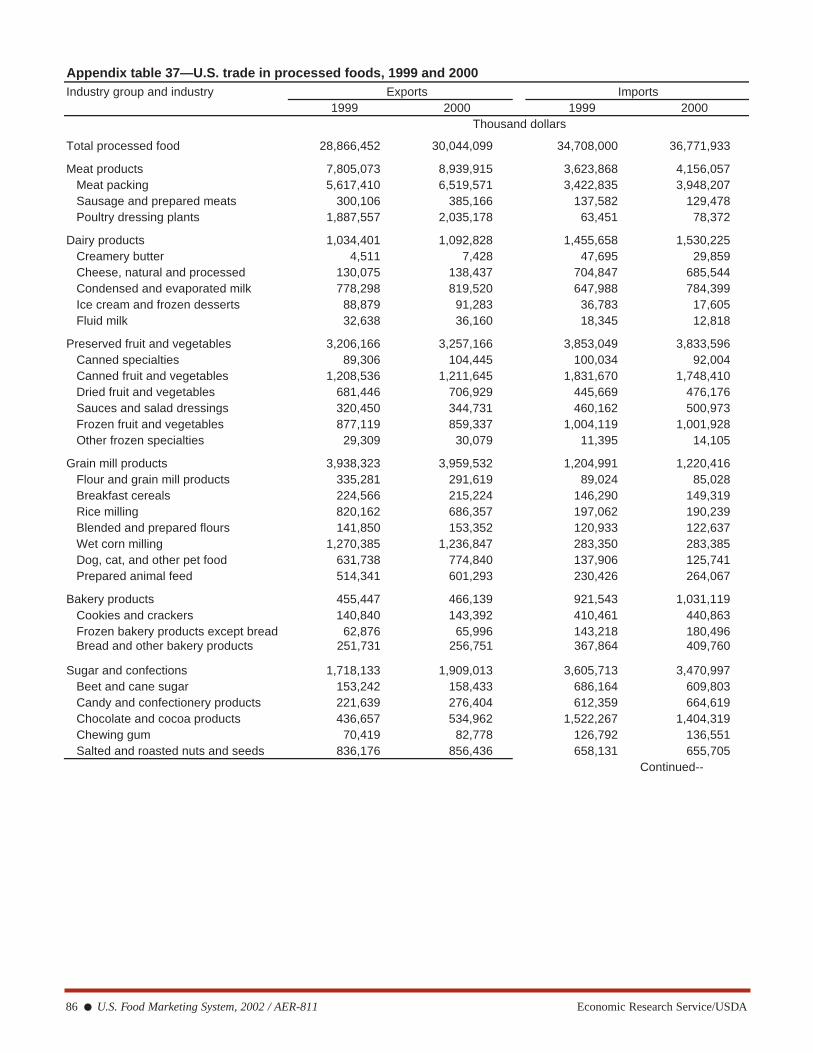
37. U.S. trade in processed foods, 1999 and 2000 . . . . . . . . . . . . . . . . . . . . . . . . . . . . . . . . . . . . . . . . . . . .86
38. U.S. trade balance in processed foods, 1995-2000 . . . . . . . . . . . . . . . . . . . . . . . . . . . . . . . . . . . . . . . . .88
39. Leading exporters of processed foods and top recipients of U.S. processed food exports . . . . . . . . . . . .89
40. U.S. processed food exports, by food category and top destination countries, 2000 . . . . . . . . . . . . . . . .90
41. U.S. processed food imports, by food category and top originating countries, 2000 . . . . . . . . . . . . . . . .92
42. Profile of foreign affiliates of U.S. firms, 1995-98 . . . . . . . . . . . . . . . . . . . . . . . . . . . . . . . . . . . . . . . .94
43. Profile of U.S. affiliates of foreign firms, 1990-98 . . . . . . . . . . . . . . . . . . . . . . . . . . . . . . . . . . . . . . . .95
52 ● U.S. Food Marketing System, 2002 / AER-811 Economic Research Service/USDA
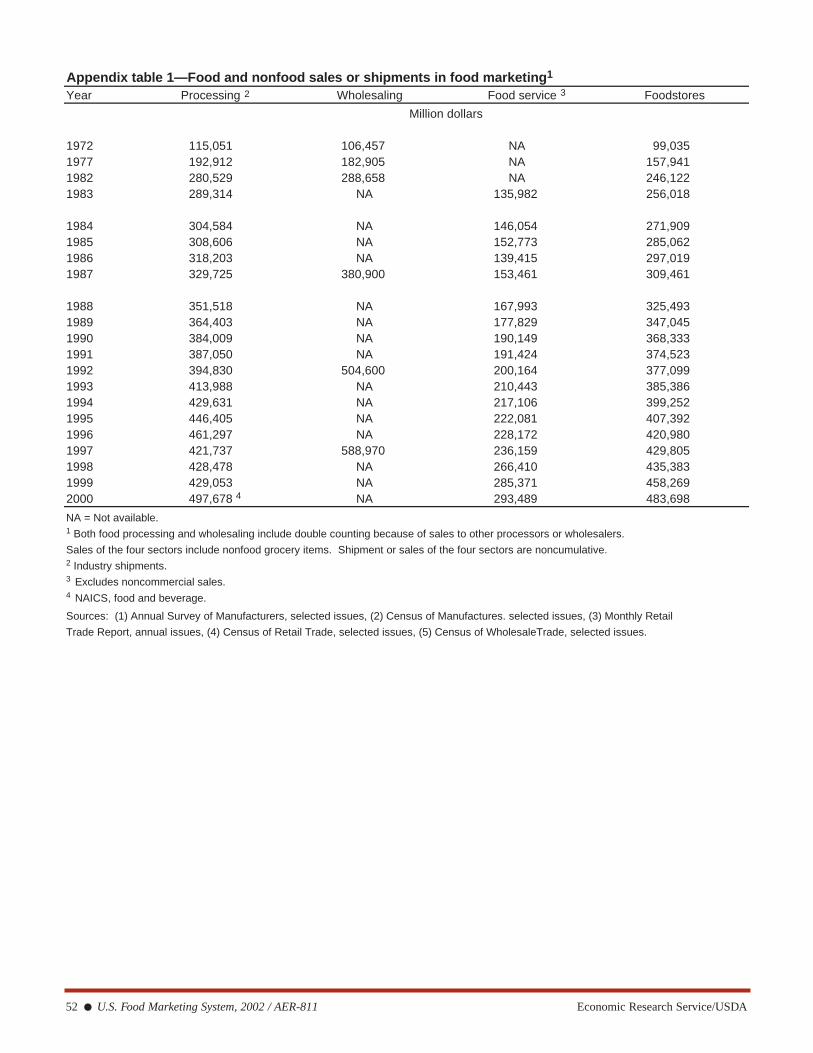
Appendix table 1—Food and nonfood sales or shipments in food marketing1
Year Processing Wholesaling Food service Foodstores
Million dollars
1972 115,051 106,457 NA 99,0351977 192,912 182,905 NA 157,9411982 280,529 288,658 NA 246,1221983 289,314 NA 135,982 256,018
1984 304,584 NA 146,054 271,9091985 308,606 NA 152,773 285,0621986 318,203 NA 139,415 297,0191987 329,725 380,900 153,461 309,461
1988 351,518 NA 167,993 325,4931989 364,403 NA 177,829 347,0451990 384,009 NA 190,149 368,3331991 387,050 NA 191,424 374,5231992 394,830 504,600 200,164 377,0991993 413,988 NA 210,443 385,3861994 429,631 NA 217,106 399,2521995 446,405 NA 222,081 407,3921996 461,297 NA 228,172 420,9801997 421,737 588,970 236,159 429,8051998 428,478 NA 266,410 435,3831999 429,053 NA 285,371 458,2692000 497,678 4 NA 293,489 483,698
NA = Not available.1 Both food processing and wholesaling include double counting because of sales to other processors or wholesalers.
Sales of the four sectors include nonfood grocery items. Shipment or sales of the four sectors are noncumulative.2 Industry shipments.3 Excludes noncommercial sales.
Sources: (1) Annual Survey of Manufacturers, selected issues, (2) Census of Manufactures. selected issues, (3) Monthly Retail
Trade Report, annual issues, (4) Census of Retail Trade, selected issues, (5) Census of WholesaleTrade, selected issues.
2 3
4 NAICS, food and beverage.
Economic Research Service/USDA U.S. Food Marketing System, 2002 / AER-811 ● 53
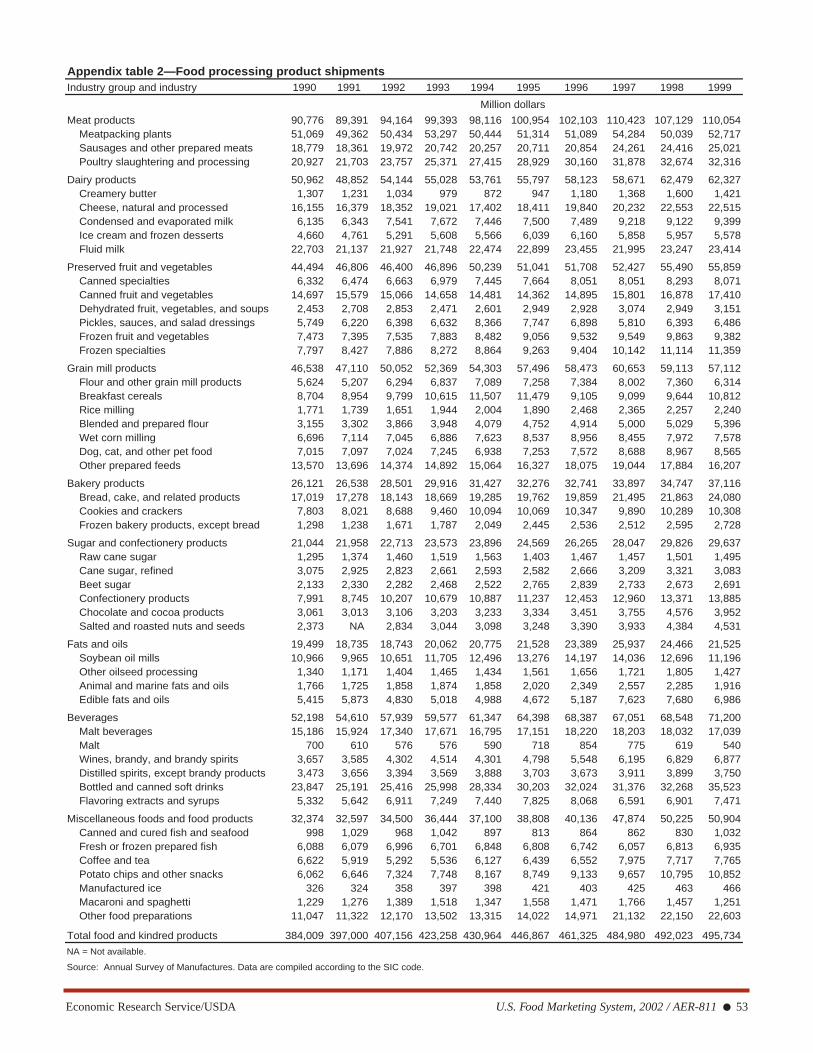
Appendix table 2—Food processing product shipmentsIndustry group and industry 1990 1991 1992 1993 1994 1995 1996 1997 1998 1999
Million dollars
Meat products 90,776 89,391 94,164 99,393 98,116 100,954 102,103 110,423 107,129 110,054 Meatpacking plants 51,069 49,362 50,434 53,297 50,444 51,314 51,089 54,284 50,039 52,717 Sausages and other prepared meats 18,779 18,361 19,972 20,742 20,257 20,711 20,854 24,261 24,416 25,021 Poultry slaughtering and processing 20,927 21,703 23,757 25,371 27,415 28,929 30,160 31,878 32,674 32,316
Dairy products 50,962 48,852 54,144 55,028 53,761 55,797 58,123 58,671 62,479 62,327 Creamery butter 1,307 1,231 1,034 979 872 947 1,180 1,368 1,600 1,421 Cheese, natural and processed 16,155 16,379 18,352 19,021 17,402 18,411 19,840 20,232 22,553 22,515 Condensed and evaporated milk 6,135 6,343 7,541 7,672 7,446 7,500 7,489 9,218 9,122 9,399 Ice cream and frozen desserts 4,660 4,761 5,291 5,608 5,566 6,039 6,160 5,858 5,957 5,578 Fluid milk 22,703 21,137 21,927 21,748 22,474 22,899 23,455 21,995 23,247 23,414
Preserved fruit and vegetables 44,494 46,806 46,400 46,896 50,239 51,041 51,708 52,427 55,490 55,859 Canned specialties 6,332 6,474 6,663 6,979 7,445 7,664 8,051 8,051 8,293 8,071 Canned fruit and vegetables 14,697 15,579 15,066 14,658 14,481 14,362 14,895 15,801 16,878 17,410 Dehydrated fruit, vegetables, and soups 2,453 2,708 2,853 2,471 2,601 2,949 2,928 3,074 2,949 3,151 Pickles, sauces, and salad dressings 5,749 6,220 6,398 6,632 8,366 7,747 6,898 5,810 6,393 6,486 Frozen fruit and vegetables 7,473 7,395 7,535 7,883 8,482 9,056 9,532 9,549 9,863 9,382 Frozen specialties 7,797 8,427 7,886 8,272 8,864 9,263 9,404 10,142 11,114 11,359
Grain mill products 46,538 47,110 50,052 52,369 54,303 57,496 58,473 60,653 59,113 57,112 Flour and other grain mill products 5,624 5,207 6,294 6,837 7,089 7,258 7,384 8,002 7,360 6,314 Breakfast cereals 8,704 8,954 9,799 10,615 11,507 11,479 9,105 9,099 9,644 10,812 Rice milling 1,771 1,739 1,651 1,944 2,004 1,890 2,468 2,365 2,257 2,240 Blended and prepared flour 3,155 3,302 3,866 3,948 4,079 4,752 4,914 5,000 5,029 5,396 Wet corn milling 6,696 7,114 7,045 6,886 7,623 8,537 8,956 8,455 7,972 7,578 Dog, cat, and other pet food 7,015 7,097 7,024 7,245 6,938 7,253 7,572 8,688 8,967 8,565 Other prepared feeds 13,570 13,696 14,374 14,892 15,064 16,327 18,075 19,044 17,884 16,207
Bakery products 26,121 26,538 28,501 29,916 31,427 32,276 32,741 33,897 34,747 37,116 Bread, cake, and related products 17,019 17,278 18,143 18,669 19,285 19,762 19,859 21,495 21,863 24,080 Cookies and crackers 7,803 8,021 8,688 9,460 10,094 10,069 10,347 9,890 10,289 10,308 Frozen bakery products, except bread 1,298 1,238 1,671 1,787 2,049 2,445 2,536 2,512 2,595 2,728
Sugar and confectionery products 21,044 21,958 22,713 23,573 23,896 24,569 26,265 28,047 29,826 29,637 Raw cane sugar 1,295 1,374 1,460 1,519 1,563 1,403 1,467 1,457 1,501 1,495 Cane sugar, refined 3,075 2,925 2,823 2,661 2,593 2,582 2,666 3,209 3,321 3,083 Beet sugar 2,133 2,330 2,282 2,468 2,522 2,765 2,839 2,733 2,673 2,691 Confectionery products 7,991 8,745 10,207 10,679 10,887 11,237 12,453 12,960 13,371 13,885 Chocolate and cocoa products 3,061 3,013 3,106 3,203 3,233 3,334 3,451 3,755 4,576 3,952 Salted and roasted nuts and seeds 2,373 NA 2,834 3,044 3,098 3,248 3,390 3,933 4,384 4,531
Fats and oils 19,499 18,735 18,743 20,062 20,775 21,528 23,389 25,937 24,466 21,525 Soybean oil mills 10,966 9,965 10,651 11,705 12,496 13,276 14,197 14,036 12,696 11,196 Other oilseed processing 1,340 1,171 1,404 1,465 1,434 1,561 1,656 1,721 1,805 1,427 Animal and marine fats and oils 1,766 1,725 1,858 1,874 1,858 2,020 2,349 2,557 2,285 1,916 Edible fats and oils 5,415 5,873 4,830 5,018 4,988 4,672 5,187 7,623 7,680 6,986
Beverages 52,198 54,610 57,939 59,577 61,347 64,398 68,387 67,051 68,548 71,200 Malt beverages 15,186 15,924 17,340 17,671 16,795 17,151 18,220 18,203 18,032 17,039 Malt 700 610 576 576 590 718 854 775 619 540 Wines, brandy, and brandy spirits 3,657 3,585 4,302 4,514 4,301 4,798 5,548 6,195 6,829 6,877 Distilled spirits, except brandy products 3,473 3,656 3,394 3,569 3,888 3,703 3,673 3,911 3,899 3,750 Bottled and canned soft drinks 23,847 25,191 25,416 25,998 28,334 30,203 32,024 31,376 32,268 35,523 Flavoring extracts and syrups 5,332 5,642 6,911 7,249 7,440 7,825 8,068 6,591 6,901 7,471
Miscellaneous foods and food products 32,374 32,597 34,500 36,444 37,100 38,808 40,136 47,874 50,225 50,904 Canned and cured fish and seafood 998 1,029 968 1,042 897 813 864 862 830 1,032 Fresh or frozen prepared fish 6,088 6,079 6,996 6,701 6,848 6,808 6,742 6,057 6,813 6,935 Coffee and tea 6,622 5,919 5,292 5,536 6,127 6,439 6,552 7,975 7,717 7,765 Potato chips and other snacks 6,062 6,646 7,324 7,748 8,167 8,749 9,133 9,657 10,795 10,852 Manufactured ice 326 324 358 397 398 421 403 425 463 466 Macaroni and spaghetti 1,229 1,276 1,389 1,518 1,347 1,558 1,471 1,766 1,457 1,251 Other food preparations 11,047 11,322 12,170 13,502 13,315 14,022 14,971 21,132 22,150 22,603
Total food and kindred products 384,009 397,000 407,156 423,258 430,964 446,867 461,325 484,980 492,023 495,734
NA = Not available.
Source: Annual Survey of Manufactures. Data are compiled according to the SIC code.
54 ● U.S. Food Marketing System, 2002 / AER-811 Economic Research Service/USDA
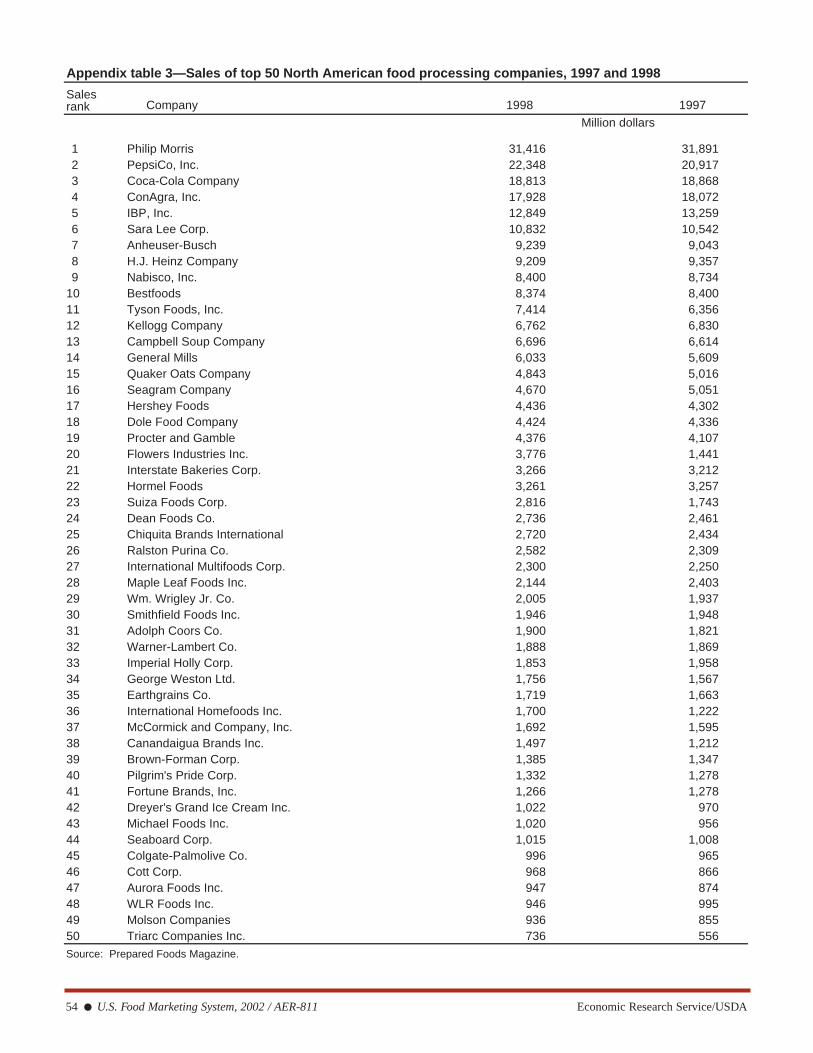
Appendix table 3—Sales of top 50 North American food processing companies, 1997 and 1998
SalesCompany 1998 1997rank
Million dollars
1 Philip Morris 31,416 31,8912 PepsiCo, Inc. 22,348 20,9173 Coca-Cola Company 18,813 18,8684 ConAgra, Inc. 17,928 18,0725 IBP, Inc. 12,849 13,2596 Sara Lee Corp. 10,832 10,5427 Anheuser-Busch 9,239 9,0438 H.J. Heinz Company 9,209 9,3579 Nabisco, Inc. 8,400 8,734
10 Bestfoods 8,374 8,40011 Tyson Foods, Inc. 7,414 6,35612 Kellogg Company 6,762 6,83013 Campbell Soup Company 6,696 6,61414 General Mills 6,033 5,60915 Quaker Oats Company 4,843 5,01616 Seagram Company 4,670 5,05117 Hershey Foods 4,436 4,30218 Dole Food Company 4,424 4,33619 Procter and Gamble 4,376 4,10720 Flowers Industries Inc. 3,776 1,44121 Interstate Bakeries Corp. 3,266 3,21222 Hormel Foods 3,261 3,25723 Suiza Foods Corp. 2,816 1,74324 Dean Foods Co. 2,736 2,46125 Chiquita Brands International 2,720 2,43426 Ralston Purina Co. 2,582 2,30927 International Multifoods Corp. 2,300 2,25028 Maple Leaf Foods Inc. 2,144 2,40329 Wm. Wrigley Jr. Co. 2,005 1,93730 Smithfield Foods Inc. 1,946 1,94831 Adolph Coors Co. 1,900 1,82132 Warner-Lambert Co. 1,888 1,86933 Imperial Holly Corp. 1,853 1,95834 George Weston Ltd. 1,756 1,56735 Earthgrains Co. 1,719 1,66336 International Homefoods Inc. 1,700 1,22237 McCormick and Company, Inc. 1,692 1,59538 Canandaigua Brands Inc. 1,497 1,21239 Brown-Forman Corp. 1,385 1,34740 Pilgrim's Pride Corp. 1,332 1,27841 Fortune Brands, Inc. 1,266 1,27842 Dreyer's Grand Ice Cream Inc. 1,022 97043 Michael Foods Inc. 1,020 95644 Seaboard Corp. 1,015 1,00845 Colgate-Palmolive Co. 996 96546 Cott Corp. 968 86647 Aurora Foods Inc. 947 87448 WLR Foods Inc. 946 99549 Molson Companies 936 85550 Triarc Companies Inc. 736 556
Source: Prepared Foods Magazine.
Economic Research Service/USDA U.S. Food Marketing System, 2002 / AER-811 ● 55
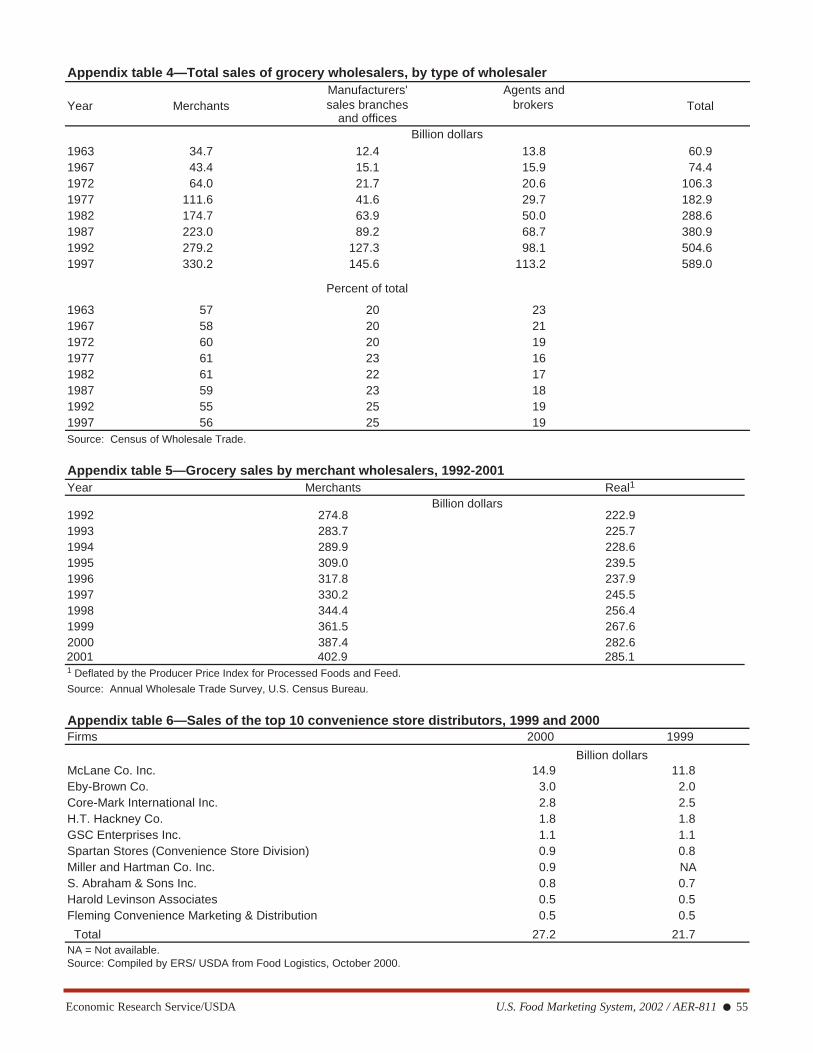
Appendix table 4—Total sales of grocery wholesalers, by type of wholesaler
Year MerchantsManufacturers' Agents and
Totalsales branches brokersand offices
Billion dollars1963 34.7 12.4 13.8 60.91967 43.4 15.1 15.9 74.41972 64.0 21.7 20.6 106.31977 111.6 41.6 29.7 182.91982 174.7 63.9 50.0 288.61987 223.0 89.2 68.7 380.91992 279.2 127.3 98.1 504.61997 330.2 145.6 113.2 589.0
Percent of total
1963 57 20 231967 58 20 211972 60 20 191977 61 23 161982 61 22 171987 59 23 181992 55 25 191997 56 25 19Source: Census of Wholesale Trade.
Appendix table 6—Sales of the top 10 convenience store distributors, 1999 and 2000Firms 2000 1999
Billion dollarsMcLane Co. Inc. 14.9 11.8Eby-Brown Co. 3.0 2.0Core-Mark International Inc. 2.8 2.5H.T. Hackney Co. 1.8 1.8GSC Enterprises Inc. 1.1 1.1Spartan Stores (Convenience Store Division) 0.9 0.8Miller and Hartman Co. Inc. 0.9 NAS. Abraham & Sons Inc. 0.8 0.7Harold Levinson Associates 0.5 0.5Fleming Convenience Marketing & Distribution 0.5 0.5
Total 27.2 21.7
Source: Compiled by ERS/ USDA from Food Logistics, October 2000.NA = Not available.
Appendix table 5—Grocery sales by merchant wholesalers, 1992-2001Year Merchants Real1
Billion dollars1992 274.8 222.91993 283.7 225.71994 289.9 228.61995 309.0 239.51996 317.8 237.91997 330.2 245.51998 344.4 256.41999 361.5 267.62000 387.4 282.6
1 Deflated by the Producer Price Index for Processed Foods and Feed.
Source: Annual Wholesale Trade Survey, U.S. Census Bureau.
2001 402.9 285.1
56 ● U.S. Food Marketing System, 2002 / AER-811 Economic Research Service/USDA
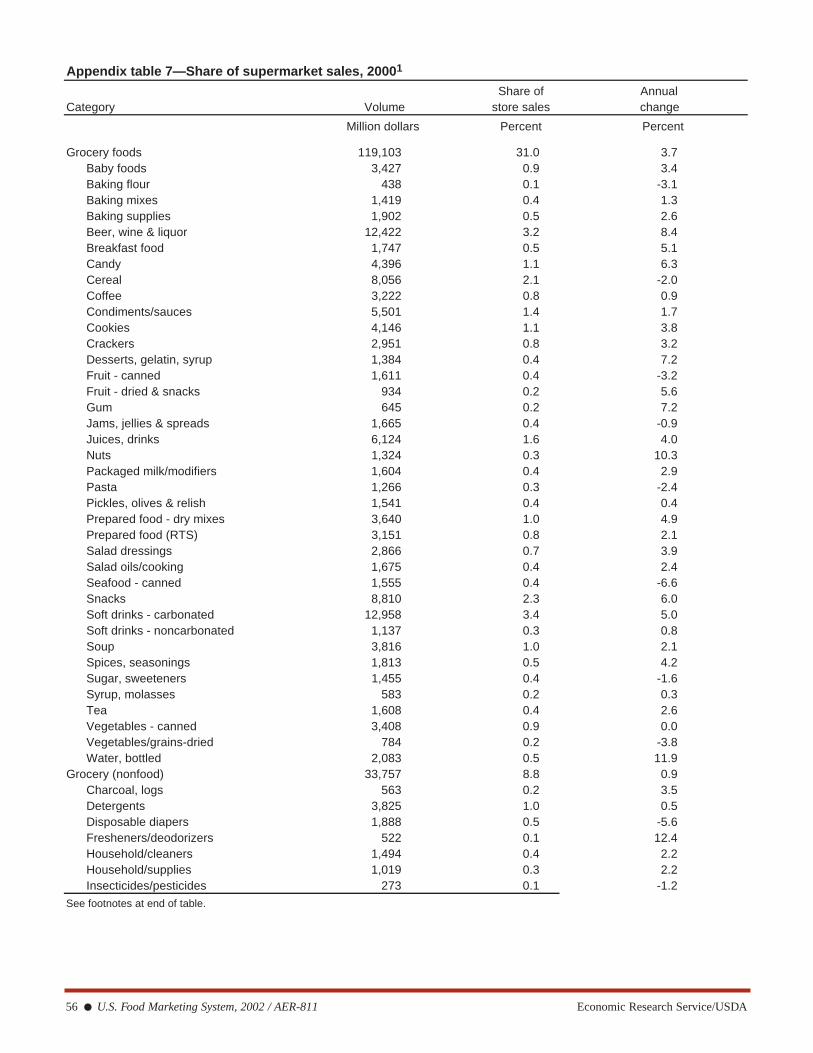
Appendix table 7—Share of supermarket sales, 20001
VolumeShare of Annual
Category store sales change
Million dollars Percent Percent
Grocery foods 119,103 31.0 3.7Baby foods 3,427 0.9 3.4Baking flour 438 0.1 -3.1Baking mixes 1,419 0.4 1.3Baking supplies 1,902 0.5 2.6Beer, wine & liquor 12,422 3.2 8.4Breakfast food 1,747 0.5 5.1Candy 4,396 1.1 6.3Cereal 8,056 2.1 -2.0Coffee 3,222 0.8 0.9Condiments/sauces 5,501 1.4 1.7Cookies 4,146 1.1 3.8Crackers 2,951 0.8 3.2Desserts, gelatin, syrup 1,384 0.4 7.2Fruit - canned 1,611 0.4 -3.2Fruit - dried & snacks 934 0.2 5.6Gum 645 0.2 7.2Jams, jellies & spreads 1,665 0.4 -0.9Juices, drinks 6,124 1.6 4.0Nuts 1,324 0.3 10.3Packaged milk/modifiers 1,604 0.4 2.9Pasta 1,266 0.3 -2.4Pickles, olives & relish 1,541 0.4 0.4Prepared food - dry mixes 3,640 1.0 4.9Prepared food (RTS) 3,151 0.8 2.1Salad dressings 2,866 0.7 3.9Salad oils/cooking 1,675 0.4 2.4Seafood - canned 1,555 0.4 -6.6Snacks 8,810 2.3 6.0Soft drinks - carbonated 12,958 3.4 5.0Soft drinks - noncarbonated 1,137 0.3 0.8Soup 3,816 1.0 2.1Spices, seasonings 1,813 0.5 4.2Sugar, sweeteners 1,455 0.4 -1.6Syrup, molasses 583 0.2 0.3Tea 1,608 0.4 2.6Vegetables - canned 3,408 0.9 0.0Vegetables/grains-dried 784 0.2 -3.8Water, bottled 2,083 0.5 11.9
Grocery (nonfood) 33,757 8.8 0.9Charcoal, logs 563 0.2 3.5Detergents 3,825 1.0 0.5Disposable diapers 1,888 0.5 -5.6Fresheners/deodorizers 522 0.1 12.4Household/cleaners 1,494 0.4 2.2Household/supplies 1,019 0.3 2.2Insecticides/pesticides 273 0.1 -1.2
See footnotes at end of table.
Economic Research Service/USDA U.S. Food Marketing System, 2002 / AER-811 ● 57
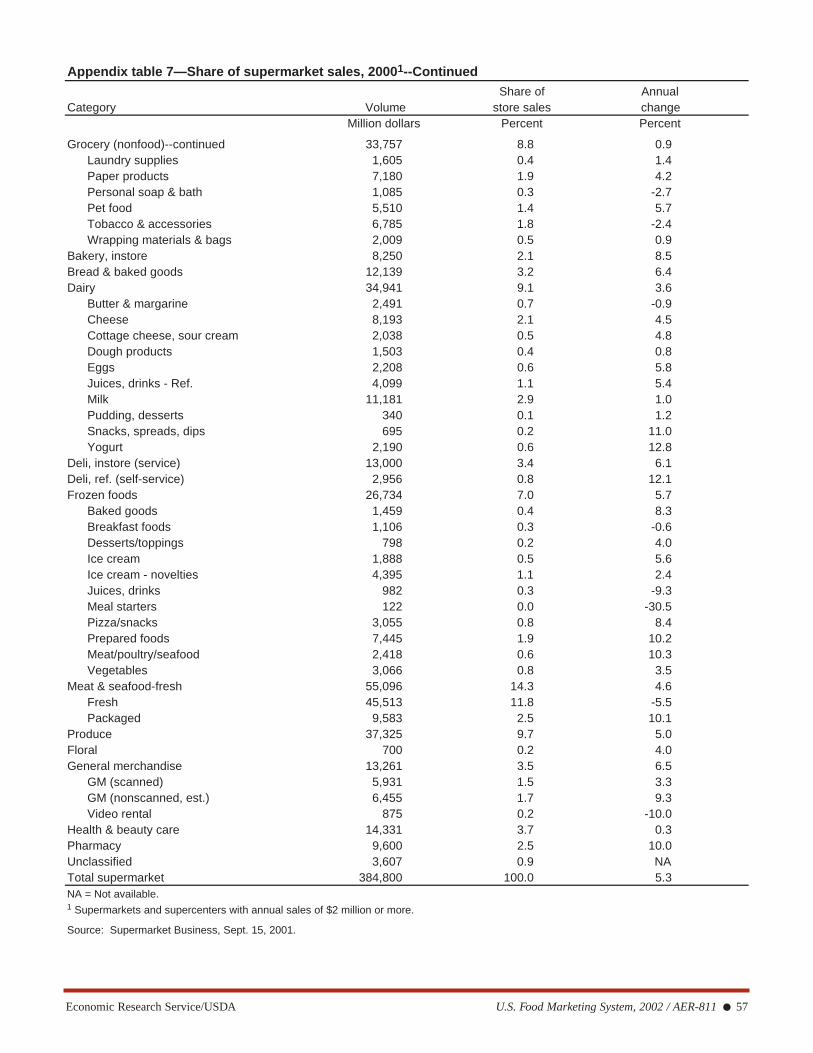
Appendix table 7—Share of supermarket sales, 20001--Continued
VolumeShare of Annual
Category store sales changeMillion dollars Percent Percent
Grocery (nonfood)--continued 33,757 8.8 0.9Laundry supplies 1,605 0.4 1.4Paper products 7,180 1.9 4.2Personal soap & bath 1,085 0.3 -2.7Pet food 5,510 1.4 5.7Tobacco & accessories 6,785 1.8 -2.4Wrapping materials & bags 2,009 0.5 0.9
Bakery, instore 8,250 2.1 8.5Bread & baked goods 12,139 3.2 6.4Dairy 34,941 9.1 3.6
Butter & margarine 2,491 0.7 -0.9Cheese 8,193 2.1 4.5Cottage cheese, sour cream 2,038 0.5 4.8Dough products 1,503 0.4 0.8Eggs 2,208 0.6 5.8Juices, drinks - Ref. 4,099 1.1 5.4Milk 11,181 2.9 1.0Pudding, desserts 340 0.1 1.2Snacks, spreads, dips 695 0.2 11.0Yogurt 2,190 0.6 12.8
Deli, instore (service) 13,000 3.4 6.1Deli, ref. (self-service) 2,956 0.8 12.1Frozen foods 26,734 7.0 5.7
Baked goods 1,459 0.4 8.3Breakfast foods 1,106 0.3 -0.6Desserts/toppings 798 0.2 4.0Ice cream 1,888 0.5 5.6Ice cream - novelties 4,395 1.1 2.4Juices, drinks 982 0.3 -9.3Meal starters 122 0.0 -30.5Pizza/snacks 3,055 0.8 8.4Prepared foods 7,445 1.9 10.2Meat/poultry/seafood 2,418 0.6 10.3Vegetables 3,066 0.8 3.5
Meat & seafood-fresh 55,096 14.3 4.6Fresh 45,513 11.8 -5.5Packaged 9,583 2.5 10.1
Produce 37,325 9.7 5.0Floral 700 0.2 4.0General merchandise 13,261 3.5 6.5
GM (scanned) 5,931 1.5 3.3GM (nonscanned, est.) 6,455 1.7 9.3Video rental 875 0.2 -10.0
Health & beauty care 14,331 3.7 0.3Pharmacy 9,600 2.5 10.0Unclassified 3,607 0.9 NATotal supermarket 384,800 100.0 5.3NA = Not available.1 Supermarkets and supercenters with annual sales of $2 million or more.
Source: Supermarket Business, Sept. 15, 2001.
58 ● U.S. Food Marketing System, 2002 / AER-811 Economic Research Service/USDA
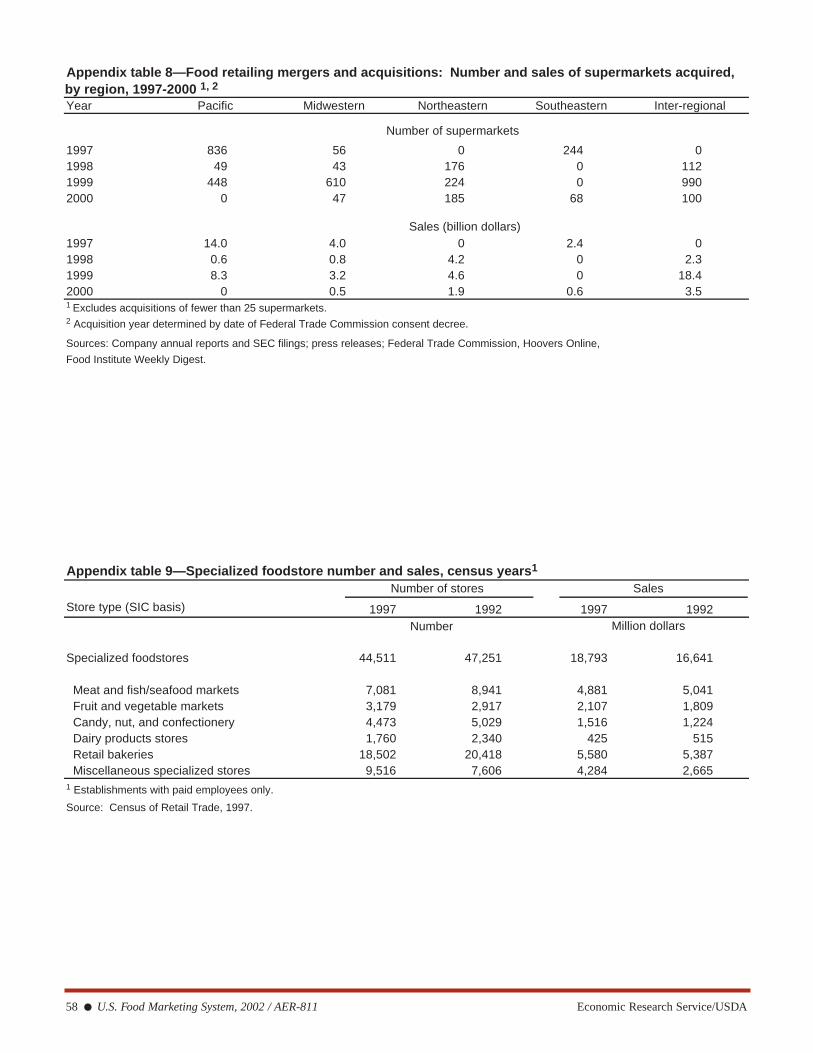
Appendix table 8—Food retailing mergers and acquisitions: Number and sales of supermarkets acquired, by region, 1997-2000 1, 2
Year Pacific Midwestern Northeastern Southeastern Inter-regional
Number of supermarkets
1997 836 56 0 244 01998 49 43 176 0 1121999 448 610 224 0 9902000 0 47 185 68 100
Sales (billion dollars)1997 14.0 4.0 0 2.4 01998 0.6 0.8 4.2 0 2.31999 8.3 3.2 4.6 0 18.42000 0 0.5 1.9 0.6 3.51 Excludes acquisitions of fewer than 25 supermarkets.2 Acquisition year determined by date of Federal Trade Commission consent decree.
Sources: Company annual reports and SEC filings; press releases; Federal Trade Commission, Hoovers Online,
Food Institute Weekly Digest.
Appendix table 9—Specialized foodstore number and sales, census years1
Number of stores Sales
1997 1992 1997 1992Million dollars
Store type (SIC basis)
Specialized foodstores 44,511 47,251 18,793 16,641
Meat and fish/seafood markets 7,081 8,941 4,881 5,041 Fruit and vegetable markets 3,179 2,917 2,107 1,809 Candy, nut, and confectionery 4,473 5,029 1,516 1,224 Dairy products stores 1,760 2,340 425 515 Retail bakeries 18,502 20,418 5,580 5,387 Miscellaneous specialized stores 9,516 7,606 4,284 2,6651 Establishments with paid employees only.
Source: Census of Retail Trade, 1997.
Number
Economic Research Service/USDA U.S. Food Marketing System, 2002 / AER-811 ● 59
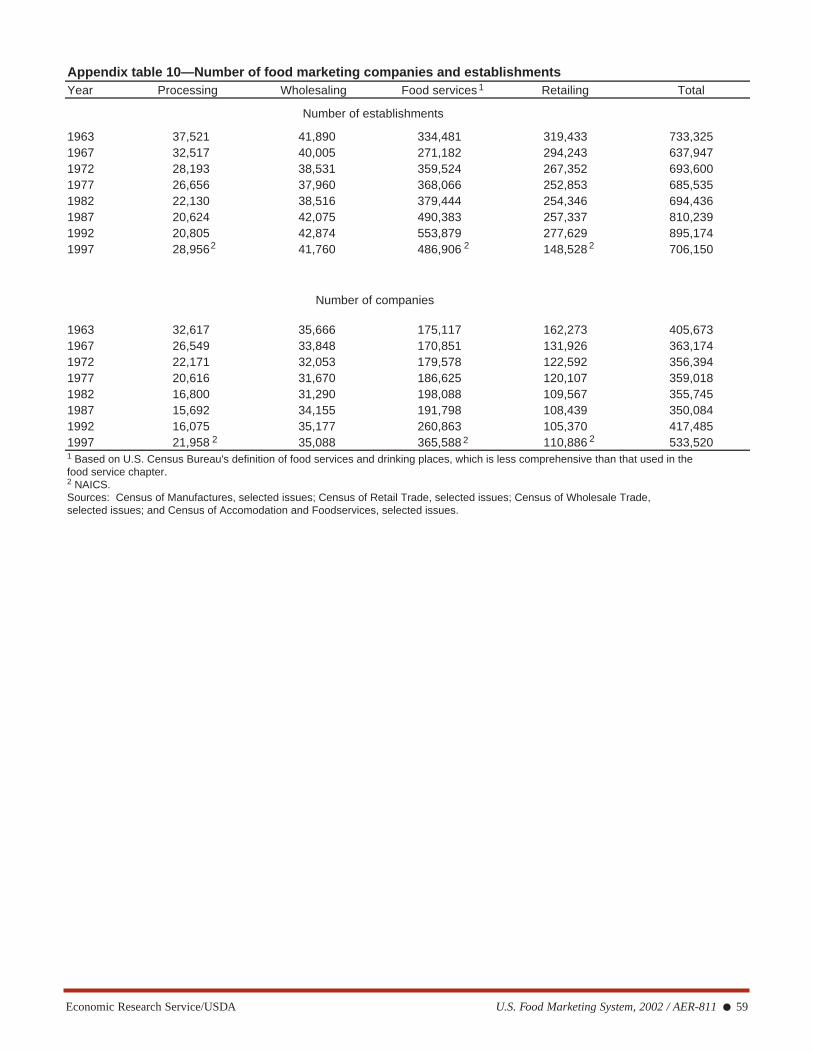
Appendix table 10—Number of food marketing companies and establishmentsYear Processing Wholesaling Food services Retailing Total
Number of establishments
1963 37,521 41,890 334,481 319,433 733,3251967 32,517 40,005 271,182 294,243 637,9471972 28,193 38,531 359,524 267,352 693,6001977 26,656 37,960 368,066 252,853 685,5351982 22,130 38,516 379,444 254,346 694,4361987 20,624 42,075 490,383 257,337 810,2391992 20,805 42,874 553,879 277,629 895,1741997 28,956 41,760 486,906 148,528 706,150
Number of companies
1963 32,617 35,666 175,117 162,273 405,6731967 26,549 33,848 170,851 131,926 363,1741972 22,171 32,053 179,578 122,592 356,3941977 20,616 31,670 186,625 120,107 359,0181982 16,800 31,290 198,088 109,567 355,7451987 15,692 34,155 191,798 108,439 350,0841992 16,075 35,177 260,863 105,370 417,4851997 21,958 35,088 365,588 110,886 533,5201 Based on U.S. Census Bureau's definition of food services and drinking places, which is less comprehensive than that used in thefood service chapter.2 NAICS.Sources: Census of Manufactures, selected issues; Census of Retail Trade, selected issues; Census of Wholesale Trade, selected issues; and Census of Accomodation and Foodservices, selected issues.
2
2 2
22
1
2

60 ● U.S. Food Marketing System, 2002 / AER-811 Economic Research Service/USDA
Appendix table 11—Number of employees in food marketing1
Eating anddrinking Food- Grocery
Year Processing Wholesaling places 2 stores 3 stores Total
Thousands
1963 1,752.0 472.9 1,747.9 1,383.8 NA 5,356.61967 1,786.3 513.0 2,191.4 1,571.6 NA 6,062.31972 1,745.2 536.3 2,860.2 1,805.1 1,577.8 6,946.81977 1,711.0 611.7 3,948.6 2,106.3 1,837.2 8,377.31982 1,635.9 666.8 4,829.4 2,477.3 2,169.6 9,609.4
1983 1,614.4 682.1 5,038.0 2,555.5 2,234.2 9,890.01984 1,611.4 706.6 5,380.9 2,635.9 2,297.3 10,334.81985 1,600.9 733.8 5,698.6 2,773.5 2,428.9 10,806.81986 1,606.9 761.1 5,901.5 2,896.3 2,544.5 11,165.81987 1,616.8 790.5 6,085.9 2,958.3 2,607.7 11,451.51988 1,626.1 820.9 6,250.2 3,073.9 2,723.5 11,771.11989 1,644.4 836.7 6,401.9 3,163.5 2,874.5 12,046.5
1990 1,660.5 849.3 6,509.1 3,215.0 2,880.1 12,233.91991 1,666.9 846.4 6,467.3 3,203.7 2,874.1 12,184.31992 1,662.5 846.9 6,609.3 3,179.5 2,847.1 12,298.21993 1,679.6 847.0 6,821.4 3,224.1 2,883.7 12,572.11994 1,678.0 871.0 7,077.8 3,291.2 2,934.0 12,918.01995 1,691.9 892.1 7,354.2 3,366.0 2,987.5 13,304.21996 1,691.9 895.6 7,516.6 3,435.5 3,034.9 13,539.61997 1,685.3 906.2 7,645.7 3,478.1 3,065.3 13,715.31998 1,683.2 919.9 7,767.8 3,483.5 3,071.9 13,854.41999 1,682.3 937.2 7,960.6 3,496.8 3,086.4 14,076.92000 1,683.8 949.0 8,113.7 3,521.0 3,106.6 14,267.5
NA = Not available.
1 Includes full- and part-time workers. 2 Excludes all noncommercial eating facilities and commercial outlets such as hotel restaurants, department store coffee shops,
and ballpark concessions. 3 Grocery stores are also included in foodstore column.
Source: Employment and Earnings, selected issues, U.S. Department of Labor, Bureau of Labor Statistics.

Economic Research Service/USDA U.S. Food Marketing System, 2002 / AER-811 ● 61
Appendix table 12—-Number of food processing establishments, value added, and cost of materials, 1992 and 19971992 1997
Number of Number of Industry group and industry establishments Value Cost of establishments Value Cost of
Total With 20/ added materials Total With 20/ added materialsmore more
employees employees
------- Number ------ ----- Million dollars ----- ------- Number ------ ----- Million dollars -----
Meat products 3,242 1,486 19,076 75,108 3,164 1,395 29,724 81,521 Meatpacking plants 1,387 431 6,928 43,586 1,393 386 8,525 45,996 Sausages and other prepared meats 1,264 623 5,491 14,455 1,297 622 9,137 15,847 Poultry slaughtering and processing 591 432 6,657 17,067 474 387 12,062 19,678
Dairy products 2,024 1,148 16,063 38,122 1,834 1,037 17,514 41,244 Creamery butter 32 17 148 884 34 21 242 1,134 Cheese, natural and processed 576 314 4,472 13,881 524 307 4,412 15,918 Condensed and evaporated milk 214 134 3,380 4,172 213 122 4,016 4,991 Ice cream and frozen desserts 456 177 2,097 3,211 451 152 2,533 3,313 Fluid milk 746 506 5,966 15,974 612 435 6,311 15,888
Preserved fruit and vegetables 2,052 1,113 22,827 23,481 2,117 1,099 26,457 26,295 Canned specialties 220 76 3,618 3,057 140 64 5,193 2,876 Canned fruit and vegetables 683 397 6,959 8,033 824 418 7,018 8,978 Dehydrated fruit, vegetables, and soups 155 84 1,515 1,318 154 90 1,340 1,694 Pickles, sauces, and salad dressings 376 152 3,749 2,651 329 116 2,970 2,895 Frozen fruit and vegetables 255 201 2,910 4,613 258 198 4,530 5,055 Frozen specialties 363 203 4,076 3,809 412 213 5,406 4,797
Grain mill products 2,618 1,077 21,086 28,916 2,531 1,039 23,560 37,448 Flour and other grain mill products 365 172 1,625 4,675 383 172 1,899 6,139 Breakfast cereals 65 42 7,338 2,471 71 47 6,672 2,596 Rice milling 53 33 437 1,204 68 38 669 1,812 Blended and prepared flour 209 122 1,822 2,040 249 119 2,392 2,423 Wet corn milling 51 34 3,258 3,742 58 39 3,071 5,361 Dog, cat, and other pet food 161 105 3,730 3,296 188 98 4,359 4,427 Other prepared feeds 1,714 569 2,876 11,488 1,514 526 4,498 14,690
Bakery products 3,152 1,259 17,904 10,594 3,384 1,446 21,787 12,146 Bread, cake, and related products 2,539 946 11,462 6,680 2,766 1,073 14,009 7,445 Cookies and crackers 441 212 5,523 3,151 380 184 6,395 3,540 Frozen bakery products, except bread 172 101 919 763 238 189 1,383 1,161
Sugar and confectionery products 1,129 492 10,951 12,957 1,884 528 13,482 14,848 Raw cane sugar 45 41 562 888 39 31 638 882 Cane sugar, refined 17 15 737 2,138 18 12 540 2,678 Beet sugar 40 37 800 1,559 36 36 969 1,768 Confectionery products 759 298 6,349 3,903 1,486 337 7,899 5,127 Chocolate and cocoa products 156 32 1,475 1,632 164 33 1,892 2,030 Salted and roasted nuts and seeds 112 69 1,028 2,837 141 79 1,544 2,363
Fats and oils 540 322 3,759 15,947 519 327 4,788 21,151 Soybean oil mills 99 70 1,274 9,373 93 69 1,695 12,835 Other oilseed processing 71 49 345 1,043 54 37 247 1,419 Animal and marine fats and oils 268 137 755 2,085 240 143 1,257 1,325 Edible fats and oils 102 66 1,385 3,446 132 78 1,589 5,572
Continued--
62 ● U.S. Food Marketing System, 2002 / AER-811 Economic Research Service/USDA
Appendix table 12—Number of food processing establishments, value added, and cost of materials, 1992 and 1997--Continued
1992 1997 Number of Number of
Industry group and industry establishments Value Cost of establishments Value Cost ofTotal With 20/ added materials Total With 20/ added materials
more moreemployees employees
------- Number ------ ----- Million dollars ----- ------- Number ------ ----- Million dollars -----
Beverages 2,064 972 29,256 28,913 2,243 965 34,514 33,822 Malt beverages 194 75 10,189 7,180 529 156 11,234 6,967 Malt 26 18 176 387 35 19 210 562 Wines, brandy, and brandy spirits 553 136 2,089 2,394 687 178 3,161 3,664 Distilled spirits, except brandy products 65 48 1,946 1,447 60 42 2,211 1,713 Bottled and canned soft drinks 926 572 9,586 15,853 757 502 12,753 19,268 Flavoring extracts and syrups 300 123 5,270 1,652 175 68 4,945 1,648
Miscellaneous foods and food products 3,984 1,469 16,322 18,199 4,159 1,549 21,246 21,667 Canned and cured fish and seafood 158 61 362 607 165 58 331 533 Fresh or frozen prepared fish 684 366 2,325 4,671 678 329 2,216 3,904 Coffee and tea 172 90 2,753 2,530 247 109 3,642 4,396 Potato chips and other snacks 409 215 3,913 3,409 416 205 5,947 3,808 Manufactured ice 562 59 255 104 582 75 298 129 Macaroni and spaghetti 199 41 831 565 266 42 1,045 716 Other food preparations 1,800 637 5,883 6,313 1,805 731 7,767 8,181
Total food and kindred products 20,805 9,338 157,244 252,237 21,835 9,385 193,072 290,142
Source: Census of Manufactures. The census is conducted every 5 years. For comparison with 1992, data for 1997 are compiled according to the SIC code.
Appendix table 13—Share of market controlled by top 20 firms, 1992 and 19971992 1997
Manufacturing firms 43.71 51.11
Wholesaling firms 25.2 25.7
Retailing firms 37.0 43.9
Foodservice firms 17.0 14.32
1 Rodgers, Structural Change in U.S. Food Manufacturing, 1958 to 1997.2 Based on NAICS, not comparable with earlier SIC data.
Economic Research Service/USDA U.S. Food Marketing System, 2002 / AER-811 ● 63
Appendix table 14—Share of shipment value for the four and eight largest food processing firms, 1992Share of shipment value
4 largest 8 largestIndustry Companies firms firms
-----Percent-----
Meatpacking 1,296 50 66Sausages 1,128 25 33Poultry and egg processing 373 34 45Butter 31 49 78Cheese 418 42 60Condensed and evaporated milk 153 43 55Ice cream 411 24 40Fluid milk 525 22 30Canned specialties 200 69 84
Canned fruit and vegetables 502 27 42Dehydrated fruit and vegetables 124 39 59Pickles, sauces, and salad dressings 332 41 56Frozen fruit and vegetables 182 28 42Frozen specialties 308 40 57Flour and grain milling 230 56 68Breakfast cereals 42 85 98Rice milling 44 50 73
Blended and prepared flour 156 39 57Wet corn milling 28 73 93Pet food 102 58 77Prepared feeds 1,161 23 33Breads and cakes 2,180 34 49Cookies and crackers 374 56 70Raw cane sugar 37 52 69Cane sugar refining 12 85 99Beet sugar 13 71 93Confectionery 705 45 59Chocolate and cocoa 146 75 88Cottonseed oil mills 22 62 81Soybean oil 42 71 91Vegetable oil 18 89 97Animal and marine fats and oils 159 37 52Shortening and cooking oils 72 35 56Malt beverages 160 90 98Malt 16 65 97Wines and brandy 514 54 66
Distilled spirits 43 62 82Bottled and canned soft drinks 637 37 48Flavoring extracts and syrups 264 69 75Canned or cured seafood 144 29 50Fresh or frozen seafood 600 19 28Roasted coffee 134 66 75Manufactured ice 513 24 32Macaroni and spaghetti 182 78 85Other food preparations 1,644 22 34 Source: Census of Manufactures, selected issues.
64 ● U.S. Food Marketing System, 2002 / AER-811 Economic Research Service/USDA
Appendix table 15—Share of shipment value for the four and eight largest food processing firms, 19971
Percent of shipment value4 largest 8 largest
Industry Companies firms firms
-----Percent-----
Animal food 1,077 23.1 34.7Dog and cat food 129 58.4 80.2Other animal food 962 23.7 36.3
Grain and oilseed milling 534 45.3 59.1Flour milling 254 48.4 62.5Rice milling 56 51.8 75.3Malt 19 69.0 94.5Wet corn milling 30 71.7 90.3Soybean processing 43 79.6 94.5Other oilseed processing 32 66.6 81.9Fats and oils refining & blending 91 36.7 63.0Breakfast cereal 48 82.9 93.5
Sugar & confectionery product 1,556 41.9 56.4Sugarcane mills 34 56.6 71.4Cane sugar refining 12 98.7 99.9Beet sugar 8 85.0 100.0Chocolate-confectionery from cacao beans 152 79.5 92.5Chocolate-confectionery from purchased chocolate 796 65.2 75.3Nonchocolate confectionery 578 40.7 60.1
Fruits & vegetable preserving 1,394 26.6 35.6Frozen fruit, juice & vegetable 177 34.3 47.4Frozen specialty food 363 40.2 56.9Fruit & vegetable canning 661 24.9 38.0Specialty canning 122 67.2 83.5Dried & dehydrated food 125 30.3 51.1
Dairy product 1,329 16.5 26.0Fluid milk 402 21.3 31.0Creamery butter 32 52.4 73.2Cheese 399 34.6 50.9Dry, condensed, & evaporated dairy prod. 169 47.1 58.6Ice cream & frozen dessert 409 32.3 48.7
Meat product mfg 2,794 35.0 47.5Animal (except poultry) slaughtering 1,307 57.0 70.8Meat processed from carcasses 1,163 20.4 30.3Rendering & meat byproduct processing 137 37.4 54.1Poultry processing 257 40.6 54.0
Seafood product preparation & packaging 731 12.4 20.9Seafood canning 152 25.9 42.5Fresh & frozen seafood processing 586 13.6 22.9
Bakeries & tortilla 10,437 28.6 40.1Retail bakeries 6,906 2.5 3.9Commercial bakeries 2,401 39.2 51.3Frozen cakes, pies, & other pastries 223 38.2 49.8Cookies & crackers 322 59.9 71.9
See footnotes at end of table. Continued--
Number
Economic Research Service/USDA U.S. Food Marketing System, 2002 / AER-811 ● 65
Appendix table 15—Share of shipment value for the four and eight largest food processing firms, 19971--Continued
Percent of shipment value4 largest 8 largest
Industry Companies firms firms-----Percent-----
Bakeries & tortilla--continuedFlour mixes & dough mfg from purchased flour 206 43.7 58.2Dry pasta 249 57.1 74.3Tortilla 217 57.2 64.2
Other food 2,493 34.7 42.7Roasted nuts & peanut butter 128 37.5 57.6Other snack food 340 70.9 76.5Coffee & tea 215 52.5 65.6Flavoring syrup & concentrate 149 80.7 87.9Mayonnaise, dressing, & other prepared sauce 293 40.3 56.5Spice & extract 241 43.7 53.5Perishable prepared food 415 24.3 35.6All other miscellaneous food 785 23.5 34.6
Beverage 2,169 40.9 52.1Soft drink 388 47.2 55.6Bottled water 109 51.7 64.4Ice mfg 514 24.4 31.3Breweries 494 89.7 93.4Wineries 637 43.2 59.2Distilleries 44 59.8 77.0
1 NAICS.
Source: 1997 Economic Census - Concentration Ratios in Manufacturing.
Number
66 ● U.S. Food Marketing System, 2002 / AER-811 Economic Research Service/USDA
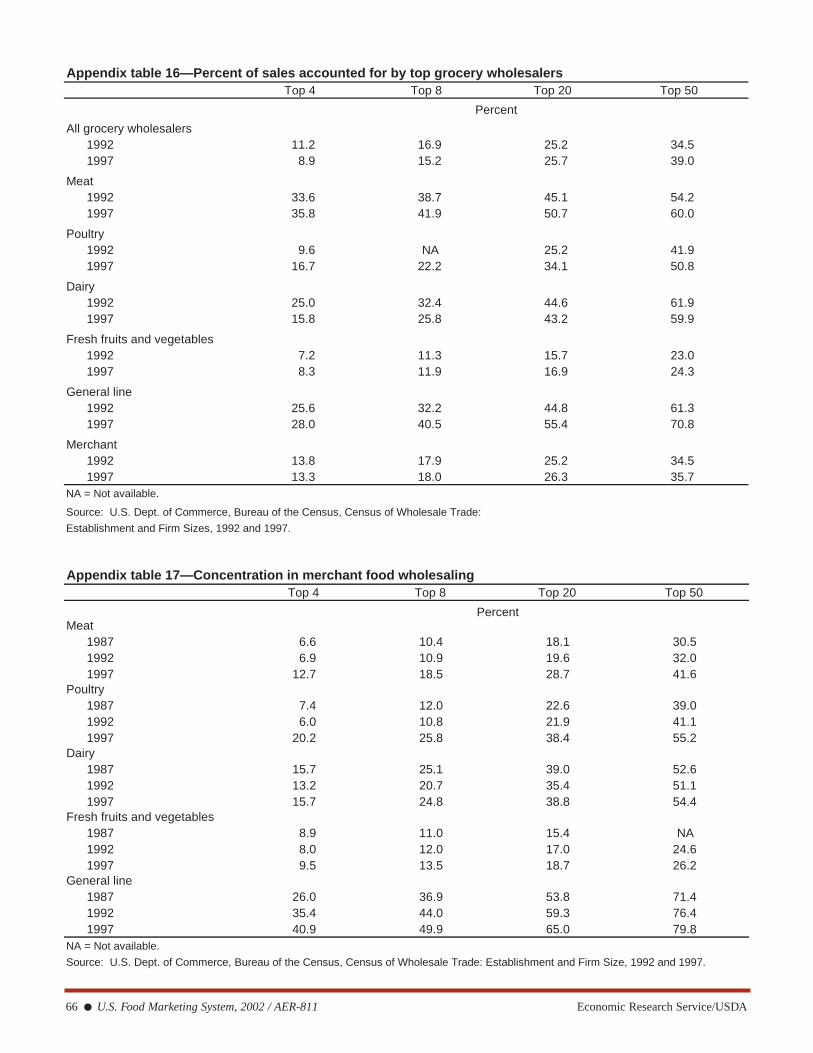
Appendix table 16—Percent of sales accounted for by top grocery wholesalers Top 4 Top 8 Top 20 Top 50
Percent
All grocery wholesalers1992 11.2 16.9 25.2 34.51997 8.9 15.2 25.7 39.0
Meat1992 33.6 38.7 45.1 54.21997 35.8 41.9 50.7 60.0
Poultry1992 9.6 NA 25.2 41.91997 16.7 22.2 34.1 50.8
Dairy1992 25.0 32.4 44.6 61.91997 15.8 25.8 43.2 59.9
Fresh fruits and vegetables1992 7.2 11.3 15.7 23.01997 8.3 11.9 16.9 24.3
General line1992 25.6 32.2 44.8 61.31997 28.0 40.5 55.4 70.8
Merchant1992 13.8 17.9 25.2 34.51997 13.3 18.0 26.3 35.7
NA = Not available.
Source: U.S. Dept. of Commerce, Bureau of the Census, Census of Wholesale Trade:
Establishment and Firm Sizes, 1992 and 1997.
Appendix table 17—Concentration in merchant food wholesaling Top 4 Top 8 Top 20 Top 50
PercentMeat
1987 6.6 10.4 18.1 30.51992 6.9 10.9 19.6 32.01997 12.7 18.5 28.7 41.6
Poultry1987 7.4 12.0 22.6 39.01992 6.0 10.8 21.9 41.11997 20.2 25.8 38.4 55.2
Dairy1987 15.7 25.1 39.0 52.61992 13.2 20.7 35.4 51.11997 15.7 24.8 38.8 54.4
Fresh fruits and vegetables1987 8.9 11.0 15.4 NA1992 8.0 12.0 17.0 24.61997 9.5 13.5 18.7 26.2
General line1987 26.0 36.9 53.8 71.41992 35.4 44.0 59.3 76.41997 40.9 49.9 65.0 79.8
NA = Not available.
Source: U.S. Dept. of Commerce, Bureau of the Census, Census of Wholesale Trade: Establishment and Firm Size, 1992 and 1997.
Economic Research Service/USDA U.S. Food Marketing System, 2002 / AER-811 ● 67
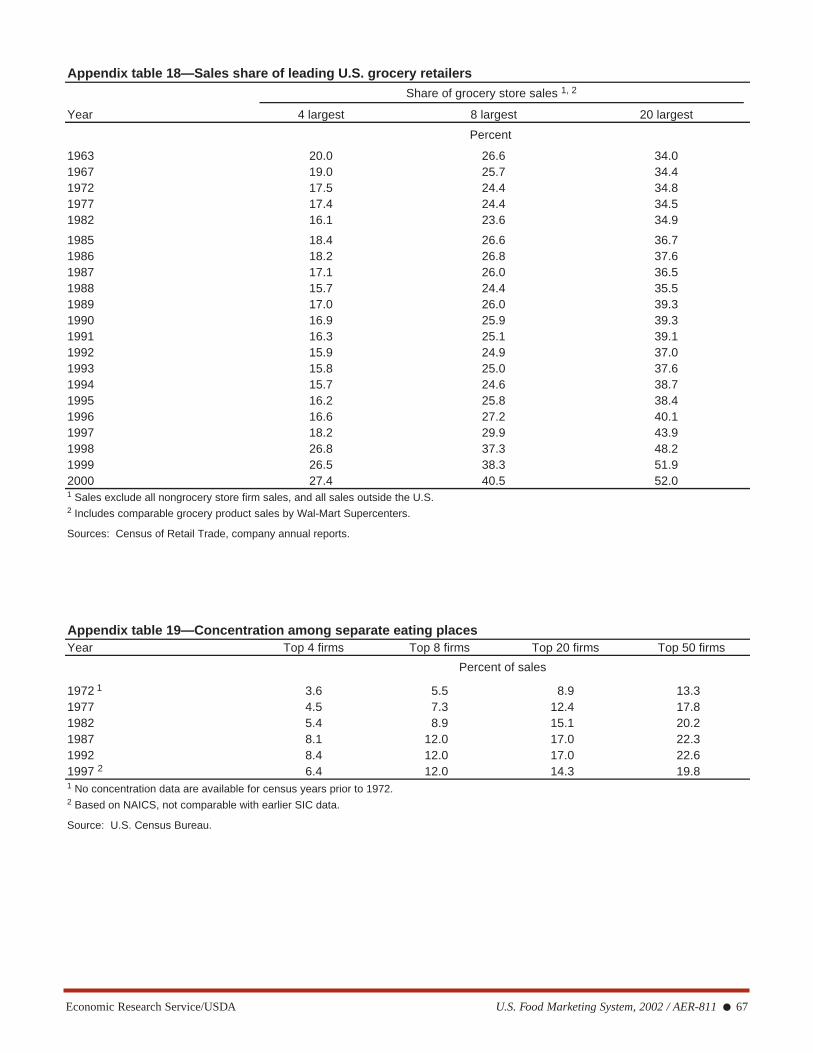
Appendix table 18—Sales share of leading U.S. grocery retailers Share of grocery store sales 1, 2
Year 4 largest 8 largest 20 largest
Percent
1963 20.0 26.6 34.01967 19.0 25.7 34.41972 17.5 24.4 34.81977 17.4 24.4 34.51982 16.1 23.6 34.9
1985 18.4 26.6 36.71986 18.2 26.8 37.61987 17.1 26.0 36.51988 15.7 24.4 35.51989 17.0 26.0 39.31990 16.9 25.9 39.31991 16.3 25.1 39.11992 15.9 24.9 37.01993 15.8 25.0 37.61994 15.7 24.6 38.71995 16.2 25.8 38.41996 16.6 27.2 40.11997 18.2 29.9 43.91998 26.8 37.3 48.21999 26.5 38.3 51.92000 27.4 40.5 52.01 Sales exclude all nongrocery store firm sales, and all sales outside the U.S.2 Includes comparable grocery product sales by Wal-Mart Supercenters.
Sources: Census of Retail Trade, company annual reports.
Appendix table 19—Concentration among separate eating placesYear Top 4 firms Top 8 firms Top 20 firms Top 50 firms
Percent of sales
1972 1 3.6 5.5 8.9 13.31977 4.5 7.3 12.4 17.81982 5.4 8.9 15.1 20.21987 8.1 12.0 17.0 22.31992 8.4 12.0 17.0 22.61997 2 6.4 12.0 14.3 19.81 No concentration data are available for census years prior to 1972.2 Based on NAICS, not comparable with earlier SIC data.
Source: U.S. Census Bureau.
68 ● U.S. Food Marketing System, 2002 / AER-811 Economic Research Service/USDA
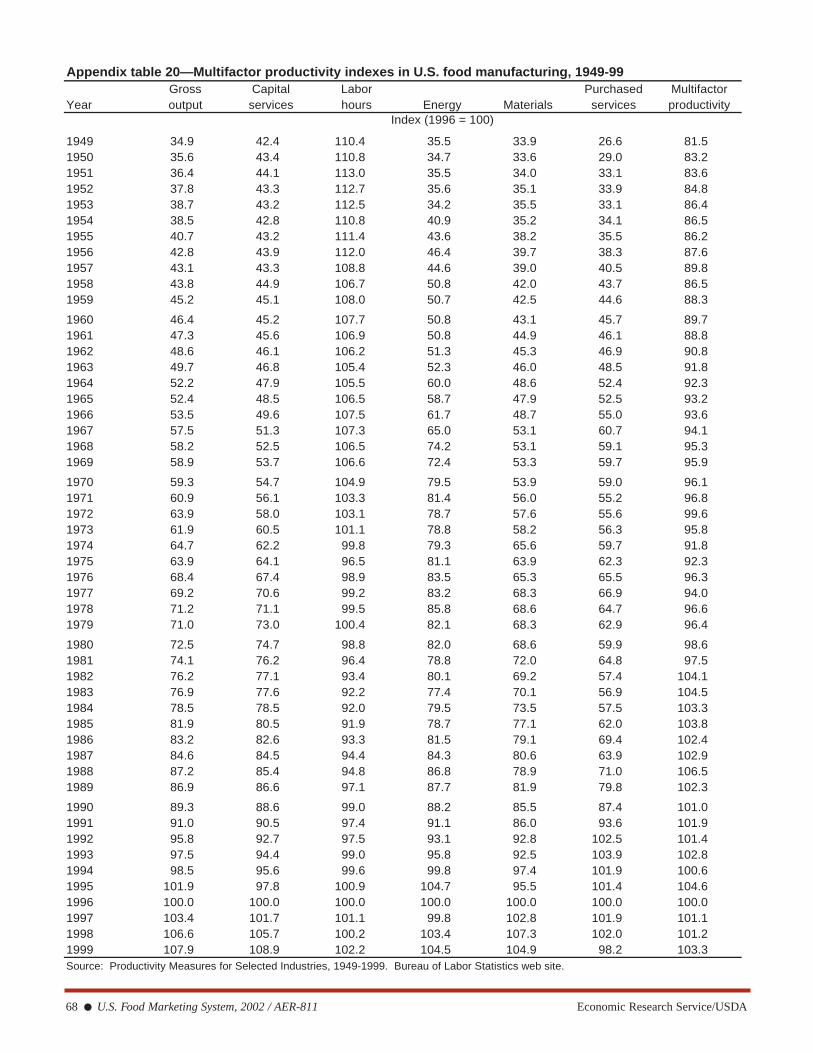
Appendix table 20—Multifactor productivity indexes in U.S. food manufacturing, 1949-99Gross Capital Labor Purchased Multifactor
Year output services hours Energy Materials services productivityIndex (1996 = 100)
1949 34.9 42.4 110.4 35.5 33.9 26.6 81.51950 35.6 43.4 110.8 34.7 33.6 29.0 83.21951 36.4 44.1 113.0 35.5 34.0 33.1 83.61952 37.8 43.3 112.7 35.6 35.1 33.9 84.81953 38.7 43.2 112.5 34.2 35.5 33.1 86.41954 38.5 42.8 110.8 40.9 35.2 34.1 86.51955 40.7 43.2 111.4 43.6 38.2 35.5 86.21956 42.8 43.9 112.0 46.4 39.7 38.3 87.61957 43.1 43.3 108.8 44.6 39.0 40.5 89.81958 43.8 44.9 106.7 50.8 42.0 43.7 86.51959 45.2 45.1 108.0 50.7 42.5 44.6 88.3
1960 46.4 45.2 107.7 50.8 43.1 45.7 89.71961 47.3 45.6 106.9 50.8 44.9 46.1 88.81962 48.6 46.1 106.2 51.3 45.3 46.9 90.81963 49.7 46.8 105.4 52.3 46.0 48.5 91.81964 52.2 47.9 105.5 60.0 48.6 52.4 92.31965 52.4 48.5 106.5 58.7 47.9 52.5 93.21966 53.5 49.6 107.5 61.7 48.7 55.0 93.61967 57.5 51.3 107.3 65.0 53.1 60.7 94.11968 58.2 52.5 106.5 74.2 53.1 59.1 95.31969 58.9 53.7 106.6 72.4 53.3 59.7 95.9
1970 59.3 54.7 104.9 79.5 53.9 59.0 96.11971 60.9 56.1 103.3 81.4 56.0 55.2 96.81972 63.9 58.0 103.1 78.7 57.6 55.6 99.61973 61.9 60.5 101.1 78.8 58.2 56.3 95.81974 64.7 62.2 99.8 79.3 65.6 59.7 91.81975 63.9 64.1 96.5 81.1 63.9 62.3 92.31976 68.4 67.4 98.9 83.5 65.3 65.5 96.31977 69.2 70.6 99.2 83.2 68.3 66.9 94.01978 71.2 71.1 99.5 85.8 68.6 64.7 96.61979 71.0 73.0 100.4 82.1 68.3 62.9 96.4
1980 72.5 74.7 98.8 82.0 68.6 59.9 98.61981 74.1 76.2 96.4 78.8 72.0 64.8 97.51982 76.2 77.1 93.4 80.1 69.2 57.4 104.11983 76.9 77.6 92.2 77.4 70.1 56.9 104.51984 78.5 78.5 92.0 79.5 73.5 57.5 103.31985 81.9 80.5 91.9 78.7 77.1 62.0 103.81986 83.2 82.6 93.3 81.5 79.1 69.4 102.41987 84.6 84.5 94.4 84.3 80.6 63.9 102.91988 87.2 85.4 94.8 86.8 78.9 71.0 106.51989 86.9 86.6 97.1 87.7 81.9 79.8 102.3
1990 89.3 88.6 99.0 88.2 85.5 87.4 101.01991 91.0 90.5 97.4 91.1 86.0 93.6 101.91992 95.8 92.7 97.5 93.1 92.8 102.5 101.41993 97.5 94.4 99.0 95.8 92.5 103.9 102.81994 98.5 95.6 99.6 99.8 97.4 101.9 100.61995 101.9 97.8 100.9 104.7 95.5 101.4 104.61996 100.0 100.0 100.0 100.0 100.0 100.0 100.01997 103.4 101.7 101.1 99.8 102.8 101.9 101.11998 106.6 105.7 100.2 103.4 107.3 102.0 101.21999 107.9 108.9 102.2 104.5 104.9 98.2 103.3Source: Productivity Measures for Selected Industries, 1949-1999. Bureau of Labor Statistics web site.
Economic Research Service/USDA U.S. Food Marketing System, 2002 / AER-811 ● 69
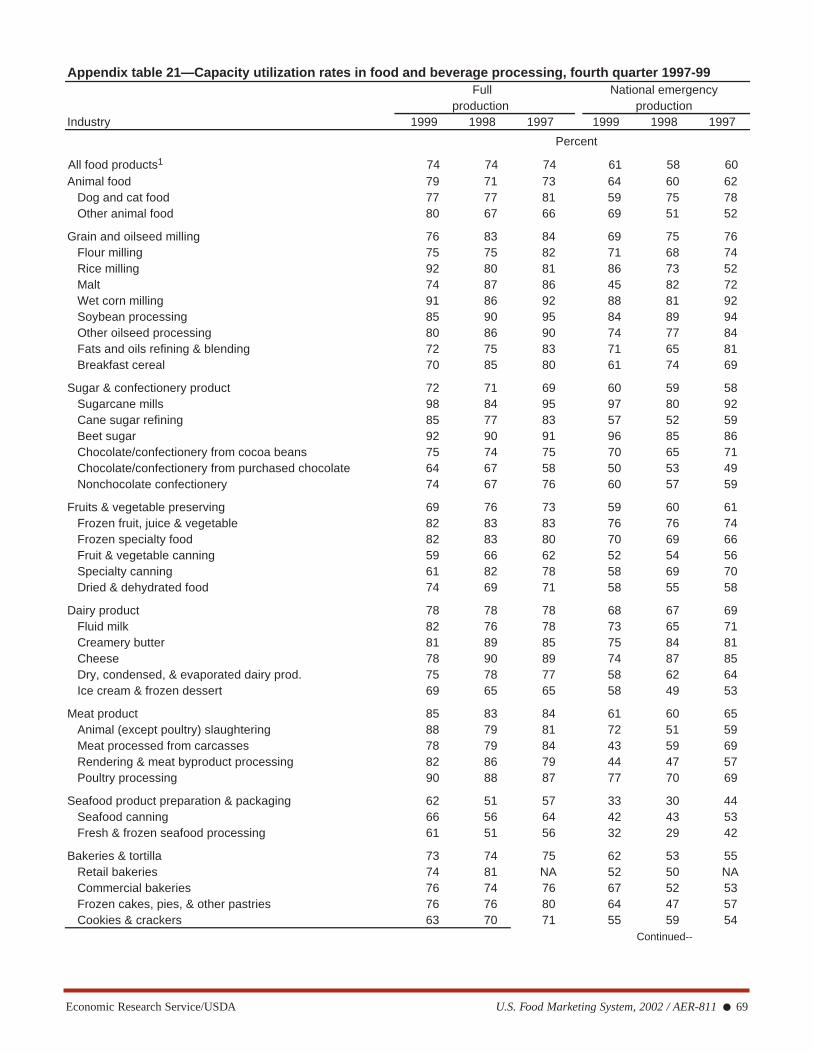
Appendix table 21—Capacity utilization rates in food and beverage processing, fourth quarter 1997-99Full National emergency
production productionIndustry 1999 1998 1997 1999 1998 1997
Percent
Animal food 79 71 73 64 60 62Dog and cat food 77 77 81 59 75 78Other animal food 80 67 66 69 51 52
Grain and oilseed milling 76 83 84 69 75 76Flour milling 75 75 82 71 68 74Rice milling 92 80 81 86 73 52Malt 74 87 86 45 82 72Wet corn milling 91 86 92 88 81 92Soybean processing 85 90 95 84 89 94Other oilseed processing 80 86 90 74 77 84Fats and oils refining & blending 72 75 83 71 65 81Breakfast cereal 70 85 80 61 74 69
Sugar & confectionery product 72 71 69 60 59 58Sugarcane mills 98 84 95 97 80 92Cane sugar refining 85 77 83 57 52 59Beet sugar 92 90 91 96 85 86Chocolate/confectionery from cocoa beans 75 74 75 70 65 71Chocolate/confectionery from purchased chocolate 64 67 58 50 53 49Nonchocolate confectionery 74 67 76 60 57 59
Fruits & vegetable preserving 69 76 73 59 60 61Frozen fruit, juice & vegetable 82 83 83 76 76 74Frozen specialty food 82 83 80 70 69 66Fruit & vegetable canning 59 66 62 52 54 56Specialty canning 61 82 78 58 69 70Dried & dehydrated food 74 69 71 58 55 58
Dairy product 78 78 78 68 67 69Fluid milk 82 76 78 73 65 71Creamery butter 81 89 85 75 84 81Cheese 78 90 89 74 87 85Dry, condensed, & evaporated dairy prod. 75 78 77 58 62 64Ice cream & frozen dessert 69 65 65 58 49 53
Meat product 85 83 84 61 60 65Animal (except poultry) slaughtering 88 79 81 72 51 59Meat processed from carcasses 78 79 84 43 59 69Rendering & meat byproduct processing 82 86 79 44 47 57Poultry processing 90 88 87 77 70 69
Seafood product preparation & packaging 62 51 57 33 30 44Seafood canning 66 56 64 42 43 53Fresh & frozen seafood processing 61 51 56 32 29 42
Bakeries & tortilla 73 74 75 62 53 55Retail bakeries 74 81 NA 52 50 NACommercial bakeries 76 74 76 67 52 53Frozen cakes, pies, & other pastries 76 76 80 64 47 57Cookies & crackers 63 70 71 55 59 54
Continued--
All food products1 74 74 74 61 58 60
70 ● U.S. Food Marketing System, 2002 / AER-811 Economic Research Service/USDA
Appendix table 21—Capacity utilization rates in food and beverage processing, fourth quarter 1997-99--Continued
Full National emergencyproduction production
Industry 1999 1998 1997 1999 1998 1997 Percent
Bakeries & tortilla--continuedFlour mixes & dough mfg from purchased flour 80 79 78 64 62 65Dry pasta 70 64 76 71 36 64Tortilla 78 NA NA 66 NA NA
Other food 68 63 64 58 52 51Roasted nuts & peanut butter 82 72 73 63 61 61Other snack food 74 72 79 64 55 62Coffee & tea 77 59 68 64 51 53Flavoring syrup & concentrate 61 53 49 52 43 37Mayonnaise, dressing, & other prepared sauce 58 70 74 52 61 64Spice & extract 65 64 61 53 55 50Perishable prepared food 67 51 51 53 43 40All other miscellaneous food 68 68 65 60 57 55
Beverages 70 68 68 59 52 50Soft drink 64 61 66 54 47 50Bottled wate 56 45 56 36 34 15Ice 40 43 31 33 19 16Breweries 85 82 71 86 82 57Wineries 71 79 80 49 39 63Distilleries 55 63 65 41 37 44
NA = Not available.1 Excludes beverages.
Source: Current Industrial Reports, Survey of Plant Capacity, U.S. Department of Commerce, Bureau of the Census.
Economic Research Service/USDA U.S. Food Marketing System, 2002 / AER-811 ● 71
Appendix table 22—Financial performance of food manufacturing and kindred products companies 1, 2
Share of sales Share of assets Profit rateTotal
Return stock-on holders'
Income Stock- stock- Return equity toOperating Nonoperating before Long-term holders' holders' on total
Year income expenses taxes debt equity equity assets debt-----------------------------------------Percent------------------------------------------ Ratio
1982 4.8 0.2 4.6 19.0 48.1 13.0 6.3 1.8
1989 7.6 0.5 7.1 29.6 38.9 21.0 8.2 1.11990 8.5 -2.2 6.3 34.4 32.5 16.1 5.3 0.81991 8.4 -1.2 7.2 32.7 34.5 17.6 6.1 0.91992 8.8 -1.9 6.9 31.2 35.3 15.6 5.5 0.91993 7.7 -2.1 5.6 30.6 34.5 13.5 4.7 0.91994 8.4 -1.0 7.4 29.4 34.6 17.8 6.1 0.91995 8.3 -1.1 7.2 22.8 35.6 18.5 6.6 1.01996 8.7 -2.0 6.7 28.9 35.3 19.1 6.7 1.01997 9.0 -1.2 7.8 29.3 34.3 19.8 6.8 0.91998 9.5 3.0 6.5 29.6 33.3 20.1 6.7 0.91999 9.2 4.0 5.2 29.6 31.2 21.1 6.6 0.82000 9.6 4.6 5.0 29.0 30.3 24.1 7.3 0.81 Includes tobacco industry data.2 Annual measures based on averages of quarterly data.
Source: Quarterly Financial Report, various years (U.S. Census Bureau).
Appendix table 23—Financial performance of food retailing companies with assets of $50 million or more1
Share of sales Share of assets Profit rate TotalReturn stock-
on holders'Income Stock- stock- Return equity to
Operating Nonoperating before Long-term holders' holders' on totalYear income 2 expenses taxes debt equity equity 3 assets 3 debt
-----------------------------------------Percent------------------------------------------ Ratio
1981 1.9 0.2 1.7 21.0 36.3 12.5 0.9 1.5
1989 2.6 1.2 1.4 43.9 16.2 14.6 2.4 0.31990 2.7 1.7 1.0 45.1 14.5 11.2 1.6 0.31991 2.7 1.4 1.3 43.0 17.0 14.5 2.4 0.41992 2.8 1.6 1.2 44.8 16.4 9.8 1.6 0.41993 2.9 1.6 1.3 40.8 17.7 7.5 1.3 0.41994 3.1 1.0 2.1 38.6 20.1 14.0 2.8 0.51995 3.1 1.3 2.1 35.8 23.7 17.2 4.2 0.31996 3.2 1.4 2.3 36.9 24.5 16.9 4.1 0.31997 3.5 1.4 2.4 38.1 25.4 17.2 4.1 0.31998 3.6 1.0 2.6 37.6 27.1 16.1 4.4 0.71999 3.9 1.3 2.6 38.3 27.6 15.7 4.3 0.72000 3.8 1.3 2.5 37.4 29.1 12.4 3.6 0.71 Annual measures based on average of quarterly data.2 Before taxes.3 After taxes.
Source: Quarterly Financial Report, various years (U.S. Census Bureau).
72 ● U.S. Food Marketing System, 2002 / AER-811 Economic Research Service/USDA
Appendix table 24—Labor productivity in food processing and retailingFood processing Food- Eating and
Bakery Candy and Soft stores drinkingYear Red meats Milk products confectionery Malt drinks places
Output per person per hour, Index (1987=100)
1967 61.3 37.9 72.1 65.3 26.9 41.4 102.2 103.61972 69.7 51.4 81.9 76.5 37.5 47.0 114.2 108.71977 81.9 60.3 86.9 84.6 56.7 62.2 107.3 106.7
1982 91.9 81.6 89.8 76.6 69.5 71.1 102.2 103.51983 95.5 86.1 93.4 82.3 75.5 75.7 102.1 102.51984 97.0 89.4 93.9 82.5 80.2 81.6 102.4 98.91985 99.7 92.2 95.5 85.9 76.8 85.2 102.4 96.21986 98.4 96.3 101.1 88.5 90.9 91.4 102.0 99.21987 100.0 100.0 100.0 100.0 100.0 100.0 100.0 100.01988 100.7 109.1 96.4 100.7 99.3 109.6 99.6 103.01989 97.3 109.0 94.1 107.9 106.4 119.5 97.2 102.51990 95.8 106.0 89.8 108.2 111.9 127.4 97.9 104.01991 98.8 103.4 87.9 111.6 110.1 136.0 97.4 103.81992 104.1 102.9 89.3 103.2 114.1 144.9 97.4 103.41993 104.1 105.8 87.6 107.9 111.9 146.0 96.5 103.81994 104.8 111.8 88.4 110.7 122.4 152.7 95.7 102.11995 104.2 116.0 89.7 110.2 123.1 161.6 93.9 102.01996 96.3 112.1 86.7 115.2 127.5 164.9 91.5 100.61997 99.4 107.7 92.9 117.1 136.8 167.5 90.9 101.61998 102.3 108.0 94.3 121.4 140.2 168.3 91.4 102.01999 104.2 106.3 104.6 138.2 132.4 167.4 94.9 104.3
Source: Productivity Measures for Selected Industries, 1949-99. Bureau of Labor Statistics web site.
Economic Research Service/USDA U.S. Food Marketing System, 2002 / AER-811 ● 73
Appendix table 25—Food marketing system purchases from U.S. agriculture, 1982-2000Fruit and Dairy Bakery
Year Meat vegetables1 products products
Billion dollars
1982 31.5 11.5 16.7 3.41983 31.4 12.9 18.0 3.51984 32.4 13.5 18.1 3.71985 30.5 13.3 17.7 3.41986 30.9 14.6 17.8 2.91987 32.7 14.3 18.2 2.81988 33.5 16.2 17.9 3.61989 34.0 17.8 19.6 4.31990 36.9 16.5 20.5 3.71991 34.7 17.0 18.4 3.31992 34.4 17.7 20.1 3.71993 35.1 18.4 20.1 3.91994 32.7 18.4 21.1 4.01995 32.6 20.3 21.4 5.01996 34.5 19.4 24.7 5.71997 34.0 21.0 22.7 4.91998 28.9 23.8 26.6 3.81999 30.8 26.3 25.5 3.32000 34.8 27.3 22.7 3.4
Grain mill Other Poultry products 2 Eggs foods 3 Total 4
Billion dollars
1982 6.0 1.4 2.5 8.4 81.41983 6.6 1.4 2.7 8.8 85.31984 8.0 1.4 3.0 9.7 89.81985 7.9 1.3 2.3 10.0 86.41986 9.0 1.1 2.5 10.0 88.81987 8.1 1.0 2.2 11.0 90.41988 9.9 1.3 2.2 12.2 96.81989 11.4 1.6 2.8 12.3 103.81990 11.1 1.4 2.8 13.3 106.21991 11.2 1.3 2.7 13.0 101.81992 12.0 1.4 2.3 13.5 101.61993 13.2 1.4 2.6 14.9 109.61994 13.9 1.5 2.6 15.4 109.61995 13.9 1.7 2.8 16.1 113.81996 15.9 2.0 3.4 16.7 122.31997 15.5 1.8 3.2 16.8 120.01998 16.4 1.6 3.1 15.5 119.71999 16.5 1.3 3.1 15.5 122.32000 16.3 1.3 3.2 14.3 123.3 1 Includes soups, baby foods, condiments, dressings, spreads, and relishes. 2 Includes, flour, flour mixes, cereals, rice, and pasta. 3 Includes, fats and oils, sugar, and miscellaneous foods. 4 Excludes alcoholic beverages and aquaculture, which are estimated at $2.5 billion in 1990.
Source: ERS, USDA.
74 ● U.S. Food Marketing System, 2002 / AER-811 Economic Research Service/USDA
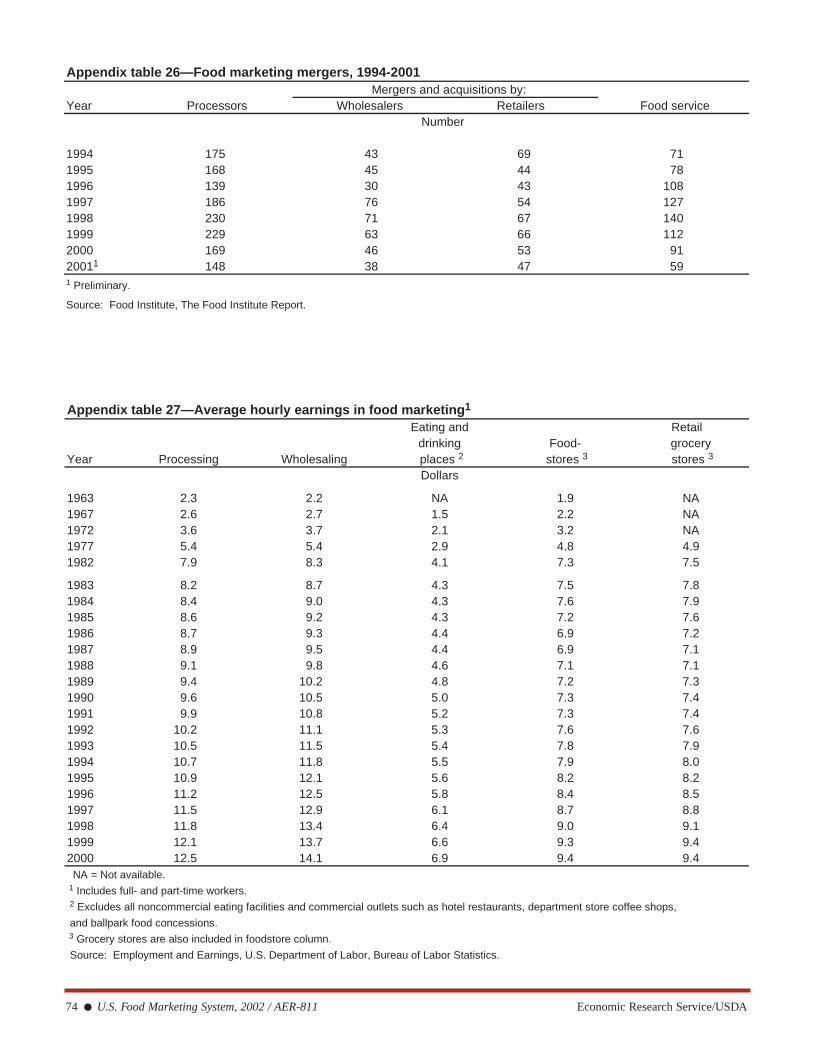
Appendix table 26—Food marketing mergers, 1994-2001Mergers and acquisitions by:
Year Processors Wholesalers Retailers Food serviceNumber
1994 175 43 69 711995 168 45 44 781996 139 30 43 1081997 186 76 54 1271998 230 71 67 1401999 229 63 66 1122000 169 46 53 9120011 148 38 47 591 Preliminary.
Source: Food Institute, The Food Institute Report.
Appendix table 27—Average hourly earnings in food marketing1
Eating and Retaildrinking Food- grocery
Year Processing Wholesaling places 2 stores 3 stores 3
Dollars
1963 2.3 2.2 NA 1.9 NA1967 2.6 2.7 1.5 2.2 NA1972 3.6 3.7 2.1 3.2 NA1977 5.4 5.4 2.9 4.8 4.91982 7.9 8.3 4.1 7.3 7.5
1983 8.2 8.7 4.3 7.5 7.81984 8.4 9.0 4.3 7.6 7.91985 8.6 9.2 4.3 7.2 7.61986 8.7 9.3 4.4 6.9 7.21987 8.9 9.5 4.4 6.9 7.11988 9.1 9.8 4.6 7.1 7.11989 9.4 10.2 4.8 7.2 7.31990 9.6 10.5 5.0 7.3 7.41991 9.9 10.8 5.2 7.3 7.41992 10.2 11.1 5.3 7.6 7.61993 10.5 11.5 5.4 7.8 7.91994 10.7 11.8 5.5 7.9 8.01995 10.9 12.1 5.6 8.2 8.21996 11.2 12.5 5.8 8.4 8.51997 11.5 12.9 6.1 8.7 8.81998 11.8 13.4 6.4 9.0 9.11999 12.1 13.7 6.6 9.3 9.42000 12.5 14.1 6.9 9.4 9.4 NA = Not available. 1 Includes full- and part-time workers.
2 Excludes all noncommercial eating facilities and commercial outlets such as hotel restaurants, department store coffee shops,
and ballpark food concessions. 3 Grocery stores are also included in foodstore column.
Source: Employment and Earnings, U.S. Department of Labor, Bureau of Labor Statistics.
Economic Research Service/USDA U.S. Food Marketing System, 2002 / AER-811 ● 75
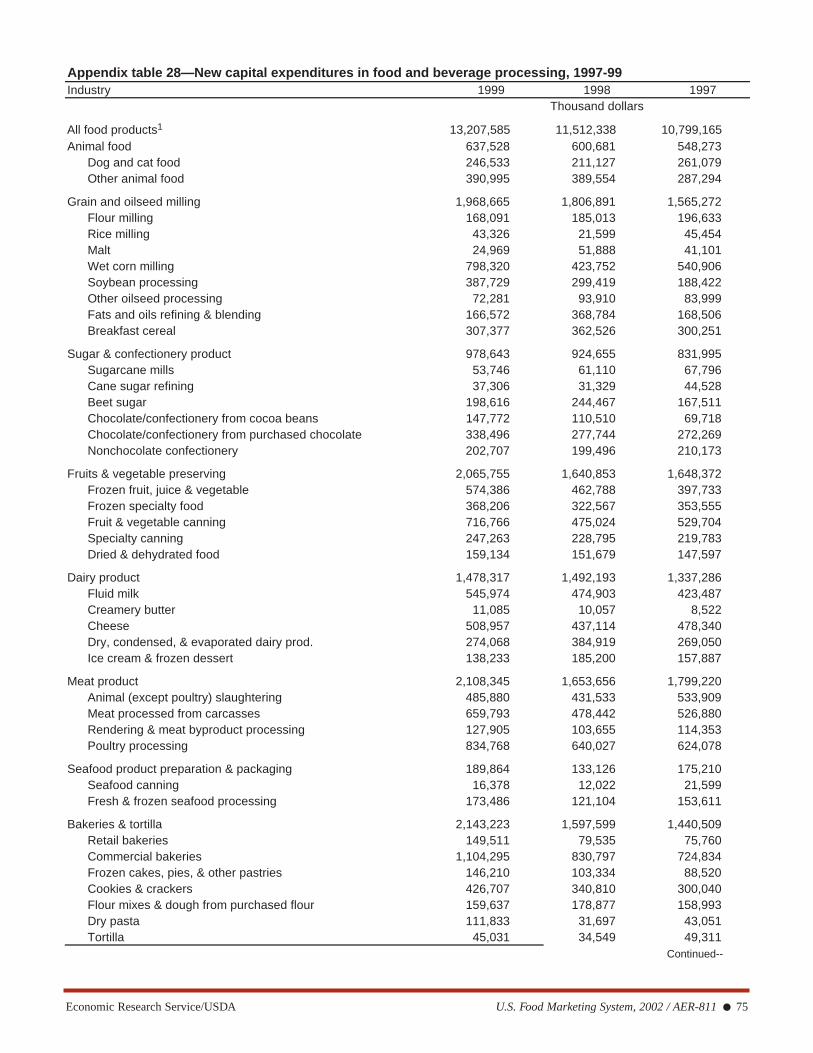
Appendix table 28—New capital expenditures in food and beverage processing, 1997-99Industry 1999 1998 1997
Thousand dollars
Animal food 637,528 600,681 548,273Dog and cat food 246,533 211,127 261,079Other animal food 390,995 389,554 287,294
Grain and oilseed milling 1,968,665 1,806,891 1,565,272Flour milling 168,091 185,013 196,633Rice milling 43,326 21,599 45,454Malt 24,969 51,888 41,101Wet corn milling 798,320 423,752 540,906Soybean processing 387,729 299,419 188,422Other oilseed processing 72,281 93,910 83,999Fats and oils refining & blending 166,572 368,784 168,506Breakfast cereal 307,377 362,526 300,251
Sugar & confectionery product 978,643 924,655 831,995Sugarcane mills 53,746 61,110 67,796Cane sugar refining 37,306 31,329 44,528Beet sugar 198,616 244,467 167,511Chocolate/confectionery from cocoa beans 147,772 110,510 69,718Chocolate/confectionery from purchased chocolate 338,496 277,744 272,269Nonchocolate confectionery 202,707 199,496 210,173
Fruits & vegetable preserving 2,065,755 1,640,853 1,648,372Frozen fruit, juice & vegetable 574,386 462,788 397,733Frozen specialty food 368,206 322,567 353,555Fruit & vegetable canning 716,766 475,024 529,704Specialty canning 247,263 228,795 219,783Dried & dehydrated food 159,134 151,679 147,597
Dairy product 1,478,317 1,492,193 1,337,286Fluid milk 545,974 474,903 423,487Creamery butter 11,085 10,057 8,522Cheese 508,957 437,114 478,340Dry, condensed, & evaporated dairy prod. 274,068 384,919 269,050Ice cream & frozen dessert 138,233 185,200 157,887
Meat product 2,108,345 1,653,656 1,799,220Animal (except poultry) slaughtering 485,880 431,533 533,909Meat processed from carcasses 659,793 478,442 526,880Rendering & meat byproduct processing 127,905 103,655 114,353Poultry processing 834,768 640,027 624,078
Seafood product preparation & packaging 189,864 133,126 175,210Seafood canning 16,378 12,022 21,599Fresh & frozen seafood processing 173,486 121,104 153,611
Bakeries & tortilla 2,143,223 1,597,599 1,440,509Retail bakeries 149,511 79,535 75,760Commercial bakeries 1,104,295 830,797 724,834Frozen cakes, pies, & other pastries 146,210 103,334 88,520Cookies & crackers 426,707 340,810 300,040Flour mixes & dough from purchased flour 159,637 178,877 158,993Dry pasta 111,833 31,697 43,051Tortilla 45,031 34,549 49,311
Continued--
All food products1 13,207,585 11,512,338 10,799,165

76 ● U.S. Food Marketing System, 2002 / AER-811 Economic Research Service/USDA
Appendix table 28—New capital expenditures in food and beverage processing, 1997-99--ContinuedIndustry 1999 1998 1997
Thousand dollars
Other food 1,637,244 1,662,682 1,452,928Roasted nuts & peanut butter 64,508 103,893 81,964Other snack food 598,508 673,137 406,407Coffee & tea 179,047 143,583 166,837Flavoring syrup & concentrate 95,284 79,272 144,097Mayonnaise, dressing, & other prepared sauce 140,496 84,963 139,688Spice & extract 142,011 118,589 115,389Perishable prepared food 129,466 171,584 124,442All other miscellaneous food 287,925 287,661 274,104
Beverages 2,282,309 2,221,883 2,381,973Soft drink 804,283 877,411 832,284Bottled water 195,929 56,330 47,508Ice 31,506 23,883 33,527Breweries 739,357 783,247 1,021,428Wineries 429,435 424,075 371,286Distilleries 81,798 56,936 75,940
1 Excludes beverages.Source: Annual Survey of Manufactures, U.S. Census Bureau.
Economic Research Service/USDA U.S. Food Marketing System, 2002 / AER-811 ● 77
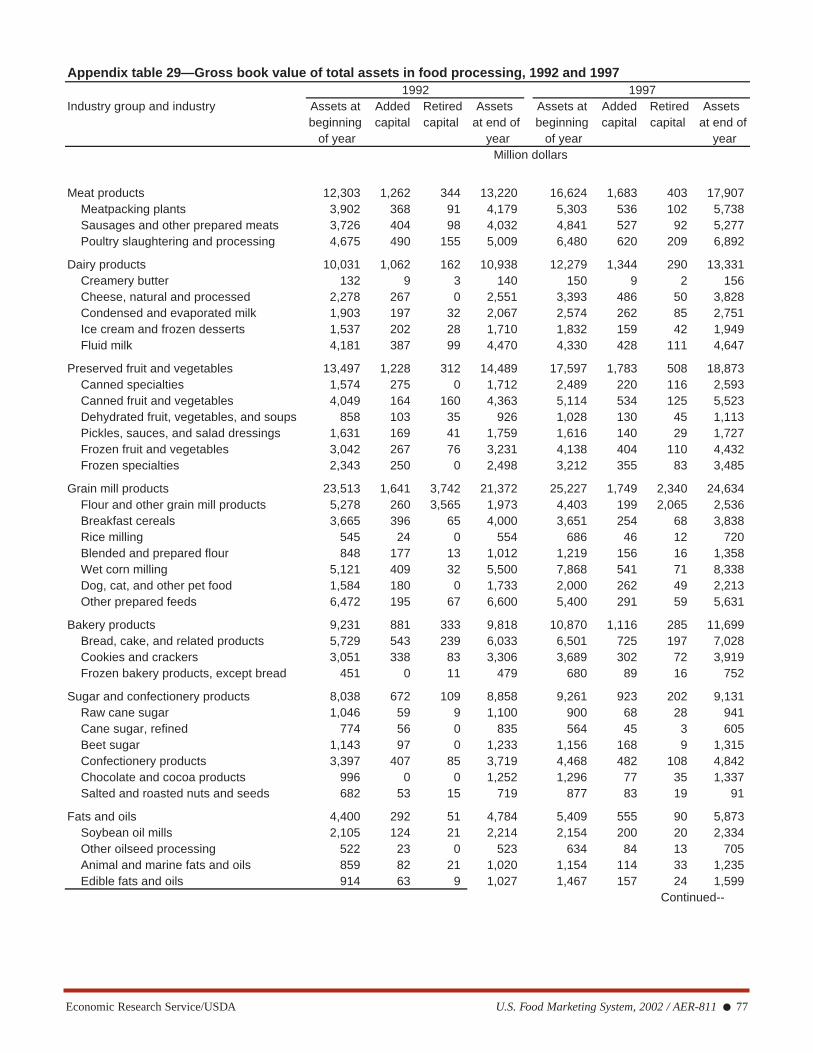
Appendix table 29—Gross book value of total assets in food processing, 1992 and 19971992 1997
Industry group and industry Assets at Added Retired Assets Assets at Added Retired Assets beginning capital capital at end of beginning capital capital at end of
of year year of year year Million dollars
Meat products 12,303 1,262 344 13,220 16,624 1,683 403 17,907 Meatpacking plants 3,902 368 91 4,179 5,303 536 102 5,738 Sausages and other prepared meats 3,726 404 98 4,032 4,841 527 92 5,277 Poultry slaughtering and processing 4,675 490 155 5,009 6,480 620 209 6,892
Dairy products 10,031 1,062 162 10,938 12,279 1,344 290 13,331 Creamery butter 132 9 3 140 150 9 2 156 Cheese, natural and processed 2,278 267 0 2,551 3,393 486 50 3,828 Condensed and evaporated milk 1,903 197 32 2,067 2,574 262 85 2,751 Ice cream and frozen desserts 1,537 202 28 1,710 1,832 159 42 1,949 Fluid milk 4,181 387 99 4,470 4,330 428 111 4,647
Preserved fruit and vegetables 13,497 1,228 312 14,489 17,597 1,783 508 18,873 Canned specialties 1,574 275 0 1,712 2,489 220 116 2,593 Canned fruit and vegetables 4,049 164 160 4,363 5,114 534 125 5,523 Dehydrated fruit, vegetables, and soups 858 103 35 926 1,028 130 45 1,113 Pickles, sauces, and salad dressings 1,631 169 41 1,759 1,616 140 29 1,727 Frozen fruit and vegetables 3,042 267 76 3,231 4,138 404 110 4,432 Frozen specialties 2,343 250 0 2,498 3,212 355 83 3,485
Grain mill products 23,513 1,641 3,742 21,372 25,227 1,749 2,340 24,634 Flour and other grain mill products 5,278 260 3,565 1,973 4,403 199 2,065 2,536 Breakfast cereals 3,665 396 65 4,000 3,651 254 68 3,838 Rice milling 545 24 0 554 686 46 12 720 Blended and prepared flour 848 177 13 1,012 1,219 156 16 1,358 Wet corn milling 5,121 409 32 5,500 7,868 541 71 8,338 Dog, cat, and other pet food 1,584 180 0 1,733 2,000 262 49 2,213 Other prepared feeds 6,472 195 67 6,600 5,400 291 59 5,631
Bakery products 9,231 881 333 9,818 10,870 1,116 285 11,699 Bread, cake, and related products 5,729 543 239 6,033 6,501 725 197 7,028 Cookies and crackers 3,051 338 83 3,306 3,689 302 72 3,919 Frozen bakery products, except bread 451 0 11 479 680 89 16 752
Sugar and confectionery products 8,038 672 109 8,858 9,261 923 202 9,131 Raw cane sugar 1,046 59 9 1,100 900 68 28 941 Cane sugar, refined 774 56 0 835 564 45 3 605 Beet sugar 1,143 97 0 1,233 1,156 168 9 1,315 Confectionery products 3,397 407 85 3,719 4,468 482 108 4,842 Chocolate and cocoa products 996 0 0 1,252 1,296 77 35 1,337 Salted and roasted nuts and seeds 682 53 15 719 877 83 19 91
Fats and oils 4,400 292 51 4,784 5,409 555 90 5,873 Soybean oil mills 2,105 124 21 2,214 2,154 200 20 2,334 Other oilseed processing 522 23 0 523 634 84 13 705 Animal and marine fats and oils 859 82 21 1,020 1,154 114 33 1,235 Edible fats and oils 914 63 9 1,027 1,467 157 24 1,599
Continued--
78 ● U.S. Food Marketing System, 2002 / AER-811 Economic Research Service/USDA
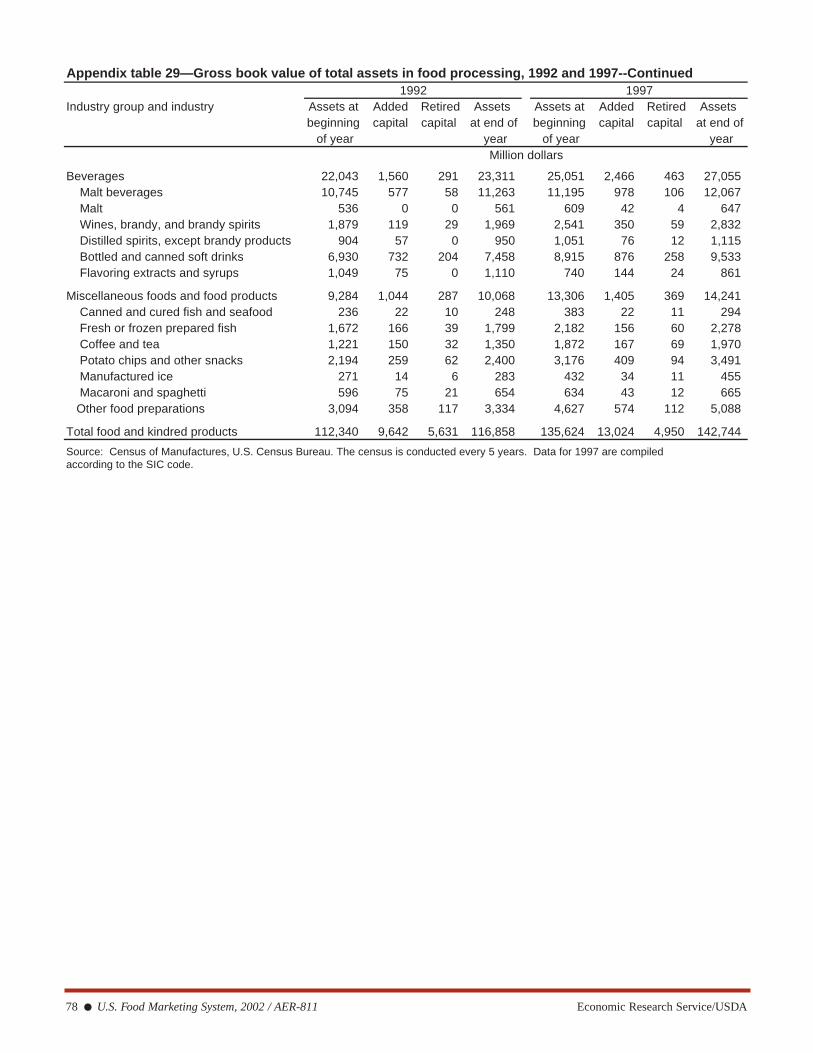
Appendix table 29—Gross book value of total assets in food processing, 1992 and 1997--Continued1992 1997
Industry group and industry Assets at Added Retired Assets Assets at Added Retired Assets beginning capital capital at end of beginning capital capital at end of
of year year of year yearMillion dollars
Beverages 22,043 1,560 291 23,311 25,051 2,466 463 27,055 Malt beverages 10,745 577 58 11,263 11,195 978 106 12,067 Malt 536 0 0 561 609 42 4 647 Wines, brandy, and brandy spirits 1,879 119 29 1,969 2,541 350 59 2,832 Distilled spirits, except brandy products 904 57 0 950 1,051 76 12 1,115 Bottled and canned soft drinks 6,930 732 204 7,458 8,915 876 258 9,533 Flavoring extracts and syrups 1,049 75 0 1,110 740 144 24 861
Miscellaneous foods and food products 9,284 1,044 287 10,068 13,306 1,405 369 14,241 Canned and cured fish and seafood 236 22 10 248 383 22 11 294 Fresh or frozen prepared fish 1,672 166 39 1,799 2,182 156 60 2,278 Coffee and tea 1,221 150 32 1,350 1,872 167 69 1,970 Potato chips and other snacks 2,194 259 62 2,400 3,176 409 94 3,491 Manufactured ice 271 14 6 283 432 34 11 455 Macaroni and spaghetti 596 75 21 654 634 43 12 665 Other food preparations 3,094 358 117 3,334 4,627 574 112 5,088
Total food and kindred products 112,340 9,642 5,631 116,858 135,624 13,024 4,950 142,744
Source: Census of Manufactures, U.S. Census Bureau. The census is conducted every 5 years. Data for 1997 are compiled according to the SIC code.
Economic Research Service/USDA U.S. Food Marketing System, 2002 / AER-811 ● 79
Appendix table 30—Food-related advertising, 1995-99Item 1999 1998 1997 1996 1995
Million dollars
Eating and drinking places 2,6462,9613,1483,1643,412
Foodstores1 813824893920947
Processed foods 6,3476,5236,8647,0597,253
Cooking products and seasoning 4 685729698702595
Prepared and convenience foods 2 1,3791,3121,3321,2841,329
Dairy products and substitutes 478441508475489
Fruits, vegetables, grains, and beans 126235168300165
Meat, poultry, and fish 256271217314281
Bakery goods 347448397263458
Confectionery and snacks 3 8569661,0941,1231,207
Alcoholic beverages 1,0281,0221,0901,1881,245
Soft drinks and bottled water 541247689708799
Other beverages5 585809628626617
General promotions 6745437869
Total advertising 9,80710,30910,90611,14311,6131 Includes foodstores and supermarkets, bake shops, dairy stores, meat, poultry, and fish markets, and food and beverage retailers.2 Soups, cereals, jams, jellies, peanut butter, infant foods, pasta products and dinners, all prepared dinners and entrees.3 Candy, gum, mints, cookies, crackers, nuts, chips, and other salty snacks.4 Sugar, syrups, artificial sweeteners, shortening, cooking oils, margarine, baking mixes, crusts, flour and other baking ingredients,
seasoning, spices, extracts, puddings, pickles, relishes, sauces, gravies, dips, salad dressings, mayonnaise, and other
miscellaneous ingredients.5 Coffee, tea, cocoa, fruit juices and drinks, and vegetable juices.
Source: Economic Research Service, BAR/LNA Multi-Media Service.
80 ● U.S. Food Marketing System, 2002 / AER-811 Economic Research Service/USDA
Appendix table 31—Share of food advertising expenditures by the largest food marketing firms, 1999Share of expenditures spent by:
Industry 3 largest advertisers 10 largest advertisers Percent
Restaurants, national 49.3 75.1
Foodstores and supermarkets 29.0 54.1
Food processing:Sugar, syrups, and artificial sweeteners 68.5 98.4Shortening, oil, margarine, and nonstick products 77.0 98.0
Baking mixes, pie crusts, and baking ingredients 76.0 97.4Seasonings, spices, and extracts 80.3 98.8Gelatins and puddings (mixes and prepared) 100.0 100.0Condiments, pickles, and relishes 70.7 97.7
Sauces, gravies, and dips 47.6 93.1Salad dressing and mayonnaise 90.6 99.1Soups 96.2 99.8
Breakfast cereals 85.4 100.0Nutritional supplements and weight control products 51.5 80.6Infant foods 98.1 100.0Pasta products and pasta-product dinners 84.8 98.8
All other prepared dinners and entrees 52.2 89.0Jellies, jams, preserves, and peanut butter 96.6 99.2Milk, butter, and eggs, yogurt, cream and sour cream 64.0 91.4
Cheese 90.1 96.2Ice cream, frozen novelties, and sherbet 43.5 77.5Dairy product substitutes 98.5 100.0
Citrus fruit 98.9 98.9Other fruit 57.0 94.7Vegetables 61.0 92.0Beans and grains 53.7 97.6
Meat, poultry, and fish 39.1 75.9Bread and rolls, waffles, and pancakes 58.3 96.8Cakes, pies and pastries, donuts 72.6 99.4Cookies and crackers 89.2 99.5
Continued--
Economic Research Service/USDA U.S. Food Marketing System, 2002 / AER-811 ● 81
Appendix table 31—Share of food advertising expenditures by the largest food marketing firms, 1999--Continued
Share of expenditures spent by:Industry 3 largest advertisers 10 largest advertisers
Percent
Coffee, tea, cocoa, and milk derivatives 73.3 96.1Fruit juices and drinks 46.7 89.3Vegetables juices 100.0 100.0
Candy, mints, and gum 62.3 94.2Chips, nuts, popcorn, and pretzels 72.9 95.1Regular carbonated drinks 99.2 100.0Dietary carbonated drinks 99.8 100.0
Noncarbonated soft drinks 88.2 92.0Bottled waters 66.7 94.4Beer and ale 81.7 98.3Wine and wine coolers 40.0 68.6
Distilled spirits:Bourbon 83.8 100.0Canadian whiskey 99.7 100.0Scotch 75.4 99.7Other whiskey 99.6 100.0Brandy, cognac, or armangnac 86.7 97.4Cordials and liqueurs 65.6 85.8 Gin 99.9 100.0 Rum 95.6 100.0Tequila 97.5 100.0 Vodka 81.3 99.8Other alcoholic beverages 84.0 92.2
Pet foodsDog food 87.2 99.7Cat food 84.4 100.0Other pet food 92.7 100.0
Source: Competitive Media Reporting and Publishers Information Bureau.
Appendix table 32—Advertising price indexes in cost per 1,000 targeted viewers or readersMedia 1984 1985 1986 1987 1988 1989 1990 1991 1992 1996 2000
Index (1975 = 100)
Network 279 301 318 318 343 363 399 399 399 423 441Spot TV 190 203 215 228 242 254 269 269 280 308 311Network radio 237 268 284 301 313 332 345 338 331 333 359Spot radio 155 161 170 177 182 193 205 205 203 215 240Magazines 223 236 249 261 271 287 301 322 338 354 362
Supplements 192 204 220 229 240 254 267 301 316 NA NANewspaper 252 267 286 306 327 347 368 390 410 422 428Outdoor 198 208 218 229 238 250 263 274 274 280 308NA = Not available.
Source: Compiled by ERS from Bar/LNA Multi-Media Service.

82 ● U.S. Food Marketing System, 2002 / AER-811 Economic Research Service/USDA
Category 1987 1988 1989 1990 1991 1992 1993Number
Food categories:Baby food 10 55 53 31 95 53 7Bakery Products 1,088 1,180 1,348 1,546 1,966 1,854 1,803Beverages 832 936 913 1,143 1,367 1,538 1,845Breakfast cereals 92 97 118 123 104 122 99Condiments 1,145 1,608 1,701 2,028 2,787 2,555 3,147Candy, gum, and snacks 1,367 1,310 1,355 1,486 1,885 2,068 2,043Dairy 1,132 854 1,348 1,327 1,111 1,320 1,099Desserts 56 39 69 49 124 93 158Entrees 691 613 694 753 808 698 631Fruit and vegetables 185 262 214 325 356 276 407Pet food 82 100 126 130 202 179 276Processed meat 581 548 509 663 798 785 454Side dishes 435 402 489 538 530 560 680Soups 170 179 215 159 265 211 248
Total, food 7,886 8,183 9,192 10,301 12,398 12,312 12,893
Nonfood categories:Health and beauty aids 2,039 2,000 2,308 2,379 3,064 3,690 3,864Household supplies and paper products 208 333 493 491 588 627 612Tobacco products 51 12 29 31 19 45 38Pet products 18 30 33 42 74 116 160Total, nonfood 2,316 2,375 2,863 2,943 3,745 4,478 4,674
Total 10,182 10,558 12,055 13,244 16,143 16,790 17,571
Category 1994 1995 1996 1997 1998 1999 2000Number
Food categories:Baby food 45 61 25 53 35 21 16Bakery Products 2,180 2,432 1,759 1,622 1,471 1,126 1,087Beverages 2,250 2,854 2,003 1,606 1,547 1,576 1,271Breakfast cereals 110 128 121 83 84 114 88Condiments 3,271 3,698 2,815 2,631 1,994 1,676 1,808Candy, gum, and snacks 2,450 2,462 2,310 2,505 2,065 1,983 1,924Dairy 1,323 1,614 1,345 862 940 921 858Desserts 215 125 100 109 117 73 78Entrees 694 748 597 629 678 543 550Fruit and vegetables 487 545 552 405 375 254 192Pet food 161 174 121 251 105 158 157Processed meat 565 790 637 672 728 646 583Side dishes 980 940 611 678 597 421 317Soups 264 292 270 292 299 254 216
Total, food 15,006 16,863 13,266 12,398 11,035 9,766 9,145
Nonfood categories:Health and beauty aids 4,368 4,897 5,702 6,226 6,467 6,257 6,573Household supplies and paper products 609 571 381 371 265 453 384Tobacco products 38 102 54 127 51 32 42Pet products 55 139 169 202 120 138 143Total, nonfood 5,070 5,709 6,306 6,926 6,903 6,880 7,142
Total 20,076 22,572 19,572 19,324 17,938 16,646 16,390Source: ERS, New Product News.
Appendix table 33—New products introduced, 1987-2000
Economic Research Service/USDA U.S. Food Marketing System, 2002 / AER-811 ● 83
Appendix table 34—Major economic indicators, 1989-2000Real per capita
Real gross domestic Unemployment disposable personalYear Population product1 rate income1
Million Billion dollars Percent Dollars
1989 247.4 6,592 5.3 19,8331990 250.0 6,708 5.6 20,0581991 252.7 6,676 6.8 19,8671992 255.4 6,880 7.5 20,2171993 258.1 7,063 6.9 20,2331994 260.6 7,348 6.1 20,5041995 263.1 7,544 5.6 21,7951996 265.5 7,813 5.4 21,0691997 268.0 8,160 4.9 21,4641998 270.6 8,516 4.5 22,3541999 273.0 8,876 4.2 22,6412000 275.4 9,224 4.0 23,148
3-month T-bill rate Exchange rate CPI (1982-84 = 100)
Percent Yen per dollar All Items
1989 8.1 138.07 124.01990 7.5 145.00 130.71991 5.4 134.59 136.21992 3.5 126.78 140.31993 3.0 111.08 144.51994 4.3 102.18 148.21995 5.5 93.96 152.41996 5.0 108.78 156.91997 5.1 121.06 160.51998 4.8 130.99 163.01999 4.7 113.73 166.62000 5.7 107.80 172.21 1996 dollars.
Source: (1) U.S. Department of Commerce, Bureau of Economic Analysis, Survey of Current Business; (2) Current Population Reports,
selected issues; (3) Employment and Earnings, U.S. Department of Labor, Bureau of Labor Statistics.
84 ● U.S. Food Marketing System, 2002 / AER-811 Economic Research Service/USDA
Appendix Table 35—Wholesale acquisitions at a glance, 1994-2001
Company Acquisitions
Broadline wholesalers:
Nash Finch Super Food Services, Erickson's Supermarkets, Military Distributors of Virginia, Super Food Services, T.J. Morris, United-A.G. Cooperative Inc.,Hinky Dinky Supermarkets, Inc., K&N Meats (Producer of beef and othermeat for fine dining establishments)
Unified Western Grocers (result of Market Wholesale Grocery Companymerger between Certified Grocers of California and Unified Grocers)
Richfood Holdings Super Rite, Farm Fresh, Inc., Shoppers Food Warehouse
Spartan Stores Family Fare, Ashcraft's Markets, Seaway Food Town, Inc., Prevo's Family Markets, Inc. (retailer)
Fleming Jitney-Jungle retail stores, Minter-Weisman (convenience store distributor), seven Food4Less retail stores from Whitco Foods, Inc.
Supervalu, Inc. Richfood Holdings, Shop 'N Save, Randall Stores, Inc.
Roundy's Mega Marts, Ultra Mart, Copps Corp. (retailer and wholesaler)
C&S Grand Union retail stores
Associated Food Stores Macey Inc., Lin's A.G. Foodstores
Food service distributors:
Ahold (managed under U.S. U.S. Foodservice, GFG Foodservice, PYA/Monarch, Parkway Foodservice, Foodservice name) Mutual Distributors, Inc. (broadline distributor), Mutual Wholesale Co., Alliant
JP Foodservice, Inc. (managed under Mazo-Lerch, US Foodservice, Squeri Food Service Inc., Arrow Paper Supplythe U.S. Foodservice name) and Food Co., Valley Food Distributors, Parkway Food Service, Stock Yards
Packing Co., Inc. (Custom meat processor)
U.S. Foodservice Clark Foodservice, Goode Foodservice, Fort Myers Meat & Seafood, CP Foodservice
Rykoff-Sexton (managed under the U.S. FoodserviceU.S. Foodservice name)
Clayton, Dubilier and Rice (investment firm) Alliant (formerly Kraft Foodservices), Belca Foodservice, ACME Food(managed under the Alliant Foodservice Atlantic Food Services, Leone Foodservice, K-B Foods, Inc., K&N name) Meats (producer of meats for tablecloth dining establishments)
Performance Food Group Fresh Express, AFI Food Service Distributors, W.J. Powell Company, McLane Foodservice (certain assets), NorthCenter Foodservice, Carroll County Foods, Inc., Dixon Tom-A-Toe Companies, Inc., State Hotel Supply Co., Nesson Meat Sales (certain assets)
McLane Co. (subsidiary of Wal Mart) AmeriServe Food Distribution, Inc.
AmeriServe Food Distribution, Inc. ProSource, Inc., PepsiCo Food Systems
Sysco Strano Foodservice, Fresh Point Holdings, Watson Foodservice Inc., Malcolm Meats (specialty meat cutter), Buckhead Beef Co. (specialty meat cutter), Newport Meat Co. (Sspecialty meat cutter), Doughtie's Foods, Jordan's Foods, Beaver Street Fisheries, Inc., 5 specialty meat operations from Freedman Food Service, North Douglas Distributors, Ltd. (Canada), Albert M. Briggs Co. (specialty meat supplier), HRI Supply Ltd. (Canadian foodservice distributor), Fulton Provision Co. (specialty meat company)
Sources: Food Institute Report, Supermarket News, Feedstuffs.
Economic Research Service/USDA U.S. Food Marketing System, 2002 / AER-811 ● 85
Appendix table 36—Producer price indexes for the food marketing system, 1990-2000Commodity 1990 1991 1992 1993 1994 1995 1996 1997 1998 1999 2000
1982 = 100
Crude foodstuffs and feedstuffs1 113.1 105.5 105.1 102.4 106.5 105.8 121.5 112.2 103.8 98.7 100.2Fruit and vegetables 117.5 114.7 96.8 106.9 104.6 108.4 122.5 115.5 117.2 117.4 111.1Grains 97.4 92.0 97.3 94.5 102.7 112.6 151.1 111.2 93.4 80.1 78.3Livestock 115.6 107.9 104.7 107.0 96.4 92.8 95.2 96.3 82.3 86.4 96.5Live poultry 118.8 111.2 122.6 122.0 124.4 125.6 140.5 131.0 141.4 129.9 124.7Fluid milk 100.8 89.5 96.3 94.1 95.8 93.7 107.9 97.5 112.6 106.3 92.0Oilseeds 112.1 106.4 107.5 115.9 117.4 112.6 139.4 140.8 114.4 90.8 93.8Sugar and raw cane 119.2 119.2 113.7 113.2 115.2 119.7 118.6 116.8 117.2 113.7 101.8
Intermediate materials for food manufacturing 2 117.9 115.3 113.9 115.6 118.5 119.5 125.3 123.2 123.1 120.8 119.2
Flour 103.6 96.8 109.3 108.9 110.3 122.8 136.8 118.7 109.2 104.3 103.8Refined sugar 122.7 121.6 120.0 118.2 118.3 119.4 123.7 123.6 119.8 121.0 110.6Crude vegetable oils 115.8 103.0 97.0 110.5 135.0 129.8 118.1 116.6 131.1 90.2 73.6
Finished consumer foods 3 124.4 124.1 123.2 124.7 126.8 129.0 133.6 134.5 134.3 135.1 137.2Fresh fruit 118.1 129.9 183.8 84.5 82.6 85.7 100.8 99.4 90.0 103.6 91.4Fresh and dried vegetables 118.1 103.8 115.0 135.2 129.1 144.4 135.0 123.1 139.5 118.0 126.7Canned fruit and juice 127.0 128.6 134.5 126.2 126.0 129.4 137.5 137.6 134.4 137.8 140.0Frozen fruit and juice 139.0 116.3 125.8 110.7 111.9 115.9 123.9 117.2 116.1 123.0 120.9Fresh vegetables, excluding potatoes 107.8 110.2 116.4 126.6 117.8 139.8 120.9 121.3 137.9 117.7 135.0Canned vegetables and juices 116.7 112.9 109.6 110.5 116.3 116.6 121.2 120.1 121.5 120.9 121.2Frozen vegetables 118.4 117.6 116.4 120.9 126.0 124.2 125.4 125.8 125.4 126.1 126.0Potatoes 157.3 125.7 118.3 144.9 142.3 142.6 133.9 106.1 122.5 126.9 100.5Eggs 117.6 110.7 78.6 86.6 80.9 86.3 105.1 97.1 90.1 77.9 84.9Bakery products 141.0 146.6 152.5 156.6 160.0 164.3 169.8 173.9 175.8 178.0 182.3Meats 117.0 113.5 106.7 110.6 104.6 102.9 109.0 111.6 101.4 104.6 114.3Beef and veal 116.0 112.2 109.7 112.9 103.6 100.9 100.2 102.8 99.5 106.3 113.7Pork 119.8 113.4 98.5 105.7 101.3 101.4 120.9 123.1 96.6 96.0 113.4Processed poultry 113.6 109.9 109.1 111.7 114.8 114.3 119.8 117.4 120.7 114.0 112.9Fish 147.2 149.5 153.0 156.5 161.5 170.9 165.9 178.1 183.0 190.9 198.1Dairy products 117.2 114.6 118.0 118.1 119.5 119.7 130.4 128.1 138.1 139.2 133.7Processed fruit and vegetables 124.7 119.6 120.8 118.2 121.2 122.4 127.6 126.4 125.8 128.1 128.6Shortening and cooking oil 123.2 116.5 114.9 122.9 138.6 142.5 138.5 137.8 143.4 140.4 132.4Soft drinks 122.3 125.5 125.7 126.2 126.9 133.1 134.0 133.2 134.8 137.9 144.1Beverages, alcoholic 111.2 123.7 126.1 126.0 124.8 128.5 132.8 135.1 135.2 136.7 140.6Tobacco products 221.4 249.7 275.2 260.3 224.7 231.3 237.4 248.9 283.4 374.0 397.2
1 What food manufacturers paid at major markets.2 What food manufacturers charged other food manufacturers.3 What retailers, wholesalers, restauranteurs, or other institutions paid.
Source: Producer Price Index, Bureau of Labor Statistics, U.S. Department of Labor.
86 ● U.S. Food Marketing System, 2002 / AER-811 Economic Research Service/USDA
Appendix table 37—U.S. trade in processed foods, 1999 and 2000Industry group and industry Exports Imports
1999 2000 1999 2000Thousand dollars
Total processed food 28,866,452 30,044,099 34,708,000 36,771,933
Meat products 7,805,073 8,939,915 3,623,868 4,156,057Meat packing 5,617,410 6,519,571 3,422,835 3,948,207Sausage and prepared meats 300,106 385,166 137,582 129,478Poultry dressing plants 1,887,557 2,035,178 63,451 78,372
Dairy products 1,034,401 1,092,828 1,455,658 1,530,225Creamery butter 4,511 7,428 47,695 29,859Cheese, natural and processed 130,075 138,437 704,847 685,544Condensed and evaporated milk 778,298 819,520 647,988 784,399Ice cream and frozen desserts 88,879 91,283 36,783 17,605Fluid milk 32,638 36,160 18,345 12,818
Preserved fruit and vegetables 3,206,166 3,257,166 3,853,049 3,833,596Canned specialties 89,306 104,445 100,034 92,004Canned fruit and vegetables 1,208,536 1,211,645 1,831,670 1,748,410Dried fruit and vegetables 681,446 706,929 445,669 476,176Sauces and salad dressings 320,450 344,731 460,162 500,973Frozen fruit and vegetables 877,119 859,337 1,004,119 1,001,928Other frozen specialties 29,309 30,079 11,395 14,105
Grain mill products 3,938,323 3,959,532 1,204,991 1,220,416Flour and grain mill products 335,281 291,619 89,024 85,028Breakfast cereals 224,566 215,224 146,290 149,319Rice milling 820,162 686,357 197,062 190,239Blended and prepared flours 141,850 153,352 120,933 122,637Wet corn milling 1,270,385 1,236,847 283,350 283,385Dog, cat, and other pet food 631,738 774,840 137,906 125,741Prepared animal feed 514,341 601,293 230,426 264,067
Bakery products 455,447 466,139 921,543 1,031,119
Bread and other bakery products 251,731 256,751 367,864 409,760
Cookies and crackers 140,840 143,392 410,461 440,863Frozen bakery products except bread 62,876 65,996 143,218 180,496
Sugar and confections 1,718,133 1,909,013 3,605,713 3,470,997Beet and cane sugar 153,242 158,433 686,164 609,803Candy and confectionery products 221,639 276,404 612,359 664,619Chocolate and cocoa products 436,657 534,962 1,522,267 1,404,319Chewing gum 70,419 82,778 126,792 136,551Salted and roasted nuts and seeds 836,176 856,436 658,131 655,705
Continued--
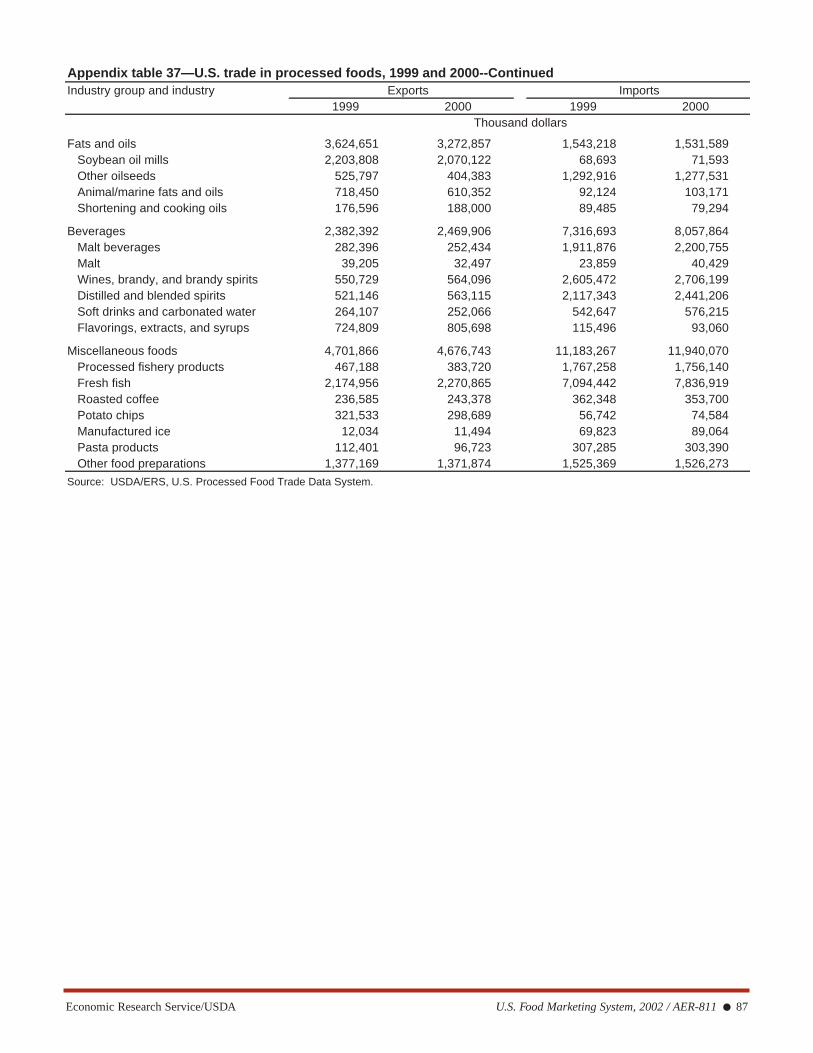
Economic Research Service/USDA U.S. Food Marketing System, 2002 / AER-811 ● 87
Appendix table 37—U.S. trade in processed foods, 1999 and 2000--ContinuedIndustry group and industry Exports Imports
1999 2000 1999 2000Thousand dollars
Fats and oils 3,624,651 3,272,857 1,543,218 1,531,589Soybean oil mills 2,203,808 2,070,122 68,693 71,593Other oilseeds 525,797 404,383 1,292,916 1,277,531Animal/marine fats and oils 718,450 610,352 92,124 103,171Shortening and cooking oils 176,596 188,000 89,485 79,294
Beverages 2,382,392 2,469,906 7,316,693 8,057,864Malt beverages 282,396 252,434 1,911,876 2,200,755Malt 39,205 32,497 23,859 40,429Wines, brandy, and brandy spirits 550,729 564,096 2,605,472 2,706,199Distilled and blended spirits 521,146 563,115 2,117,343 2,441,206Soft drinks and carbonated water 264,107 252,066 542,647 576,215Flavorings, extracts, and syrups 724,809 805,698 115,496 93,060
Miscellaneous foods 4,701,866 4,676,743 11,183,267 11,940,070Processed fishery products 467,188 383,720 1,767,258 1,756,140Fresh fish 2,174,956 2,270,865 7,094,442 7,836,919Roasted coffee 236,585 243,378 362,348 353,700Potato chips 321,533 298,689 56,742 74,584Manufactured ice 12,034 11,494 69,823 89,064Pasta products 112,401 96,723 307,285 303,390Other food preparations 1,377,169 1,371,874 1,525,369 1,526,273
Source: USDA/ERS, U.S. Processed Food Trade Data System.

88 ● U.S. Food Marketing System, 2002 / AER-811 Economic Research Service/USDA
Appendix table 38—U.S. trade balance in processed foods, 1995-2000Industry group and industry 1995 1996 1997 1998 1999 2000
Thousand dollars
Meat products 5,365 6,063 5,641 4,597 3,996 4,784 Meatpacking 3,607 3,510 2,903 2,175 2,040 2,571 Sausages and other prepared meats -38 12 251 221 163 256 Poultry slaughtering and processing 2,067 2,541 2,486 2,201 1,794 1,957
Dairy products -188 -400 -116 -390 -447 -437 Creamery butter 61 32 6 -58 -43 -28 Cheese, natural and processed -460 -479 -425 -518 -575 -547 Condensed and evaporated milk 92 -76 176 78 105 -35 Ice cream and frozen desserts 85 90 86 80 52 -74 Fluid milk 33 33 41 28 14 -23
Preserved fruit and vegetables 211 -159 -115 -144 -647 -576 Canned specialties 34 29 15 -13 -11 -17 Canned fruit and vegetables -492 -696 -686 -412 -623 -557 Dehydrated fruit, vegetables, and soups 407 402 389 308 236 -231 Pickles, sauces, and salad dressings -28 -37 -34 -80 -140 -156 Frozen fruit and vegetables 237 92 136 17 -127 -143 Frozen specialties 53 51 64 35 18 -16
Grain mill products 2,778 2,829 2,749 2,666 2,449 2,739 Flour and other grain mill products 353 243 239 212 246 207 Breakfast cereals 68 55 32 90 78 66 Rice milling 780 749 607 627 623 496 Blended and prepared flour 69 79 64 25 21 31 Wet corn milling 1,177 1,296 1,330 1,179 987 953 Dog, cat, and other pet foods 332 408 477 532 494 649 Other prepared feeds 447 348 380 325 284 337
Bakery products -221 -253 -265 -340 -466 -565 Bread, cake, and related products -131 -131 -117 -67 -116 -153 Cookies and crackers -82 -108 -132 -233 -270 -297 Frozen bakery products -7 -15 -17 -39 -80 -115
Sugar and confectionery products -857 -1,431 -1,653 -1,882 -1,888 -1,562 Beet and cane sugar -456 -961 -920 -725 -533 -451 Confectionary products -210 -228 -218 -312 -391 -388 Chocolate and cocoa products -772 -1,023 -1,052 -1,303 -1,142 -869 Salted and roasted nuts and seeds 581 780 537 458 178 -199
Fats and oils 2,330 1,879 2,833 2,900 2,081 1,741 Soybean oil mills 1,947 2,045 3,111 2,941 2,135 1,999 Other oilseed processing -591 -957 -947 -840 -767 -873 Animal and marine fats and oils 923 739 605 732 626 507 Edible fats and oils 51 53 63 68 87 109
Continued--

Economic Research Service/USDA U.S. Food Marketing System, 2002 / AER-811 ● 89
Appendix table 38—U.S. trade balance in processed foods, 1995-2000--ContinuedIndustry group and industry 1995 1996 1997 1998 1999 2000
Thousand dollars
Beverages -2,050 -2,791 -3,316 -4,012 -4,934 -5,588 Malt beverages -666 -888 -1,096 -1,394 -1,629 -1,948 Malt 23 22 27 27 15 -8 Wines, brandy, and brandy spirits -1,156 -1,394 -1,608 -1,696 -2,055 -2,142 Distilled spirits, except brandy products -806 -1,027 -1,081 -1,307 -1,596 -1,878 Bottled and canned soft drinks -13 -173 -226 -244 -279 -324 Flavoring extracts and syrups 567 668 668 602 609 -713
Miscellaneous foods and food products -3,661 -3,730 -5,112 -6,338 -6,481 -7,263 Canned and cured fish and seafood -648 -753 -988 -1,148 -1,300 -1,372 Fresh or frozen prepared fish -2,897 -2,946 -4,029 -4,848 -4,919 -6,666 Coffee and tea -100 -101 -101 -148 -126 -110 Potato chips and other snacks 202 192 192 261 265 -224 Manufactured ice -11 -21 -18 -42 -58 -78 Macaroni and spaghetti -216 -226 -237 -199 -195 -207 Other food preparations 11 125 69 -215 -148 -154
Total food and kindred products 4,424 2,354 1,026 -2,619 -6,052 -6,728
Source: USDA/ERS, U.S. Processed Food Trade Data System.
Appendix table 39—Leading exporters of processed foods to the U.S. and top recipients of U.S. processed food exports
Share of ChangeU.S imports from: Imports, processed food 1998-99 1999-20
2000 importsMillion dollars ------------------------------ Percent ------------------------------
Canada 8,400.5 22.8 12.6 8.4Mexico 2,933.5 8.0 11.6 11.3Thailand 2,233.9 6.1 11.7 9.3France 1,964.8 5.3 17.8 -3.5Italy 1,578.4 4.3 4.4 9.9Australia 1,398.6 3.8 8.1 27.0Netherlands 1,221.4 3.3 6.8 18.1United Kingdom 1,199.8 3.3 15.5 2.9New Zealand 1,073.2 2.9 -1.3 12.9China (mainland) 1,025.8 2.8 16.3 17.3
Share of ChangeU.S. exports to: Exports, processed food 1998-99 1999-20
2000 exportsMillion dollars
Japan 6,213.6 20.7 6.1 3.3Canada 5,746.5 19.1 3.7 5.6Mexico 3,369.0 11.2 1.0 16.9South Korea 1,839.6 6.1 46.1 32.9Hong Kong 885.3 2.9 -12.3 -4.8United Kingdom 741.3 2.5 -1.1 -11.9China (Taiwan) 730.2 2.4 4.7 -0.2Netherlands 704.6 2.3 1.1 -5.2China (mainland) 661.5 2.2 -46.3 46.3Germany 497.3 1.7 -20.7 1.7
Source: USDA, ERS.
------------------------------ Percent ------------------------------

90 ● U.S. Food Marketing System, 2002 / AER-811 Economic Research Service/USDA
Appendix table 40—U.S. processed food exports, by food category and top destination countries, 2000Country Value
Thousand dollars
Meats:Japan 2,922,858Mexico 1,372,252South Korea 1,152,440Canada 824,319Hong Kong 555,859
Dairy:Canada 209,364Mexico 199,502Japan 105,706China (Taiwan) 51,652South Korea 43,882
Processed fruits and vegetables:Canada 871,130Japan 700,340Mexico 315,863Netherlands 143,881South Korea 122,257
Grain mill products:Canada 826,520Japan 569,243Mexico 434,714Netherlands 203,467United Kingdom 130,201
Bakery:Canada 315,450Mexico 35,117Japan 15,385Australia 8,922United Kingdom 8,775
Sugar and confectionery:Canada 466,858Mexico 250,480Japan 187,264Germany 128,893Spain 93,305
Fats and oils:Canada 426,100Mexico 396,982Switzerland 205,794Philippines 200,887Japan 170,177
Continued--
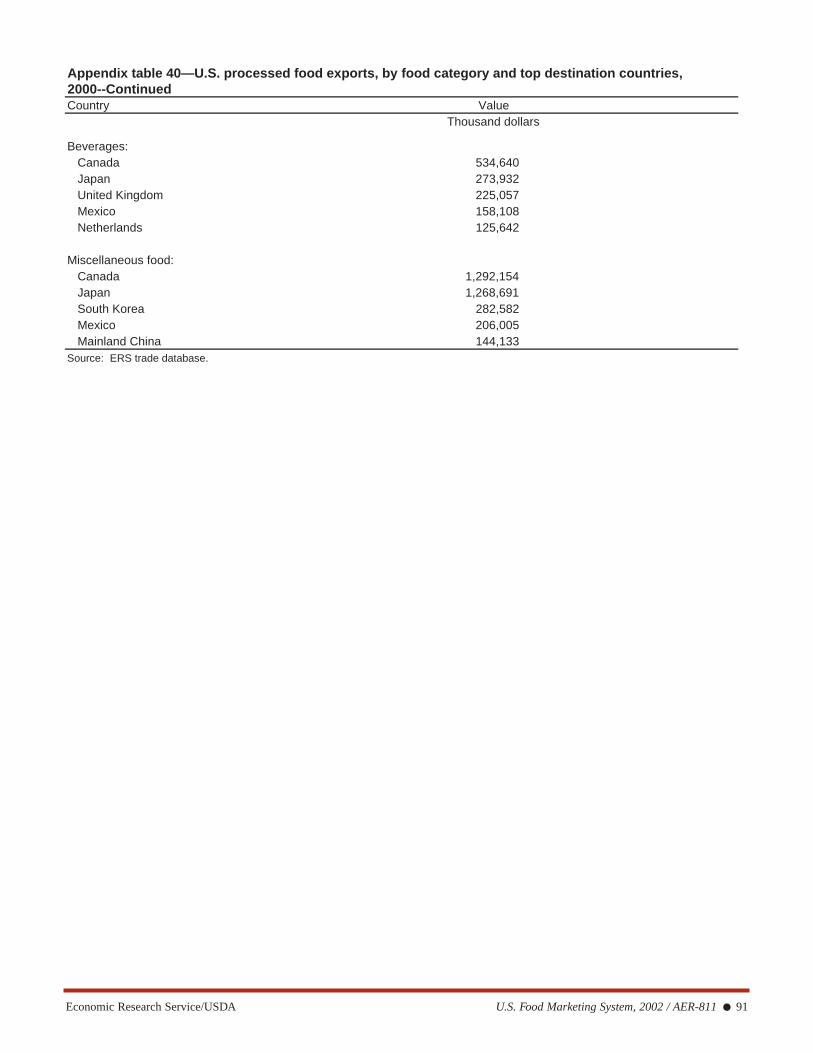
Economic Research Service/USDA U.S. Food Marketing System, 2002 / AER-811 ● 91
Appendix table 40—U.S. processed food exports, by food category and top destination countries, 2000--ContinuedCountry Value
Thousand dollars
Beverages:Canada 534,640Japan 273,932United Kingdom 225,057Mexico 158,108Netherlands 125,642
Miscellaneous food:Canada 1,292,154Japan 1,268,691South Korea 282,582Mexico 206,005Mainland China 144,133
Source: ERS trade database.
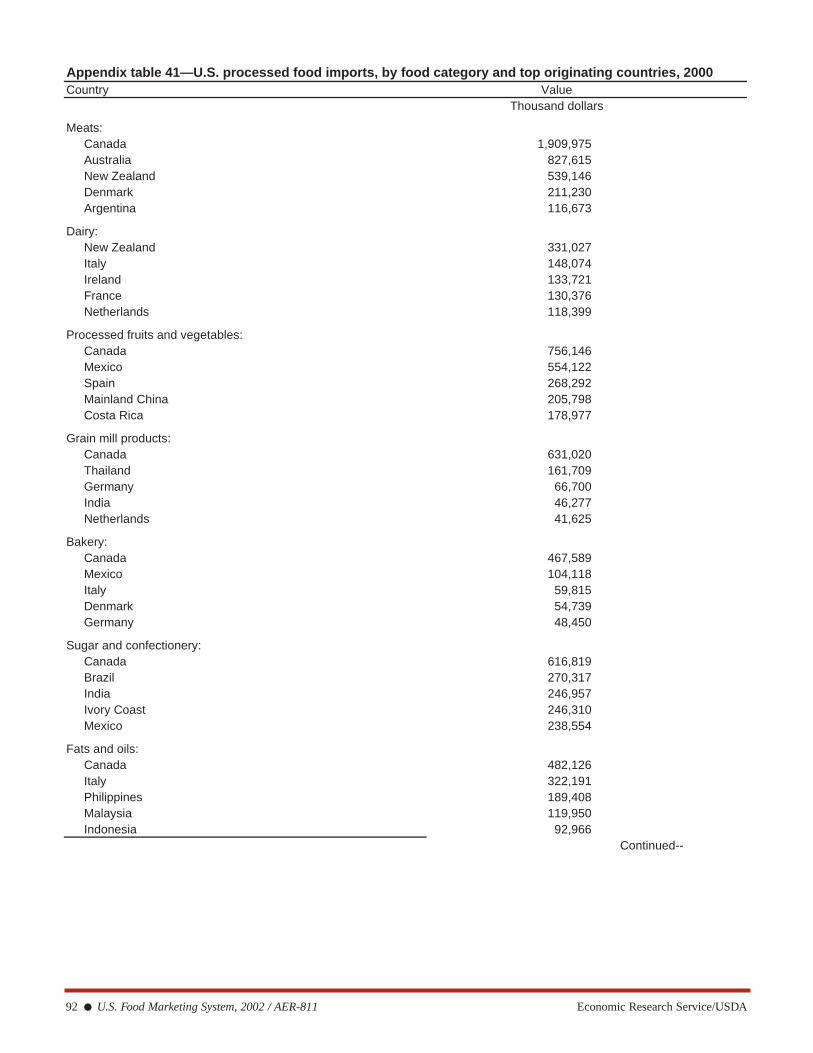
92 ● U.S. Food Marketing System, 2002 / AER-811 Economic Research Service/USDA
Appendix table 41—U.S. processed food imports, by food category and top originating countries, 2000Country Value
Thousand dollars
Meats:Canada 1,909,975Australia 827,615New Zealand 539,146Denmark 211,230Argentina 116,673
Dairy:New Zealand 331,027Italy 148,074Ireland 133,721France 130,376Netherlands 118,399
Processed fruits and vegetables:Canada 756,146Mexico 554,122Spain 268,292Mainland China 205,798Costa Rica 178,977
Grain mill products:Canada 631,020Thailand 161,709Germany 66,700India 46,277Netherlands 41,625
Bakery:Canada 467,589Mexico 104,118Italy 59,815Denmark 54,739Germany 48,450
Sugar and confectionery:Canada 616,819Brazil 270,317India 246,957Ivory Coast 246,310Mexico 238,554
Fats and oils:Canada 482,126Italy 322,191Philippines 189,408Malaysia 119,950Indonesia 92,966
Continued--
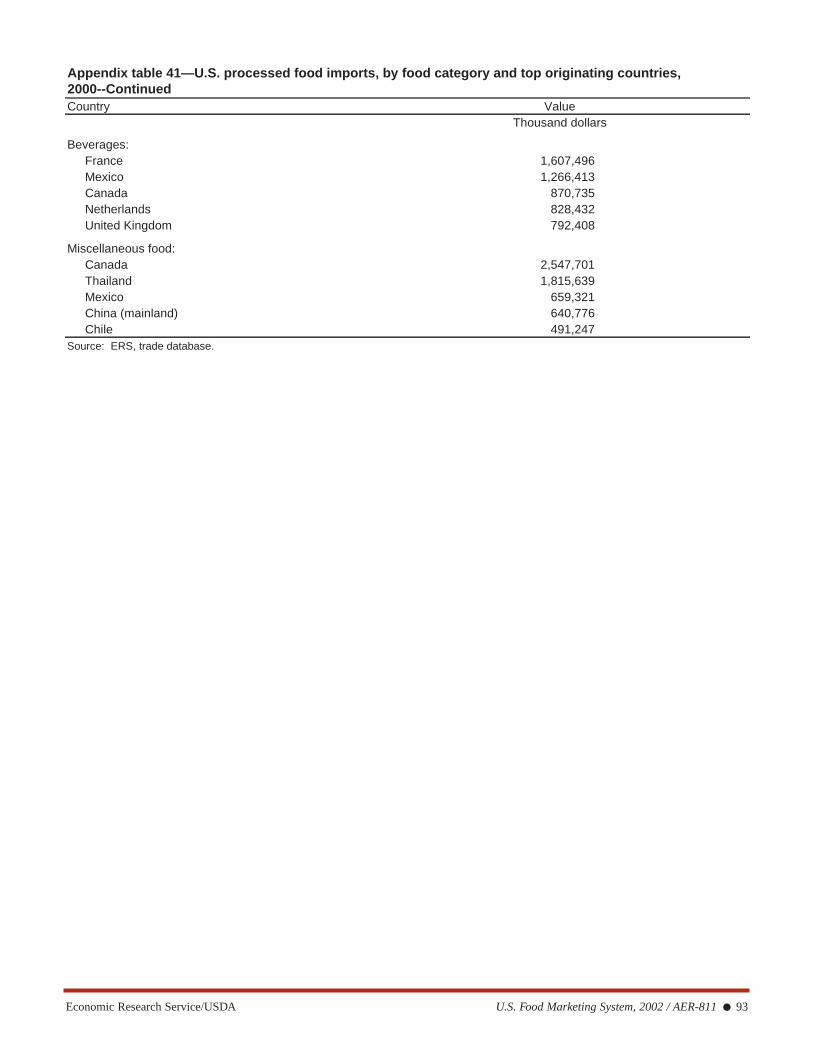
Economic Research Service/USDA U.S. Food Marketing System, 2002 / AER-811 ● 93
Appendix table 41—U.S. processed food imports, by food category and top originating countries, 2000--ContinuedCountry Value
Thousand dollars
Beverages:France 1,607,496Mexico 1,266,413Canada 870,735Netherlands 828,432United Kingdom 792,408
Miscellaneous food:Canada 2,547,701Thailand 1,815,639Mexico 659,321China (mainland) 640,776Chile 491,247
Source: ERS, trade database.
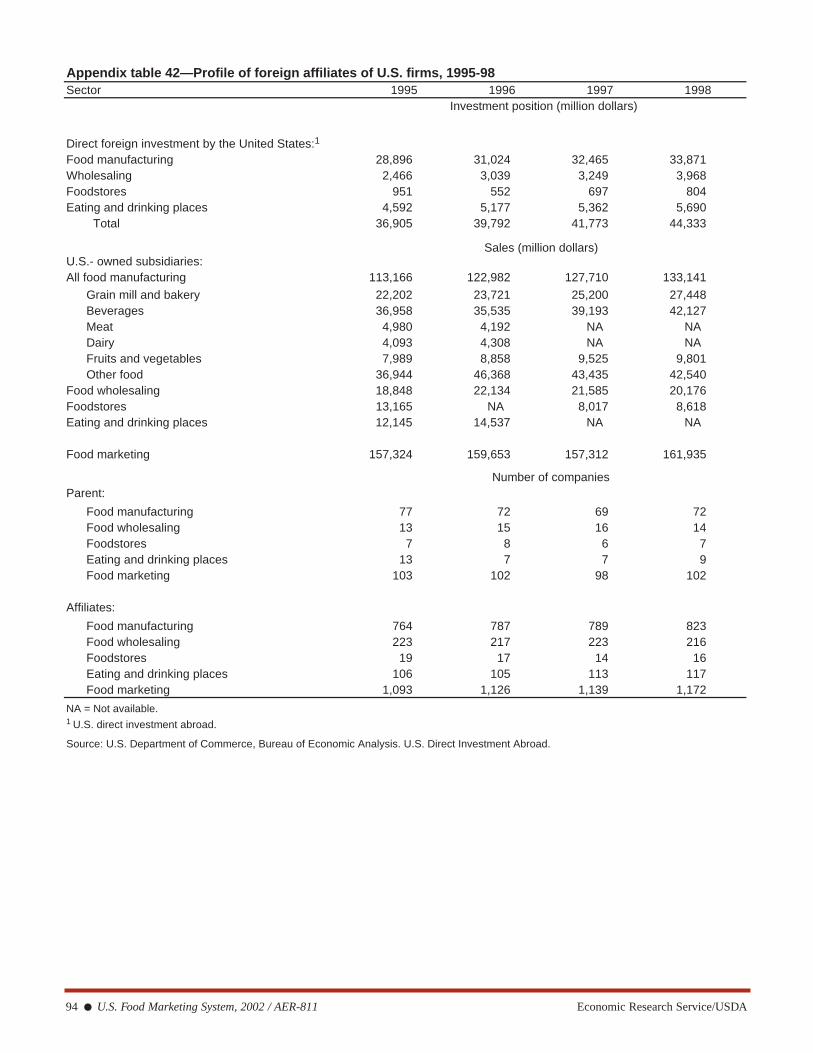
94 ● U.S. Food Marketing System, 2002 / AER-811 Economic Research Service/USDA
Appendix table 42—Profile of foreign affiliates of U.S. firms, 1995-98Sector 1995 1996 1997 1998
Investment position (million dollars)
Direct foreign investment by the United States:1
Food manufacturing 28,896 31,024 32,465 33,871Wholesaling 2,466 3,039 3,249 3,968Foodstores 951 552 697 804Eating and drinking places 4,592 5,177 5,362 5,690 Total 36,905 39,792 41,773 44,333
Sales (million dollars)U.S.- owned subsidiaries:All food manufacturing 113,166 122,982 127,710 133,141
Grain mill and bakery 22,202 23,721 25,200 27,448Beverages 36,958 35,535 39,193 42,127Meat 4,980 4,192 NA NADairy 4,093 4,308 NA NAFruits and vegetables 7,989 8,858 9,525 9,801Other food 36,944 46,368 43,435 42,540
Food wholesaling 18,848 22,134 21,585 20,176Foodstores 13,165 NA 8,017 8,618Eating and drinking places 12,145 14,537 NA NA
Food marketing 157,324 159,653 157,312 161,935
Number of companiesParent:
Food manufacturing 77 72 69 72Food wholesaling 13 15 16 14Foodstores 7 8 6 7Eating and drinking places 13 7 7 9Food marketing 103 102 98 102
Affiliates:
Food manufacturing 764 787 789 823Food wholesaling 223 217 223 216Foodstores 19 17 14 16Eating and drinking places 106 105 113 117Food marketing 1,093 1,126 1,139 1,172
NA = Not available.1 U.S. direct investment abroad.
Source: U.S. Department of Commerce, Bureau of Economic Analysis. U.S. Direct Investment Abroad.
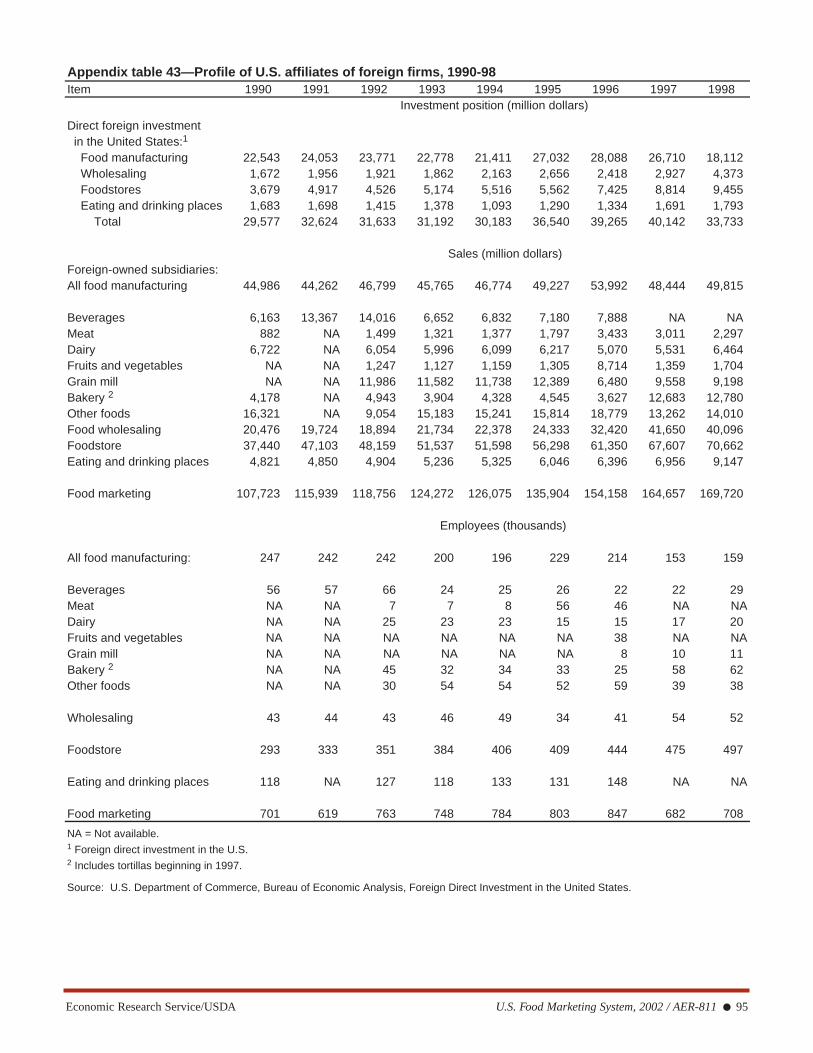
Economic Research Service/USDA U.S. Food Marketing System, 2002 / AER-811 ● 95
Appendix table 43—Profile of U.S. affiliates of foreign firms, 1990-98Item 1990 1991 1992 1993 1994 1995 1996 1997 1998
Investment position (million dollars)
Direct foreign investment in the United States:1
Food manufacturing 22,543 24,053 23,771 22,778 21,411 27,032 28,088 26,710 18,112 Wholesaling 1,672 1,956 1,921 1,862 2,163 2,656 2,418 2,927 4,373 Foodstores 3,679 4,917 4,526 5,174 5,516 5,562 7,425 8,814 9,455 Eating and drinking places 1,683 1,698 1,415 1,378 1,093 1,290 1,334 1,691 1,793 Total 29,577 32,624 31,633 31,192 30,183 36,540 39,265 40,142 33,733
Sales (million dollars)Foreign-owned subsidiaries:All food manufacturing 44,986 44,262 46,799 45,765 46,774 49,227 53,992 48,444 49,815
Beverages 6,163 13,367 14,016 6,652 6,832 7,180 7,888 NA NAMeat 882 NA 1,499 1,321 1,377 1,797 3,433 3,011 2,297Dairy 6,722 NA 6,054 5,996 6,099 6,217 5,070 5,531 6,464Fruits and vegetables NA NA 1,247 1,127 1,159 1,305 8,714 1,359 1,704Grain mill NA NA 11,986 11,582 11,738 12,389 6,480 9,558 9,198Bakery 2 4,178 NA 4,943 3,904 4,328 4,545 3,627 12,683 12,780Other foods 16,321 NA 9,054 15,183 15,241 15,814 18,779 13,262 14,010Food wholesaling 20,476 19,724 18,894 21,734 22,378 24,333 32,420 41,650 40,096Foodstore 37,440 47,103 48,159 51,537 51,598 56,298 61,350 67,607 70,662Eating and drinking places 4,821 4,850 4,904 5,236 5,325 6,046 6,396 6,956 9,147
Food marketing 107,723 115,939 118,756 124,272 126,075 135,904 154,158 164,657 169,720
Employees (thousands)
All food manufacturing: 247 242 242 200 196 229 214 153 159
Beverages 56 57 66 24 25 26 22 22 29Meat NA NA 7 7 8 56 46 NA NADairy NA NA 25 23 23 15 15 17 20Fruits and vegetables NA NA NA NA NA NA 38 NA NAGrain mill NA NA NA NA NA NA 8 10 11Bakery 2 NA NA 45 32 34 33 25 58 62Other foods NA NA 30 54 54 52 59 39 38
Wholesaling 43 44 43 46 49 34 41 54 52
Foodstore 293 333 351 384 406 409 444 475 497
Eating and drinking places 118 NA 127 118 133 131 148 NA NA
Food marketing 701 619 763 748 784 803 847 682 708
NA = Not available.1 Foreign direct investment in the U.S.2 Includes tortillas beginning in 1997.
Source: U.S. Department of Commerce, Bureau of Economic Analysis, Foreign Direct Investment in the United States.