The transmission of bank capital requirements and monetary ...
34
Discussion Paper Deutsche Bundesbank No 49/2019 The transmission of bank capital requirements and monetary policy to bank lending Björn Imbierowicz Axel Löffler Ursula Vogel Discussion Papers represent the authors‘ personal opinions and do not necessarily reflect the views of the Deutsche Bundesbank or the Eurosystem.
Transcript of The transmission of bank capital requirements and monetary ...

Discussion PaperDeutsche BundesbankNo 49/2019
The transmission of bank capital requirementsand monetary policy to bank lending
Björn ImbierowiczAxel LöfflerUrsula Vogel
Discussion Papers represent the authors‘ personal opinions and do notnecessarily reflect the views of the Deutsche Bundesbank or the Eurosystem.

Editorial Board: Daniel Foos Stephan Jank Thomas Kick Malte Knüppel Vivien Lewis Christoph Memmel Panagiota Tzamourani
Deutsche Bundesbank, Wilhelm-Epstein-Straße 14, 60431 Frankfurt am Main, Postfach 10 06 02, 60006 Frankfurt am Main Tel +49 69 9566-0 Please address all orders in writing to: Deutsche Bundesbank, Press and Public Relations Division, at the above address or via fax +49 69 9566-3077
Internet http://www.bundesbank.de
Reproduction permitted only if source is stated.
ISBN 978–3–95729–658–0 (Printversion) ISBN 978–3–95729–659–7 (Internetversion)

Non-technical summary
Research Question
After the global financial crisis, banking regulation in Europe underwent a comprehensive overhaul, in particular with respect to the increases in bank capital requirements. At the same time monetary policy – in the euro area as well as in other major economies – was characterized by an accommodative monetary policy stance. As the banking system is a major transmission channel for monetary policy and banking regulation alike, the implications of the two policies with respect to bank lending and interest rates deserve closer attention. This paper aims to contribute to the understanding of the short-term transmission of bank capital requirements as well as monetary policy, and the interaction between these two, on bank lending and bank interest rates in the German banking system.
Contribution
This paper contributes to the existing literature by shedding light on the transmission of changes in capital requirements and monetary policy to banks’ lending to corporates and the attendant lending rates, as well as the interaction between monetary policy and capital requirements. With respect to banks’ capital requirements, we go beyond the usual investigation of implications of changes in regulatory requirements by accounting for bank idiosyncratic and time-specific “affectedness”.
Results
Our results show that for weakly capitalized banks increases in capital requirements are associated with a decrease in bank lending in the short-term. Furthermore, changes in the monetary policy stance are positively related to lending rates. Regarding the interaction effect of capital regulation and monetary policy, we observe that increases in capital requirements attenuate the general effects of monetary policy on interest rates. Overall, the transmission of an accomodating monetary policy to lending rates is attenuated by contemporaneous increases in bank capital requirements which additionally imply a transitory decrease of the loan growth of weakly capitalized banks.

Nichttechnische Zusammenfassung
Fragestellung
Nach der globalen Finanzkrise wurde die Bankenregulierung in Europa umfassend überarbeitet, insbesondere hinsichtlich der Kapitalanforderungen für Banken. Gleichzeitig war die Geldpolitik, in der Eurozone ebenso wie in anderen Volkswirtschaften, gekennzeichnet durch eine nie zuvor gewesene akkommodierende Ausrichtung. Da sowohl für Regulierungspolitik als auch für Geldpolitik das Bankensystem ein wichtiger Transmissionskanal ist, verdienen die Auswirkungen der beiden Politiken auf die Kreditvergabe von Banken nähere Aufmerksamkeit. Dieses Papier untersucht die Transmission von Kapitalanforderungen und Geldpolitik, sowie die Interaktion der beiden auf die Kreditvergabe und Kreditzinsen der Banken in Deutschland in der kurzen Frist.
Beitrag
Dieses Papier leistet einen Beitrag zur bestehenden Literatur, indem es die Transmission der Änderung von Kapitalanforderungen und Geldpolitik auf die Kreditvergabe von Banken an nicht-finanzielle Unternehmen sowie die entsprechenden Kreditzinsen und die Interaktion der beiden Politiken untersucht. Hinsichtlich der Kapitalanforderungen für Banken gehen wir über die übliche Untersuchung von Änderungen der regulatorischen Anforderungen hinaus, indem wir berücksichtigen, in welchem Ausmaß die Banken von den Maßnahmen betroffen waren.
Ergebnisse
Unsere Ergebnisse zeigen, dass Erhöhungen von Kapitalanforderungen bei Banken mit schwacher Kapitalausstattung nah am regulatorischen Minimum kurzfristig mit einer geringeren Kreditvergabe einhergehen. Zudem besteht ein positiver Zusammenhang zwischen Änderungen der geldpolitischen Ausrichtung und Kreditzinsen. Dieser Effekt ist jedoch gedämpft, wenn parallel zu geldpolitischen Änderungen sich die Kapitalanforderungen für Banken erhöhen. Insgesamt wird die Transmission akkommodierender Geldpolitik auf Kreditzinsen also durch höhere Kapitalanforderungen verringert, wobei die Kreditvergabe der weniger kapitalisierten Banken temporär sinkt.

DEUTSCHE BUNDESBANK DISCUSSION PAPER NO 49/2019
The transmission of bank capital requirements and monetary policy to bank lending
Björn Imbierowicza Axel Löfflerb Ursula Vogelc
Abstract We investigate the transmission of changes in bank capital requirements and supranational monetary policy, and their interaction effect, on euro area bank lending and lending rates. Our results show that - for weakly capitalized banks - increases in capital requirements are in the short-run associated with a decrease in the total of domestic and cross-border bank lending. In addition, we find that there is no similar effect of capital requirements for strongly capitalized banks. Furthermore, changes in the monetary policy stance are positively related to lending rates. Regarding the interacting effect of national capital requirements and supranational monetary policy, we observe that increases in capital requirements attenuate the general effects of monetary policy on interest rates. Overall, the transmission of an accommodating monetary policy to lending rates is attenuated by contemporaneous increases in bank capital requirements which additionally imply a transitory decrease of the loan growth of weakly capitalized banks. JEL classification: E52, F30, G28. Keywords: Bank Lending, Lending Rates, Capital Requirements, Monetary Policy, International Policy Interaction.
a [email protected]; b [email protected]; c [email protected], all Deutsche Bundesbank, Wilhelm-Epstein-Str. 14, 60431 Frankfurt. The paper benefitted from comments from Ozge Akinci as well as participants at IBRN meetings and a Bundesbank seminar. The views expressed in this paper are those of the authors alone and do not necessarily reflect the policy or positions of the Deutsche Bundesbank or the Eurosystem.

1
1. Introduction
After the global financial crisis, banking regulation in Europe underwent a
comprehensive overhaul, in particular with respect to bank capital. Microprudential capital
requirements were tightened and complemented with several macroprudential measures to
provide regulators with (further) tools which could now address systemic risks. At the same
time monetary policy – in the euro area as well as in other major economies – was characterized
by an accommodative monetary policy stance. As the banking system is a major transmission
channel for monetary policy and capital regulation alike, the implications of the two policies
with respect to bank lending and interest rates1 deserve closer attention. This paper aims to
contribute to the understanding of the transmission of bank capital requirements as well as
supranational monetary policy, and the interaction between the two policies, on euro area bank
lending and related bank interest rates. Consequently it sheds light into domestic as well as
international implications of national and supranational policy interactions over the short term.
Both policies have been investigated separately in the empirical literature. The evidence
on the effects of changes in bank capital requirements is mixed,2 and implications hinge on the
time horizon analyzed.3 As to the impact of monetary policy, the results in the literature suggest
that its effects on bank lending depend on banks’ risk.4 While the central bank policy rate has
1 In this paper the terms “bank interest rate”, “lending interest rate” and “interest rate” are used synonymously. All terms refer to the bank- and time-specific weighted interest rate for outstanding lending to corporates in the euro area and denominated in Euro. 2 Aiyar et al. (2014) observe a decrease in lending in response to higher capital requirements, while a survey by the Basel Committee on Banking Supervision (BCBS) (1999) of more than 130 research papers on the effects of Basel I suggests that this is the case in economic troughs only. Other studies argue that the effects depend on the industry sector (Bridges et al., 2015), bank dependency (Gropp et al., 2018), banks’ rating approach (Behn et al., 2016), or bank type (De Jonghe et al., 2016). Moreover, Jiménez et al. (2017) investigate a dynamic provisioning of capital requirements and find that it helps smooth the credit cycle. Francis and Osborne (2012) and Imbierowicz et al. (2018) show that banks tend to adjust the risk composition of their asset portfolio in response to an increase in capital requirements rather than the volume of loan portfolios. 3 Some papers examining the long-term implications find transitory adverse implications (see e.g. Eickmeier et al. 2018) and in the long-run higher bank capital being associated with higher loan volumes (see e.g. Buch and Prieto (2014) for an analysis of the German banking system). 4 Examples are Bernanke and Blinder (1992), Kashyap et al. (1993), Kashyap and Stein (1994, 2000), Gambacorta and Mistrulli (2004), or Jiménez et al. (2012).

2
an effect on banks’ risk-taking and leverage and therefore financial stability (for an overview,
see e.g. Gambacorta, 2009), prudential capital requirements generally induce a change in banks’
funding mix and accordingly their costs, and thereby affect their response to policy changes.
Some more recent studies have also looked into the interaction between the two policies. Takáts
and Temesvary (2019) find significant interactions between macroprudential policy in general
and monetary policy associated with the currency of cross-border bank lending. Tighter
macroprudential policy mitigates the lending impact of monetary policy, whereas an ease of
macroprudential policy amplifies the lending impact of monetary policy. Some studies
investigate the interaction between monetary policy and bank capital requirements. Aiyar et al.
(2016) find in a study for the UK that a tightening of both capital requirements and monetary
policy reduces bank lending. However, they find little evidence of an interaction between the
two policy instruments. De Marco and Wieladek (2016) also study bank-specific capital
requirements and monetary policy in the UK and the consequences for SMEs. They find that
effects differ depending on the bank-firm relationship and firms’ dependency on banks, as well
as bank and firm characteristics. Empirical evidence presented by Budnik and Bochmann
(2017) shows that the response of better capitalized banks’ loan growth to changes in monetary
policy is less severe. Relatedly, Gambacorta and Mistrulli (2004) and Maddaloni and Peydro
(2013) illustrate that lending by poorly capitalized banks responds more strongly to changes in
monetary policy rates. Eickmeier et al. (2018) show for the US that monetary policy cushions
negative short-term effects of capital requirement tightenings. We are not aware of studies
looking at the implications on lending rates.
In our paper, we examine the impact of changes in capital requirements and
supranational monetary policy on the total of banks’ domestic and cross-border lending to the
non-financial corporate sector in the euro area and the interest rate charged for these loans. Our
sample covers the period from 2008:Q1 to 2018:Q3 for a sample of German and international
banks in the German banking system. We analyze the effects of the supranational monetary

3
policy stance accounting for the transmission of changes in bank capital requirements. As a
measure for the monetary policy stance, we use the cumulative changes in the money market
interest rate over one year. We measure a bank’s capital requirement as the ratio of capital
required by the regulator for the specific type of loans we investigate (i.e. corporate loans). It
is calculated as the sum of the bank-specific risk-weighted capital requirement ratios multiplied
by the average risk weight of the corporate loan portfolio (RWA density). It therefore includes
more variation in the time dimension than regulatory changes alone.
In a first step, we investigate the effect of changes in banks’ loan type-related capital
requirements on euro area lending as well as on the related lending rates. We find that in the
short term higher capital requirements are, on average, associated with a reduction in the total
of domestic and cross-border lending. This effect stems from those banks with less capital
beyond the regulatory required level. We do not observe an effect on lending rates. We then
investigate whether the effect of changes in capital requirements on lending and lending rates
depends on the level of a bank’s capital. To do so, we calculate a bank’s excess capital, that is,
the difference between its regulatory capital requirement and its actual capital ratio. We observe
that the decrease in lending in response to higher capital requirements derives from banks with
lower levels of excess capital. Our analyses show that these are banks with a level of excess
capitalization of less than 2.8%. A one-percentage-point increase in bank capital requirements
implies a 1.5% lower loan growth for these banks. We acknowledge that dynamics might be
different over longer time horizons as banks may target a bank- and time-specific optimal
capital ratio (e.g. Gropp and Heider 2010). Furthermore, we cannot rule out substitution effects.
Banks might decrease their lending to the corporate sector but increase lending to other sectors
with for example lower risk weights (e.g. Imbierowicz et al. 2018).5 Our finding complements
well Buch and Prieto (2014) who also look at the German banking system. While they show
5 Mankart et al. (2018) show that tighter leverage requirements c.p. (ceteris paribus) increase lending to sectors with higher risk weights, while higher risk-weighted capital requirements c.p. reduce banks’ loan supply.

4
that aggregate and long-term implications of higher bank capital for lending are positive, we
add to this by exploring short-term effects and by pointing out that possible transitory adverse
effects hinge on the excess capitalization of banks.
In a second step, we additionally analyze the effects of changes in the supranational
monetary policy stance. We find that changes in the monetary policy stance, tightening as well
as easing ones, are positively related to euro area lending rates but are not related to loan growth.
However, the effect of a tightening of monetary policy on lending rates is stronger than for an
easing. We observe that a decrease (increase) in the monetary policy rate of 1 percentage point
implies a decrease of 0.038% (increase of 0.181%) of the change in lending rates, what
translates to a transmission to corporate interest rate levels of about 75%.
In a last step, we explore the interaction of capital requirements and supranational
monetary policy. Prudential regulation and monetary policy are likely to interact in their effects
as for both types of policy the banking sector is a major transmission channel. Both types of
policies might have an effect on bank refinancing costs which, in turn, might affect lending
rates and volumes. Accordingly, the transmission of one policy may be affected by changes to
the other. Interacting changes in regulatory capital requirements and monetary policy shows
that changes in the monetary policy stance are associated with attenuating effects when capital
requirements change in the opposite direction. This implies that a lower monetary policy rate
translates into a smaller decrease in bank lending rates if capital requirements are tightened at
the same time. Correspondingly, lower bank capital requirements might cushion the effects of
policy rate hikes. However, we find our previous result of capital requirements being negatively
related to the lending of weaker banks again confirmed. Higher capital requirements imply a
decrease in the lending for weaker capitalized banks.
Our findings add to the still rather scarce empirical literature on the joint effects of
capital regulation and monetary policy, and show that bank regulation and monetary policy
should not only be considered individually as they also interact, and that real effects - which

5
appear domestically and cross-border - hinge crucially on bank capitalization. Yet, it is to be
noted that our analysis contributes to an improved understanding of short-term implications of
policy changes for different types of banks, which are shown to be different from positive long-
term or more aggregate implications (see e.g. Buch and Prieto 2014, Eickmeier et al. 2018).
Our results are important for policymakers as a thorough understanding of policy transmission
and interactions is crucial for maintaining the stability of the domestic as well as other banking
systems, and the resulting real implications. They might further be useful for ex-ante
assessments of envisaged policy changes, in particular with respect to unintended externalities
and the understanding of their transitory nature. Last but not least, our paper contributes to the
at this point still scarce literature in which the intensity of prudential policy changes is mapped
to outcome variables.6
The remainder of the paper is structured as follows. In Section 2 we provide a brief
overview of bank capital regulation and monetary policy in Germany. Section 3 describes the
data, and Section 4 presents our empirical work and the results. Section 5 concludes.
2. Capital requirements and monetary policy
2.1 Bank capital requirements in Germany
Our sample period starts in 2008:Q1 when Basel II was already in force. Accordingly,
for determining risk weights, banks were able to choose between the standardized approach
(SA) and the internal ratings-based approach (IRBA). In contrast to the SA, in which risk
weights are assigned by predefined templates set by the regulator, the IRBA allows banks to
determine risk weights based on their internal risk models, subject to approval by the regulator.
In Germany, mainly large banks gradually shifted their loan portfolios from the SA to the IRBA
upon the introduction of Basel II. This resulted in most cases in substantially lower risk weights
6 See Vandenbussche et al. (2015) for a study of a comprehensive set of prudential policy measures. Other studies accounting for the intensity of policy changes focus on LTV changes only.

6
for most of these banks’ assets as well as in differences in risk weights across banks.
Most Basel III-related provisions have been applicable since January 2014 in the EU.7
The requirements implied a gradual tightening of capital regulations – both in terms of capital
definitions and quantity. Minimum capital requirements were complemented with additional
capital buffers such as, for instance, the capital conservation buffer (CCoB) and the buffers for
systemically important financial institutions (SIFI buffers). In addition, from 2015 onwards,
bank-specific pillar 2 capital requirements (based on the Supervisory Review and Evaluation
Process – SREP) have been determined annually by banking supervisors. Over our sample
period from 2008:Q1 to 2018:Q3, only bank capital-related prudential regulatory action –
possibly affecting lending to non-financial corporates – was implemented in Germany.8
2.2 Supranational monetary policy and monetary policy stance
Monetary policy for Germany, as a member of the euro area, is conducted at the
supranational level within the Eurosystem, which consists of the European Central Bank (ECB)
and all euro-area national central banks. Since October 2008, in response to the crisis, the ECB
has set a fixed main policy interest rate and provided liquidity according to banks’ demand (full
allotment).9 It also extended the maturity of refinancing operations and the range of eligible
assets that could be used as collateral for these operations. Prior to October 2008, the ECB
offered liquidity such that banks were able to exactly fulfill their reserve requirements.
Liquidity was issued by the ECB in a competitive tender procedure and thereafter distributed
in the markets such that each bank was able to fulfill its requirement. Consequently, since
October 2008 the ECB has been operating in an environment of surplus liquidity and the money
7 In the EU, Basel III has been implemented by the Capital Requirement Directive (CRD IV) and the Capital Requirement Regulation (CRR), which form the European legal framework. CRD IV provisions require implementation in the German Banking Act (Kreditwesengesetz - KWG). 8 See Budnik and Kleibl (2018) and the related MaPPED for details on all macroprudential policy actions in the EU between 1995 and 2014. 9 For an extensive overview of euro-area monetary policy, see Hartmann and Smets (2018).

7
market rate has approached the lower bound of the corridor (ECB marginal deposit facility
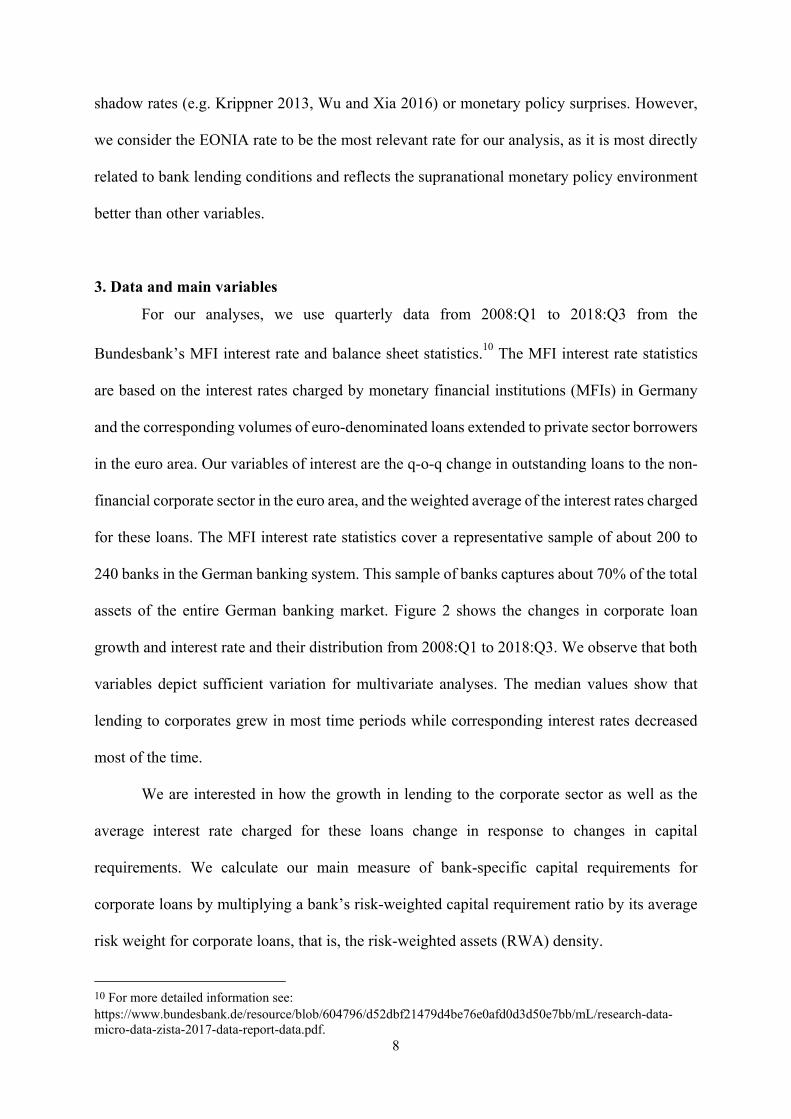
interest rate). Figure 1 depicts the key policy interest rates and the money market rate from
2008:Q1 to 2018:Q3.
Figure 1: Monetary policy rates The figure shows key ECB policy interest rates and the EONIA interest rate from 2008:Q1 to 2018:Q3.
Prior to October 2008, the main refinancing rate and the overnight interbank money
market rate (Euro Over Night Index Average, or EONIA) were close to each other. Since then,
the EONIA interest rate has moved from being close to the main refinancing rate towards the
lower bound of the interest rate corridor set by the ECB, that is, to the deposit facility interest
rate. We therefore use the EONIA interest rate as our proxy for the ‘true’ supranational
monetary policy rate. In our empirical analyses, we incorporate the cumulative changes in the
short-term money market rate over the current and the three previous quarters as a measure of
the monetary policy stance (in contrast to immediate shocks). In the literature, other measures
have been used to explore the implications of monetary policy changes. These measures include
01
23
45
Perc
ent
2008m1 2010m1 2012m1 2014m1 2016m1 2018m1
Marginal deposit facility interest rate Main refinancing rateMarginal lending facility interest rate EONIA
8
shadow rates (e.g. Krippner 2013, Wu and Xia 2016) or monetary policy surprises. However,
we consider the EONIA rate to be the most relevant rate for our analysis, as it is most directly
related to bank lending conditions and reflects the supranational monetary policy environment
better than other variables.
3. Data and main variables For our analyses, we use quarterly data from 2008:Q1 to 2018:Q3 from the
Bundesbank’s MFI interest rate and balance sheet statistics.10 The MFI interest rate statistics
are based on the interest rates charged by monetary financial institutions (MFIs) in Germany
and the corresponding volumes of euro-denominated loans extended to private sector borrowers
in the euro area. Our variables of interest are the q-o-q change in outstanding loans to the non-
financial corporate sector in the euro area, and the weighted average of the interest rates charged
for these loans. The MFI interest rate statistics cover a representative sample of about 200 to
240 banks in the German banking system. This sample of banks captures about 70% of the total
assets of the entire German banking market. Figure 2 shows the changes in corporate loan
growth and interest rate and their distribution from 2008:Q1 to 2018:Q3. We observe that both
variables depict sufficient variation for multivariate analyses. The median values show that
lending to corporates grew in most time periods while corresponding interest rates decreased
most of the time.
We are interested in how the growth in lending to the corporate sector as well as the
average interest rate charged for these loans change in response to changes in capital
requirements. We calculate our main measure of bank-specific capital requirements for
corporate loans by multiplying a bank’s risk-weighted capital requirement ratio by its average
risk weight for corporate loans, that is, the risk-weighted assets (RWA) density.
10 For more detailed information see: https://www.bundesbank.de/resource/blob/604796/d52dbf21479d4be76e0afd0d3d50e7bb/mL/research-data-micro-data-zista-2017-data-report-data.pdf.

9
, = ,, ∙ ,, (1)
The first term is a bank’s total regulatory capital requirement ratio, i.e. the sum of
minimum pillar 1 requirements, macroprudential capital add-ons including the buffer for SIFIs
and the CCoB, and pillar 2 requirements divided by the bank’s total risk weighted assets.11 The
second term – RWA density – is the risk-weighted exposure for the bank’s corporate loans
relative to the total unweighted exposure for corporate loans. It reflects the average risk weight
of the bank’s corporate loan portfolio. Hence, our variable , captures a bank’s total
regulatory capital requirement related to corporate lending. We use this measure rather than the
simple regulatory capital requirement ratio because banks with a lower RWA density are
relatively less exposed to a change in capital requirements. Accordingly, our measure
, more precisely reflects banks’ de facto capital requirements.
Panel A of Figure 3 shows regulatory capital requirements from 2008:Q1 to 2018:Q3
for the banks in our sample. Panel B shows the RWA density for loans to non-financial
corporates over time. Accordingly it measures the ‘affectedness’ of a bank following an
increase in regulatory capital requirements. It depicts a substantial degree of heterogeneity
across banks as well as over time. Panel C in Figure 3 shows the capital requirement for
corporate loans (the product of the two prior measures) across banks over our sample period.
Note that the increase in the average capital requirement from 2015 on is largely attributable to
the SREP-related requirements that, along with the SIFI-related add-ons, create heterogeneity
in regulatory requirement ratios across banks. It confirms the substantial variation beginning in
2016. It also depicts that the quarterly change in capital requirements varies sufficiently across
banks to ensure an adequate degree of heterogeneity for multivariate analyses.
11 The necessary compliance with these requirements differs. While minimum capital requirements are hard requirements for which fulfillment is mandatory, a breach of the capital buffer would only trigger automatic restrictions on dividend and bonus payments a bank can make.

10
Figure 2Change in corporate loan growth and interest ratesThe figure shows the 25th, 50th and 75th percentile of the quarterly change in corporate loans issued by our sample banks (Panel) A and the interest rate charged for these loans (Panel B) from 2008:Q1 to 2018:Q3.
Panel A: Change in corporate loans
Panel B: Change in corporate loan interest rates
-4-2
02
46
2008q1 2010q1 2012q1 2014q1 2016q1 2018q1
dloans_corp_s
-.6-.4
-.20
.2
2008q1 2010q1 2012q1 2014q1 2016q1 2018q1
dloans_corp_s_i

11
Figure 3: Bank capital requirements The figure shows the 25th, 50th and 75th percentile of regulatory bank capital requirement (Panel A), the risk-weighted assets (RWA) density of corporate loans (Panel B), and bank-specific capital requirements for loans to the non-financial corporate sector (Panel C) from 2008:Q1 to 2018:Q3. It reflects the ingredients of , =
,, ∙ ,, where Panel A shows the first term, Panel B the second term, and Panel C the variable , . The
first term is a bank’s total regulatory capital requirement ratio, i.e. the sum of minimum pillar 1, macroprudential capital buffers such as the O-SII buffer and the CCoB, and pillar 2 requirements divided by the bank’s total risk-weighted assets. The second term, the RWA density, is the risk-weighted exposure for corporate loans of the bank relative to the total unweighted exposure for corporate loans.
Panel A: Regulatory bank capital requirements Panel B: RWA density
Panel C: Bank-specific capital requirements
Information on regulatory required capital ratios are publicly available (for minimum
requirements, capital conservation and SIFI-related buffers), confidential information on SREP
related add-ons are provided by banking supervisors. All other bank-level data is obtained from
confidential Bundesbank balance sheet statistics. In our empirical analysis, we control for
2008q1 2010q1 2012q1 2014q1 2016q1 2018q1
req_T2_P2G_corp

12
different relevant bank characteristics and macroeconomic determinants. Bank-specific control
variables include a bank’s size (measured by the logarithm of its total real assets), the ratio of
liquid assets to total assets, the ratio of its core deposits to total assets, and the return on assets,
all described in more detail in Table 1. We also include a dummy variable for bank mergers
which is one in the quarter when a bank merges with another bank and zero otherwise.
Macroeconomic control variables are obtained from public sources. In Table 1, Panel A
provides summary statistics and Panel B variable definitions.
Panel A of Table 1 shows that the loan growth to the non-financial corporate sector
averages 0.83% each quarter, while the lending rate changes by -0.059%. The quarterly change
in capital requirements is 0.049% and the level of excess capital is 2.762%, as a percentage of
total assets. Our monetary policy stance variable, the one-year average quarterly change of the
money market interest rate, averages -0.058% over our sample period. Note that this includes
periods where it is both positive and negative. Banks hold, on average, 24% of their assets in
liquid form and have core deposits of 36%, both in terms of total assets. The return on assets is
on average 0.20% of total assets over our sample period, and we include 0.3% of bank quarters
where two banks merge.

13
Table 1: Descriptive statistics and variable definitions The table shows descriptive statistics using data from 2008:Q1 to 2018:Q3. Variables are defined in Panel B. Panel A: Descriptive Statistics Variable Mean Standard deviation
(1) Dependent variables ∆ lending (q-o-q change) 0.826 3.910 ∆ interest rate (q-o-q change) -0.059 0.081
(2) Independent variables Capital requirements for lending to corporates (change) 0.049 0.440 Excess capital (% total assets) 2.762 1.564 Monetary policy stance (%) -0.058 0.233 Bank size (ln real assets) 18.115 1.378 Liquid assets (% total assets) 24.083 12.765 Deposits share (% total assets) 35.732 18.899 RoA 0.197 0.285 Merger dummy 0.003 0.050 Uncertainty 137.662 54.331 Ifo business climate 97.462 5.280 Term spread (change) -0.012 0.454 Credit-to-GDP gap -7.241 2.730 GDP gap 0.263 1.570
Panel B: Variable definitions Variable Definition Data source (1) Dependent variables
∆ lending Loans to non-financial corporations in the euro area; % change (q-o-q) MFI interest rate
statistics ∆ interest rate Weighted interest rate for loans to non-financial corp. in the euro area; change (q-o-q)
(2) Independent variables Capital requirements for lending to corporates (change)
Total capital requirements (minimum + combined buffer + pillar 2 requirements); % change (q-o-q) COREP, Supervisory
data Excess capital (% total assets) Minimum of CET1, T1 and T2 excess capital; % of total assets
Monetary policy stance (%) Cumulative change in the money market rate (EONIA) over four quarters ECB
Bank size (ln real assets) Log of total real assets
BISTA, FINREP, Solvency statistics
Liquid assets (% total assets) Sum of cash, balances with the central bank, securities and shares; % of total assets
Deposits share (% total assets) Total deposits of the non-financial sector; % of total assets RoA Annual net profit; % of total assets
Merger dummy Dummy equal to one in the quarter when a merger took place and zero otherwise Supervisory data
Uncertainty News based economic policy uncertainty index Economic Policy Uncertainty (EPU)
Ifo business climate ifo Business Climate index; 2015=100 ifo
Term-spread Spread between 10-year government bond interest rate and money market rate ECB
Credit-to-GDP gap Deviation of credit to GDP from its long-term trend Bundesbank GDP gap Deviation of actual GDP from potential output Bundesbank

14
4. Results
4.1 Transmission of capital requirements
In a first step, we analyze the relationship between changes in banks’ capital
requirements and changes in banks’ lending and interest rates. We estimate the following panel
regression:
∆ , = + ∑ , ∆ , + , + + + , (2)
where ∆ , is the change in the ln of outstanding loans to the non-financial corporate sector
and the difference in the corresponding lending interest rate of bank b in quarter t. Note that we
use a simultaneous equations approach to account for the possibility that changes in lending
and lending rate might not be orthogonal to each other. This implies that we estimate a system
of structural equations comparable with Imbierowicz et al. (2018). All dependent variables are
explicitly taken to be endogenous to the system and are treated as correlated with the
disturbances in the system's equations. For identification, we use the first lag of the dependent
variables as instruments after having rejected a unit root for these in a Phillips-Perron test and
autocorrelation in panel data by a Wooldridge test. This GMM estimator then calculates a
weight matrix which is used in the second step of the estimation for the correlation structure of
the equation disturbances. The change in a bank’s capital requirement is represented by ∆ , , with K=4. Accordingly, we measure changes in lending and changes in lending rates
in response to the changes of a bank’s capital requirement over the previous year. , is a
vector of lagged bank specific control variables and also includes an indicator variable for bank
mergers. All regressions include bank fixed effects and use standard errors clustered at the
bank-quarter level. The results are shown in Table 2.
Columns (1) and (2) of Table 2 contain macroeconomic control variables and columns
(3) and (4) quarter fixed effects to further account for unobserved factors varying at the time
level. The results show that a change in a bank’s capital requirement over the previous year is

15
negatively related to its corporate loan growth. This result is in line with the findings in, for
example, Aiyar et al. (2014), Gropp et al. (2018), and De Jonghe et al. (2016). The coefficient
indicates that a 1 percentage point increase in the bank loan type-specific capital requirements
results in a 1% decrease in corporate lending. Note that our analysis focuses on corporate
lending and the corresponding interest rates and hence we cannot rule out the possibility of a
bank’s lending shifting to other sectors with lower risk weights or lending in other currencies.
Table 2 also shows that capital requirements are not (directly) related to changes in lending
rates.
Table 2: The effect of capital requirements on lending and interest rates The table shows the second step of two-step GMM regression results of a simultaneous equations estimation regressing the quarterly change in lending to the non-financial private sector and the quarterly change in the average interest rate charged for these loans on control variables. The data range from 2008:Q1 to 2018:Q3. All variables are used at the bank-quarter level and defined in Panel B of Table 1. For the two-step GMM estimator, the first step estimates each equation via 2SLS using the first lag of the dependent variables as instruments, where a Fisher type unit root test based on the Phillips-Perron test rejects a unit root and a Wooldridge test rejects autocorrelation in panel data in all cases. A weight matrix is then calculated which is used in the second step of GMM. The dependent variables are taken to be endogenous to the system and treated as correlated with the disturbances in the system's equations. Capital requirement is shown as the cumulative effect over the previous four quarters. Control variables are bank size, liquid assets, deposits share, RoA, included lagged by one quarter, and a dummy variable which is one in a quarter when a bank merges with another bank. In the table, columns (1) and (2) shows the results for the regression with macro controls, and columns (3) and (4) the results when using time fixed effects instead. Both regression specifications are estimated simultaneously. The statistical significance of results is indicated by * = 10% level, ** = 5% level and *** = 1% level using standard errors clustered at the bank level. P-values are shown in parentheses below coefficient estimates.
(1) (2) (3) (4) Dependent variable: ∆ lending ∆ interest rate ∆ lending ∆ interest rate
Capital requirement -1.786*** 0.0105 -1.016*** 0.004 (3.79E-04) (0.466) (9.75E-04) (0.612) Bank control variables yes yes yes yes Bank fixed effects yes yes yes yes Macro control variables yes yes no no Time fixed effects no no yes yes Observations 5,051 5,051 5,123 5,123 Number of banks 170 170 170 170 R-squared 0.139 0.224 0.166 0.284
The implications of changes in capital requirements might depend on banks’
characteristics. De Jonghe et al. (2016), for example, show that increasing capital requirements

16
imply the strongest decrease in bank lending for riskier banks. A bank’s reaction to an increase
in regulatory capital requirements might depend on the amount of banks’ excess capital reduced
by the new requirement, i.e. how much this bank is constrained through the regulatory change.
Accordingly, the response to changes in bank capital requirements might vary between banks
with low and high levels of excess capital, that is, capital above the required regulatory
minimum. We calculate a bank’s excess level of capital using the regulatory definitions for
CET1, T1 and T2 capital, in terms of total assets, and use the minimum out of these three. This
ensures that we are conservative in our approach as banks have to adhere to all three
requirements but their compliance with respect to each capital requirement might be
heterogeneous. Figure 4 shows that banks’ excess capital increased until 2015 but decreased
thereafter until the end of our sample period.
Figure 4: Excess capital The figure shows the 25th, 50th and 75th percentile of banks’ excess capital from 2008:Q1 to 2018:Q3. Excess capital is the minimum of a bank’s capital above the regulatory requirement, using the definitions for CET1, T1 and T2. Regulatory capital requirements include the minimum pillar 1 requirements, the combined capital buffer (capital conservation buffer, countercyclical capital buffer and the buffer for systemically important banks) and pillar 2 requirements (SREP).

17
We again investigate the relationship between changes in banks’ capital requirements
and banks’ lending and interest rates but now additionally condition on banks’ excess capital.
We hypothesize that those banks with lower capitalization levels react more strongly to changes
in capital requirements. We investigate the effects of changes in capital requirements on loan
growth and the change in interest rates by interacting the change in capital requirement with
our continuous variable of banks’ excess level of capital. We estimate the following regression
model using, again, our simultaneous equations setup for both corporate loan growth and the
change in the lending rate
∆ , = + ∑ , ∆ , + ∑ , ∆ , ∗ , + , + , + + + , (3)
where , is a banks’ excess capital ratio. Additionally, we split banks by their level of
excess capital and estimate the following regression model using simultaneous equations.
∆ , = ∑ , , + ∑ , , + ∑ , , + , + + + , (4)
where , is the change in capital requirements when a bank is in the lowest quartile of
the distribution of excess capitalization and zero otherwise, and , the change in capital
requirements when a bank is in the highest quartile. K is again set to K=4. This allows us to test
for the differential effects of changes in capital requirement between worse and better
capitalized banks. Table 3 shows the results.
Panel A of Table 3 shows the results when we interact the changes in capital
requirements with our continuous variable of a bank’s level of excess capital. We observe that
higher levels of excess capital attenuate the negative relationship between a change in a bank’s
capital requirement and its corporate loan growth. The coefficients indicate that the effect of
changes in bank capital requirements is zero for banks with a level of excess capital to total

18
assets of about 6%. Panel B shows our results including the change in capital requirements
separately for banks in the lowest and in the highest quartile of excess capital in a quarter.12 We
observe that changes in capital requirements are negatively related to only the loan growth of
banks with the lowest capitalization levels. Accordingly, increasing capital requirements are
related to decreasing loan growth for weaker banks. As we are estimating within effects and
accordingly statistical significance stems from capitalization and lending dynamics for each
bank (instead of across banks), we can rule out the possibility that our results regarding the
relationship between capital requirements and lending are driven by factors such as bank size
and business model. Rather for ensuing policy ex-ante analysis of the aggregate implications of
changes in capital requirements the distribution of lending volumes across capitalization levels
is crucial. In both Panel A and B we again do not observe a relationship between capital
requirements and corporate lending rates. Our explanation for this is that an increase in lending
rates in response to higher capital requirements would, in fact, constitute a competitive
disadvantage that is too large for more constrained banks and therefore results rather in a better
selection of borrowers by the less capital-constrained banks. To explore this further, loan level
data would be needed.
12 All regressions in Panel B of Table 3 include the change in capital requirement as base effect which is not reported for brevity. The coefficients are statistically insignificant in all cases.

19
Table 3: The effect of capital requirements and bank capitalization on lending and interest rates The table shows the second step of two-step GMM regression results of a simultaneous equations estimation regressing the quarterly change in lending to the non-financial private sector and the quarterly change in the average interest rate charged for these on control variables. The data range from 2008:Q1 to 2018:Q3. All variables are used at the bank-quarter level and defined in Panel B of Table 1. For the two-step GMM estimator, the first step estimates each equation via 2SLS using the first lag of the dependent variables as instruments, where a Fisher type unit root test based on the Phillips-Perron test rejects a unit root and a Wooldridge test rejects autocorrelation in panel data in all cases. A weight matrix is then calculated which is used in the second step of GMM. The dependent variables are taken to be endogenous to the system and treated as correlated with the disturbances in the system's equations. Capital requirement is shown as the cumulative effect over the previous four quarters. Excess capital is defined as a bank’s capital holdings above its regulatory requirement, divided by the bank’s total assets. In Panel A, Excess capital as base effect is included but omitted. In Panel B, the change in capital requirement is interacted with an indicator variable, low excess capital, which is one when a bank is in the lowest quartile of the distribution of excess capitalization in a quarter and zero otherwise, and with high excess capital, which is one when a bank is in the highest quartile of excess capital in a quarter and zero otherwise. In Panel B, the change in capital requirement as a base effect is included but omitted from the table. Control variables are bank size, liquid assets, deposits share, RoA, included lagged by one quarter, and a dummy variable which is one in a quarter in which a bank merges with another bank. In the table, columns (1) and (2), and columns (3) and (4) are estimated simultaneously. The statistical significance of results is indicated by * = 10% level, ** = 5% level and *** = 1% level using standard errors clustered at the bank level. P-values are shown in parentheses below coefficient estimates.
Panel A: Interaction with excess capital (1) (2) (3) (4) Dependent variable: ∆ lending ∆ interest rate ∆ lending ∆ interest rate Capital requirement -2.078*** 0.012 -2.015*** 0.010 (0.000) (0.273) (0.001) (0.520) Capital req. * excess capital 0.369** 0.002 0.298** 2.80E-04 (0.007) (0.427) (0.035) (0.426) Bank control variables yes yes yes yes Bank fixed effects yes yes yes yes Macro control variables yes yes no no Time fixed effects no no yes yes Observations 5,099 5,099 5,099 5,099 Number of banks 170 170 170 170 R-squared 0.134 0.229 0.163 0.286
Panel B: Banks broken down by excess capital (1) (2) (3) (4) Dependent variable: ∆ lending ∆ interest rate ∆ lending ∆ interest rate Capital requirement (low excess capital) -1.251** 0.003 -1.425** -0.005 (0.045) (0.849) (0.023) (0.768) Capital requirement (high excess capital) 0.189 0.002 0.122 -0.005 (0.735) (0.893) (0.829) (0.759) Bank control variables yes yes yes yes Bank fixed effects yes yes yes yes Macro control variables yes yes no no Time fixed effects no no yes yes Observations 5,051 5,051 5,051 5,051 Number of banks 170 170 170 170 R-squared 0.168 0.287 0.139 0.225

20
4.2 Transmission of capital requirements and monetary policy
In this section, we additionally investigate the effect of supranational monetary policy
on corporate loan growth and lending rates. In our sample period, monetary policy was largely
accommodative. The bank lending channel was the target of several monetary policy measures
and accordingly we hypothesize that monetary policy is also transmitted to bank lending. In
addition to the change in capital requirements we incorporate the monetary policy stance which
is measured by the cumulative change in the money market rate over the previous three quarters
and the current quarter.13 That is, we estimate the following regression model using again our
simultaneous equations setup for both corporate loan growth and the change in the lending rate ∆ , = + ∑ , ∆ , + ∑ ∆ −=0 + , + + + , (5)
with ∆ indicating the change in our monetary policy variable and L=3. Note that we are
not able to include quarter time fixed effects in these regressions as they would absorb our
monetary policy variable, which is the same for each bank in a quarter, but include our set of
macro control variables instead. We additionally account for our finding from the previous
section and split banks into those in the lowest and those in the highest quartile in terms of their
level of excess capital in each quarter. We are interested whether our result – that changes in
capital requirements are related only to the lending of weaker banks – continues to hold, and
whether differential effects exist with respect to monetary policy between weaker and stronger
banks as well. Panel A of Table 4 shows the results.
13 We rerun all our analyses using the lending rate spread over the money market rate instead of the lending rate. The results are qualitatively the same.

21
Table 4: The effect of capital requirements and monetary policy on lending and interest rates The table shows the second step of two-step GMM regression results of a simultaneous equations estimation regressing the quarterly change in lending to the non-financial private sector and the quarterly change in the average interest rate charged for these on control variables. The data range from 2008:Q1 to 2018:Q3. All variables are used at the bank-quarter level and defined in Panel B of Table 1. For the two-step GMM estimator, the first step estimates each equation via 2SLS using the first lag of the dependent variables as instruments, where a Fisher type unit root test based on the Phillips-Perron test rejects a unit root and a Wooldridge test rejects autocorrelation in panel data in all cases. A weight matrix is then calculated which is used in the second step of GMM. The dependent variables are taken to be endogenous to the system and treated as correlated with the disturbances in the system's equations. Capital requirement is shown as the cumulative effect over the previous four quarters. Monetary policy is the level of the money market interest rate which is shown as the joint average effect over the current and the previous three four quarters. In Panel B, Monetary Policy is interacted with indicator variables which are one when the money market interest rate declines (Monetary Policy [loose]) and when it increases (Monetary Policy [tight]) from montht-3 to montht. Control variables are bank size, liquid assets, deposits share, RoA, included lagged by one quarter, and a dummy variable which is one in a quarter when a bank merges with another bank. In the table, columns (1) and (2), columns (3) and (4), and columns (5) and (6) are estimated simultaneously. The statistical significance of results is indicated by * = 10% level, ** = 5% level and *** = 1% level using standard errors clustered at the bank level. P-values are shown in parentheses below coefficient estimates.
Panel A: Bank capital requirements and monetary policy All banks Low excess capital banks High excess capital banks (1) (2) (3) (4) (5) (6) Dependent variable ∆ lending ∆ interest rate ∆ lending ∆ interest rate ∆ lending ∆ interest rate Capital requirement -0.870*** 0.014* -1.627*** 0.023 0.431 0.017 (0.002) (0.081) (0.005) (0.171) (0.476) (0.343) Monetary policy -0.868 0.136*** -0.608 0.116*** -1.948* 0.084** (0.123) (0.000) (0.622) (0.001) (0.081) (0.010) Bank control variables yes yes yes yes yes yes Bank fixed effects yes yes yes yes yes yes Macro control variables yes yes yes yes yes yes Observations 5,123 5,123 1,168 1,168 1,344 1,344 Number of banks 170 170 92 92 80 80 R-squared 0.138 0.234 0.213 0.286 0.135 0.204
Panel B: Bank capital requirements and loose and tight monetary policy All banks Low excess capital banks High excess capital banks (1) (2) (3) (4) (5) (6) Dependent variable: ∆ lending ∆ interest rate ∆ lending ∆ interest rate ∆ lending ∆ interest rate Capital requirement -0.912*** 0.00622 -1.64*** 0.021 0.39 0.39 (0.002) (0.442) (0.004) (0.210) (0.520) (0.520) Monetary policy [loose] -0.736 0.154*** -0.532 0.137*** -1.984* 0.110*** (0.194) (0.000) (0.667) (0.000) (0.077) (0.001) Monetary policy [tight] 2.130 0.723*** 2.106 0.776*** 0.174 0.663*** (0.223) (0.000) (0.587) (0.000) (0.960) (0.000) Bank control variables yes yes yes yes yes yes Bank fixed effects yes yes yes yes yes yes Macro control variables yes yes yes yes yes yes Observations 5,123 5,123 1,168 1,168 1,344 1,344 Number of banks 170 170 92 92 80 80 R-squared 0.139 0.257 0.214 0.308 0.135 0.223

22
Panel A confirms our previous finding. We observe that changes in capital requirements
are negatively related to banks’ corporate loan growth which is driven by banks with low levels
of excess capital. The table also shows that the central bank’s monetary policy stance is related
to bank lending. Panel A of Table 4 shows that the supranational monetary policy is transmitted
to changes in corporate lending rates with a positive relationship. The coefficients in Panel A
imply that a one percentage point decrease in the money market rate reduces the change in
interest rates by about 0.14 percentage points. We observe neither a relationship of monetary
policy to loan growth nor differences of the effects of monetary policy by banks’ excess
capital.14
As mentioned earlier, monetary policy was largely accommodative in our sample
period. However, we observe several periods where the average change in the money market
rate was also increasing, indicating a monetary policy tightening.15 To explore whether the
effect is symmetric in episodes with a tightening and with an easing monetary policy stance,
we split our monetary policy variable into two variables. Monetary policy [loose] is the
cumulative change in the money market rate when it is negative and zero otherwise. Monetary
policy [tight] is the cumulative change when it is zero or positive and zero otherwise. We again
estimate equation (5) but replace ∆ with these two variables. Panel B of Table 4 shows
the results.
We find our previous results confirmed for both the tightening and the easing of
supranational monetary policy. Changes in the policy rate are positively related to changes in
corporate lending rates. This implies that a looser monetary policy stance translates into lower
corporate lending rates while stricter monetary policy implies higher corporate lending rates.
Note that the coefficients between our monetary policy variables are not directly comparable in
14 We also re-rerun all regressions excluding the changes in capital requirements. All results continue to hold. 15 As an example, the ECB increased its main refinancing rate from 100bps to 125 bps on April 13, 2011 and further to 150bps on July 13, 2011.

23
their relation to lending rates as the average decrease in the money market rate, as well as its
standard deviation, are much larger than its average increase and deviation in our sample period.
Accounting for the average change and standard deviation in the money market rate, the
sensitivity with respect to corporate lending rates is rather comparable. Interestingly, column
(5) in Panel B shows that banks with high levels of excess capital seem to increase their lending
when the money market rate decreases. This may indicate that better capitalized banks are better
transmitters of accommodative monetary policy. However, we refrain from interpreting this
result in more detail as the coefficient is only marginally significant.
Overall, our results in this section show that changes in capital requirements are
negatively related to the loan growth of weaker banks, while changes in supranational monetary
policy are positively related to corporate interest rates charged by banks irrespective of their
capitalization.
4.3 Transmission of capital requirements, monetary policy, and their interaction
In this section, we are interested in whether changes in capital requirements and the
monetary policy stance are related to bank lending only individually, or also mutually affect
their transmission and effectiveness. To explore this, we additionally explore the interaction
between changes in the two policies. We estimate our regression model from Panel B of Table
4 again but additionally interact the change in capital requirements with our variables Monetary
policy [loose] and Monetary policy [tight]. We again investigate the results for the total sample
as well as separately for the two subsamples of banks with low and high levels of excess capital.
The results are shown in Table 5.

24
Table 5: The effect of capital requirements and monetary policy stance conditional on bank capitalization on lending and interest rates The table shows the second step of two-step GMM regression results of a simultaneous equations estimation regressing the quarterly change in lending to the non-financial private sector and the quarterly change in the average interest rate charged for these on control variables. The data range from 2008:Q1 to 2018:Q3. All variables are used at the bank-quarter level and defined in Panel B of Table 1. For the two-step GMM estimator, the first step estimates each equation via 2SLS using the first lag of the dependent variables as instruments, where a Fisher type unit root test based on the Phillips-Perron test rejects a unit root and a Wooldridge test rejects autocorrelation in panel data in all cases. A weight matrix is then calculated which is used in the second step of GMM. The dependent variables are taken to be endogenous to the system and treated as correlated with the disturbances in the system's equations. Capital requirement is shown as the cumulative average effect over the previous four quarters. Monetary policy is the level of the money market interest rate which is shown as the joint average effect over the current and the previous three four quarters and interacted with indicators variables which are one when the money market interest rate declines (Monetary Policy [loose]) and when it increases (Monetary Policy [tight]) from montht-3 to montht. Control variables are bank size, liquid assets, deposits share, RoA, included lagged by one quarter, and a dummy variable which is one in a quarter when a bank merges with another bank. In the table, columns (1) and (2), columns (3) and (4), and columns (5) and (6) are estimated simultaneously. The statistical significance of results is indicated by * = 10% level, ** = 5% level and *** = 1% level using standard errors clustered at the bank level. P-values are shown in parentheses below coefficient estimates.
All banks Low excess capital banks High excess capital banks (1) (2) (3) (4) (5) (6) Dependent variable ∆ lending ∆ interest rate ∆ lending ∆ interest rate ∆ lending ∆ interest rate Capital requirement -0.615* 0.003 -1.340** 0.002 0.297 0.004 (0.056) (0.765) (0.044) (0.915) (0.648) (0.822) Monetary policy [loose] -0.885 0.171*** -0.552 0.137*** -2.710** 0.122*** (0.119) (0.000) (0.655) (0.000) (0.015) (0.000) Monetary policy [tight] 1.441 0.745*** 1.836 0.753*** -0.334 0.625*** (0.417) (0.000) (0.649) (0.000) (0.925) (0.000) Capital requirement * MP [loose] 2.677 -0.086* 0.760 -0.154** -7.177 -0.328** (0.105) (0.058) (0.763) (0.036) (0.207) (0.045) Capital requirement * MP [tight] -10.08 -0.546** -12.61 -0.597 -1.133 -1.146** (0.285) (0.039) (0.531) (0.307) (0.953) (0.040) Bank control variables yes yes yes yes yes yes Bank fixed effects yes yes yes yes yes yes Macro control variables yes yes yes yes yes yes Observations 5,123 5,123 1,168 1,168 1,344 1,344 Number of banks 170 170 92 92 80 80 R-squared 0.140 0.263 0.218 0.322 0.157 0.238

25
Table 5 confirms our previous findings on the transmission of policy changes. Changes
in capital requirements are negatively related to the loan growth of banks with lower levels of
excess capital, and supranational monetary policy changes are positively related to corporate
lending rates. As to the interaction between changes in capital requirements and monetary
policy, we observe that an increase in capital requirements has countervailing effects to the
transmission of monetary policy changes on lending rates. Both coefficients for our interaction
terms are opposite to the positive association of monetary policy to banks’ interest rates (column
2). This implies that a decreasing (increasing) policy rate is associated with lower (higher)
corporate lending rates; however, when capital requirements simultaneously increase
(decrease) this relationship is attenuated. This result is largely confirmed, including where we
split banks into those with high and with low levels of excess capital, with the exception of the
coefficient of the interaction term between changes in capital requirement and loose monetary
policy for banks with low excess capital. It is negative but not statistically significant.
In sum, changes in the supranational monetary policy stance are related to changes in
corporate lending rates in the same direction, irrespective of bank health. However,
simultaneous but opposite changes in capital requirements might attenuate this transmission.
While this might be desirable from a policy perspective when monetary policy is tightened, it
might also counteract monetary policy intentions when the policy is accommodative.
Importantly, changes in capital requirements are additionally related to the loan growth of
weaker banks. This suggests that over the period after the financial crisis, when monetary policy
was largely accommodative and bank capital requirements simultaneously were increased,
banks’ lending interest rates might have decreased to a smaller extent than intended by
policymakers, and the loan growth of weaker banks may have actually decreased.

26
5 Conclusion
This paper explores the transmission of bank capital requirements and supranational
monetary policy and their joint effect on banks’ lending to the non-financial corporate sector in
the euro area and corresponding lending rates in the short-term. Our results suggest that for
weakly capitalized banks in the short-term increases in capital requirements are negatively
associated with changes in loan growth but not with lending rates. The relationship is
economically significant as an increase in the regulatory capital requirement of 1 percentage
point is associated with a 1.7 percent decrease in euro area bank lending of weaker banks. This
effect is only observable for banks operating close to the regulatory required level of capital,
and it disappears for excess capital to total assets ratios of around 6 percent. Our results do not
show a relationship between capital requirements and corporate lending rates. These findings
suggest that externalities of changes in capital requirements in the short-term hinge on the level
and the distribution of excess bank capitalization in a banking system.
Our sample period of 2008 to 2018 is predominantly characterized by increases in
capital requirements. At the same time, the euro area monetary policy stance was mostly
accommodative. When examining the interaction between the two policies, we observe that
increases in capital requirements attenuate the general effects of monetary policy on interest
rates. Accordingly, our results suggest that the bank lending channel was exposed to these two
forces in the opposite direction, potentially implying reduced effectiveness. This finding
suggests that a careful and elaborate mutual consideration of monetary policy and bank capital
regulation is crucial for ensuring the policies’ efficacy.
Overall, our results further may help policymakers to gauge ex ante the domestic as well
as international implications of policy actions as well as to identify and gauge possible
undesired short-term externalities. Besides, the results show the need for monitoring not only
the policy actions of international financially integrated countries, but also certain features of
the respective foreign banking systems and its main lenders. Last but not least, this study

27
provides crucial insights for analyses of the aggregate effects of policy changes (which are
beyond the scope of our analysis). Future work exploring aggregate policy effects should
account for how determining features, such as banks’ excess capitalization, and their
distribution is related to the distribution of, for instance, lending volumes.

28
References
Aiyar, S., C. Calomiris, and T. Wieladek (2014). Does macro-prudential regulation leak? Evidence from a UK policy experiment. Journal of Money, Credit and Banking 46(1), 181-214.
Aiyar, S., C. Calomiris, and T. Wieladek (2016). How does credit supply respond to monetary policy and bank minimum capital requirements? European Economic Review 82, 142-165.
Behn, M., R. Haselmann, and P. Wachtel (2016). Procyclical capital regulation and lending. Journal of Finance 71(2), 919-956.
Bernanke, B., and A. Blinder (1992). The federal funds rate and the channels of monetary transmission. American Economic Review 82(4), 901-921.
Bridges, J., D. Gregory, M. Nielsen, S. Pezzini, A. Radia, and M. Spaltro (2015). The impact of higher capital requirements on bank lending. Bank of England Working Paper No. 486.
Buch, C., and E. Prieto (2014). Do Better Capitalized Banks Lend Less? Long-Run Panel Evidence from Germany. International Finance 17(1),1-23.
Budnik, K., and P. Bochmann (2017). Capital and liquidity buffers and the resilience of the banking systems in the euro area. ECB Working Paper No. 2120.
Budnik, K., and J. Kleibl (2018). Macroprudential regulation in the European Union in 1995-2014: introducing a new data set on policy actions of a macroprudential nature. ECB Working Paper No 2123.
De Jonghe, O., H. Dewachter, and S. Ongena (2016). Bank capital (requirements) and credit supply: Evidence from pillar 2 decisions. National Bank of Belgium Working Paper 303.
De Marco, F., and T. Wieladek (2016). The real effects of capital requirements and monetary policy : Evidence from the United Kingdom, available: https://papers.ssrn.com/sol3/papers.cfm?abstract_id=2780373.
Eickmeier, S., Kolb, B., and E. Prieto (2018). Macroeconomic effects of bank capital regulation. Bundesbank Discussion Paper No 44/2018.
Francis, W. B., and M. Osborne (2012). Capital requirements and bank behavior in the UK: Are there lessons for international capital standards? Journal of Banking & Finance 36(3), 803-816.
Gambacorta, L. (2009). Monetary policy and the risk-taking channel. BIS Quarterly Review, December 2009, 43-53.
Gambacorta, L., and P. Mistrulli (2004). Does bank capital affect lending behavior? Journal of Financial Intermediation 13, 436-457.
Gropp, R., and F. Heider (2010). The determinants of bank capital structure. Review of Finance 14(4), 587-622.

29
Gropp, R., T. Mosk, S. Ongena, and C. Wix (2018). Bank response to higher capital requirements: Evidence from a quasi-natural experiment. The Review of Financial Studies 32(1), 266-299.
Hartmann, P., and F. Smets (2018). The first twenty years of the European Central Bank: monetary policy. ECB Working Paper Series No 2219.
Imbierowicz, B., J. Kragh, and J. Rangvid (2018). Time-varying capital requirements and disclosure rules: Effects on capitalization and lending decisions. Journal of Money, Credit and Banking 50(4), 573-602.
Jiménez, G., S. Ongena, J. Peydro, and J. Saurina (2012). Credit supply and monetary policy: Identifying the bank balance-sheet channel with loan applications. American Economic Review 102(5), 2301-2326.
Jiménez, G., S. Ongena, J. Peydro, and J. Saurina (2017). Macroprudential policy, countercyclical bank capital buffers and credit supply: Evidence from the Spanish dynamic provisioning experiments. Journal of Political Economy 125(6), 2126-2177.
Kashyap, A.K. and J.C. Stein (1994). The impact of monetary policy on bank balance sheets, NBER Working Paper No. 4821.
Kashyap, A.K. and J.C. Stein (2000). What do a million observations on banks say about the transmission of monetary policy? American Economic Review 90(3), 407-428.
Krippner, L. (2013). Measuring the stance of monetary policy in zero lower bound environments. Economics Letters 118: 135-138.
Maddaloni, A. and J. Peydro (2013). Monetary policy, macroprudential policy, and banking stability: Evidence from the euro area. International Journal of Central Banking 9(1), 121-169.
Takáts, E. and J. Temesvary (2019). How does the interaction of macroprudential and monetary policies affect cross-border bank lending? BIS Working Paper No. 782.
Vandenbussche, J., U. Vogel and E. Detragiache (2015). Macroprudential policies and housing prices: A new database and empirical evidence for central, eastern, and southeastern Europe. Journal of Money, Credit and Banking 47(S1): 343-377.
Wu, J, and F. Xia (2016). Measuring the macroeconomic impact of monetary policy at the zero lower bound. Journal of Money, Credit and Banking 48: 253-291.