Financial System Liquidity, Asset Prices and Monetary Policy
Upload
macropru-readerCategory
view
404download
0
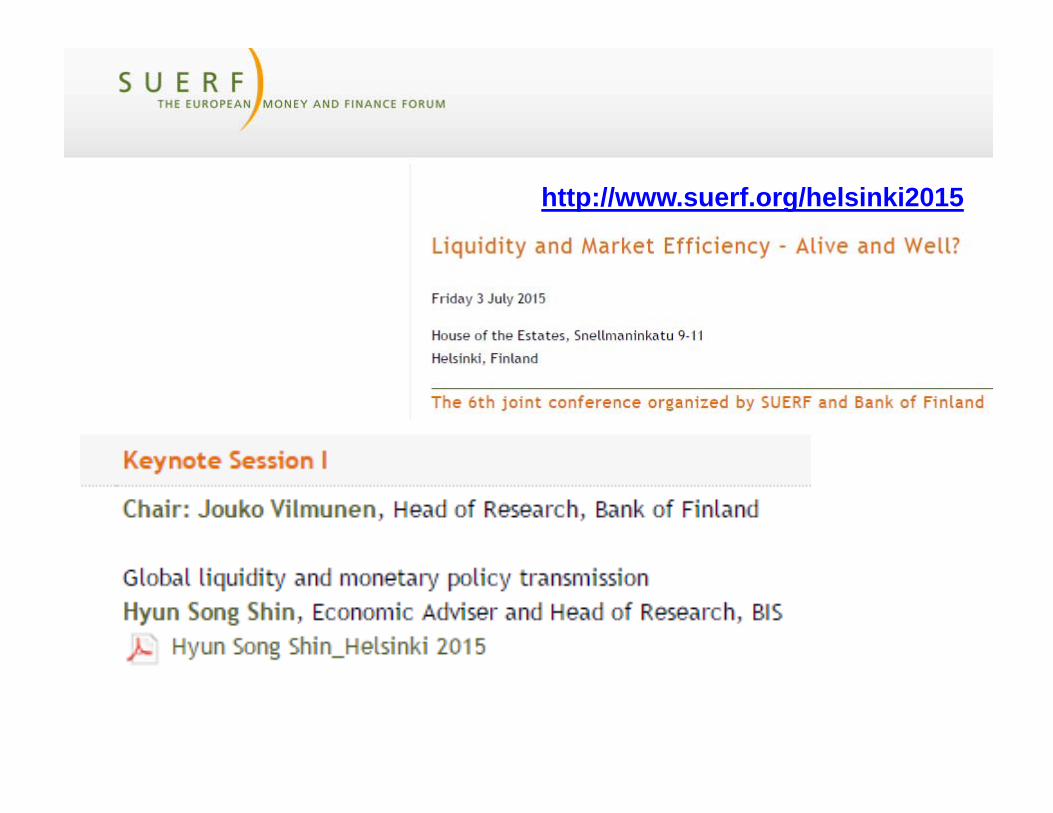
Global liquidity and
monetary policy transmission
Hyun Song Shin*
Bank for International Settlements
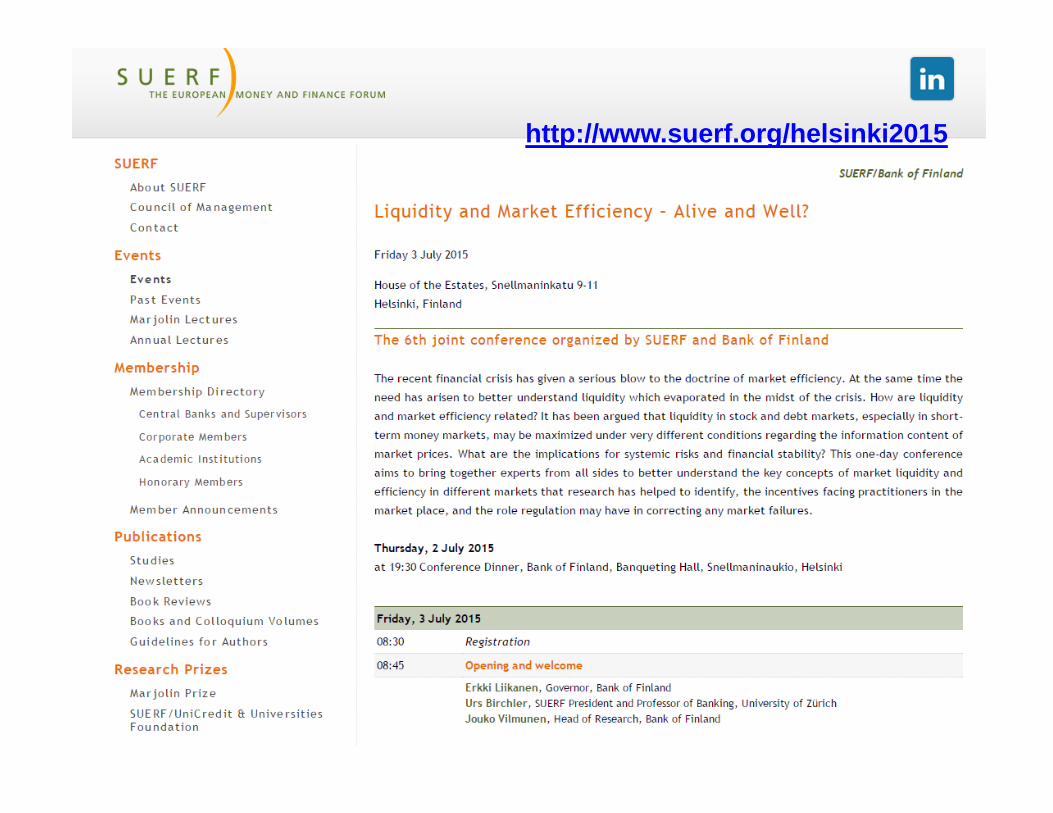
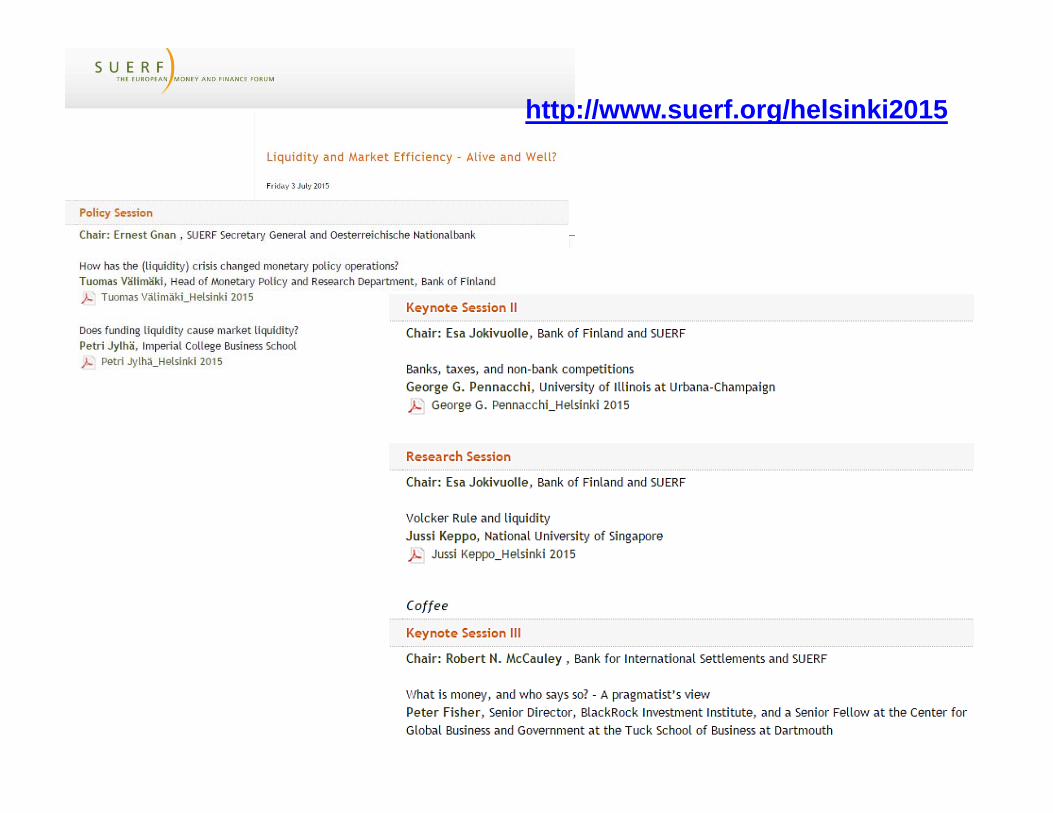
Liquidity and Market Efficiency – Alive and Well?
6th joint conference organised by SUERF and Bank of Finland
Helsinki, 3 July 2015
*Views expressed here are mine, not necessarily those of the BIS
http://www.suerf.org/docx/l_8e296a067a37563370ded05f5a3bf3ec_1919_suerf.pdf
2
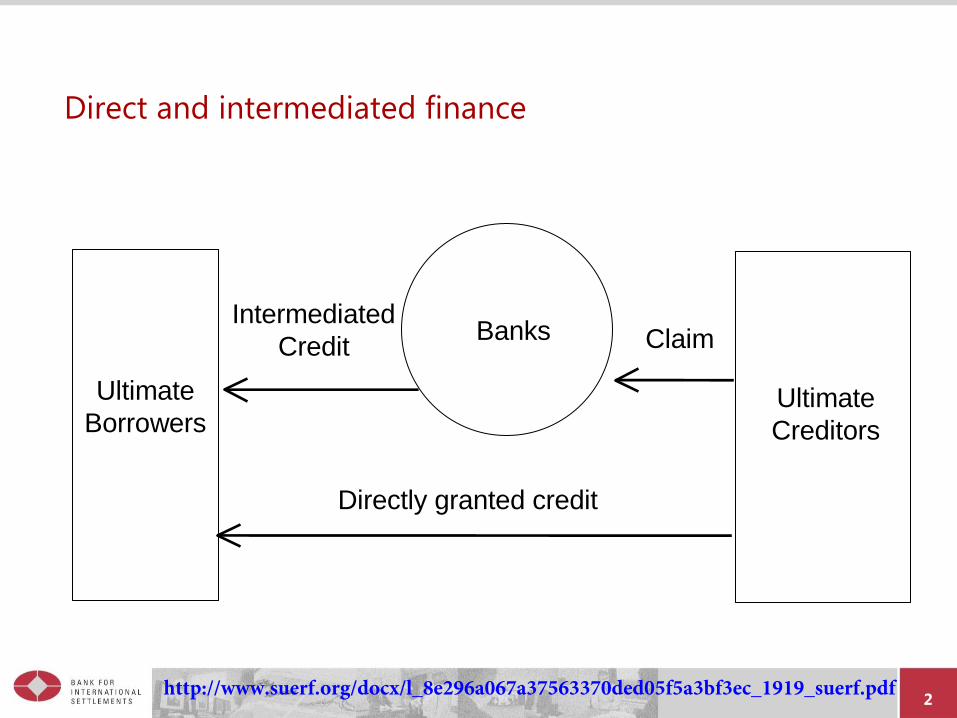
Direct and intermediated finance
Banks
Ultimate
Creditors
Ultimate
Borrowers
Intermediated
Credit Claim
Directly granted credit
http://www.suerf.org/docx/l_8e296a067a37563370ded05f5a3bf3ec_1919_suerf.pdf
4
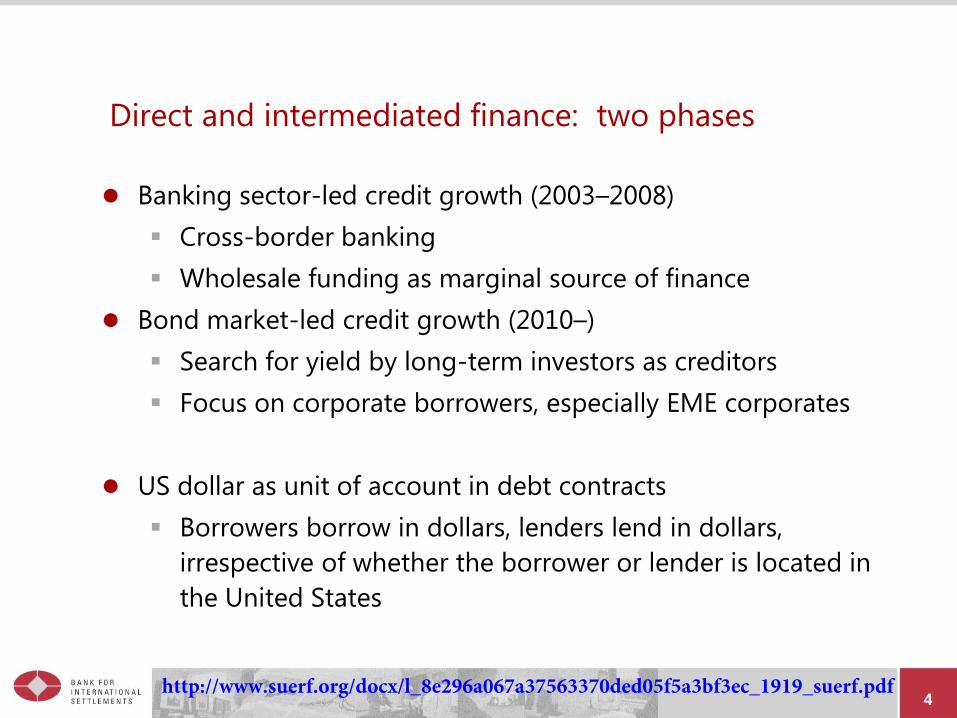
Direct and intermediated finance: two phases
Banking sector-led credit growth (2003–2008)
Cross-border banking
Wholesale funding as marginal source of finance
Bond market-led credit growth (2010–)
Search for yield by long-term investors as creditors
Focus on corporate borrowers, especially EME corporates
US dollar as unit of account in debt contracts
Borrowers borrow in dollars, lenders lend in dollars,
irrespective of whether the borrower or lender is located in
the United States
http://www.suerf.org/docx/l_8e296a067a37563370ded05f5a3bf3ec_1919_suerf.pdf
5
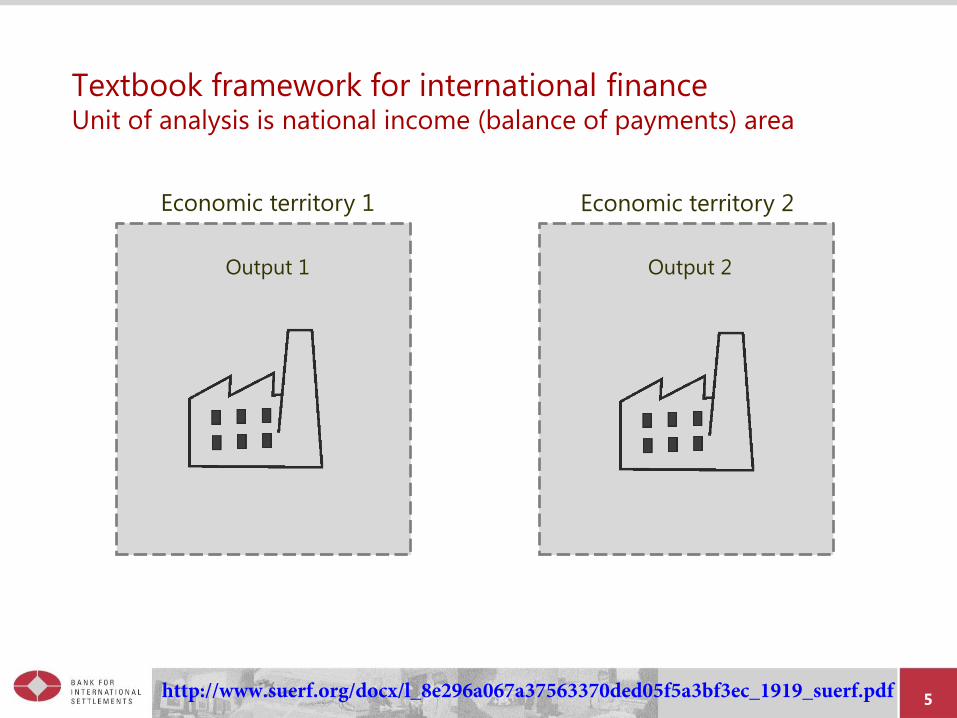
Textbook framework for international finance Unit of analysis is national income (balance of payments) area
Economic territory 1 Economic territory 2
Output 1 Output 2
http://www.suerf.org/docx/l_8e296a067a37563370ded05f5a3bf3ec_1919_suerf.pdf
6
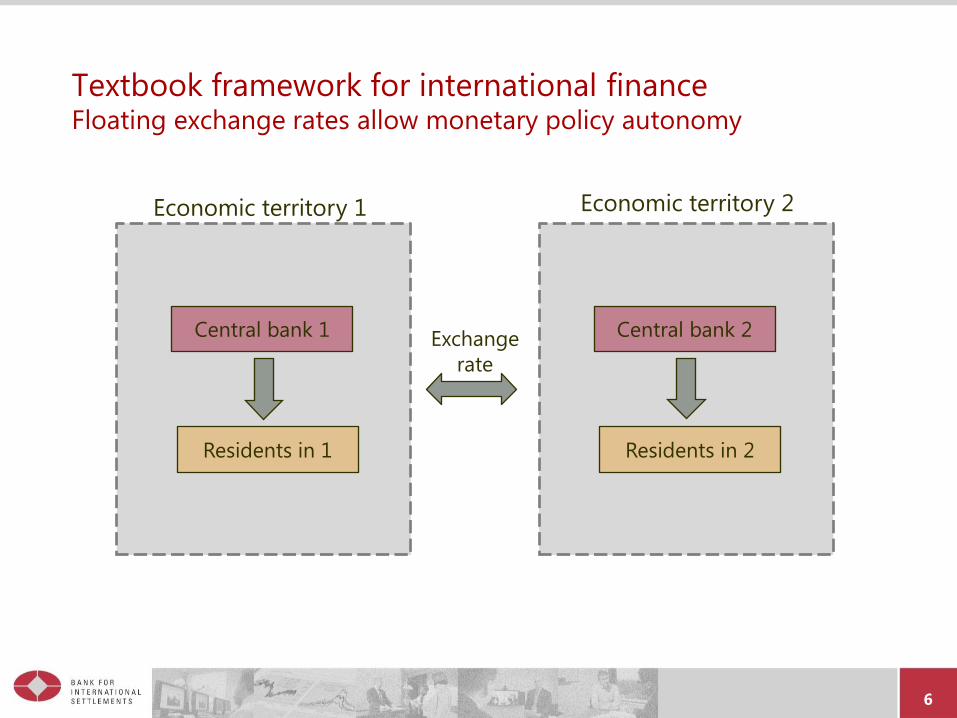
Textbook framework for international finance Floating exchange rates allow monetary policy autonomy
Central bank 1 Central bank 2
Residents in 1 Residents in 2
Exchange
rate
Economic territory 1 Economic territory 2
The US dollar and the waxing and waning of
cross-border banking
http://www.suerf.org/docx/l_8e296a067a37563370ded05f5a3bf3ec_1919_suerf.pdf
8
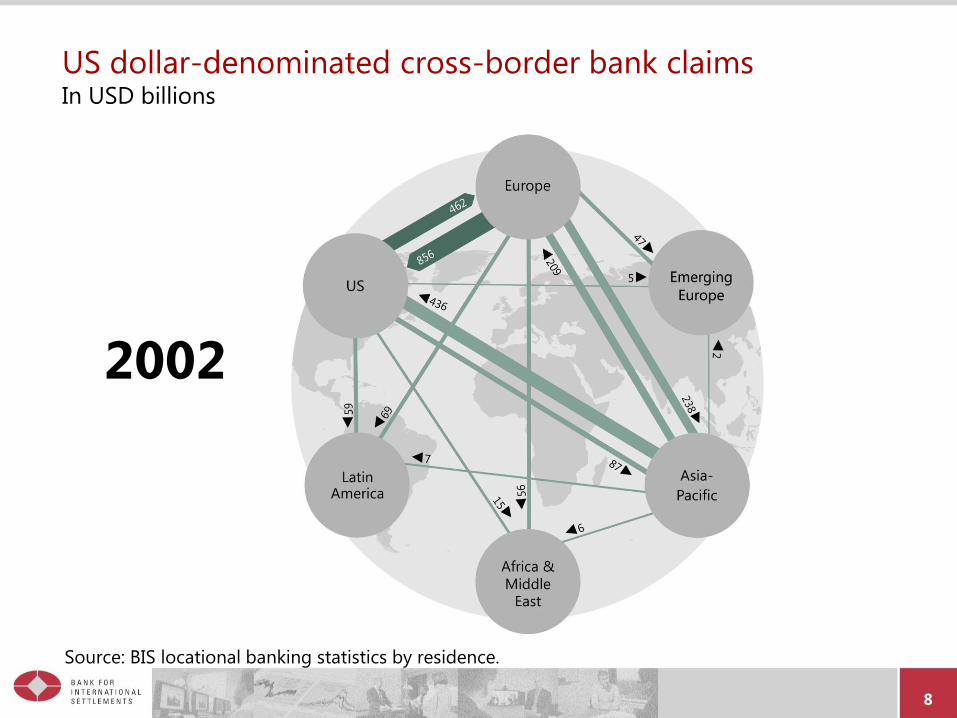
US dollar-denominated cross-border bank claims In USD billions
2002
Source: BIS locational banking statistics by residence.
-
9
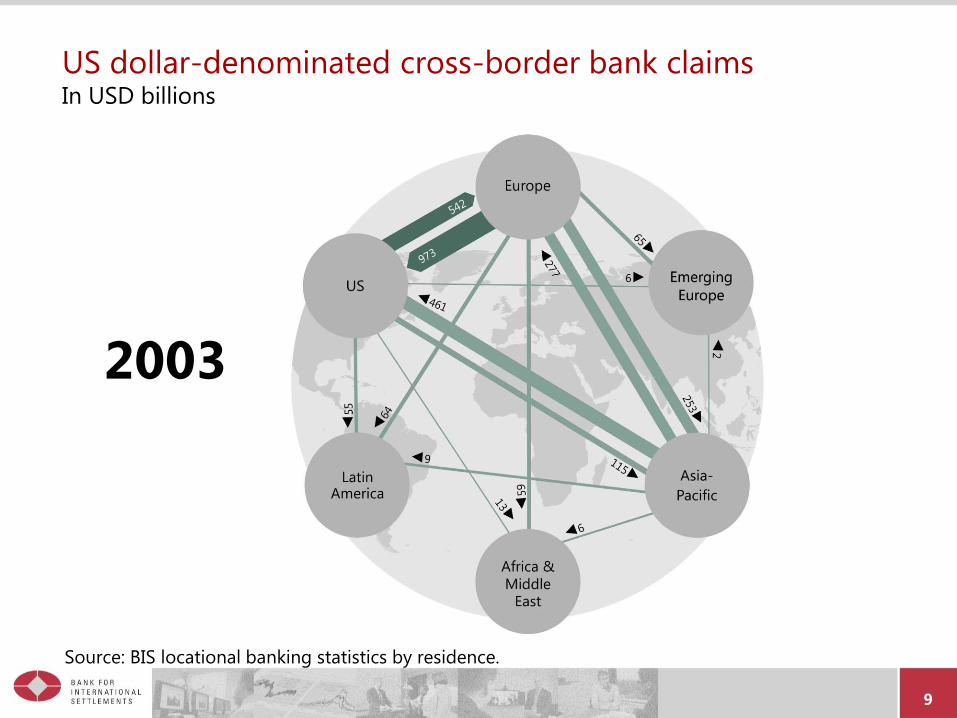
US dollar-denominated cross-border bank claims In USD billions
2003
Source: BIS locational banking statistics by residence.
10
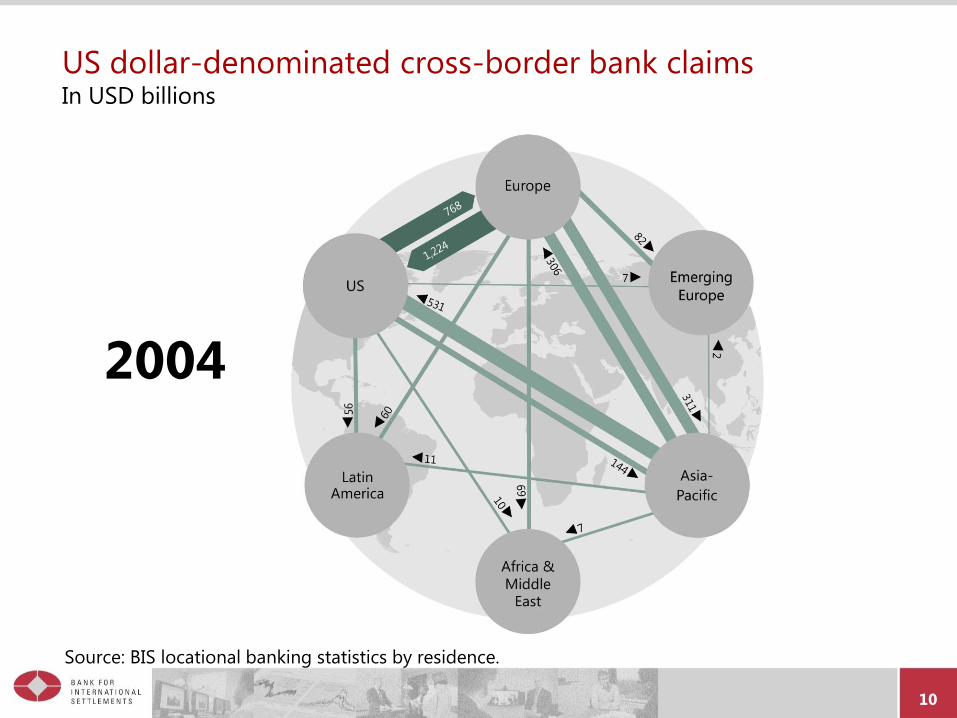
US dollar-denominated cross-border bank claims In USD billions
2004
Source: BIS locational banking statistics by residence.
11
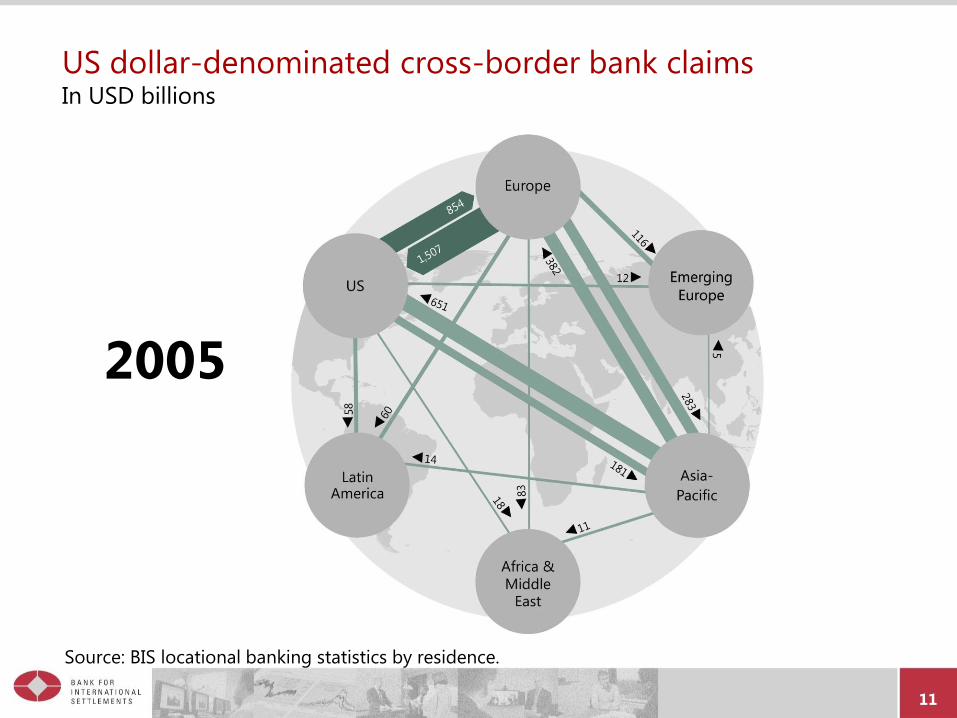
US dollar-denominated cross-border bank claims In USD billions
2005
Source: BIS locational banking statistics by residence.
12
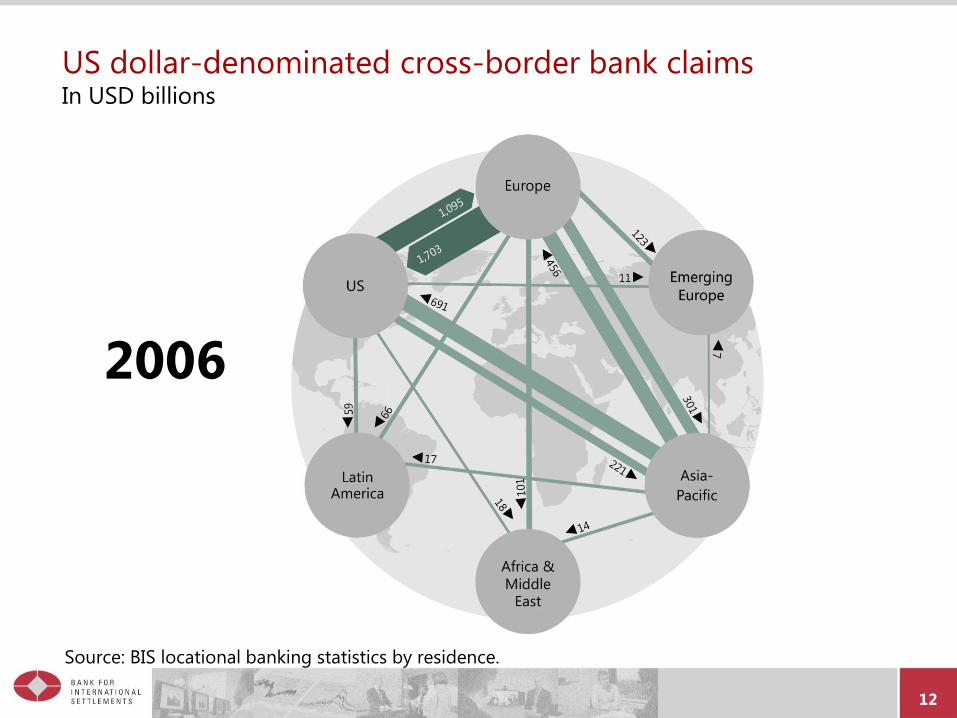
US dollar-denominated cross-border bank claims In USD billions
2006
Source: BIS locational banking statistics by residence.

13
US dollar-denominated cross-border bank claims In USD billions
2007
Source: BIS locational banking statistics by residence.
14
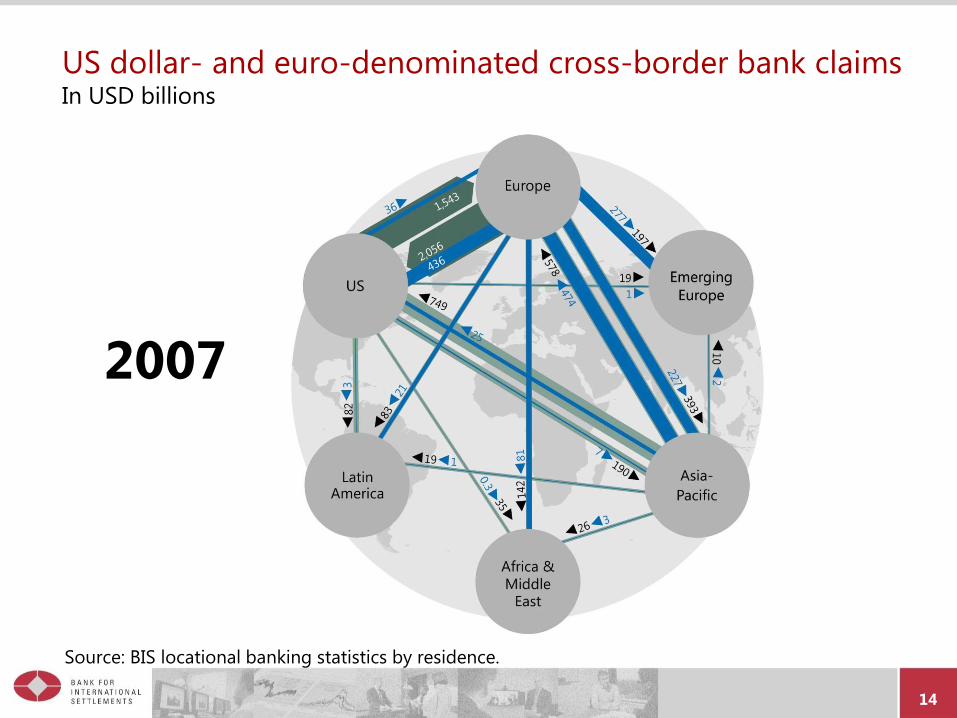
US dollar- and euro-denominated cross-border bank claims In USD billions
2007
Source: BIS locational banking statistics by residence.
15
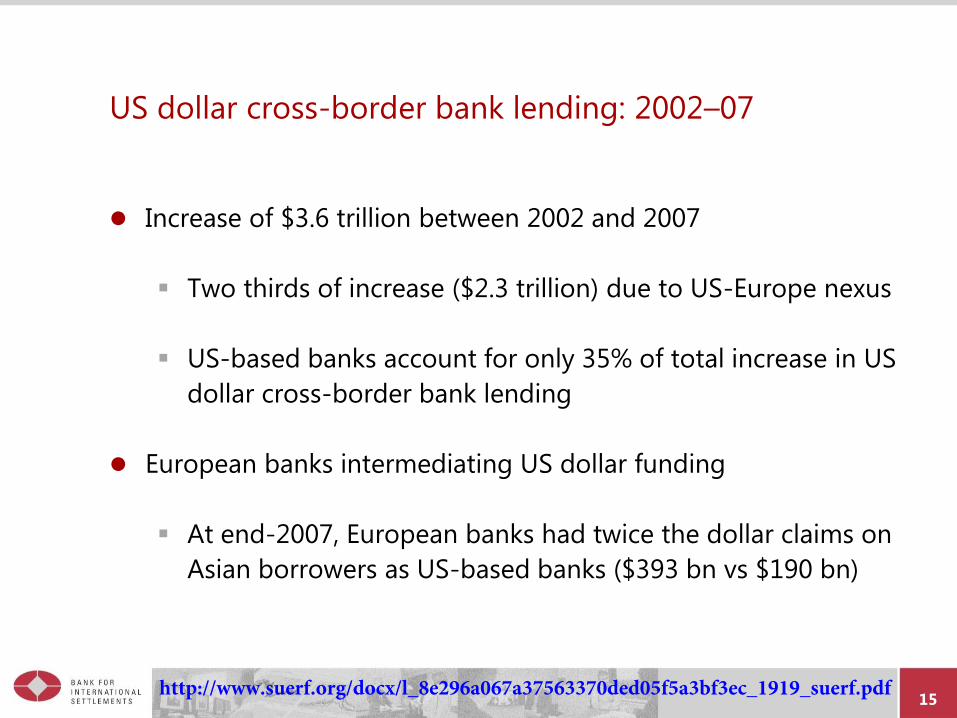
US dollar cross-border bank lending: 2002–07
Increase of $3.6 trillion between 2002 and 2007
Two thirds of increase ($2.3 trillion) due to US-Europe nexus
US-based banks account for only 35% of total increase in US
dollar cross-border bank lending
European banks intermediating US dollar funding
At end-2007, European banks had twice the dollar claims on
Asian borrowers as US-based banks ($393 bn vs $190 bn)
http://www.suerf.org/docx/l_8e296a067a37563370ded05f5a3bf3ec_1919_suerf.pdf
16
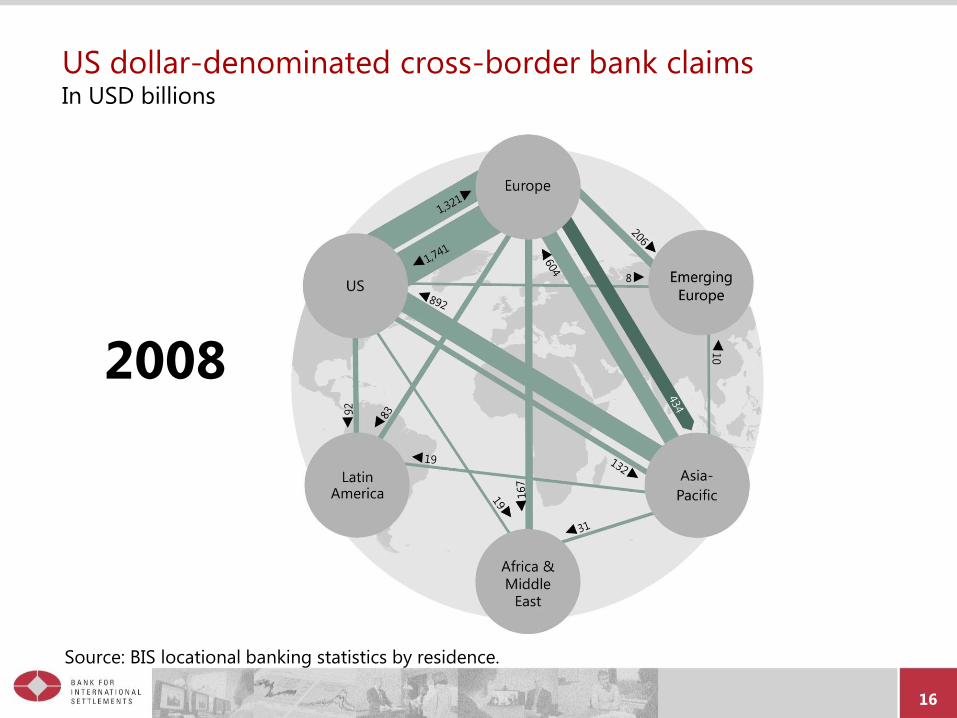
2008
US dollar-denominated cross-border bank claims In USD billions
Source: BIS locational banking statistics by residence.

17
2009
US dollar-denominated cross-border bank claims In USD billions
Source: BIS locational banking statistics by residence.

18
2010
US dollar-denominated cross-border bank claims In USD billions
Source: BIS locational banking statistics by residence.
19
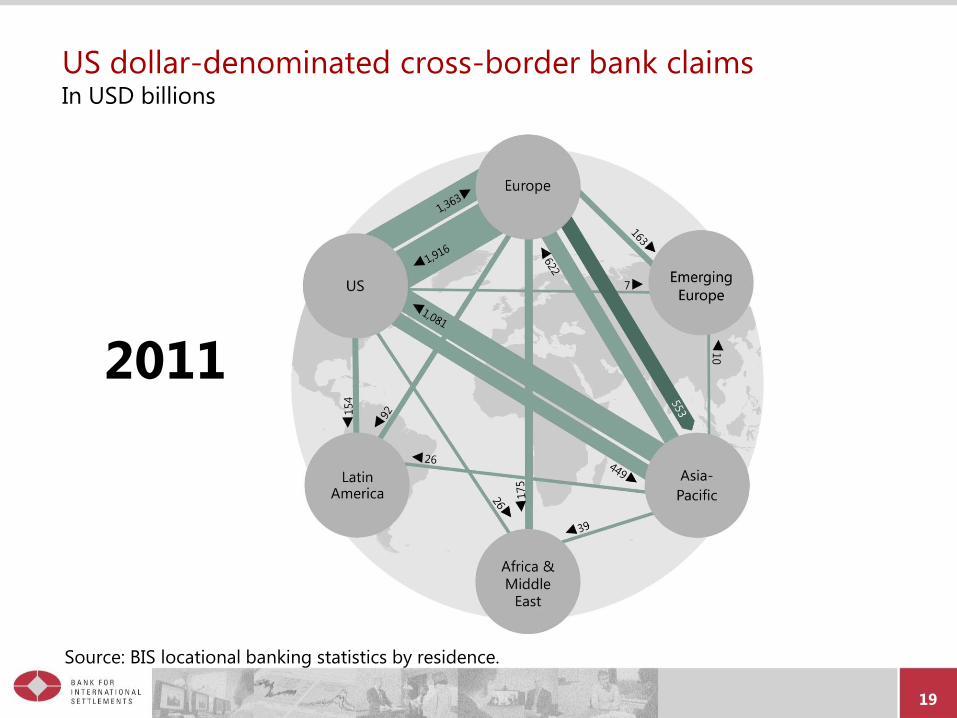
2011
US dollar-denominated cross-border bank claims In USD billions
Source: BIS locational banking statistics by residence.

20
2012
US dollar-denominated cross-border bank claims In USD billions
Source: BIS locational banking statistics by residence.

21
2013
US dollar-denominated cross-border bank claims In USD billions
Source: BIS locational banking statistics by residence.

22
2014
US dollar-denominated cross-border bank claims In USD billions
Source: BIS locational banking statistics by residence.
Currency denomination does not follow
the national income boundary:
the case of non-banks
http://www.suerf.org/docx/l_8e296a067a37563370ded05f5a3bf3ec_1919_suerf.pdf
24
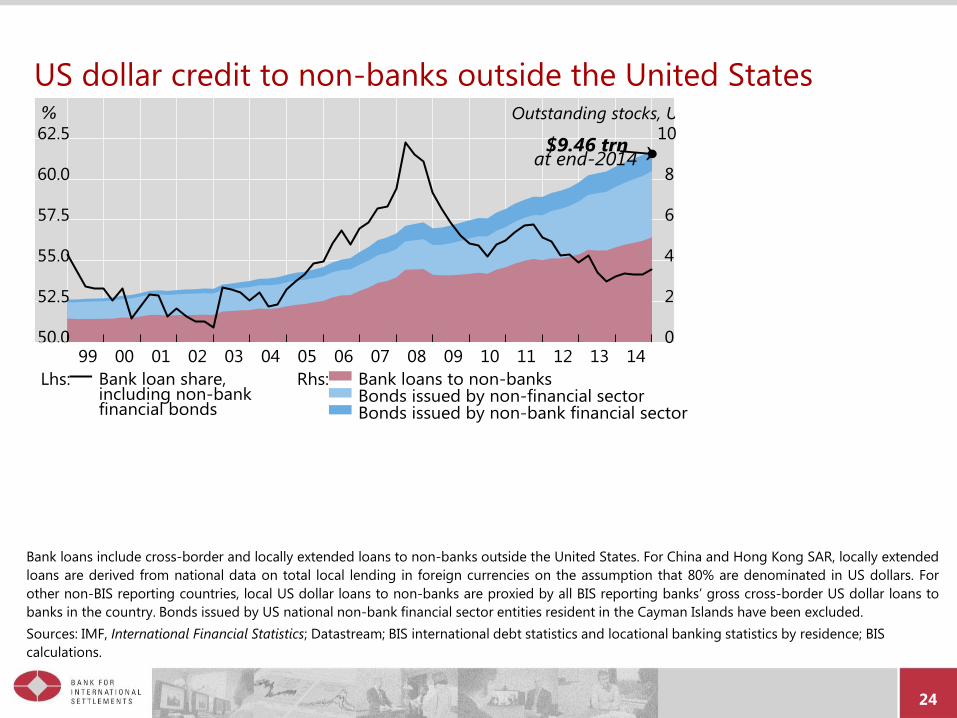
US dollar credit to non-banks outside the United States
Bank loans include cross-border and locally extended loans to non-banks outside the United States. For China and Hong Kong SAR, locally extended
loans are derived from national data on total local lending in foreign currencies on the assumption that 80% are denominated in US dollars. For
other non-BIS reporting countries, local US dollar loans to non-banks are proxied by all BIS reporting banks’ gross cross-border US dollar loans to
banks in the country. Bonds issued by US national non-bank financial sector entities resident in the Cayman Islands have been excluded.
Sources: IMF, International Financial Statistics; Datastream; BIS international debt statistics and locational banking statistics by residence; BIS
calculations.
25
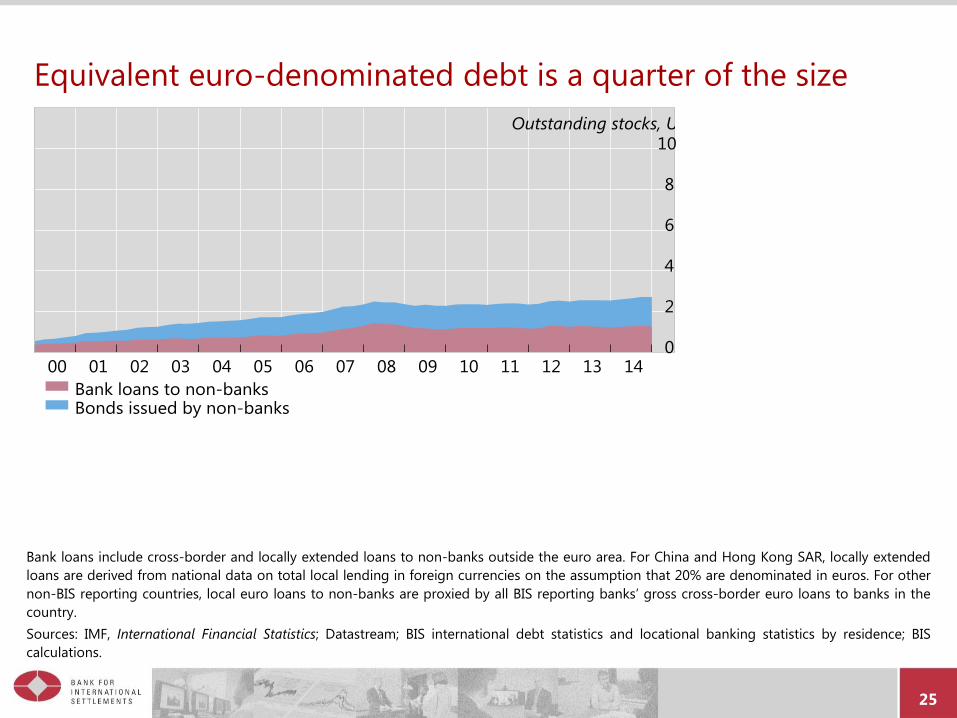
Equivalent euro-denominated debt is a quarter of the size
Bank loans include cross-border and locally extended loans to non-banks outside the euro area. For China and Hong Kong SAR, locally extended
loans are derived from national data on total local lending in foreign currencies on the assumption that 20% are denominated in euros. For other
non-BIS reporting countries, local euro loans to non-banks are proxied by all BIS reporting banks’ gross cross-border euro loans to banks in the
country.
Sources: IMF, International Financial Statistics; Datastream; BIS international debt statistics and locational banking statistics by residence; BIS
calculations.
26
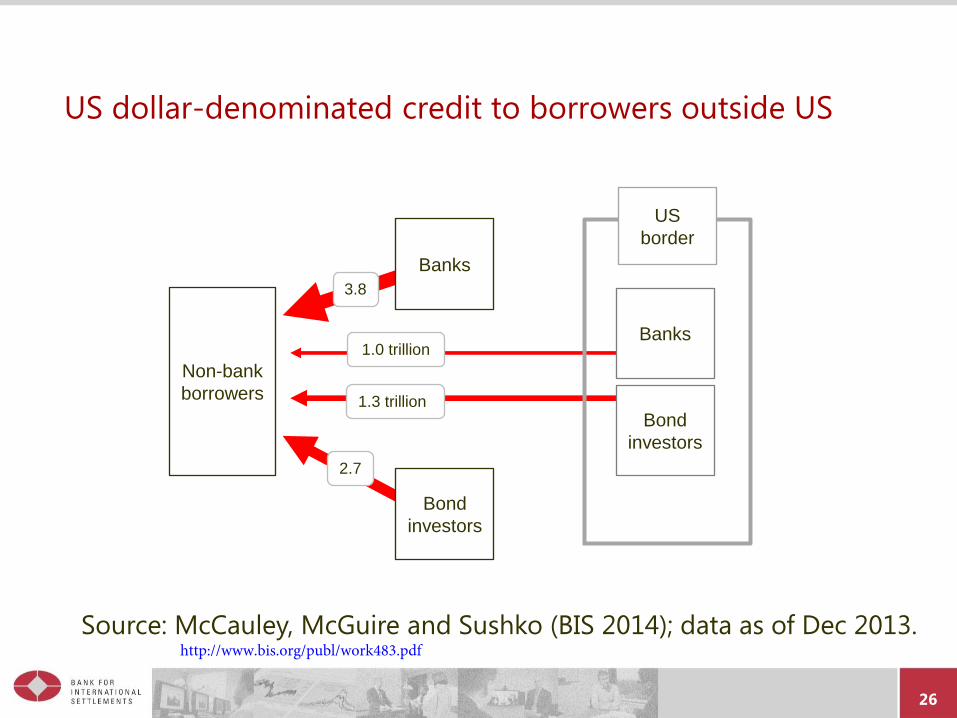
US dollar-denominated credit to borrowers outside US
US
border
Banks
Bond
investors
Banks
Bond
investors
Non-bank
borrowers
3.8
2.7
1.0 trillion
1.3 trillion
Source: McCauley, McGuire and Sushko (BIS 2014); data as of Dec 2013. http://www.bis.org/publ/work483.pdf
27
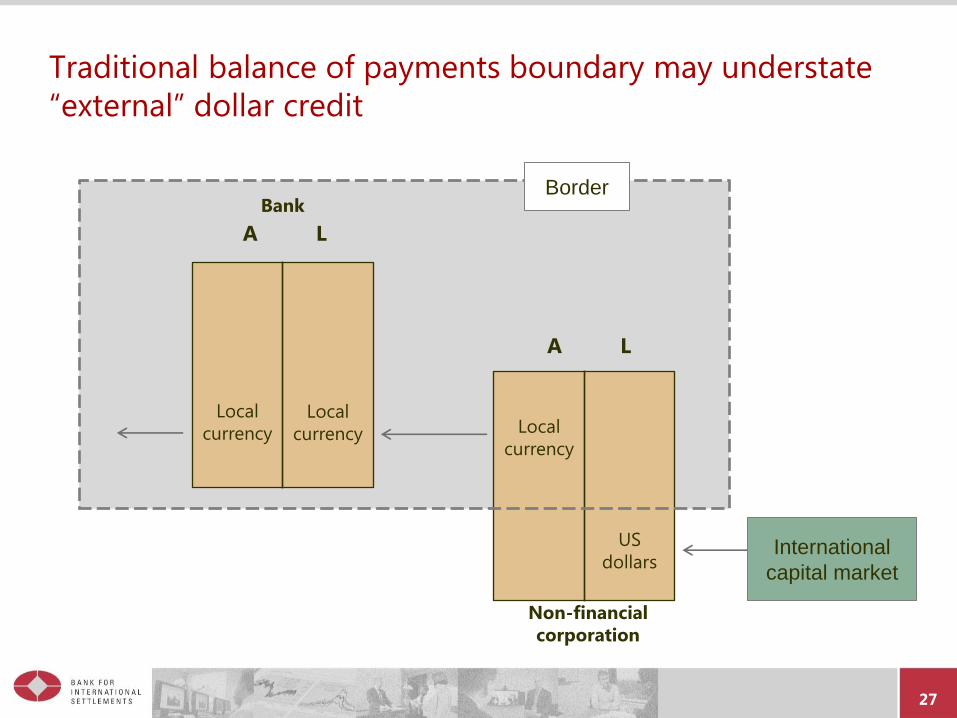
Traditional balance of payments boundary may understate
“external” dollar credit
A L
A L
Local
currency
Local
currency Local
currency
US
dollars
Bank
Non-financial
corporation
Border
International
capital market
28
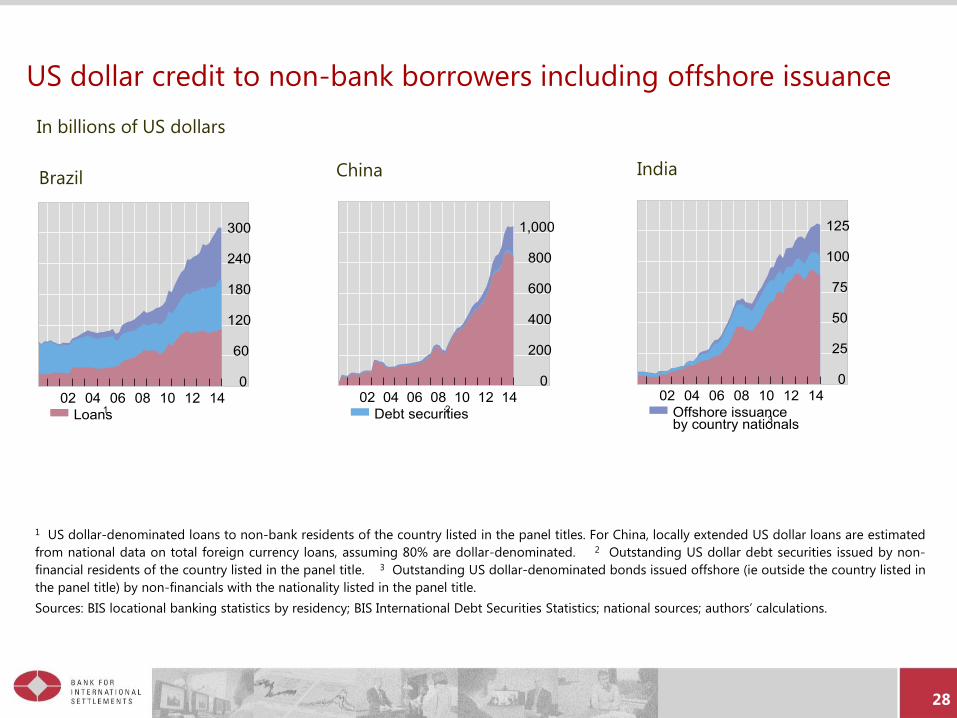
US dollar credit to non-bank borrowers including offshore issuance
1 US dollar-denominated loans to non-bank residents of the country listed in the panel titles. For China, locally extended US dollar loans are estimated
from national data on total foreign currency loans, assuming 80% are dollar-denominated. 2 Outstanding US dollar debt securities issued by non-
financial residents of the country listed in the panel title. 3 Outstanding US dollar-denominated bonds issued offshore (ie outside the country listed in
the panel title) by non-financials with the nationality listed in the panel title.
Sources: BIS locational banking statistics by residency; BIS International Debt Securities Statistics; national sources; authors’ calculations.
Brazil China India
In billions of US dollars

29
US dollar credit to non-banks outside the United States
Bank loans include cross-border and locally extended loans to non-banks outside the United States. For China and Hong Kong SAR, locally extended
loans are derived from national data on total local lending in foreign currencies on the assumption that 80% are denominated in US dollars. For
other non-BIS reporting countries, local US dollar loans to non-banks are proxied by all BIS reporting banks’ gross cross-border US dollar loans to
banks in the country. Bonds issued by US national non-bank financial sector entities resident in the Cayman Islands have been excluded.
Sources: IMF, International Financial Statistics; Datastream; BIS international debt statistics and locational banking statistics by residence; BIS
calculations.
30
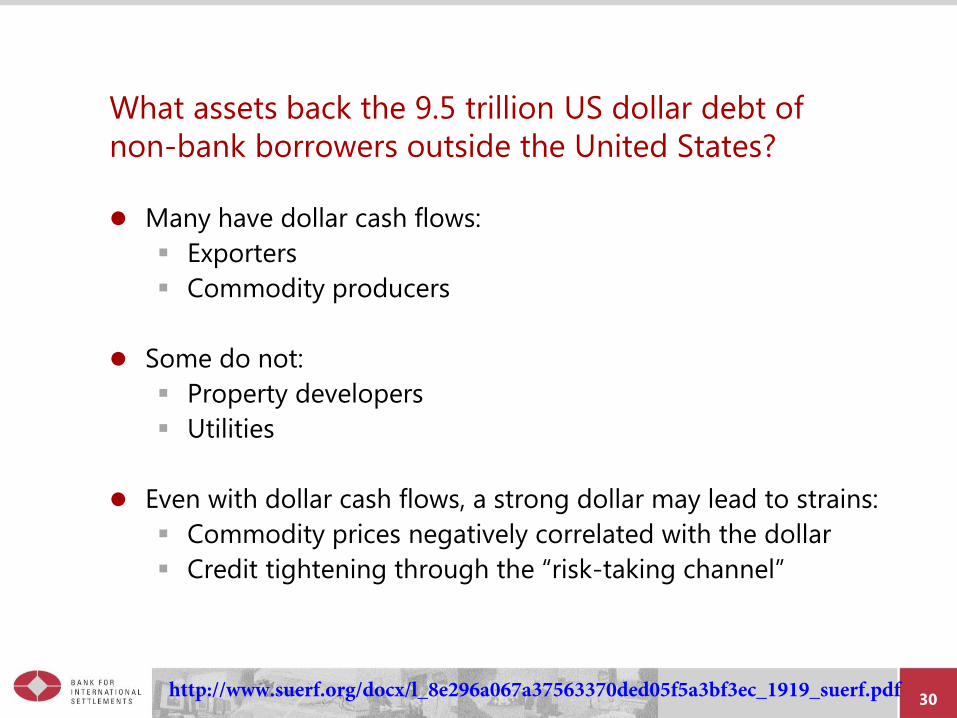
What assets back the 9.5 trillion US dollar debt of
non-bank borrowers outside the United States?
Many have dollar cash flows:
Exporters
Commodity producers
Some do not:
Property developers
Utilities
Even with dollar cash flows, a strong dollar may lead to strains:
Commodity prices negatively correlated with the dollar
Credit tightening through the “risk-taking channel”
http://www.suerf.org/docx/l_8e296a067a37563370ded05f5a3bf3ec_1919_suerf.pdf

31
Risk-taking channel and exchange rates
http://www.suerf.org/docx/l_8e296a067a37563370ded05f5a3bf3ec_1919_suerf.pdf
32
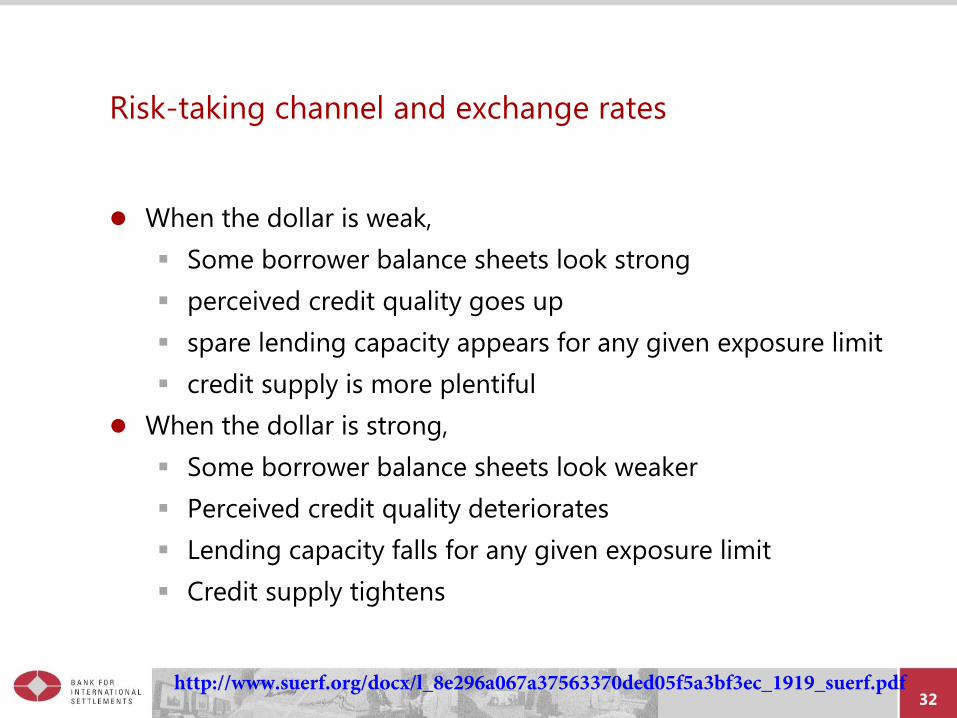
Risk-taking channel and exchange rates
When the dollar is weak,
Some borrower balance sheets look strong
perceived credit quality goes up
spare lending capacity appears for any given exposure limit
credit supply is more plentiful
When the dollar is strong,
Some borrower balance sheets look weaker
Perceived credit quality deteriorates
Lending capacity falls for any given exposure limit
Credit supply tightens
http://www.suerf.org/docx/l_8e296a067a37563370ded05f5a3bf3ec_1919_suerf.pdf
33
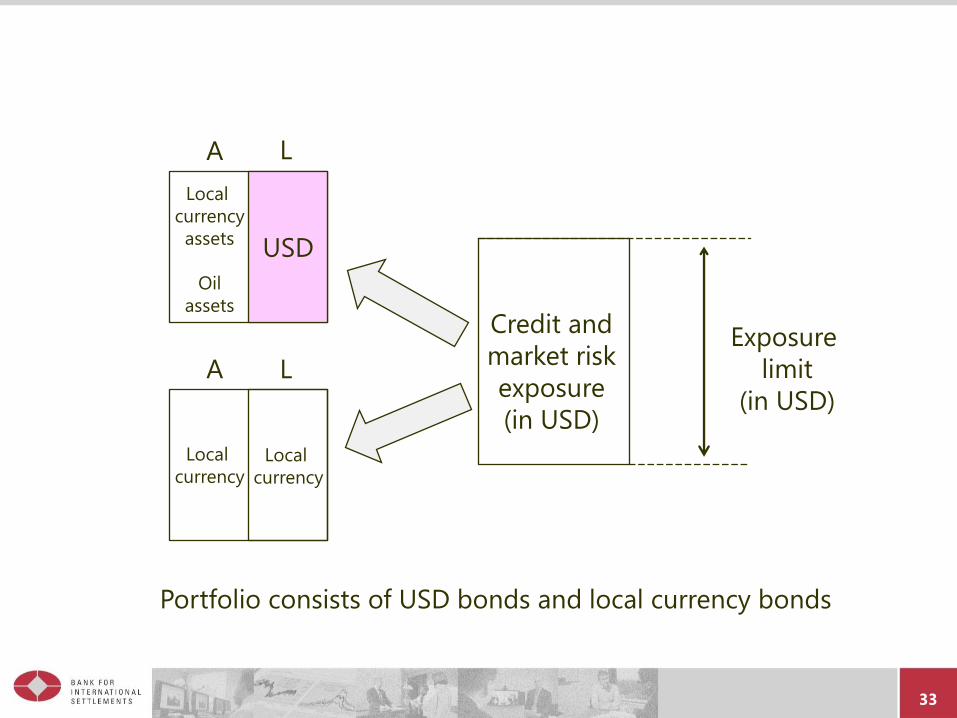
A L
Credit and
market risk
exposure
(in USD)
Exposure
limit
(in USD)
Local
currency Local
currency
Portfolio consists of USD bonds and local currency bonds
A L
USD
Local
currency
assets
Oil
assets
34
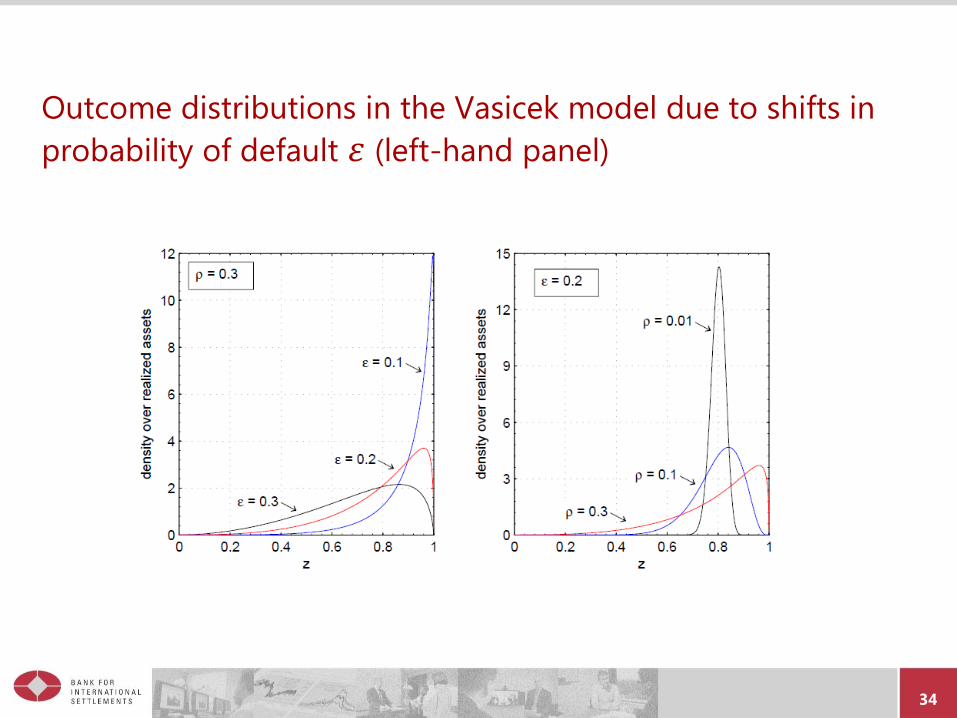
Outcome distributions in the Vasicek model due to shifts in
probability of default 𝜀 (left-hand panel)

35
A L
Credit and
market risk
exposure
(in USD)
Exposure
limit
(in USD)
Local
currency Local
currency
Portfolio consists of USD bonds and local currency bonds
A L
USD
Local
currency
assets
Oil
assets
36
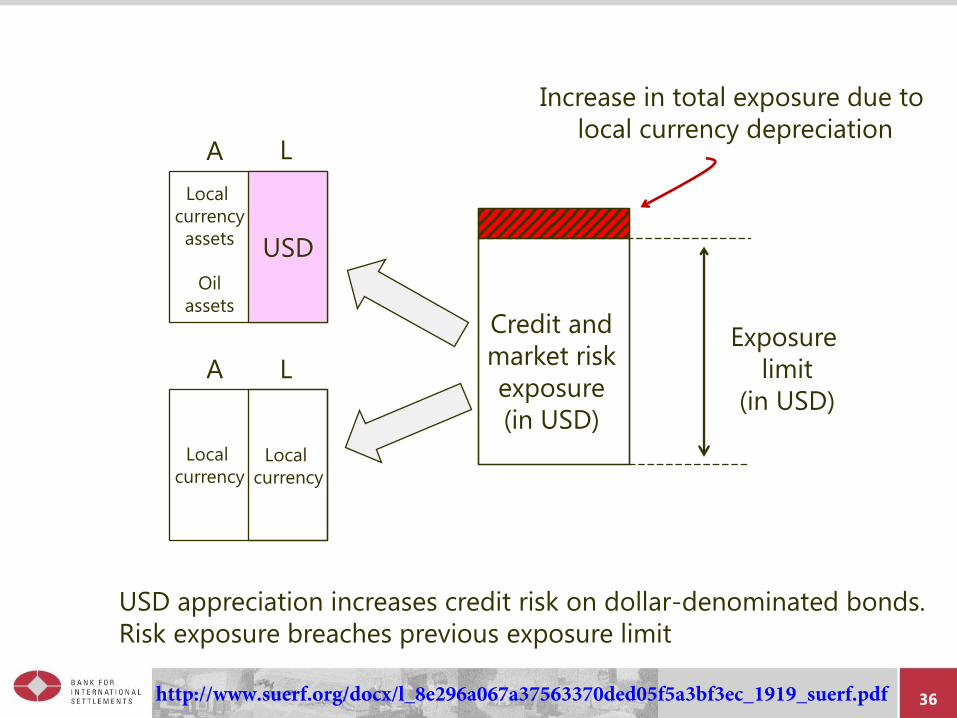
A L
Local
currency Local
currency
Increase in total exposure due to
local currency depreciation
USD appreciation increases credit risk on dollar-denominated bonds.
Risk exposure breaches previous exposure limit
A L
USD
Local
currency
assets
Oil
assets Credit and
market risk
exposure
(in USD)
Exposure
limit
(in USD)
http://www.suerf.org/docx/l_8e296a067a37563370ded05f5a3bf3ec_1919_suerf.pdf
37
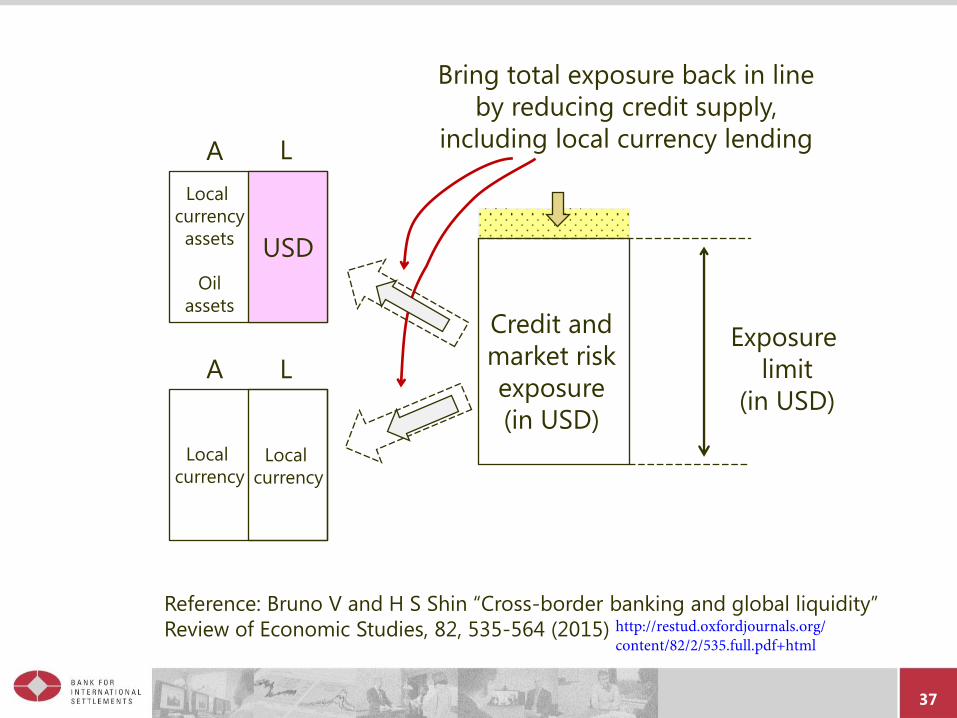
A L
Local
currency Local
currency
Bring total exposure back in line
by reducing credit supply,
including local currency lending
Reference: Bruno V and H S Shin “Cross-border banking and global liquidity”
Review of Economic Studies, 82, 535-564 (2015)
A L
USD
Local
currency
assets
Oil
assets Credit and
market risk
exposure
(in USD)
Exposure
limit
(in USD)
http://restud.oxfordjournals.org/content/82/2/535.full.pdf+html
38
Risk-taking channel and exchange rates
Even borrowers with no currency mismatch will see credit
conditions fluctuate with the exchange rate
It is the bilateral US dollar exchange rate, not the traded-
weighted effective exchange rate that matters
Reason is the outstanding stock of USD debt
http://www.suerf.org/docx/l_8e296a067a37563370ded05f5a3bf3ec_1919_suerf.pdf

39
Evidence from EME bond mutual funds
http://www.suerf.org/docx/l_8e296a067a37563370ded05f5a3bf3ec_1919_suerf.pdf
40
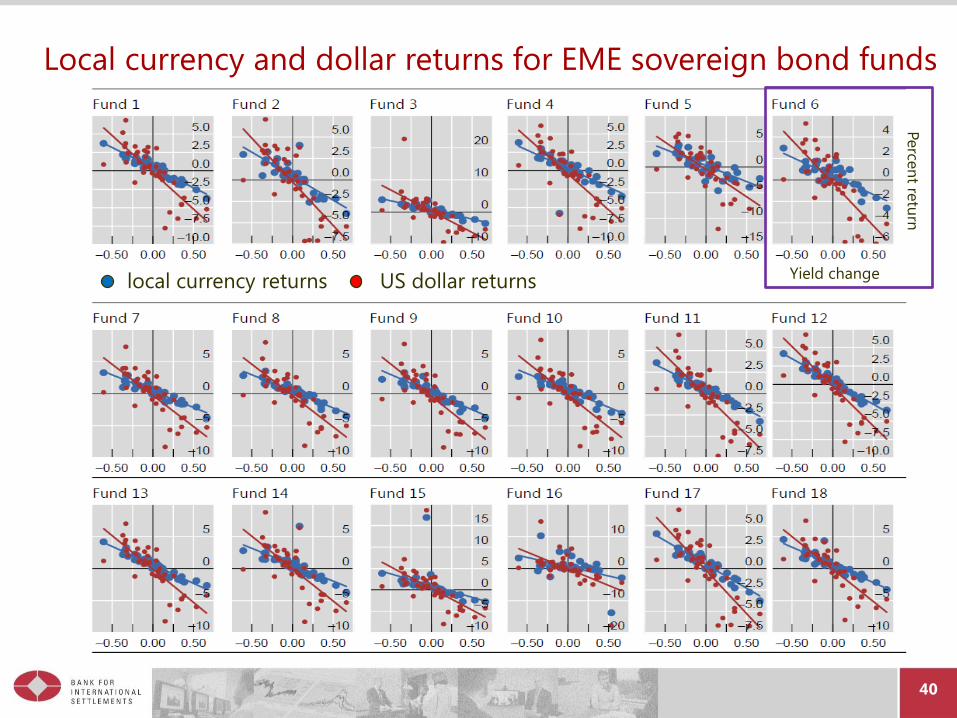
Local currency and dollar returns for EME sovereign bond funds
local currency returns US dollar returns Yield change
Perce
nt re
turn
41
Source: Shek, Shim and Shin (BIS working paper forthcoming)

42
Evidence from EME sovereign CDS spreads
http://www.suerf.org/docx/l_8e296a067a37563370ded05f5a3bf3ec_1919_suerf.pdf
43
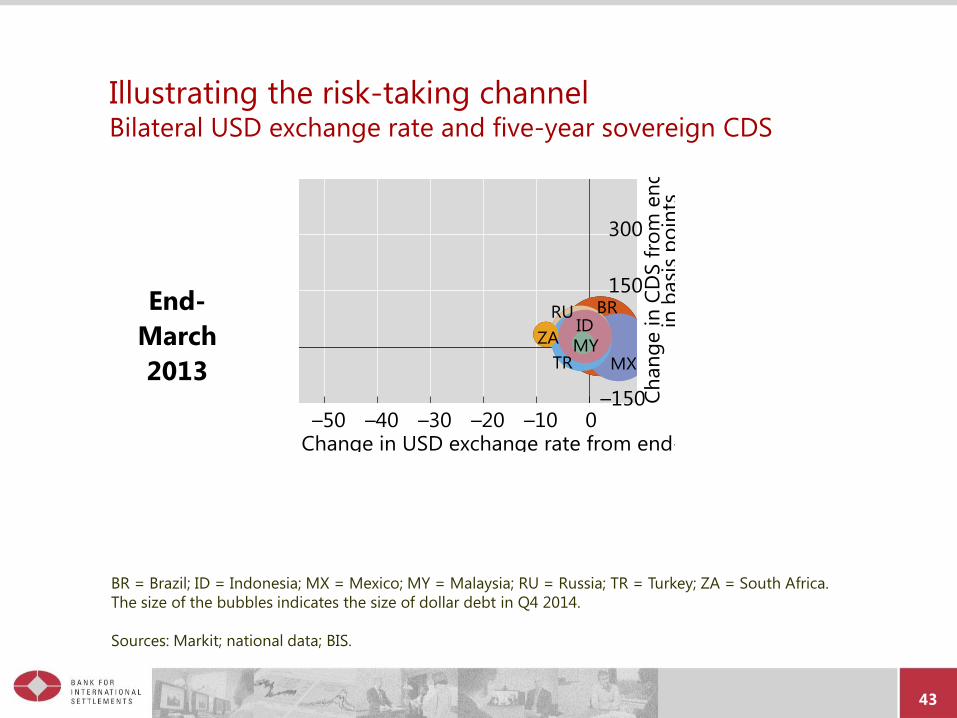
Illustrating the risk-taking channel Bilateral USD exchange rate and five-year sovereign CDS
End-
March
2013
BR = Brazil; ID = Indonesia; MX = Mexico; MY = Malaysia; RU = Russia; TR = Turkey; ZA = South Africa.
The size of the bubbles indicates the size of dollar debt in Q4 2014.
Sources: Markit; national data; BIS.
44
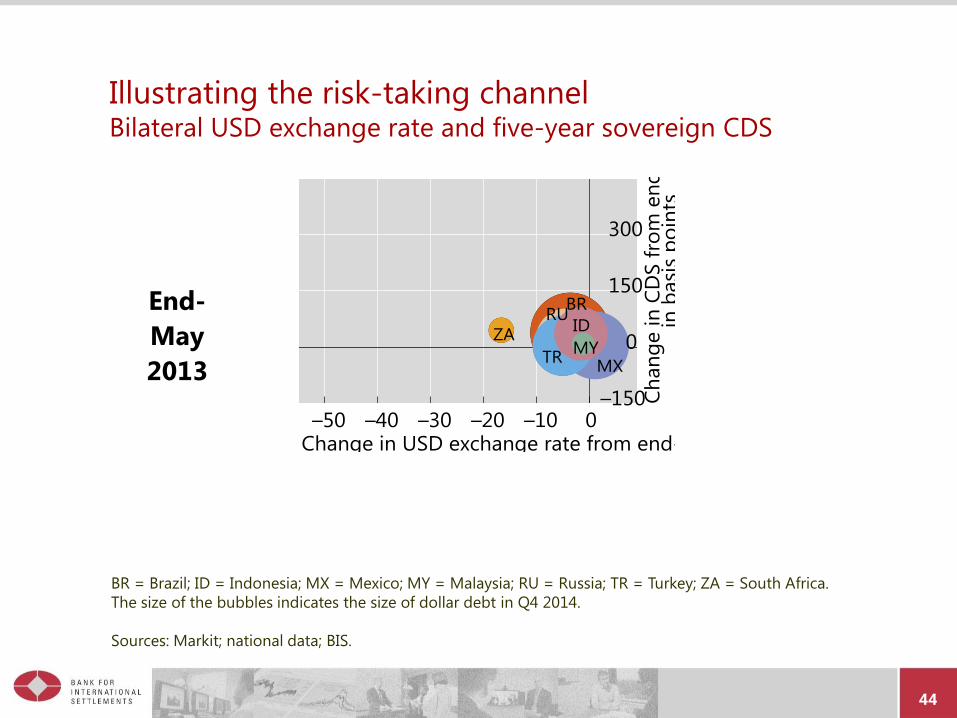
Illustrating the risk-taking channel Bilateral USD exchange rate and five-year sovereign CDS
End-
May
2013
BR = Brazil; ID = Indonesia; MX = Mexico; MY = Malaysia; RU = Russia; TR = Turkey; ZA = South Africa.
The size of the bubbles indicates the size of dollar debt in Q4 2014.
Sources: Markit; national data; BIS.
45
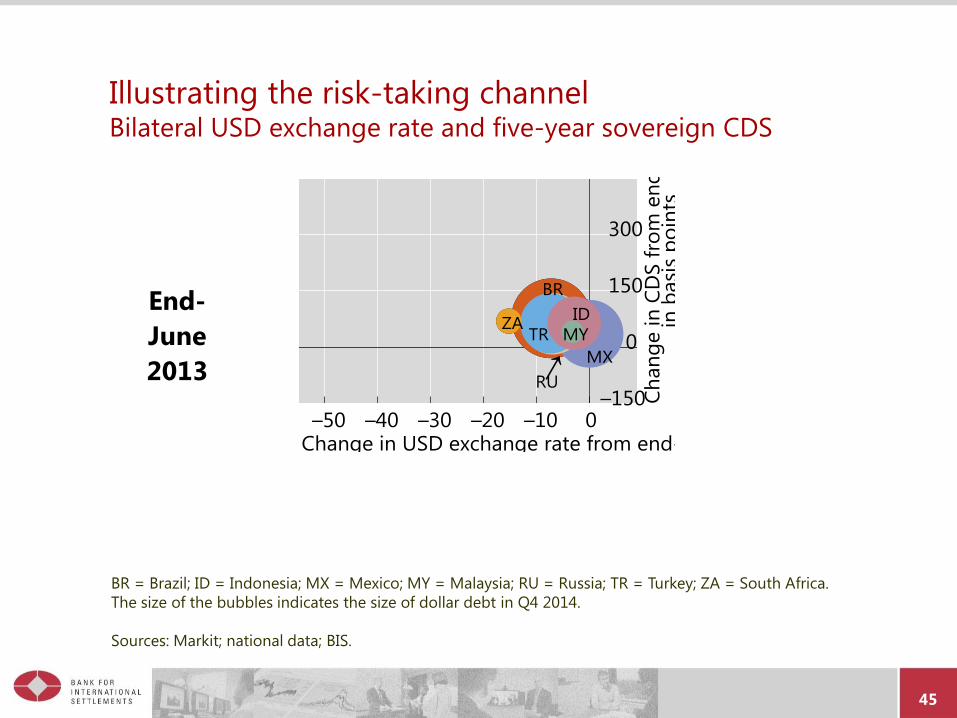
Illustrating the risk-taking channel Bilateral USD exchange rate and five-year sovereign CDS
End-
June
2013
BR = Brazil; ID = Indonesia; MX = Mexico; MY = Malaysia; RU = Russia; TR = Turkey; ZA = South Africa.
The size of the bubbles indicates the size of dollar debt in Q4 2014.
Sources: Markit; national data; BIS.
46
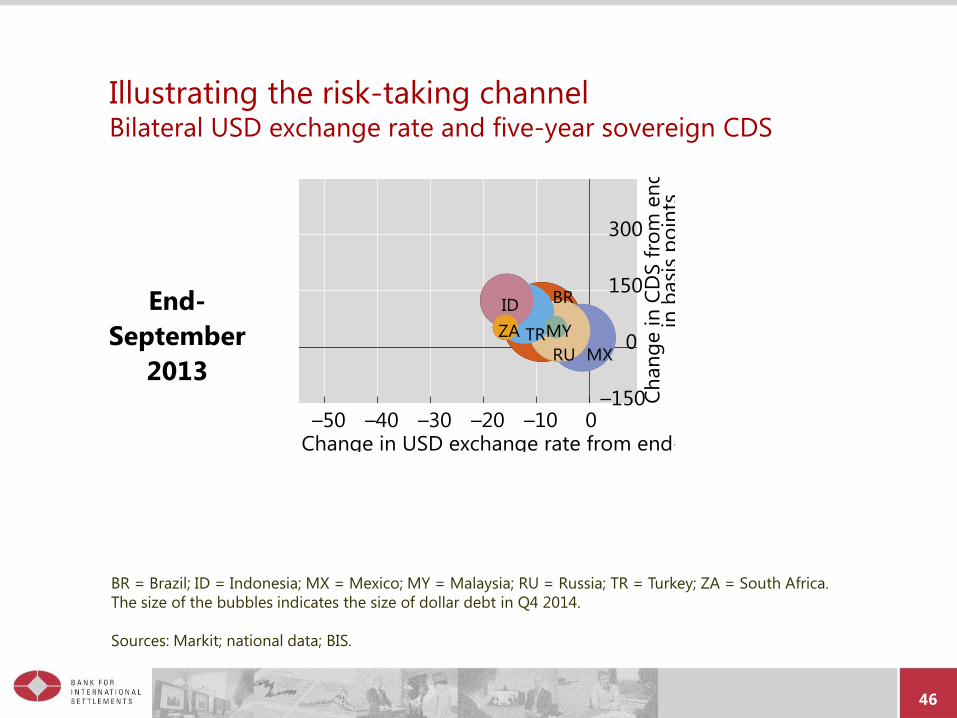
Illustrating the risk-taking channel Bilateral USD exchange rate and five-year sovereign CDS
End-
September
2013
BR = Brazil; ID = Indonesia; MX = Mexico; MY = Malaysia; RU = Russia; TR = Turkey; ZA = South Africa.
The size of the bubbles indicates the size of dollar debt in Q4 2014.
Sources: Markit; national data; BIS.
47
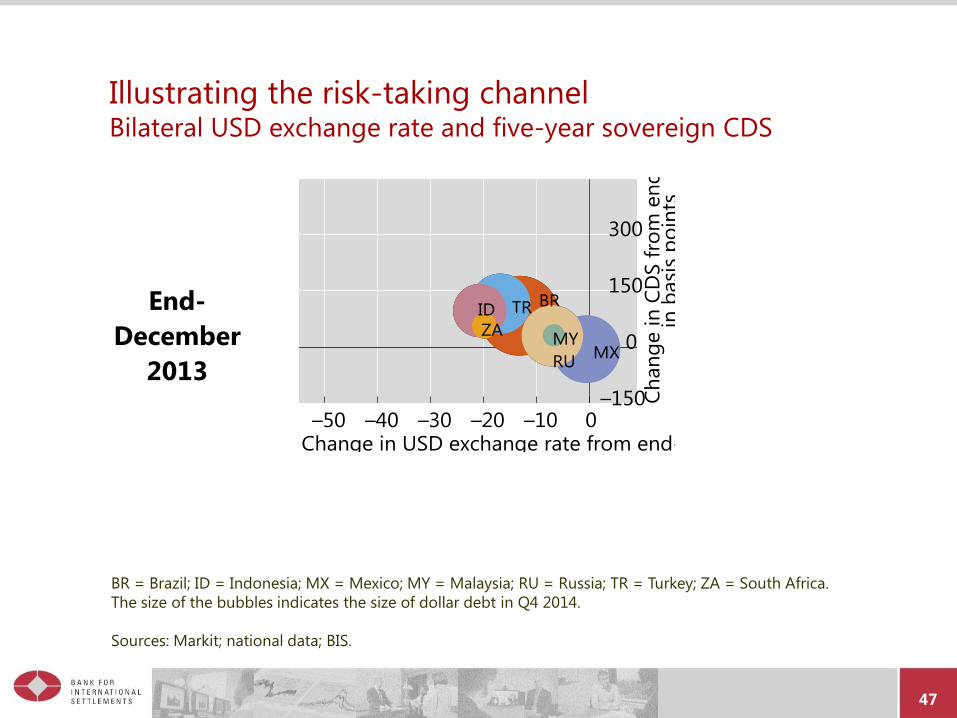
Illustrating the risk-taking channel Bilateral USD exchange rate and five-year sovereign CDS
End-
December
2013
BR = Brazil; ID = Indonesia; MX = Mexico; MY = Malaysia; RU = Russia; TR = Turkey; ZA = South Africa.
The size of the bubbles indicates the size of dollar debt in Q4 2014.
Sources: Markit; national data; BIS.
48
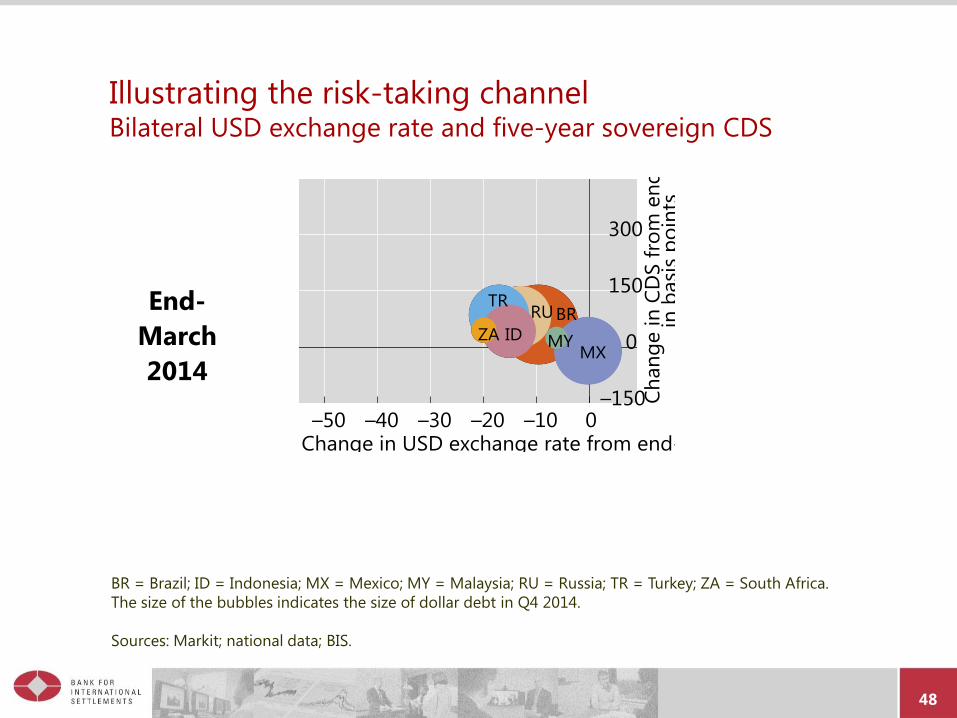
Illustrating the risk-taking channel Bilateral USD exchange rate and five-year sovereign CDS
End-
March
2014
BR = Brazil; ID = Indonesia; MX = Mexico; MY = Malaysia; RU = Russia; TR = Turkey; ZA = South Africa.
The size of the bubbles indicates the size of dollar debt in Q4 2014.
Sources: Markit; national data; BIS.
49
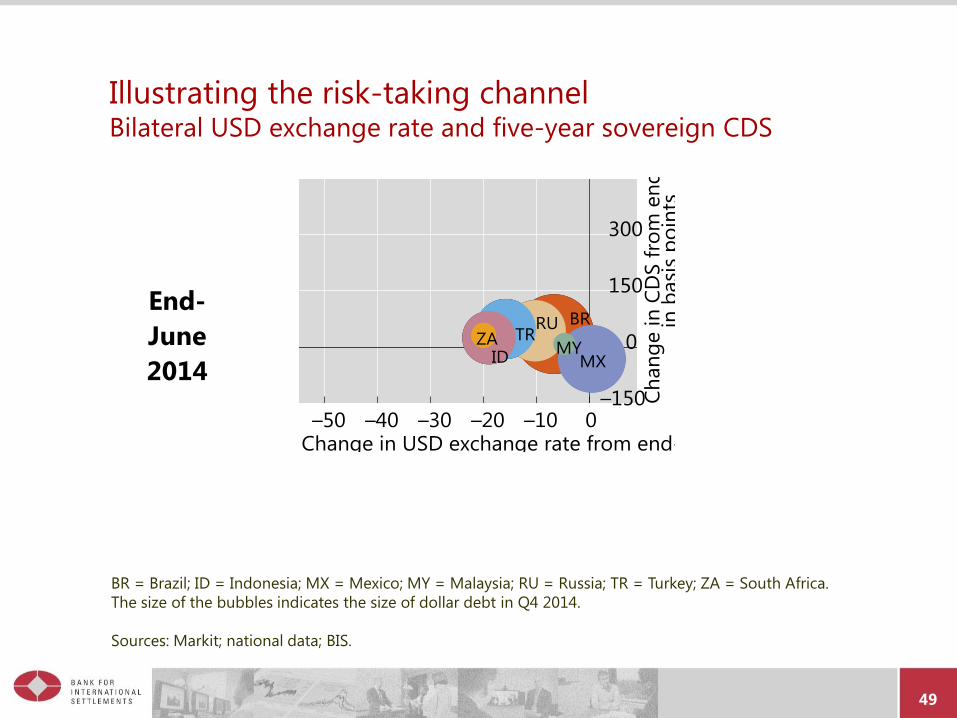
Illustrating the risk-taking channel Bilateral USD exchange rate and five-year sovereign CDS
End-
June
2014
BR = Brazil; ID = Indonesia; MX = Mexico; MY = Malaysia; RU = Russia; TR = Turkey; ZA = South Africa.
The size of the bubbles indicates the size of dollar debt in Q4 2014.
Sources: Markit; national data; BIS.
50
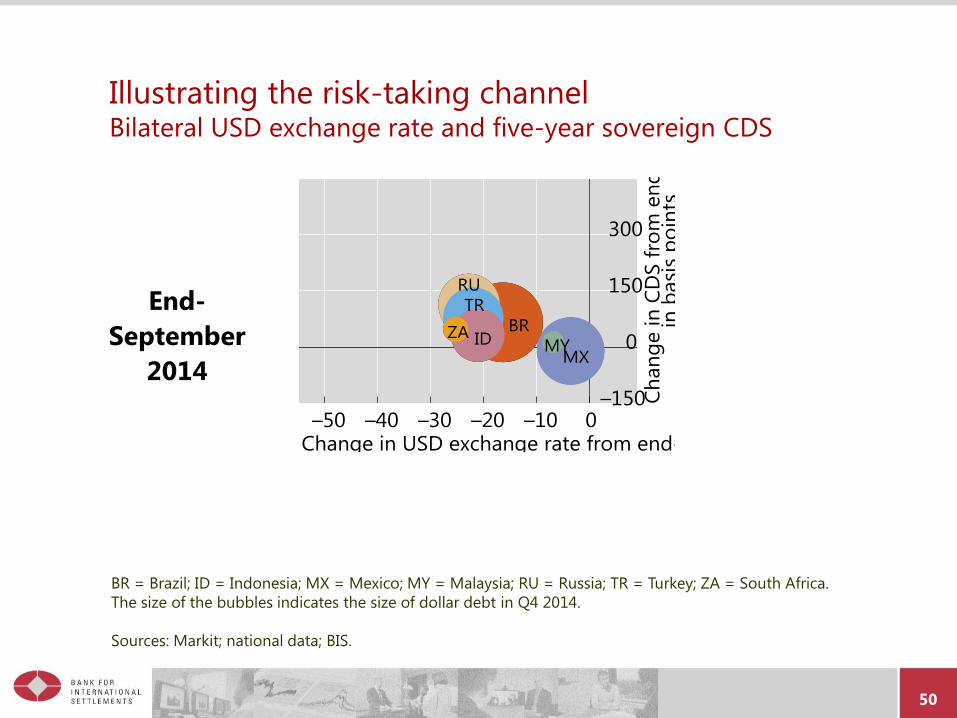
Illustrating the risk-taking channel Bilateral USD exchange rate and five-year sovereign CDS
End-
September
2014
BR = Brazil; ID = Indonesia; MX = Mexico; MY = Malaysia; RU = Russia; TR = Turkey; ZA = South Africa.
The size of the bubbles indicates the size of dollar debt in Q4 2014.
Sources: Markit; national data; BIS.
51
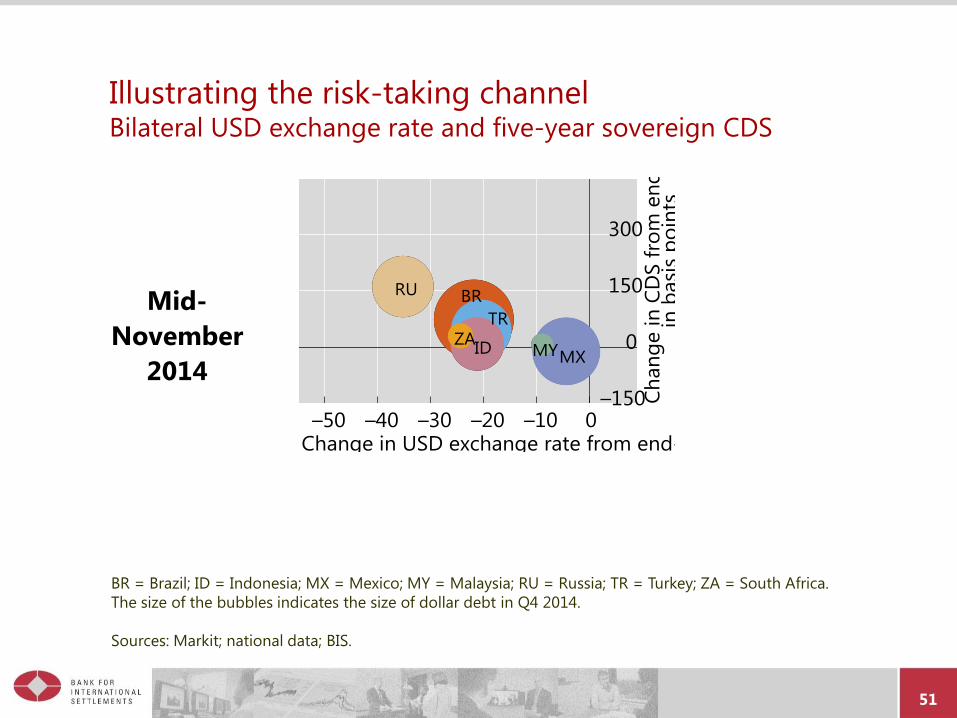
Illustrating the risk-taking channel Bilateral USD exchange rate and five-year sovereign CDS
Mid-
November
2014
BR = Brazil; ID = Indonesia; MX = Mexico; MY = Malaysia; RU = Russia; TR = Turkey; ZA = South Africa.
The size of the bubbles indicates the size of dollar debt in Q4 2014.
Sources: Markit; national data; BIS.
52
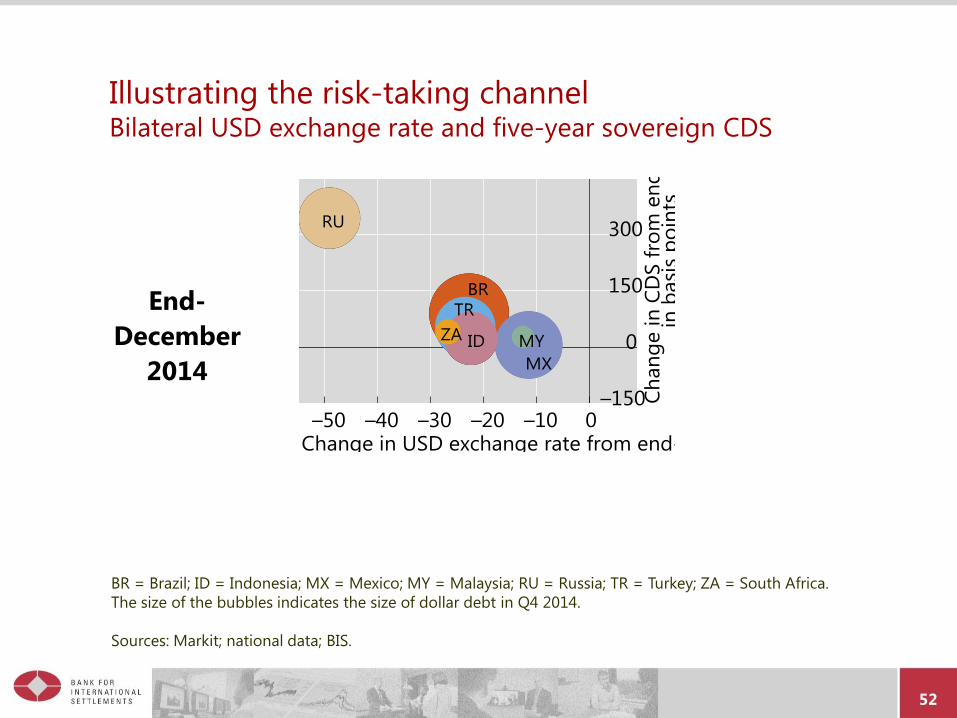
Illustrating the risk-taking channel Bilateral USD exchange rate and five-year sovereign CDS
End-
December
2014
BR = Brazil; ID = Indonesia; MX = Mexico; MY = Malaysia; RU = Russia; TR = Turkey; ZA = South Africa.
The size of the bubbles indicates the size of dollar debt in Q4 2014.
Sources: Markit; national data; BIS.
53
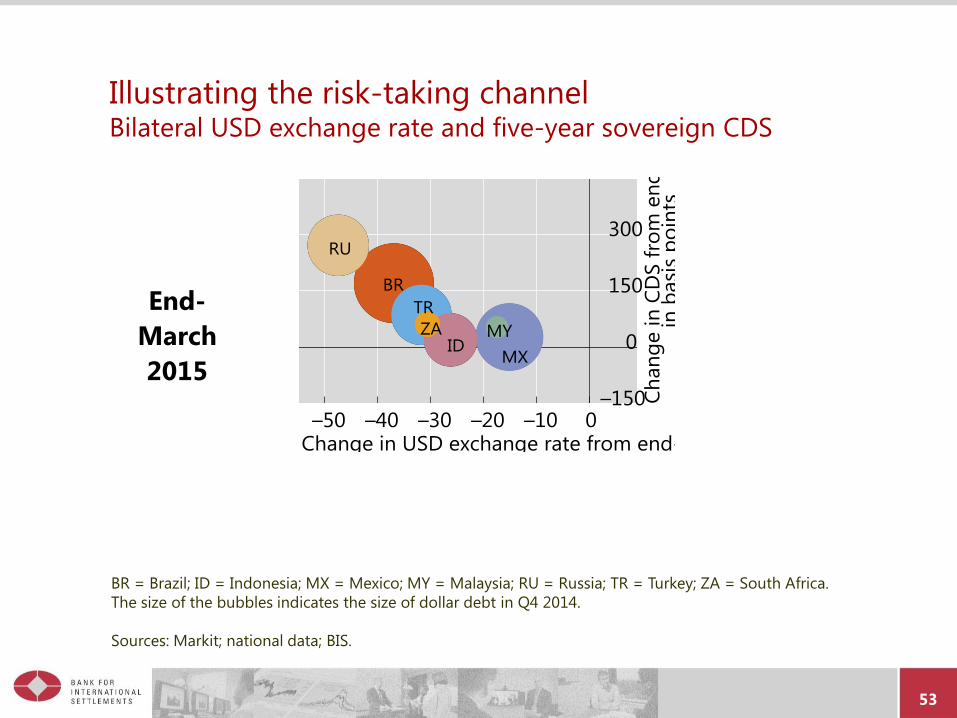
Illustrating the risk-taking channel Bilateral USD exchange rate and five-year sovereign CDS
End-
March
2015
BR = Brazil; ID = Indonesia; MX = Mexico; MY = Malaysia; RU = Russia; TR = Turkey; ZA = South Africa.
The size of the bubbles indicates the size of dollar debt in Q4 2014.
Sources: Markit; national data; BIS.
54
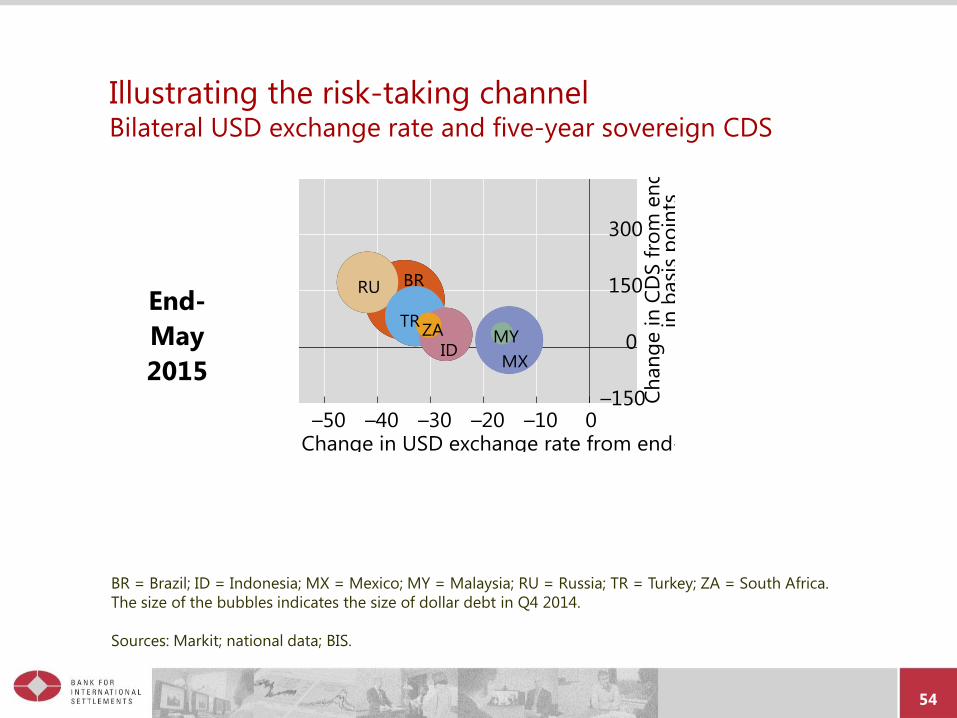
Illustrating the risk-taking channel Bilateral USD exchange rate and five-year sovereign CDS
End-
May
2015
BR = Brazil; ID = Indonesia; MX = Mexico; MY = Malaysia; RU = Russia; TR = Turkey; ZA = South Africa.
The size of the bubbles indicates the size of dollar debt in Q4 2014.
Sources: Markit; national data; BIS.
55
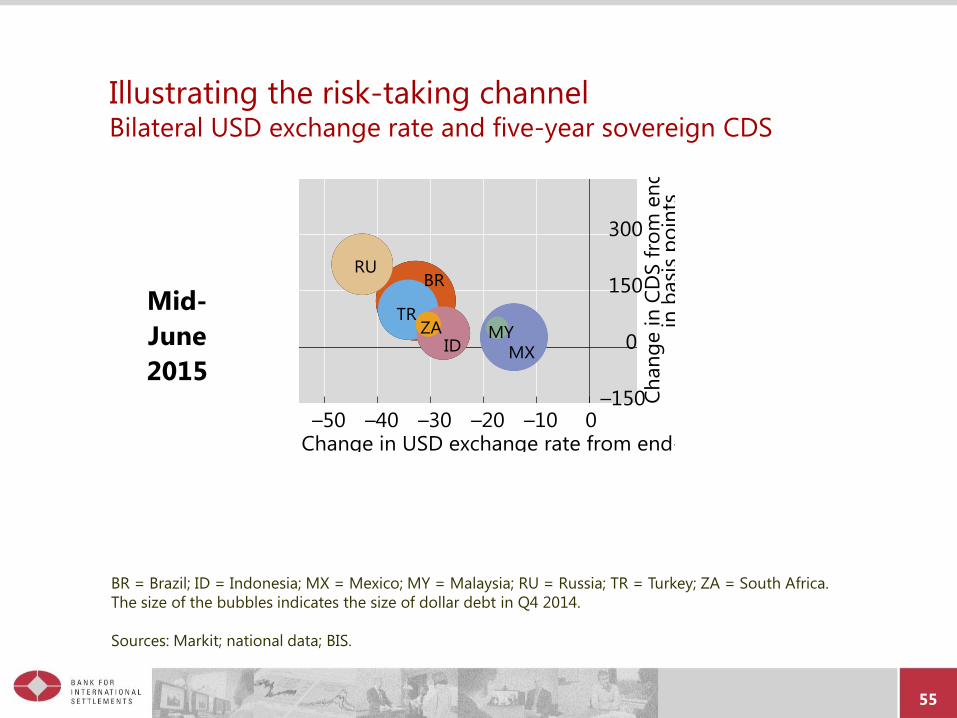
Illustrating the risk-taking channel Bilateral USD exchange rate and five-year sovereign CDS
Mid-
June
2015
BR = Brazil; ID = Indonesia; MX = Mexico; MY = Malaysia; RU = Russia; TR = Turkey; ZA = South Africa.
The size of the bubbles indicates the size of dollar debt in Q4 2014.
Sources: Markit; national data; BIS.
56
Macro implications
http://www.suerf.org/docx/l_8e296a067a37563370ded05f5a3bf3ec_1919_suerf.pdf
57
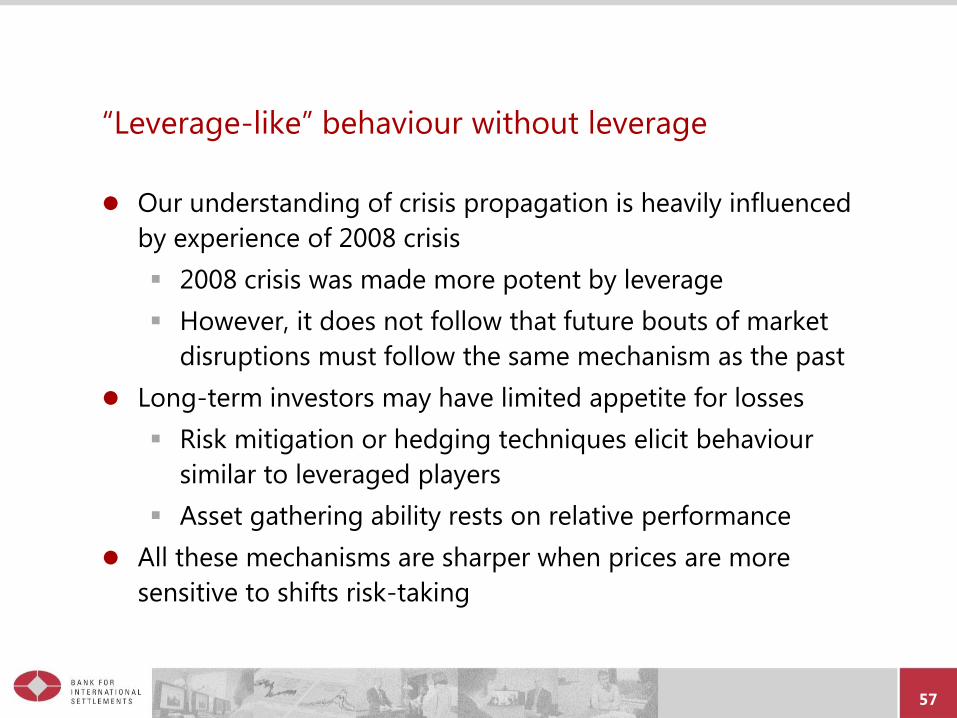
“Leverage-like” behaviour without leverage
Our understanding of crisis propagation is heavily influenced
by experience of 2008 crisis
2008 crisis was made more potent by leverage
However, it does not follow that future bouts of market
disruptions must follow the same mechanism as the past
Long-term investors may have limited appetite for losses
Risk mitigation or hedging techniques elicit behaviour
similar to leveraged players
Asset gathering ability rests on relative performance
All these mechanisms are sharper when prices are more
sensitive to shifts risk-taking
58
Redemptions and discretionary sales
http://www.suerf.org/docx/l_8e296a067a37563370ded05f5a3bf3ec_1919_suerf.pdf
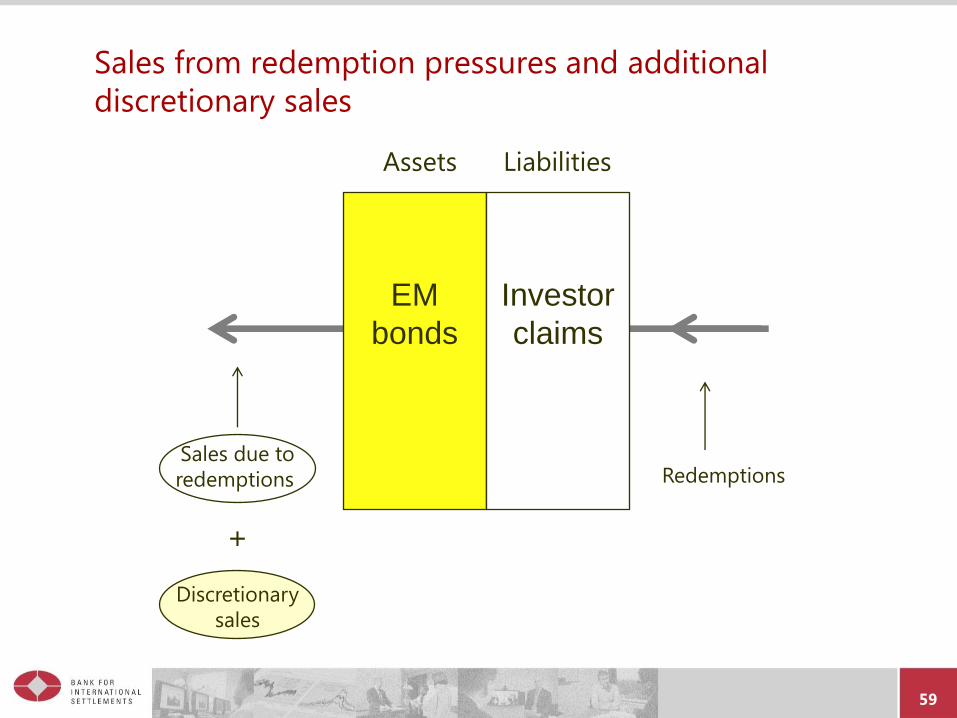
Sales from redemption pressures and additional
discretionary sales
59
EM
bonds
Investor
claims
Assets Liabilities
Redemptions Sales due to
redemptions
+
Discretionary
sales
60
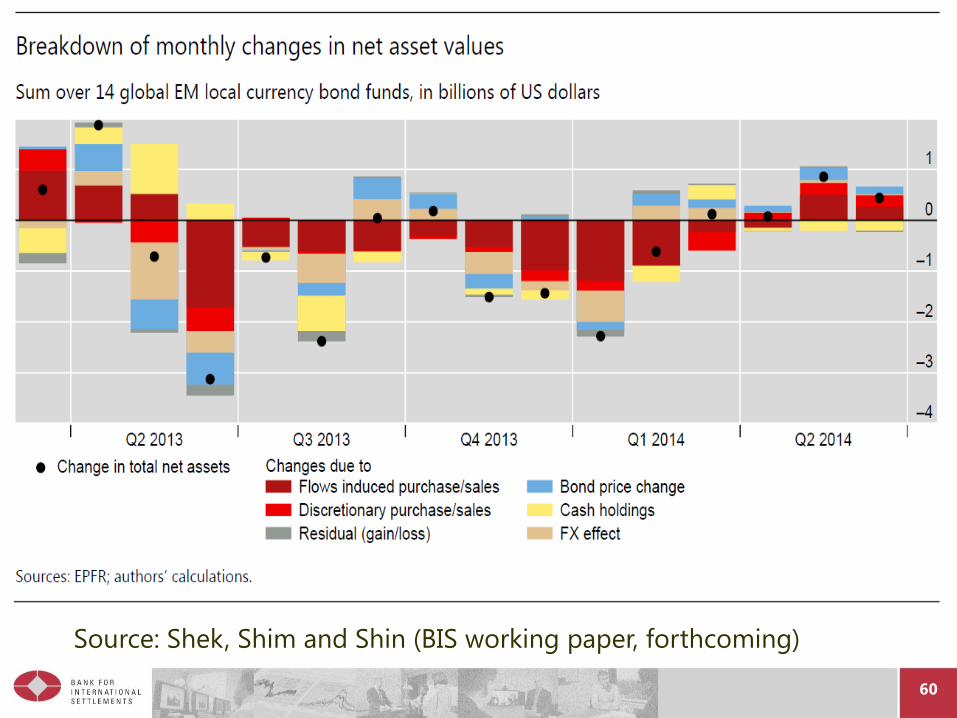
Source: Shek, Shim and Shin (BIS working paper, forthcoming)
61
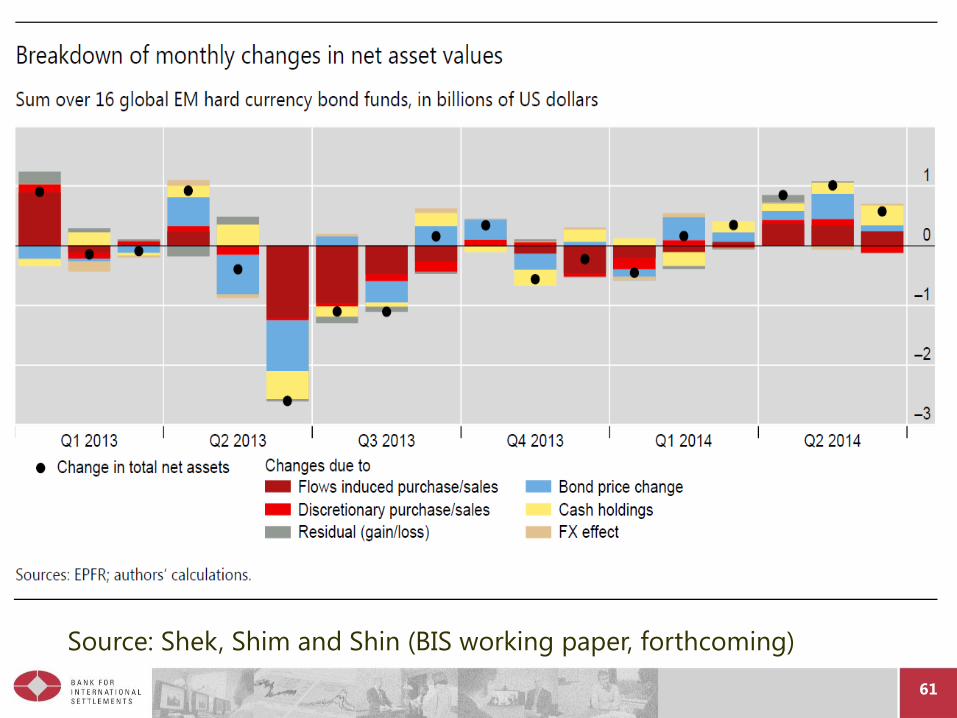
Source: Shek, Shim and Shin (BIS working paper, forthcoming)
62
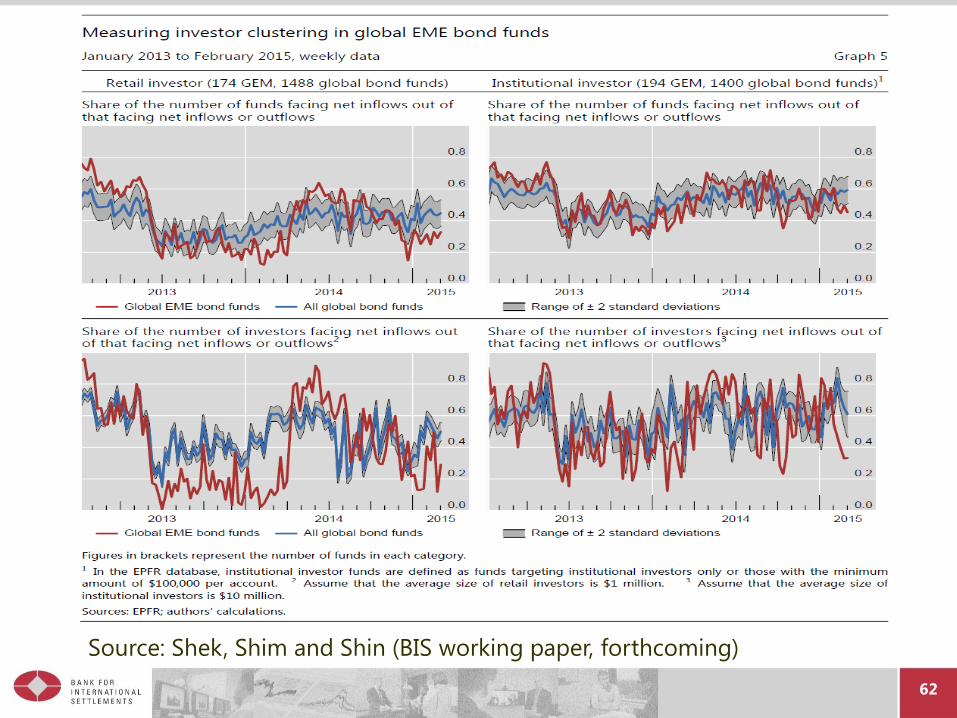
Source: Shek, Shim and Shin (BIS working paper, forthcoming)
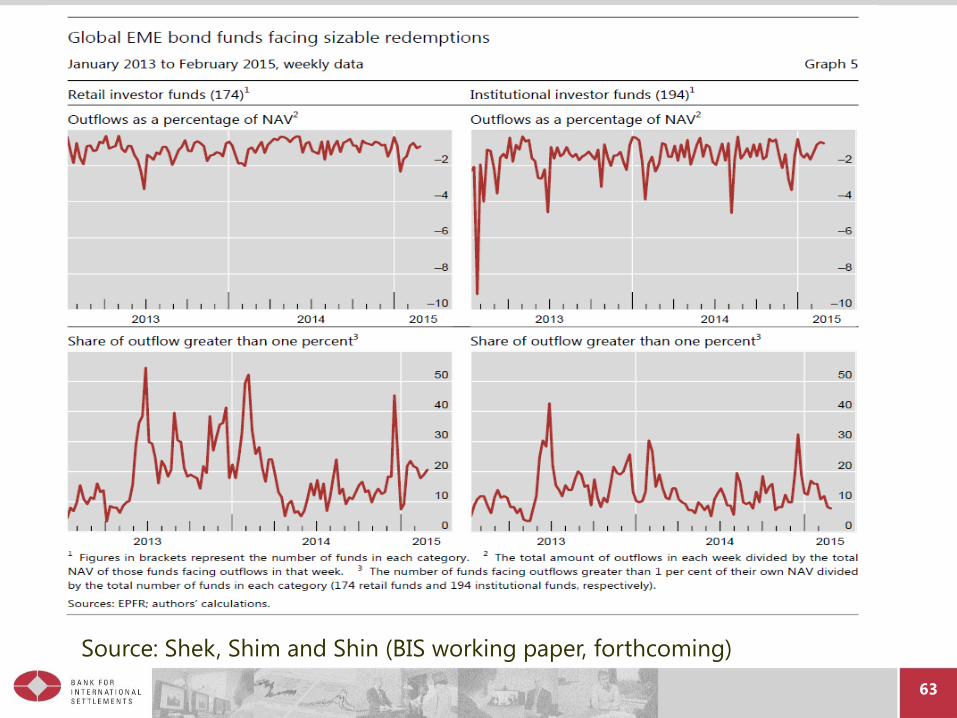
63
Source: Shek, Shim and Shin (BIS working paper, forthcoming)
64
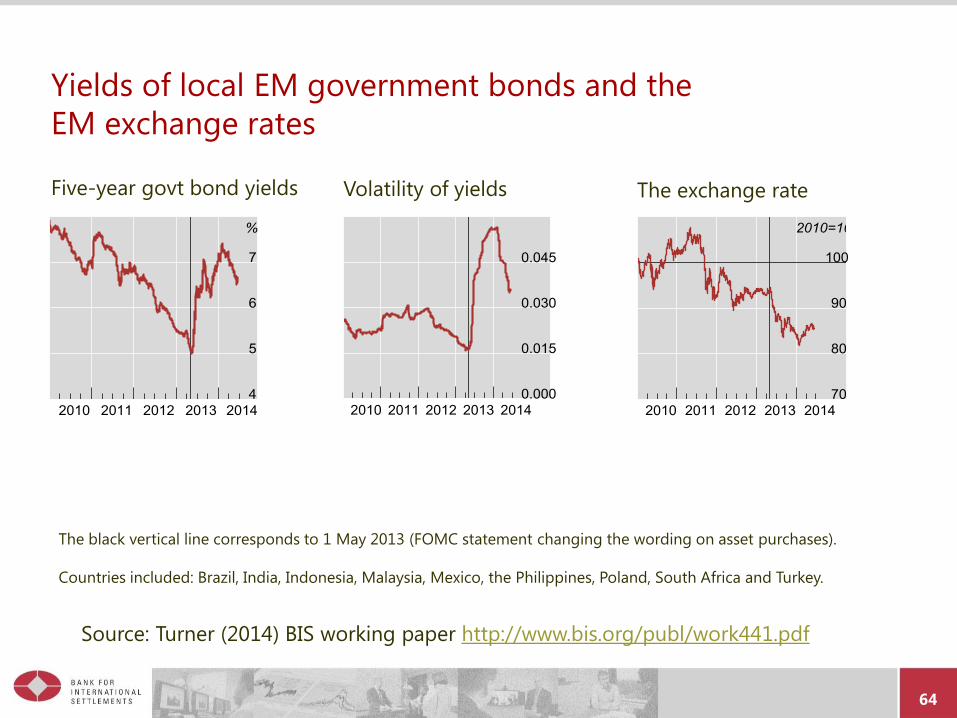
Yields of local EM government bonds and the
EM exchange rates
Five-year govt bond yields Volatility of yields The exchange rate
The black vertical line corresponds to 1 May 2013 (FOMC statement changing the wording on asset purchases).
Countries included: Brazil, India, Indonesia, Malaysia, Mexico, the Philippines, Poland, South Africa and Turkey.
Source: Turner (2014) BIS working paper http://www.bis.org/publ/work441.pdf
65
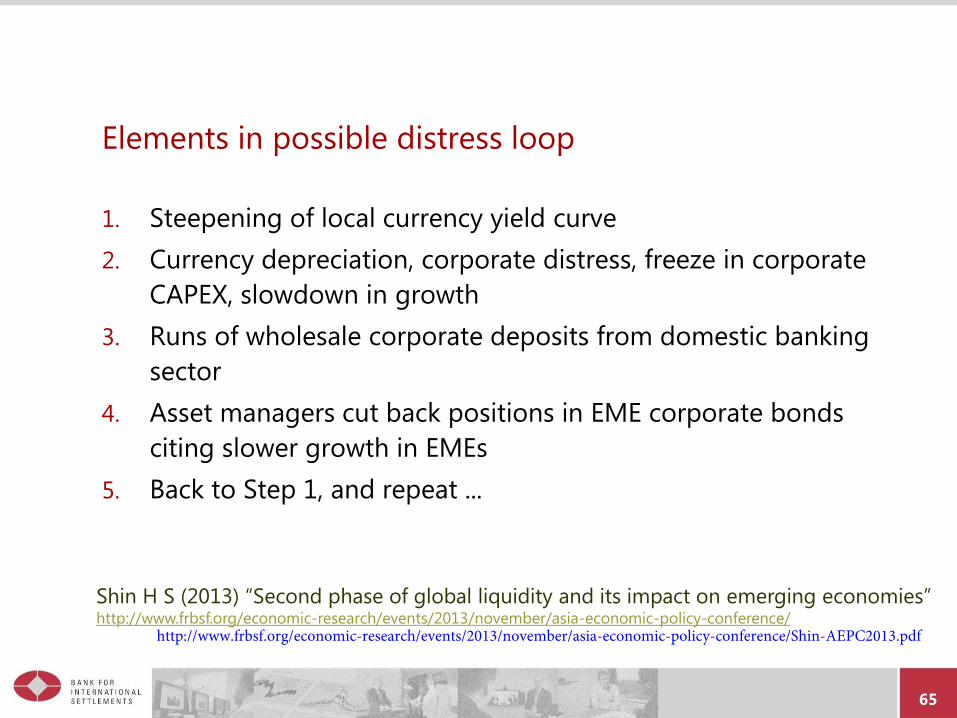
Elements in possible distress loop
1. Steepening of local currency yield curve
2. Currency depreciation, corporate distress, freeze in corporate
CAPEX, slowdown in growth
3. Runs of wholesale corporate deposits from domestic banking
sector
4. Asset managers cut back positions in EME corporate bonds
citing slower growth in EMEs
5. Back to Step 1, and repeat ...
Shin H S (2013) “Second phase of global liquidity and its impact on emerging economies” http://www.frbsf.org/economic-research/events/2013/november/asia-economic-policy-conference/
http://www.frbsf.org/economic-research/events/2013/november/asia-economic-policy-conference/Shin-AEPC2013.pdf
66
Monetary policy spillovers and “spillbacks”
http://www.suerf.org/docx/l_8e296a067a37563370ded05f5a3bf3ec_1919_suerf.pdf
67
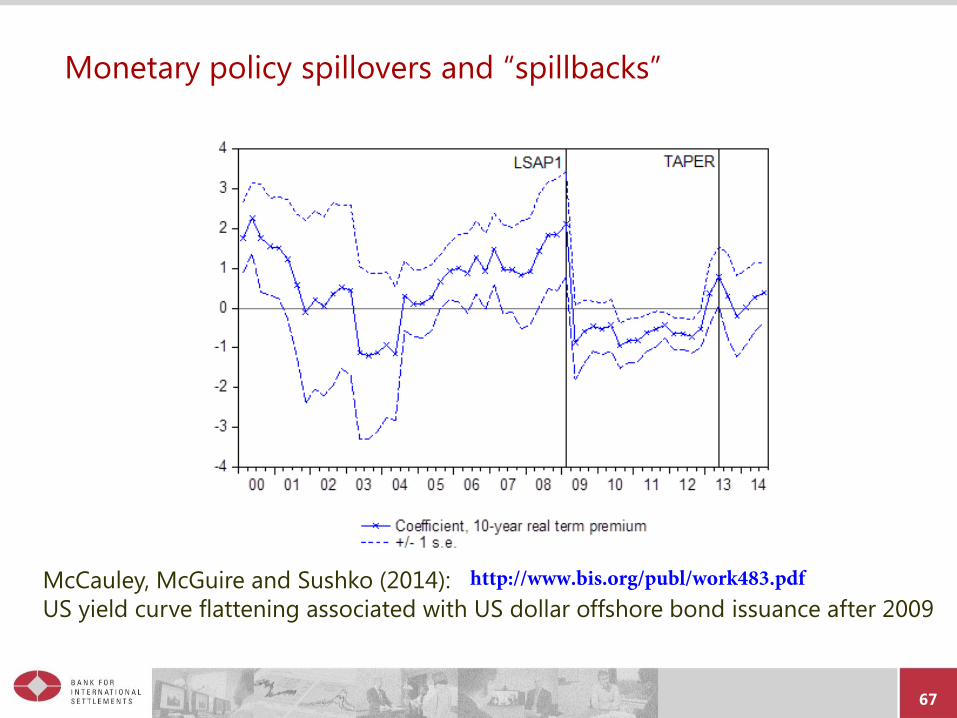
Monetary policy spillovers and “spillbacks”
McCauley, McGuire and Sushko (2014):
US yield curve flattening associated with US dollar offshore bond issuance after 2009
http://www.bis.org/publ/work483.pdf
68
Monetary policy spillovers and “spillbacks”
McCauley et al (2014): USD bond issuance outside the United
States associated with US treasury yield curve flattening
Three questions:
1. How much is the recent weak macro reading in the United
States due to the strong dollar?
2. To what extent is the strong dollar due to “net short”
position in dollars outside the United States?
3. How should monetary policy take account of spillbacks –
and hence initial spillovers?
http://www.suerf.org/helsinki2015
http://www.suerf.org/helsinki2015
http://www.suerf.org/helsinki2015

https://www.flickr.com/photos/suomenpankki/sets/72157654979418508

https://www.flickr.com/photos/suomenpankki/sets/72157654979418508
https://www.flickr.com/photos/suomenpankki/sets/72157654979418508

https://www.flickr.com/photos/suomenpankki/sets/72157654979418508
https://www.flickr.com/photos/suomenpankki/sets/72157654979418508

https://www.flickr.com/photos/suomenpankki/sets/72157654979418508


http://www.suerf.org/helsinki2015