THE TITRATION CURVE OF GLUTATHIONE. of During the past few years considerable advances
14
THE TITRATION CURVE OF GLUTATHIONE. BY NORMAN W. PIRIE AND KATHLEEN GODWIN PINHEY. (From the Biochemical and Physiological Laboratories, University of Cambridge, England.) (Received for publication, July 20, 1929.) During the past few years considerable advances have been made, by Harris and others, in the interpretation of titration curves of amino acids and peptides. It was our intention in undertaking this work simply to see whether the titration curve of the crys- talline substance described by Hopkins in the accompanying paper was consistent with the view that it is a tripeptide of glu- tamic acid, cysteine, and glycine; i.e., containing one SH, one NH2, and two COOH groups. This turns out to be the case, and we have also been able to identify and measure the constants for each group. The magnitude of the titration constants of a substance may in many cases serve in addition as a valuable guide in the elucida- tion of its detailed structure (Simms and others). We fully ap- preciate however that there is so little information concerning the peptides of dicarboxylic acids and of cysteine that certain con- clusions drawn, in this paper, under this second heading must be considered strictly provisional. EXPERIMENTAL. Glass Electrode Titration. For each curve about 25 mg. of glutathione prepared by Hop- kins’ (1) method were taken. The samples were weighed into a small glass tube, open at each end, and then tipped out quanti- tatively into the cup of a glass electrode of the type described by Kerridge (2). A few minutes shaking sufficed to dissolve the glutathione after addition of 0.8 cc. of water or dilute formalde- hyde solution. The actual volumes of normal acid and alkali used were reduced to the common basis of 30.7 mg. of reduced gluta- 321 by guest on April 3, 2019 http://www.jbc.org/ Downloaded from
Transcript of THE TITRATION CURVE OF GLUTATHIONE. of During the past few years considerable advances

THE TITRATION CURVE OF GLUTATHIONE.
BY NORMAN W. PIRIE AND KATHLEEN GODWIN PINHEY.
(From the Biochemical and Physiological Laboratories, University of Cambridge, England.)
(Received for publication, July 20, 1929.)
During the past few years considerable advances have been made, by Harris and others, in the interpretation of titration curves of amino acids and peptides. It was our intention in undertaking this work simply to see whether the titration curve of the crys- talline substance described by Hopkins in the accompanying paper was consistent with the view that it is a tripeptide of glu- tamic acid, cysteine, and glycine; i.e., containing one SH, one NH2, and two COOH groups. This turns out to be the case, and we have also been able to identify and measure the constants for each group.
The magnitude of the titration constants of a substance may in many cases serve in addition as a valuable guide in the elucida- tion of its detailed structure (Simms and others). We fully ap- preciate however that there is so little information concerning the peptides of dicarboxylic acids and of cysteine that certain con- clusions drawn, in this paper, under this second heading must be considered strictly provisional.
EXPERIMENTAL.
Glass Electrode Titration.
For each curve about 25 mg. of glutathione prepared by Hop- kins’ (1) method were taken. The samples were weighed into a small glass tube, open at each end, and then tipped out quanti- tatively into the cup of a glass electrode of the type described by Kerridge (2). A few minutes shaking sufficed to dissolve the glutathione after addition of 0.8 cc. of water or dilute formalde- hyde solution. The actual volumes of normal acid and alkali used were reduced to the common basis of 30.7 mg. of reduced gluta-
321
by guest on April 3, 2019
http://ww
w.jbc.org/
Dow
nloaded from

322 Titration Curve of Glutathione
thione, thus making 0.1 cc. correspond to 1 equivalent of reduced glutathione.
The technique of pH determination differed from the standard procedure described by Kerridge in two points. No paraffin was used. The glass electrode and its connections, including the calomel electrodes, was in an air bath at 22’ (a few degrees above room temperature). Under these conditions moisture leaks are avoided without the use of paraffin. The same KC1 contact was used during the series of determinations on any sample. That the possible diffusion of KC1 around the glass cap does not affect the accuracy of the pH values is definitely shown by the good agreement obtained between the glass and hydrogen electrode determinations. The KC1 used was 3.5 N.
Potassium hydrogen phthalate was used as the standard for the determinations of pH. This was the British Drug Houses “A. IL” quality and its pH was checked by direct measurement with the hydrogen electrode against a saturated calomel half- cell, the value for the latter being accepted as given by Clark (3). As a further check, we compare the phthalate against the half neutralized acetic acid used as standard in the hydrogen electrode determinations, and against a McIlvaine disodium phosphate- citric acid buffer.
Hydrogen Electrode Titration.
As in the case of the glass electrode solid glutathione was weighed, put into the titration vessel, and then dissolved in water or formaldehyde. A glass tube 5 cm. long and 1 cm. in diameter, fused at its lower end to a capillary U-tube, was used as the titra- tion vessel. The hydrogen was introduced through this capillary and so kept the liquid effectively stirred. A platinized platinum wire electrode and KC1 agar bridge were held from above against the inner wall of the titration vessel, leaving ample room for the burette. With this apparatus very steady readings can be ob- tained on 0‘5 cc. of fluid. The standard used was another hydro- gen electrode in a standard buffer solution.
Hydrogen electrode determinations were possible only for re- duced glutathione in water since formaldehyde is blown out of the solution by the current of hydrogen. As the hydrogen and glass &&rode curves agree perfectly on the alkaline side of the isoelec-
by guest on April 3, 2019
http://ww
w.jbc.org/
Dow
nloaded from

h’. TV. Pirie and K. G. Pinhey 323
tric point, we assume that the readings of the glass electrode in this range are also reliable for systems containing formaldehyde. On the acid side of the isoelectric point however, for systems con- taining reduced glutathione and hydrochloric acid, the glass electrode determinations were consistently 0.2 pH lower than the corresponding readings of the hydrogen electrode. This has been confirmed by determinations with both electrodes on the same solution, when this contains reduced glutathione and HCl and has a pH in the neighborhood of 2. This effect is not due simply to the low pH of the solution since the glass and hydrogen elec- trodes agree perfectly in this range when pure sulfuric acid solu- tions are used or, as Hughes has shown (4), hydrochloric acid. With 0.1 M glycine and HCl we found a similar discrepancy be- tween the two electrodes, of about 0.08 pH, in the range pH 2.5 to 1.5. We have therefore added 0.2 pH to all values deter- mined by the glass electrode on the acid side of the isoelectric point.
All determinations were made at 22”. Quinhydrone cannot be used with glutathione. This is prob-
ably due to the upsetting of the quinone : hydroquinone equilib- rium by an oxidation-reduction system.
Normal HCI and COz-free NaOH, in 1 cc. standard burettes divided in 0.01 cc., were used. The burette had fixed to it a very fine glass tip, waxed at the point; this was immersed in the solution in the titration vessel after each addition of acid or alkali.
Blank correction curves on water and 0.4 per cent formaldehyde were determined. In both cases the correction is negligible up to pH 11 on the alkaline side. On the acid side it becomes con- siderably below pH 2, and is approximately the same for water and formaldehyde. The values used in drawing the curves have been corrected by subtraction of the water or form01 blank from the volume of acid added. With this correction, the curves are in good agreement with the theoretical curve, calculated by the Henderson-Hasselbalch equation, as far as pH 1.7.
With the glass electrode we have determined the titration curve of impure oxidized glutathione in water and in 0.4 per cent for- maldehyde. The sample used was prepared by atmospheric oxidation of pure reduced glutathione neutralized with baryta; its sulfur and nitrogen contents were respectively 92 and 85 per
by guest on April 3, 2019
http://ww
w.jbc.org/
Dow
nloaded from

324 Titration Curve of Glutathione
TABLE I.
Reduced Glutathione; Determinations with the Hydrogen Electrode.
Observed pH.
2.85 2.61 2.40 2.19 1.99 1.81 1.66 1.51
- Volume of N HCI,
corrected for acid blank.
Observed pH. V.lu~~~rmf~dHCl,
for acid blank.
cc.
0.000
0.013 0.030 0.046 0.062 0.074 0.085 0.097
2.85 2.65 2.42 2.16 2.03 1.89 1.73 1.57
cc.
0.000
0.012 0.028 0.040 0.054 0.066 0.072 0.092
Observed pH. Volume of N NaOH.
2.85 3.09 3.32 3.55 3.80 4.08 4.54 7.42 8.19 8.51 8.74 8.92 9.08 9.27 9.41 9.51 9.74 9.96
10.24 10.52 11.33 12.43
cc.
0.000 0.017 0.033 0.046 0.065 0.077 0.094 0.107 0.122 0.138 0.154 0.166 0.183 0.203 0.218 0.233 0.254 0.272 0.288 0.303 0.315 0.336
Corrected pH. Volume of N HCI, corrected for
acid blank.
2.79 2.44 2.01 1.57
cc.
0.000 0.023 0.065 0.087
by guest on April 3, 2019
http://ww
w.jbc.org/
Dow
nloaded from

N. W. Pirie and K. G. Pinhey
TABLE I-continued.
325
Corrected pH.
2.84 2.42 2.30 2.07 1.80 1.63 1.49 1.37
Observed pH. Volume of N NaOH. Observed pH.
2.85 3.22 3.75 4.36 8.56 8.97 9.25 9.57
10.07 10.33 10.46 11.04
cc.
0.000
0.023 0.058 0.085 0.145 0.178 0.209 0.245 0.278 0.289 0.302 0.322
2.83 3.29 3.69 4.22 4.47 5.20 8.00 8.30 8.78 9.39
11.23
!- Reduced glutsthione in 0.1 per ceut
formaldehyde. Reduced glutathione in 0.2 per cent
formaldehyde.
Observed pH. Volume of N N&OH. Observed pH. Volume. of N NaOH.
2.83 4.09 8.64 9.42 9.71
10.38 11.09
cc.
0.000 0.075 0.154 0.212 0.249 0.277 0.302
Volume of N HCI, corrected for acid blank.
cc.
0.000 0.009 0.023 0.038 0.058 0.075 0.089 0.102
-
T
.-
-
Jolume of N NaOH .
cc.
0.000 0.028 0.057 0.080 0.089 0.096 0.120 0.131 0.164 0.224 0.313
2.80 3.23 3.77 4.11 4.71 6.64 7.89 8.85 9.06 9.34 9.90
11.02
cc.
0.000
0.028 0.062 0.081 0.096 0.100 0.141 0.181 0.190 0.203 0.235 0.274
by guest on April 3, 2019
http://ww
w.jbc.org/
Dow
nloaded from

326 Tit,rat,ion Curve of Glutathione
TABLE I-Concluded.
Reduced glutathione in 0.4 per cent formaldehyde.
Corrected pH. Volume of iv HCl,
corrected for acid blank.
2.78 2.48 2.15 1.84 1.65 1.42
CG.
0.000
0.022 0.047 0.072 0.087 0.108
Corrected pH. Volume of N HCl,
corracted for acid blank.
cc.
2.83 0.000 2.49 0.027 2.12 0.058 1.86 0.082
Reduced glutathione in water; determinations made with glass electrode. As has already been stated 0.2 pH has been added to the observed value on the acid side of the isoelectric point.
cent of the theoretical. From the curve the molecular weight appears to be about 740, if we assume that there are two groups titrating between the iscelectric point and pH 6. This suggests that there is present at least 17 per cent of impurity. The im- purity may however be responsible for the neutralization of some of the soda added in the range pH 2.86 to 6. The pK values given are therefore only approximate, not only on account of the impurity but also on account of the great overlapping in several of the dissociation ranges.
DISCUSSION.
The four pK values for reduced glutathione and the six for oxidized glutathione are determined from the curves by fitting a stencil, cut in accordance with the Henderson-Hasselbalch equa-
tion pH = pK + loge ff
to the experimental points and reading
off the pH corresponding to 50 per cent dissociation, i.e. to CY = 0.5, as has been done by Harris (5).
The values obtained for titration in water are, reduced gluta- thione 2.12, 3.53, 8.66, 9.62; oxidized glutathione (approximate values) 2.0,2.6,3.3,4.0,8.7,9.6.
Titrations were also carried out in formaldehyde solutions of different concentrations since Harris has shown (6) that such titrations give a useful indication as to which pK values corre-
by guest on April 3, 2019
http://ww
w.jbc.org/
Dow
nloaded from

N. W. Pirie and K. G. Pinhey 327
by guest on April 3, 2019
http://ww
w.jbc.org/
Dow
nloaded from

Titration Curve of Glutathione
by guest on April 3, 2019
http://ww
w.jbc.org/
Dow
nloaded from
N. W. Pirie and K. G. Pinhey 329
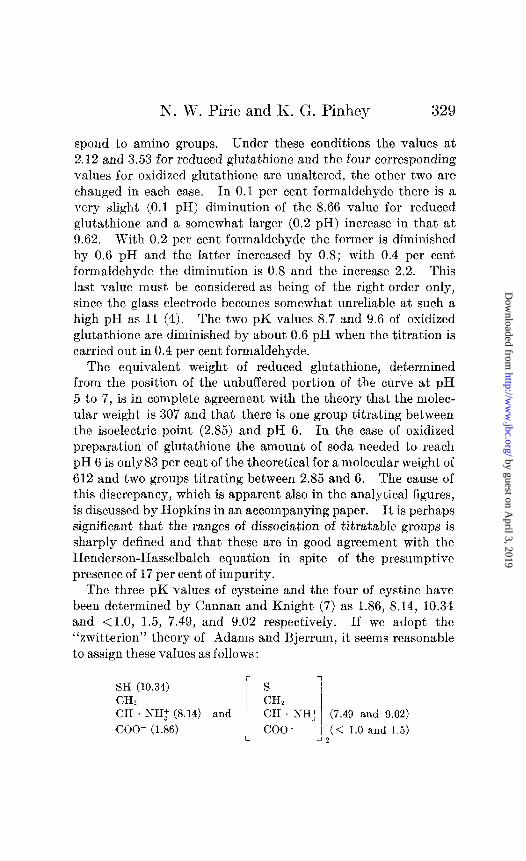
spond to amino groups. Under these conditions the values at 2.12 and 3.53 for reduced glutathione and the four corresponding values for oxidized glutathione are unaltered, the other two are changed in each case. In 0.1 per cent formaldehyde there is a very slight (0.1 pH) diminution of the 8.66 value for reduced glutathione and a somewhat larger (0.2 pH) increase in that at 9.62. With 0.2 per cent formaldehyde the former is diminished by 0.6 pH and the latter increased by 0.8; with 0.4 per cent formaldehyde the diminution is 0.8 and the increase 2.2. This last value must be considered as being of the right order only, since the glass electrode becomes somewhat unreliable at such a high pH as 11 (4). The two pK values 8.7 and 9.6 of oxidized glutathione are diminished by about 0.6 pH when the titration is carried out in 0.4 per cent formaldehyde.
The equivalent weight of reduced glutathione, determined from the position of the unbuffered portion of the curve at pH 5 to 7, is in complete agreement with the theory that the molec- ular weight is 307 and that there is one group titrating between the isoelectric point (2.85) and pH 6. In the case of oxidized preparation of glutathione the amount of soda needed to reach pH 6 is only83 per cent of the theoretical for a molecular weight of 612 and two groups titrating between 2.85 and 6. The cause of this discrepancy, which is apparent also in the analytical figures, is discussed by Hopkins in an accompanying paper. It is perhaps significant that the ranges of dissociation of titratable groups is sharply defined and that these are in good agreement with the Henderson-Hasselbalch equation in spite of the presumptive presence of 17 per cent of impurity.
The three pK values of cysteine and the four of cystine have been determined by Cannan and Knight (7) as 1.86, 8.14, 10.34 and <l.O, 1.5, 7.49, and 9.02 respectively. If we adopt the “zwitterion” theory of Adams and Bjerrum, it seems reasonable to assign these values as follows:
SW (10.34) ls -I
CH2 CH, CH NH: (8.14) and CH . NH: (7.43 and 9.02)
coo- (1.86) coo- (< 1.0 and 1.5) I- -12
by guest on April 3, 2019
http://ww
w.jbc.org/
Dow
nloaded from

330 TitraCon Curve of Glutathione
The value assigned to the -SH group is similar to that found by Cannan and Knight (7) in the cases of thiolactic and thioglycollic acids and the absence of a corresponding value in the oxidized compound is further confirmation of this arrangement. The values for both the carboxyl and the amino groups of cysteine are comparable with those of other amino acids although, as the authors mentioned above have pointed out, abnormally low.
Harris (5, 8) has determined the pK of glutamic acid. His values are approximately 2.2,4.3, and 9.8; these may be assigned
(4.3) OOC * CH,CH,CH . COO- (2.2)
“Hi (9.8)
because 2.2 and 9.8 are normal values for the carboxyl and amino groups of amino acids and 4.3 is in agreement with the value 4.8 given by Landolt and Bornstein (9) for butyric and valeric acids. Harris (5) also gives values for glycine and (6) assigns them thus, (2.4)-OOC . CH,NH,+ (9.75).
It has been shown by Harris (5) and Simms (10) that on peptide formation there is a weakening of both the acidic and basic pK values; i.e., the carboxyl pK is increased and the amino one dimin- ished. If we assume, in the case of the carboxyl group, that this is due to the removal of the activating influence of the amino group, and vice versa, as in Bjerrum’s t,heory, and if we assume also that this is a general rule for all peptides, we may attempt to assign the four pK values of reduced glutathione to their respective groups. (For the purpose of our argument it has been considered unnecessary to correct the observed,pK for salt concentration or to use t,he more accurate y values in applying the acid correction, as minor changes in the pK values do not affect our conclusions.)
The pK at 8.66 probably corresponds to an amino group since it is diminished in the formal titrations in a manner similar to that found by Harris (6) for the amino groups of amino acids under these conditions.
We may confidently assign the pK at 9.62 to an -SH group on account of its apparent absence in the oxidized compound and on account of its abnormal behavior with formaldehyde. L
1 The reaction between formaldehyde and the -SH group appears to be an equilibrium similar to that occurring with --NH2 groups since the shift of the most alkaline pK of glutathione depends on the concentration of
by guest on April 3, 2019
http://ww
w.jbc.org/
Dow
nloaded from

N. W. Pirie and K. G. Pinhey 331
The pK values at 2.12 and 3.53 are probably due to carboxyl groups by analogy with other amino acids and peptides.
It is therefore clear that reduced glutathione, having a com- bining weight of 367 and having one SH, one NHZ, and two COOH groups, satisfies the requirements for a tripeptide of glutamic acid, cysteine, and glycine.
An attempt will now be made to decide whether some of t,he twelve possible structures for such a peptide are more probable than others. This decision can only be provisional and it will be necessary to wait for direct chemical evidence or for more detailed knowledge of the titration constants of similar peptides before any positive statements can be made.
The value 2.12 is probably due to the oc-carboxyl group of glutamic acid if the adjacent amino group is free; it is aIso possible that it corresponds to the carboxyl of cysteine. The fall of the -SH pK, from a value greater than 10 in cysteine and other -SH compounds with a free carboxyl group, to 9.62 is if anything opposed to the latter possibility, since, on an electrostatic theory, the free carboxyl group is probably the cause of the rise in the first pK of H,S from about 7.5 to the neighborhood of 10 in HS .CHR. COOH compounds. In the peptides which have been studied the pK of an amino group has been about 8; the value 8.66 is therefore very high for an amino group without an ad- jacent carboxyl group. It is, on the other hand, lower than is usual for an amino acid PK. The latter objection is less serious than the former in view of the great variability in the pK values for the amino groups of amino acids. Probably therefore it corresponds to the amino group of glutamic acid with the ad- jacent carboxyl group free.
formaldehyde even when there is present less than 1 molecule of formalde- hyde for each molecule of glutathione. Similar results have been obtained by titrating to pH 12 with brilliant cresyl blue as indicator. In the absence
of formaldehyde 3 equivalents of soda were needed to take reduced gluta- thione or cysteine hydrochloride to pH 12 and with a large excess of for- maldehyde only 2 were required. Between these extremes the amount of soda needed is a function of the formaldehyde concentration. This action
is being investigated further as it does not seem to be strictly comparable to the well known action between mercaptans and ketones giving com- pounds of the type of mercaptol.
by guest on April 3, 2019
http://ww
w.jbc.org/
Dow
nloaded from

332 Titration Curve of Glutathione
The structures
COOH . CH . CHzCHzCO-NHCHKO-NH . CH . CH,SH
I I NH2 COOH
COOH * CH . CH&HK!O-NH . CH . CO-NIT . CHZOOH
I I NH2 CHzSH
appear to be the most probable for reduced glutathione and the second is slightly more probable than the first on account of the absence of a cysteine carboxyl group.
Neither of these formulas offers a very satisfactory explanation of the pK at 3.53. This is too high for an ordinary carboxyl group adjacent to a peptide linkage and too low for a carboxyl group approximating to the fatty acid type. If we suppose that the y-carboxyl group of glutamic acid is free, there are three possibilities; viz.
HOOC . CHzCHzCH . COOH
I NH-RRi
HOOC . CH&THzCH XH,
CO-RR,
HOOC . CH&H,CH . CO-R
NH-Ri
R and Ri represent glycine and cysteine
The first of these approximates to glutaric acid in which the pK values are 4.3 and 5.5 (9), while the second resembles y-amino- valeric acid in which Schmidt (11) found an acid pK at about 4. It is hard to reconcile the third structure with the preparation by IIopkins (1) of glycine-cysteine diketopiperazine from glutathione. A free -y-carboxyl group fails therefore to provide an adequate explanation of this pK, and until more information is available concerning the peptides of dicarboxylic acids we must leave the discrepancy unexplained.
by guest on April 3, 2019
http://ww
w.jbc.org/
Dow
nloaded from

N. W. Pirie and K. G. Pinhey 333
SUMMARY.
The titration curves of glutathione in water and dilute formalde- hyde are given.
Reduced glutathione is shown to have the following pK values : SH 9.62, NH2 8.66, COOH 3.53, and COOH 2.12.
From the magnitude of these constants an attempt is made to consider which are the more likely of the various possible modes of linkage of the three amino acids to form a tripeptide molecule.
We are deeply indebted to Professor Sir Frederick Gowland Hopkins, Mr. J. B. S. Haldane, and Dr. I,. J. Harris for their ad- vice and criticism in the preparation of this paper, and to Miss Gertrude Boothby for assistance during the investigation.
BIBLIOGRAPHY.
1. Hopkins, F. G., J. Biol. Chem., 84,269 (1929). 2. Kerridge, P. M. T., J. SC. Instruments, 3,404 (1926). 3. Clark, W. M., The determination of hydrogen ions, Baltimore, 3rd
edition (1928). 4. Hughes, W. S., J. Chem. Sot., 491 (1928). 5. Harris, L. J., Proc. Roy. Sot. London, Series B, 95,440 (1923-24). 6. Harris, L. J., Proc. Roy. She. London, Series B, 104,412 (1929). 7. Cannan, R. K., and Knight, B. C. J. G., Biochem. J., 21, 1384 (1927). 8. Harris, L. J., J. Chem. Sot., 123,3294 (1923). 9. Landolt, H. H., and Bornstein, R., Physikalisch-chemische Tabellen,
Berlin, 5th edition (1929). 10. Simms, H. S., J. Gen. Phyeiol., 11,629 (1927-28). 11. Schmidt, C. L. A., Appleman, W. K., and Kirk, P. L., J. Biol. Chem.,
81,723 (1929).
by guest on April 3, 2019
http://ww
w.jbc.org/
Dow
nloaded from

Norman W. Pirie and Kathleen Godwin PinheyGLUTATHIONE
THE TITRATION CURVE OF
1929, 84:321-333.J. Biol. Chem.
http://www.jbc.org/content/84/1/321.citation
Access the most updated version of this article at
Alerts:
When a correction for this article is posted•
When this article is cited•
alerts to choose from all of JBC's e-mailClick here
ml#ref-list-1
http://www.jbc.org/content/84/1/321.citation.full.htaccessed free atThis article cites 0 references, 0 of which can be
by guest on April 3, 2019
http://ww
w.jbc.org/
Dow
nloaded from