The Thomas B. Fordham Institute promotes educational ...
45
Transcript of The Thomas B. Fordham Institute promotes educational ...


The Thomas B. Fordham Institute promotes educational excellence for
every child in America via quality research, analysis, and commentary, as
well as advocacy and exemplary charter school authorizing in Ohio. It is
affiliated with the Thomas B. Fordham Foundation, and this publication is
a joint project of the Foundation and the Institute. For further information,
please visit our website at www.edexcellence.net. The Institute is neither
connected with nor sponsored by Fordham University.
CO
NT
EN
TS
FOREWORD & SUMMARY 4
INTRODUCTION 8
DATA & METHODS 13
RISK FACTORS 24
DISCUSSION 30
APPENDIX A 32
APPENDIX B 33
APPENDIX C 35
APPENDIX D 40
ENDNOTES 41

THREE SIGNS THAT A PROPOSED CHARTER SCHOOL IS AT RISK OF FAILING
It’s well established—by excellent work from the Center for Research on Education Outcomes (CREDO)
and others—that some charter schools do far better than others at educating their students. This
variability has profound implications for the children who attend those schools. Yet painful experience
shows that rebooting or closing a low-performing school is a drawn-out and excruciating process that
often backfires or simply doesn’t happen. But what if we could predict which schools are likely not to
succeed—before they even open their doors? If authorizers had that capability, they could select stronger
schools to launch, thereby protecting children and ultimately leading to a higher-performing charter
sector overall.
This study employs an empirical approach to do just that. Analysts coded charter applications for easy-
to-spot indicators and used them to predict the schools’ academic performance in their first years of
operation.
Authorizers rejected 77 percent of applications from a sample of over 600 applications from four states.
They worked hard at screening those applications, seemingly homing in on a
common set of indicators—“trigger warnings,” if you will—whose presence in
or absence from applications made it more likely that they would reject the
application.
Yet despite the vigorous screening process that authorizers
used to determine which applicants to turn down and which
to entrust with new schools, 30 percent of the approved
applications in this study led to charter schools that performed
poorly during their first years of operation. Given that research has
shown that a school’s early-year performance almost always predicts
its future performance, those weak schools are unlikely to improve.1
Could a different kind of screening process, informed by common risk factors,
have prevented at least some of this school failure? It was surely worth investigating.
We turned to Dr. David Stuit, co-founder of Basis Policy Research and the author of two previous Fordham
Institute reports on school choice. He was joined by lead author Dr. Anna Nicotera, senior associate at
Basis who brings substantial charter school and school choice expertise. Before joining Basis, Anna was
senior director of research at the National Alliance for Public Charter Schools, worked for the National
Center on School Choice at Vanderbilt University, and served as an advisor to the U.S. Department of
Education’s evaluation of the federal Charter Schools Program.
Our Basis colleagues found three risk factors that were present in the approved applications that
also turned out to be significant predictors of future school performance in the initial years:
FOR
EW
OR
D &
SU
MM
AR
Y
4
WHAT IF WE COULD PREDICT WHICH SCHOOLS ARE LIKELY
NOT TO SUCCEED—BEFORE THEY EVEN OPEN THEIR
DOORS?

5THREE SIGNS THAT A PROPOSED CHARTER SCHOOL IS AT RISK OF FAILING
1. Lack of Identified Leadership: Charter applications that propose a self-managed school
without naming its initial school leader.
2. High Risk, Low Dose: Charter applications that propose to serve at-risk pupils but plan to
employ “low dose” academic programs that do not include sufficient academic supports, such
as intensive small-group instruction or individual tutoring.
3. A Child-Centered Curriculum: Charter applications that propose to deploy child-centered,
inquiry-based pedagogies, such as Montessori, Waldorf, Paideia, or experiential programs.
The presence of these risk factors in charter applications significantly boosted the probability that the
school would perform poorly during its first years of operation. When an application displayed two or
more of these risk factors, the probability of low performance rose to 80 percent.
We also learned that the following indicators, among others, made it more likely that authorizers would
reject the application entirely:
■ A lack of evidence that the school will start with a sound financial foundation;
■ No description of how the school will use data to evaluate educators or inform instruction;
■ No discussion of how the school will create and sustain a culture of high expectations; and
■ No plans to hire a management organization to run the school.
Here’s what we make of those findings.
First, authorizers already have multiple elements in mind—though not always consciously—that they use to
screen out applications. The factors named above that are already linked to rejection may well predict low
performance, had the schools displaying them been allowed to open. But since those schools did not open,
we have no way of knowing for sure. Still, the authorizers we studied—and their peers throughout the
country—would probably be wise to continue to view these factors as possible signs of likely school failure
and to act accordingly.
Second, we were somewhat surprised to see that an applicant’s intention to use a child-centered,
inquiry-based instructional model (such as Montessori, Waldorf, or Paideia) made it less likely that the
school would succeed academically in its first years. It’s hard to tell what’s going on here. Some of these
pedagogies, expertly implemented, can surely work well for many children. But they are not intended to
FOR
EW
OR
D &
SU
MM
AR
Y
THREE SIGNS THAT A PROPOSED CHARTER SCHOOL IS AT RISK OF FAILING6
FOR
EW
OR
D &
SU
MM
AR
Y prepare students to shine on the kinds of assessments that are typically used by states and authorizers to
judge school performance—in other words, the same tests that our research team used to judge quality for
purposes of this analysis.
We do not mean to discourage innovation and experimentation with curriculum and pedagogy in the
charter realm going forward. That sector’s mission includes providing families with access to education
programs that might suit their children and that might not otherwise be available to them. Fordham is a
charter authorizer itself (in its home state of Ohio) and we’re keenly aware of the need to balance the risk
that a new school may struggle academically against a charter’s right to autonomy and innovation. Well-
executed versions of inquiry-based education surely have their place in chartering. But the present study
finds that they boost the probability of low performance as conventionally measured.
Third, let’s acknowledge that quality is in the eye of the beholder. Many of these child-centered schools
aren’t “failing” in the eyes of their customers. The parents who choose them may not care if they have low
“value added” on test scores. But authorizers must balance parental satisfaction with the public’s right to
assure that students learn. Schools exist not only to benefit their immediate clients but also to contribute
to the public good: a well-educated society.
Yes, it’s a tricky balance, especially in places where dismally performing district schools have been the
only option for many youngsters. The best we can say to authorizers is to exercise your authority wisely.
Consider the quality of existing options, plus a prospective charter school’s ability to enhance those
options—not only academically, but in other ways fundamental to parents and the public. Pluralism is an
important value for the charter sector, and is worth taking some risk to achieve.
Fourth, these findings aren’t a license for lazy authorizing. Yes, the trio of significant indicators that we
found helps to identify applications that have a high probability of yielding struggling charter schools. But
these aren’t causal relationships. Nor do they obviate an authorizer’s responsibility to carefully evaluate
every element of a charter application. If our results are used to automatically reject or fast-track an
application, they have been misused. Yet they ought, at minimum, to lead to considerably deeper inquiry,
heightened due diligence, and perhaps a requirement for additional information. In short, their proper use
is to enhance an authorizer’s review.
Deciding whether to give the green light to a new school is a weighty decision. Failing to authorize a
potentially successful school for children desperately in need of one is just as bad as authorizing a school
that ultimately fails to educate them. The information herein adds one more tool to authorizers’ toolkits.
May they use it wisely.

7THREE SIGNS THAT A PROPOSED CHARTER SCHOOL IS AT RISK OF FAILING
FOR
EW
OR
D &
SU
MM
AR
Y
ACKNOWLEDGMENTS
This report was made possible through the generous support of the Walton Family Foundation and our
sister organization, the Thomas B. Fordham Foundation. We are especially grateful to authors Anna
Nicotera and David Stuit, who thoughtfully conducted the research and authored this report; to Lori
Ventimiglia and Jeff Johnson (Colorado League of Charter Schools), who kindly provided access to charter
applications from Colorado; to Sy Doan, Lauren Shaw, and Emily Sholtis (Basis Policy Research), who
assisted in coding the applications; and to external reviewer Dr. Ron Zimmer (University of Kentucky), who
provided valuable input on the draft report.
On Fordham’s side, we extend thanks to Chester E. Finn Jr. for thoughtfully reviewing drafts, Kathryn
Mullen Upton for offering an authorizer’s feedback during critical junctures, Alyssa Schwenk for handling
funder and media relations, and Jonathan Lutton, who developed the report’s layout and design. Fordham
interns Chris Rom and Lauren Mason provided administrative assistance. Finally, we thank Shannon Last,
who copyedited the report, as well as Zager of Getty Images from whom elements of our cover originated.
THREE SIGNS THAT A PROPOSED CHARTER SCHOOL IS AT RISK OF FAILING
Over the last two and a half decades, we have witnessed charter schooling evolve from a novel and
controversial policy experiment to a dynamic institution that has gained widespread acceptance among
education reformers, policymakers, and, sometimes, the mainstream public education community. The
growth of this sector has, by and large, been fueled by the compelling principles on which the charter
schooling concept rests: more education options for families, less regulation for schools, and greater
accountability for student results. A 2014 meta-analysis indicated that elementary and middle charter
schools had a small, but statistically significant, positive impact on student mathematics performance.2
More promising has been the research on urban charter schools. In a 2015 study, CREDO found that
students who attended such schools experienced significantly higher levels of academic growth in math
and reading than their counterparts in traditional district schools.3 For low-income African American,
Hispanic, and English language learner students, the difference in performance by attending urban
charter schools can be on the order of twenty-five to seventy-nine additional days of learning per year.4
While many charter schools have demonstrated considerable success, perhaps
the greatest threat to the legitimacy of the charter school movement is the
continuing presence of chronically failing schools. When a charter school
consistently produces sub-par academic results for its students, it is a
sign that the latter half of the “charter school bargain” (better results
in return for more autonomy) is not being met. Failing schools
can have profound political and financial implications, but
the foremost concern is that they harm students.
Charter school authorizers play a critical role in addressing the
problem of chronic charter school failure. There is growing evidence
showing that authorizer practices make a significant difference when
it comes to dealing with struggling charter schools.5 Several professional
guides, such as the National Association of Charter School Authorizers’
(NACSA) Principles & Standards for Charter School Authorizing, draw from the
experiences of authorizers with portfolios of high-performing schools to recommend authorizing practices
that may be linked to improving school quality.6 Such guides typically recommend that authorizers engage
in ongoing monitoring and oversight and that they develop transparent and rigorous procedures for
application, renewal, and revocation decisions.
Since authorizers and authorizing practices can influence charter quality, it’s essential to understand the
tools that authorizers have to deal with failing schools. There are several strategies available to them.
First, authorizers can provide support to struggling charter schools with the goal of improving
them. Across the public education system, school turnaround approaches have been the most
INT
RO
DU
CT
ION
FAILING SCHOOLS CAN HAVE PROFOUND
POLITICAL AND FINANCIAL IMPLICATIONS, BUT THE
FOREMOST CONCERN IS THAT THEY HARM STUDENTS.
8

9THREE SIGNS THAT A PROPOSED CHARTER SCHOOL IS AT RISK OF FAILING
INT
RO
DU
CT
ION
commonly used strategy to improve low-performing schools,7 despite the painful reality that turning
around schools (in any sector) is an incredibly challenging and resource-intensive task, and there are not
many examples of success.8 In a study that examined low-performing charter and district schools over
five years, Stuit found that only 1 percent of them—from either sector—made significant improvements in
performance.9 Research on the effect of School Improvement Grants (SIG) in several states provides mixed
results, with evidence that turnaround efforts improved performance for some schools in California10
and Ohio,11 but had limited success in North Carolina.12 The recently released national study of the SIG
program showed that despite $3 billion being spent on improving low-performing schools, the reform
effort, on average, had no significant impact on math or reading test scores.13
Similarly, the research team at CREDO examined the trajectories of high-, middle-, and low-performing
charter schools after their first years of operation and found that early school performance nearly perfectly
predicted performance in later years. Specifically, the study divided charter schools into quintiles based on
the first available performance measure for new charter schools. The researchers found that 80 percent of
schools in the bottom two quintiles were unable to break out after five years. On the flip side, 94 percent
of new charter schools that were in the top quintiles after the first performance measure remained in the
top category after five years.14 Other studies have shown that average student performance improves
when students attend more mature charter schools, but the CREDO results suggest that charter schools
that struggle in their early years rarely see dramatic improvements in student performance in subsequent
years.15
Second, authorizers can aggressively identify and close failing schools. In 2012, NACSA called for
authorizers to be more proactive in this work, stating, “In some places, accountability has been part of
the charter model in name only. If charters are going to succeed in helping improve public education,
accountability must go from being rhetoric to reality.”16 However, authorizers have been reluctant to
respond. While the total number of charters that close each year has increased,17 the closure rate remained
constant at roughly 3.7 percent between 2011–12 and 2014–15.18
There are a variety of reasons why authorizers have found it difficult to close struggling schools.
Authorizers may not have clearly defined academic, financial, or operational metrics to which they hold
charter schools accountable. Many authorizers fail to regularly collect information or monitor charter
schools in order to make tough decisions—or don’t use the accountability data in those decisions.19 School
closures can be particularly challenging when stakeholders, such as parents and educators, become
invested in struggling schools. Often, families believe that they have made the right school choice decision
and are satisfied with the low-performing school because it is safer or better than the alternative. When
you add to this the challenge that authorizers are more likely to be affluent and white, while the students
served by the schools are poor and minorities,20 closure decisions can turn into politically and emotionally
fraught battles.21 Fifteen states have passed automatic closure policies that require charter schools to close

THREE SIGNS THAT A PROPOSED CHARTER SCHOOL IS AT RISK OF FAILING10
INT
RO
DU
CT
ION
if they do not meet pre-defined performance benchmarks,22 but it’s unclear how much of an impact these
laws have had on weeding out low-performing schools.23 Again, the reality is that charter school closures
are too infrequent to make a significant dent in the number of low-performing charter schools.
Third, the most straightforward strategy, and the focus of this report, is to reduce the number of failing
charter schools by denying them the opportunity to open their doors in the first place. That is, reject the
applications of schools that are unlikely to succeed. Many authorizers already employ well-developed
criteria and procedures by which to review prospective school operators and subsequently reject the
majority of applications that they receive. This report provides them with an additional tool to improve
authorizing decisions. It asks:
■ Is it possible to identify risk factors in the written content of charter applications that signal that
an applicant is unlikely to succeed in operating a quality school?
We define risk factors as easy-to-spot and hard-to-game indicators that increase the likelihood that the
proposed charter school will struggle academically in its first years. Since early success is highly predictive
of strong performance in the future, it is critical to develop and validate tools and procedures that will help
authorizers make better chartering decisions.
We use charter applications as a primary source of data. We coded 639 of them as submitted to thirty
authorizers in Colorado, Indiana, North Carolina, and Texas between 2009–10 and 2014–15. We
combined the coded application data with school performance data in the first year that they were
reported for new charter schools. We then used these data to build a predictive model that identifies
charter school application indicators that point to schools that will struggle academically in their early
years. The analysis suggests that there are three risk factors that authorizers should look out for and
evaluate carefully:
1. Lack of Identified Leadership: Charter applications that propose a self-managed school
without naming a school leader.
2. High Risk, Low Dose: Charter applications that propose to serve at-risk pupils but plan to
employ “low dose” academic programs that do not include sufficient academic supports, such
as intensive small-group instruction or extensive individual tutoring.
3. A Child-Centered Curriculum: Charter applications that propose to deploy child-centered,
inquiry-based pedagogies, such as Montessori, Waldorf, Paideia, or experiential programs.

11THREE SIGNS THAT A PROPOSED CHARTER SCHOOL IS AT RISK OF FAILING
INT
RO
DU
CT
ION
We do not suggest that every applicant that falls into one of these categories will ultimately produce a
charter school that struggles academically in its early years. Our intent is not to stifle innovation in the
charter sector by suggesting that authorizers deny every application with one or more of these risk factors.
Indeed, a major tenet of the theory of charter schools is to encourage innovation, which means that there
may be an optimal amount of school failure to ensure that educators can experiment. Unfortunately, we
do not know what constitutes that optimal failure amount. And it is probably safe to say that the current
number of low-performing charter schools is above optimal, so taking steps to reduce failing schools is
warranted.
We are also mindful of the limitation inherent in any attempt to predict performance on the basis of
applications, as—obviously—we are only able to analyze the performance data for schools whose
applications were approved. Authorizers deny most applications and we have no information on how
students would perform at schools that never started (see The Debate on Authorizers’
Ability to Predict Charter School Quality).
Still and all, the three risk factors we identified are easy-to-spot and hard-to-
game pieces of information found in the written content of applications.
And they are strong predictors of future school performance.
Authorizers can use this information to improve their processes
for reviewing and approving new charter school applications so
they can identify ahead of time those applicants who will likely
struggle to succeed. Specifically, they can use these risk factors to
determine which charter applicants merit more thorough review. Plus, they
will be in a better position to provide additional support to risky candidates
if the proposed charter school is one that the authorizer believes would meet the
needs of students it serves.
In the following pages, we describe the data and methods we used to predict—based on the content of
charter applications alone—whether a proposed school is apt to succeed or struggle in its early years.
For each of the risk factors that emerged, we present the specific finding, discuss what the literature says
about why that risk factor matters, and suggest ways in which an authorizer could address applications
that include the risk factor. Authorizers can use this information to make better decisions, improve charter
school quality, and diminish the risk that unsuccessful schools will open.
OUR INTENT IS NOT TO STIFLE INNOVATION IN
THE CHARTER SECTOR BY SUGGESTING THAT AUTHORIZERS DENY EVERY APPLICATION WITH
ONE OR MORE OF THESE RISK FACTORS.
THREE SIGNS THAT A PROPOSED CHARTER SCHOOL IS AT RISK OF FAILING12
INT
RO
DU
CT
ION
THE DEBATE ON AUTHORIZERS’ ABILITY TO PREDICT
CHARTER SCHOOL QUALITY
Charter applications provide a wealth of data, yet little research to date has systematically analyzed them.
One notable exception is a 2015 report by Douglas N. Harris and Whitney Bross that used information
from 155 applications to the Louisiana Board of Elementary and Secondary Education with applicants
hoping to operate charter schools in Orleans Parish. The report coded ten components common across
the applications and used them to predict approval and renewal decisions, as well as future school
performance.24 It found that a limited number of components were related to approval and renewal
decisions, and only one of the categories coded from the applications predicted schools’ future academic
performance, specifically: planning to partner with a nonprofit organization had a negative influence on
school performance.
After Harris and Bross released their study,25 University of Arkansas professor Jay P. Greene responded
that, because authorizers cannot predict future success, they should not be in the business of preventing
charter schools from opening.26 Nelson Smith, senior advisor to NACSA, responded that authorizers do in
fact have a strong set of resources and procedures by which to assess the quality and prospects of charter
applications.27
Authorizers today approve, on average, just one-third of the charter applications that they receive.28 The
majority of authorizers employ rigorous and transparent application review criteria to identify applications
that demonstrate a likely capacity to operate a quality school.29 We do not know how rejected applicants
would have performed if their applications had been approved and they had opened schools, but it is likely
that authorizers are preventing many poor-performing schools from opening. Of course, there will always
be some “false negatives”—i.e., prospective schools that are denied at the application stage but that
might have worked well for students. Others get denied due to practical concerns that could be addressed
through policy, such as assured access to unused district facilities.30 Perhaps more worrisome, from a
quality control standpoint, are “false positives”—i.e., schools that get approved on the basis of seemingly
strong applications but that end up serving children poorly.
Results from such studies should not be used to discourage authorizers from carefully evaluating every
element of a charter application. Rather, they should be used to enhance rigorous review of charter
applications and to reduce the number of both false positives and false negatives in determining which
prospective schools should launch.
THREE SIGNS THAT A PROPOSED CHARTER SCHOOL IS AT RISK OF FAILING
DA
TA
& M
ET
HO
DS
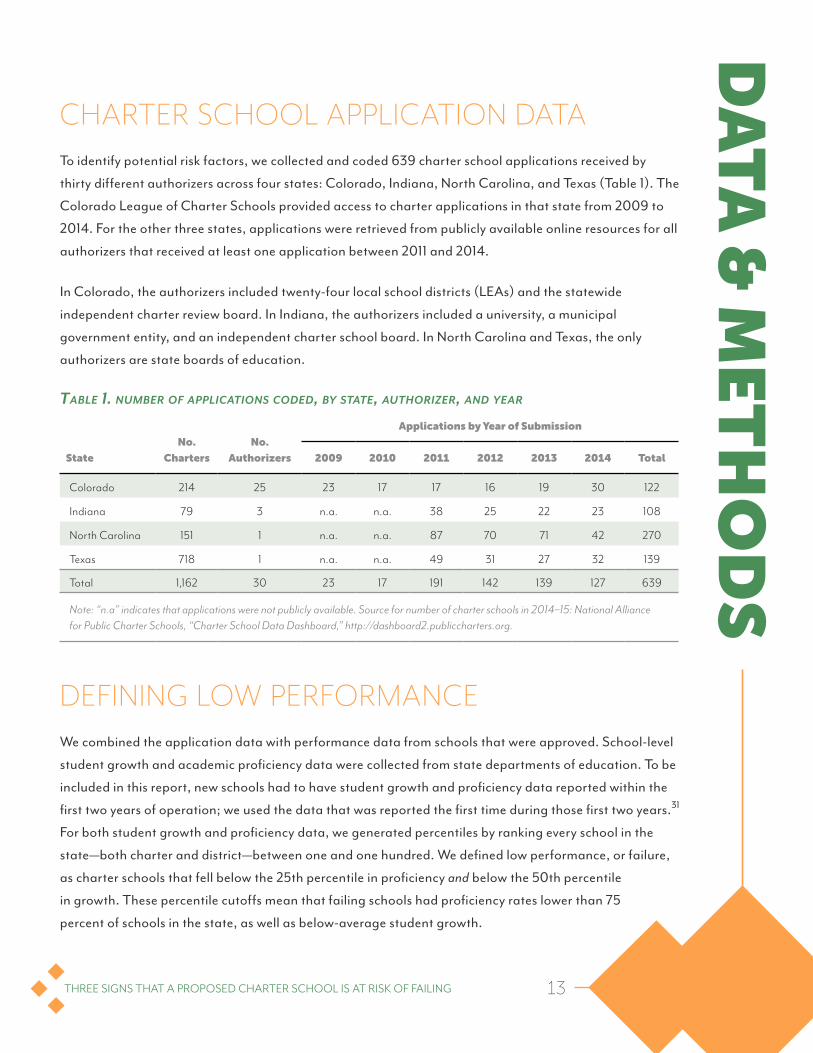
CHARTER SCHOOL APPLICATION DATATo identify potential risk factors, we collected and coded 639 charter school applications received by
thirty different authorizers across four states: Colorado, Indiana, North Carolina, and Texas (Table 1). The
Colorado League of Charter Schools provided access to charter applications in that state from 2009 to
2014. For the other three states, applications were retrieved from publicly available online resources for all
authorizers that received at least one application between 2011 and 2014.
In Colorado, the authorizers included twenty-four local school districts (LEAs) and the statewide
independent charter review board. In Indiana, the authorizers included a university, a municipal
government entity, and an independent charter school board. In North Carolina and Texas, the only
authorizers are state boards of education.
Table 1. number of applicaTions coded, by sTaTe, auThorizer, and year
State
No.
Charters
No.
Authorizers
Applications by Year of Submission
2009 2010 2011 2012 2013 2014 Total
Colorado 214 25 23 17 17 16 19 30 122
Indiana 79 3 n.a. n.a. 38 25 22 23 108
North Carolina 151 1 n.a. n.a. 87 70 71 42 270
Texas 718 1 n.a. n.a. 49 31 27 32 139
Total 1,162 30 23 17 191 142 139 127 639
Note: “n.a” indicates that applications were not publicly available. Source for number of charter schools in 2014–15: National Alliance for Public Charter Schools, “Charter School Data Dashboard,” http://dashboard2.publiccharters.org.
DEFINING LOW PERFORMANCEWe combined the application data with performance data from schools that were approved. School-level
student growth and academic proficiency data were collected from state departments of education. To be
included in this report, new schools had to have student growth and proficiency data reported within the
first two years of operation; we used the data that was reported the first time during those first two years.31
For both student growth and proficiency data, we generated percentiles by ranking every school in the
state—both charter and district—between one and one hundred. We defined low performance, or failure,
as charter schools that fell below the 25th percentile in proficiency and below the 50th percentile
in growth. These percentile cutoffs mean that failing schools had proficiency rates lower than 75
percent of schools in the state, as well as below-average student growth.
13

THREE SIGNS THAT A PROPOSED CHARTER SCHOOL IS AT RISK OF FAILING14
DA
TA
& M
ET
HO
DS
Of the 127 applications that resulted in schools that were approved and opened, thirty-five (28 percent)
were deemed low-performing schools during their first years of operation.
Since our data on new charter schools come from a range of academic years based on when the charter
applicant submitted the application, was approved, and opened the school, our sample size decreases
significantly when we look beyond the first two years of reported data. As a result, we cannot examine
charter performance three, four, or five years after the schools opened. However, we did use the subset of
our sample that had reported data beyond the first year to check if their first year performance predicted
later performance. Schools that we classified as low performing in their first years had a 45 percent
probability of being classified as low performing in their third year of operation. In contrast, for schools
that were not low performing in their first years, the probability of future low performance was just 7
percent.
MISSING DATAAfter collecting and coding 639 applications, we excluded ninety-seven (or 15 percent) from the predictive
model because of missing data (Table 2). First, we excluded thirty-nine applications that proposed
alternative high schools, including dropout prevention programs, credit recovery, and GED completion
programs, as well as programs targeting juvenile offenders. Five of the thirty-nine proposals for alternative
high schools were approved, but we excluded them from the analysis because performance data were
not available by their second year of operation. Second, we excluded seventeen applications that were
approved by authorizers but did not open charter schools. We excluded the schools that never opened,
rather than include them in the count of academic failures. Finally, we excluded forty-one charter
applications that were approved but did not have student growth and proficiency performance data
reported within their first two years of operation. We searched extensively for performance data for
schools that opened and enrolled students, but in these cases we were not able to find such data, typically
because the schools served early grades where state assessments are not administered. Appendix A
provides more detailed information about the excluded applications.
Table 2. applicaTions ThaT were excluded, by sTaTe and reason
State
Alternative
high school
applicants
Approved applicants
that did not open
schools
Approved applicants
with missing test
score data
Total
excluded
Pct.
excluded
Colorado 6 0 14 20 16%
Indiana 13 14 6 33 31%
North Carolina 9 2 19 30 11%
Texas 11 1 2 14 10%
Total 39 17 41 97 15%

15THREE SIGNS THAT A PROPOSED CHARTER SCHOOL IS AT RISK OF FAILING
DA
TA
& M
ET
HO
DS
APPLICATION APPROVAL AND FAILURE RATES Figure 1 provides a visual representation of the applications for each state by year. The orange bars below
the year indicate the number of submitted applications that were rejected by authorizers. Above the year,
the bars indicate the number of approved applications. The approved application bars are broken out by
the number that did not open schools (light green), the number that opened and were not deemed to be
low performing in the first years of operation (green), and the number that opened and were defined as
low performing (light orange). The total of all bars (orange, light orange, green, and light green) indicates
the total number of applications submitted to authorizers by state and year.
The figure also presents the approval and failure rates by state and year, and shows how those rates are
calculated. The approval rate is calculated by dividing the total number of schools approved (the sum of
approved applications that did not open, schools that are not failing, and schools that are failing) by the
total number of applications submitted (the sum of the total number of schools approved and the total
number of schools rejected). The overall approval rates ranged from 11 percent (Texas) to 46 percent
(Colorado).
The failure rate is calculated by dividing the total number of failing schools approved by the total number
of schools approved (sum of approved applications that are not failing and approved applications that are
failing). The overall failure rates ranged from 16 percent (North Carolina) to 31 percent (Texas).
Figure 1 shows that the number of applications submitted, as well as approval and failure rates, varied
across and within states throughout the years included in this report. In Colorado, for example, there was
a steady flow of submitted applications; the approval rate hovered around 50 percent except in two years
where it was high (69 percent in 2012) and low (21 percent in 2013). Overall, 23 percent of the approved
charter schools in Colorado were deemed low performing during their first years of operation.
Of the four states in this report, Indiana experienced the largest number of approved applicants that did
not open their doors to students. Out of ninety-five applications submitted in Indiana, thirty-nine were
approved (41 percent), and twenty-three opened. Of the schools that opened, seven were deemed to be
low performing in their first years of operation (30 percent).
North Carolina’s charter sector experienced the largest increase in new schools during this period. The
state’s sole authorizer, the Office of Charter Schools within the NC Department of Public Instruction,
received 270 applications between 2011 and 2014. Seventy-nine of them were approved (30 percent);
twelve of the schools that opened failed (16 percent). The growth in submitted and approved applications
resulted from changes to state law in 2011 that lifted the cap on the number of charter schools allowed to
operate in the Tar Heel State.

THREE SIGNS THAT A PROPOSED CHARTER SCHOOL IS AT RISK OF FAILING16
DA
TA
& M
ET
HO
DS
Texas had the second-highest number of applications submitted, 129, during the years included in this
report. Due to the cap on the number of charter schools permitted in the state, only fourteen were
approved (11 percent), and of the schools that opened, four failed (31 percent).
figure 1. charTer school applicaTion approval raTes, by sTaTe and year
Colorado Indiana North Carolina Texas
Year 09 10 11 12 13 14 All 11 12 13 14 All 11 12 13 14 All 11 12 13 14 All
Approval
rate43% 47% 53% 69% 21% 46% 46% 44% 52% 25% 40% 41% 35% 36% 18% 31% 30% 11% 14% 13% 7% 11%
Failure
rate11% 14% 44% 27% 25% 15% 23% 63% 0% 25% 13% 30% 21% 23% 8% 0% 16% 25% 50% 33% 0% 31%
17THREE SIGNS THAT A PROPOSED CHARTER SCHOOL IS AT RISK OF FAILING
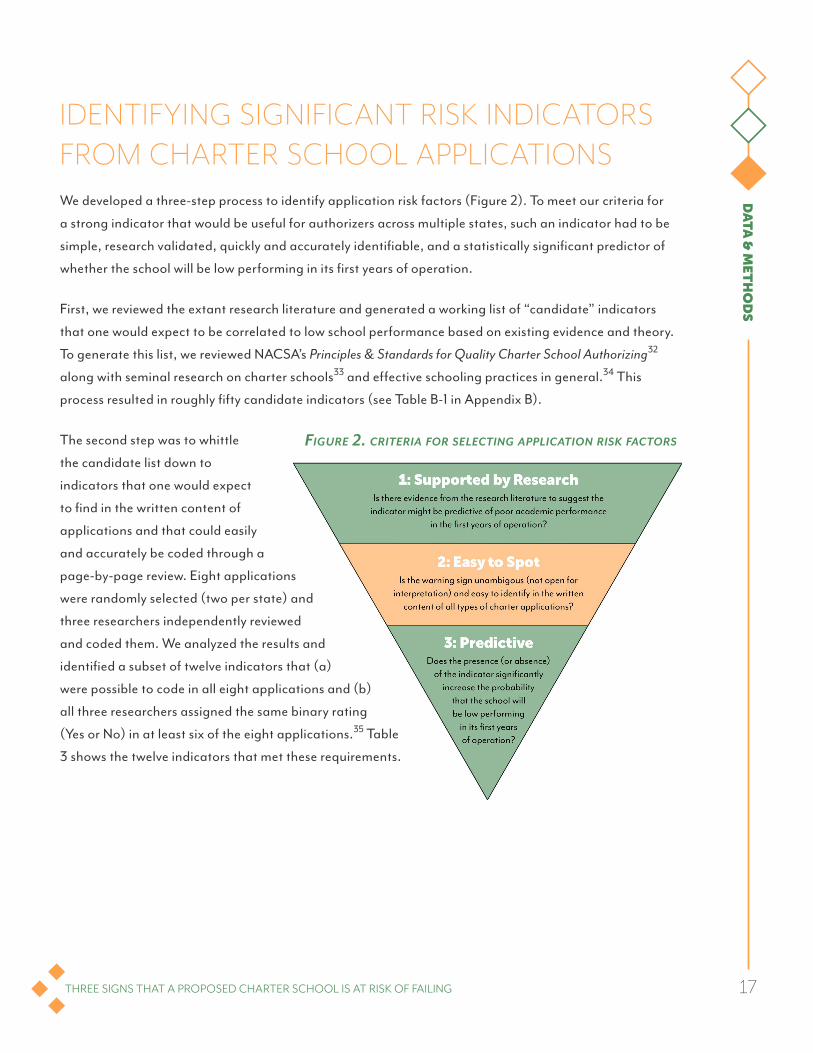
figure 2. criTeria for selecTing applicaTion risk facTors
DA
TA
& M
ET
HO
DS
IDENTIFYING SIGNIFICANT RISK INDICATORS FROM CHARTER SCHOOL APPLICATIONSWe developed a three-step process to identify application risk factors (Figure 2). To meet our criteria for
a strong indicator that would be useful for authorizers across multiple states, such an indicator had to be
simple, research validated, quickly and accurately identifiable, and a statistically significant predictor of
whether the school will be low performing in its first years of operation.
First, we reviewed the extant research literature and generated a working list of “candidate” indicators
that one would expect to be correlated to low school performance based on existing evidence and theory.
To generate this list, we reviewed NACSA’s Principles & Standards for Quality Charter School Authorizing32
along with seminal research on charter schools33 and effective schooling practices in general.34 This
process resulted in roughly fifty candidate indicators (see Table B-1 in Appendix B).
The second step was to whittle
the candidate list down to
indicators that one would expect
to find in the written content of
applications and that could easily
and accurately be coded through a
page-by-page review. Eight applications
were randomly selected (two per state) and
three researchers independently reviewed
and coded them. We analyzed the results and
identified a subset of twelve indicators that (a)
were possible to code in all eight applications and (b)
all three researchers assigned the same binary rating
(Yes or No) in at least six of the eight applications.35 Table
3 shows the twelve indicators that met these requirements.
THREE SIGNS THAT A PROPOSED CHARTER SCHOOL IS AT RISK OF FAILING18
DA
TA
& M
ET
HO
DS
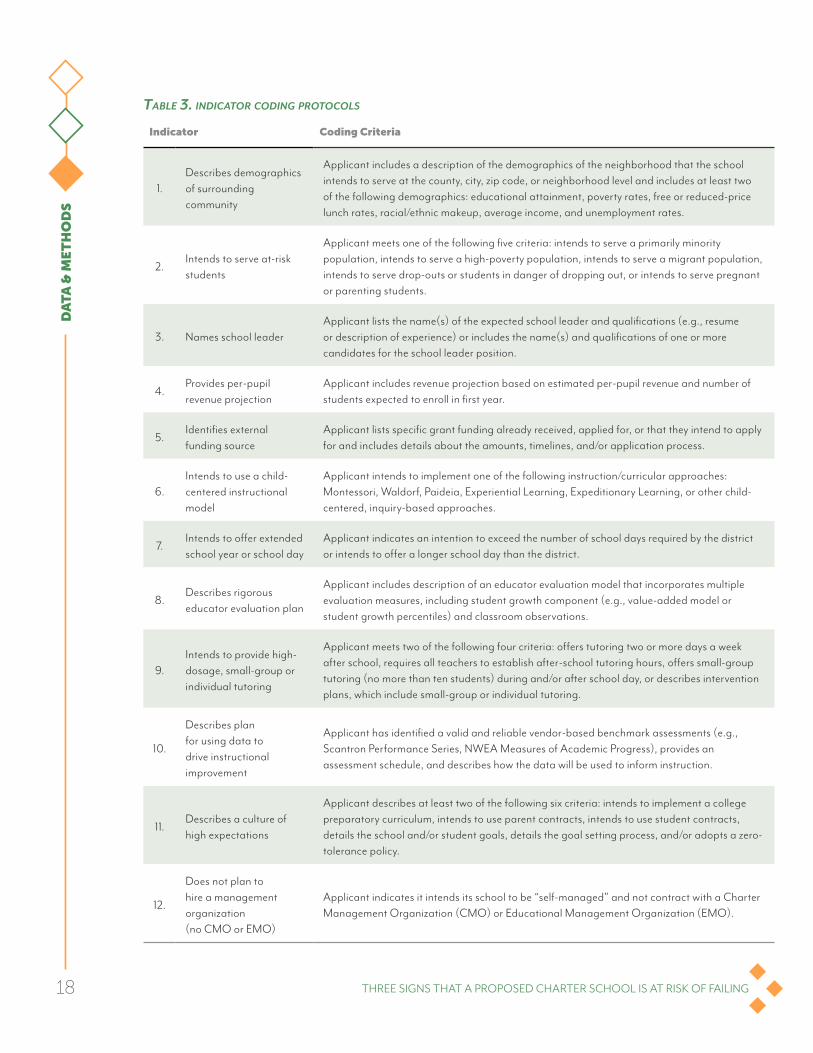
Table 3. indicaTor coding proTocols
Indicator Coding Criteria
1.Describes demographics of surrounding community
Applicant includes a description of the demographics of the neighborhood that the school intends to serve at the county, city, zip code, or neighborhood level and includes at least two of the following demographics: educational attainment, poverty rates, free or reduced-price lunch rates, racial/ethnic makeup, average income, and unemployment rates.
2.Intends to serve at-risk students
Applicant meets one of the following five criteria: intends to serve a primarily minority population, intends to serve a high-poverty population, intends to serve a migrant population, intends to serve drop-outs or students in danger of dropping out, or intends to serve pregnant or parenting students.
3. Names school leader Applicant lists the name(s) of the expected school leader and qualifications (e.g., resume or description of experience) or includes the name(s) and qualifications of one or more candidates for the school leader position.
4.Provides per-pupil revenue projection
Applicant includes revenue projection based on estimated per-pupil revenue and number of students expected to enroll in first year.
5.Identifies external funding source
Applicant lists specific grant funding already received, applied for, or that they intend to apply for and includes details about the amounts, timelines, and/or application process.
6.Intends to use a child-centered instructional model
Applicant intends to implement one of the following instruction/curricular approaches: Montessori, Waldorf, Paideia, Experiential Learning, Expeditionary Learning, or other child-centered, inquiry-based approaches.
7.Intends to offer extended school year or school day
Applicant indicates an intention to exceed the number of school days required by the district or intends to offer a longer school day than the district.
8.Describes rigorous educator evaluation plan
Applicant includes description of an educator evaluation model that incorporates multiple evaluation measures, including student growth component (e.g., value-added model or student growth percentiles) and classroom observations.
9.Intends to provide high-dosage, small-group or individual tutoring
Applicant meets two of the following four criteria: offers tutoring two or more days a week after school, requires all teachers to establish after-school tutoring hours, offers small-group tutoring (no more than ten students) during and/or after school day, or describes intervention plans, which include small-group or individual tutoring.
10.
Describes plan for using data to drive instructional improvement
Applicant has identified a valid and reliable vendor-based benchmark assessments (e.g., Scantron Performance Series, NWEA Measures of Academic Progress), provides an assessment schedule, and describes how the data will be used to inform instruction.
11.Describes a culture of high expectations
Applicant describes at least two of the following six criteria: intends to implement a college preparatory curriculum, intends to use parent contracts, intends to use student contracts, details the school and/or student goals, details the goal setting process, and/or adopts a zero-tolerance policy.
12.
Does not plan to hire a management organization (no CMO or EMO)
Applicant indicates it intends its school to be “self-managed” and not contract with a Charter Management Organization (CMO) or Educational Management Organization (EMO).

19THREE SIGNS THAT A PROPOSED CHARTER SCHOOL IS AT RISK OF FAILING
DA
TA
& M
ET
HO
DS
Table 4 provides descriptive information about the number of applicants that included—or omitted—one
of the final twelve indicators in their charter applications. The table shows that while the twelve final
indicators were present in both rejected and approved applications, there are some differences in the
prevalence. For example, the indicator for whether the application identifies an external funding source is
more prevalent in the rejected applications than those approved (66 percent versus 57 percent). Moreover,
a larger percent of the rejected applications did not plan to offer an extended school day or year (64
percent versus 59 percent), did not describe a rigorous educator evaluation plan (74 percent versus 54
percent), did not intend to offer additional academic support such as tutoring (80 percent versus 66
percent), and did not describe a culture of high expectations (60 percent versus 45 percent).
Table 4. presence of Twelve indicaTors in applicaTions
Indicator
All applications
(n = 542)
Rejected applications
(n = 415)
Approved applications
(n = 127)
1.Does not describe community demographics
204 (38%) 159 (38%) 45 (35%)
2. Intends to serve at-risk students 189 (35%) 139 (33%) 50 (39%)
3. Does not name school leader 368 (68%) 273 (66%) 95 (75%)
4.Does not provide per-pupil revenue projection
91 (17%) 74 (18%) 17 (13%)
5.Does not identify external funding source
347 (64%) 274 (66%) 73 (57%)
6.Intends to use a child-centered instructional model
72 (13%) 53 (13%) 19 (15%)
7.Does not intend to offer extended school day/year
341 (63%) 266 (64%) 75 (59%)
8.Does not describe rigorous educator evaluation plan
375 (69%) 306 (74%) 69 (54%)
9.Does not intend to provide high-dosage, small-group or individual tutoring
416 (77%) 332 (80%) 84 (66%)
10.Does not describe plan for using data to drive instructional improvement
175 (32%) 150 (36%) 25 (20%)
11.Does not describe a culture of high expectations
307 (57%) 250 (60%) 57 (45%)
12. Does not plan to hire a CMO or EMO 423 (78%) 333 (80%) 90 (71%)

THREE SIGNS THAT A PROPOSED CHARTER SCHOOL IS AT RISK OF FAILING20
DA
TA
& M
ET
HO
DS
The third and final step in identifying risk factors was to test whether the twelve final indicators were
statistically significant predictors of whether or not the applicant would have low academic performance
in its first years of operation.36 In addition to testing how well the indicators predicted school performance
on their own, we examined whether certain indicators were stronger predictors of low performance
when used together. For example, we hypothesized that the risk of low performance would be greater for
applicants that intended to serve at-risk students, but did not indicate in their proposals that they had
a plan to offer additional academic support. Appendix C describes in detail the series of statistical tests
involved in the prediction procedure.
One of the twelve final indicators passed the statistical tests, as well as two of the “combination
indicators.” Figure 3 shows the predicted probability that the school would perform poorly in the first years
of operation for the three risk factors for applications that were approved and opened. The orange bars
are the predicted probabilities of low performance for applications where the risk factor was present. The
green bars show the predicted probabilities of low performance for applications without the risk factor.
figure 3. predicTed probabiliTy of low-performance for applicaTions wiTh and wiThouT The Three risk facTors

21THREE SIGNS THAT A PROPOSED CHARTER SCHOOL IS AT RISK OF FAILING
DA
TA
& M
ET
HO
DS
We find that the predicted probability that a charter school will be low performing in its first years of
operation is 51 percent when the approved application proposes opening a standalone charter school
without naming a school leader. The predicted probability of low performance is 60 percent when
the approved application highlights an intention to serve at-risk students without providing sufficient
academic supports. And for applications that propose using a child-centered, inquiry-based instructional
model, the predicted probability of low performance is 57 percent. Moreover, we find that when an
application includes two of these risk factors, the predicted probability that the school will be low
performing rises to roughly 80 percent. For applications that include all three risk factors, the predicted
probability of low performance during the first years of operation is 93 percent.
In the next section we will discuss each of the three risk factors that predict school performance in depth.
But first, let’s examine whether authorizers in our sample were more likely to reject applications based on
the three risk factors or any of the other twelve final indicators.
Ultimately, we found eight indicators (seven of the twelve final indicators and one of the three risk factors)
where the difference between applications with and without the respective indicator was positive and
statistically significant (p-value < 0.10), indicating that applications with these indicators were more likely
to be rejected by authorizers. None of the differences that were negative were statistically significant,
which would suggest that the presence of the indicator would decrease the probability that it was rejected.
(See Table D-1 in Appendix D for the predicted probability for all twelve final indicators and three risk
factors.)
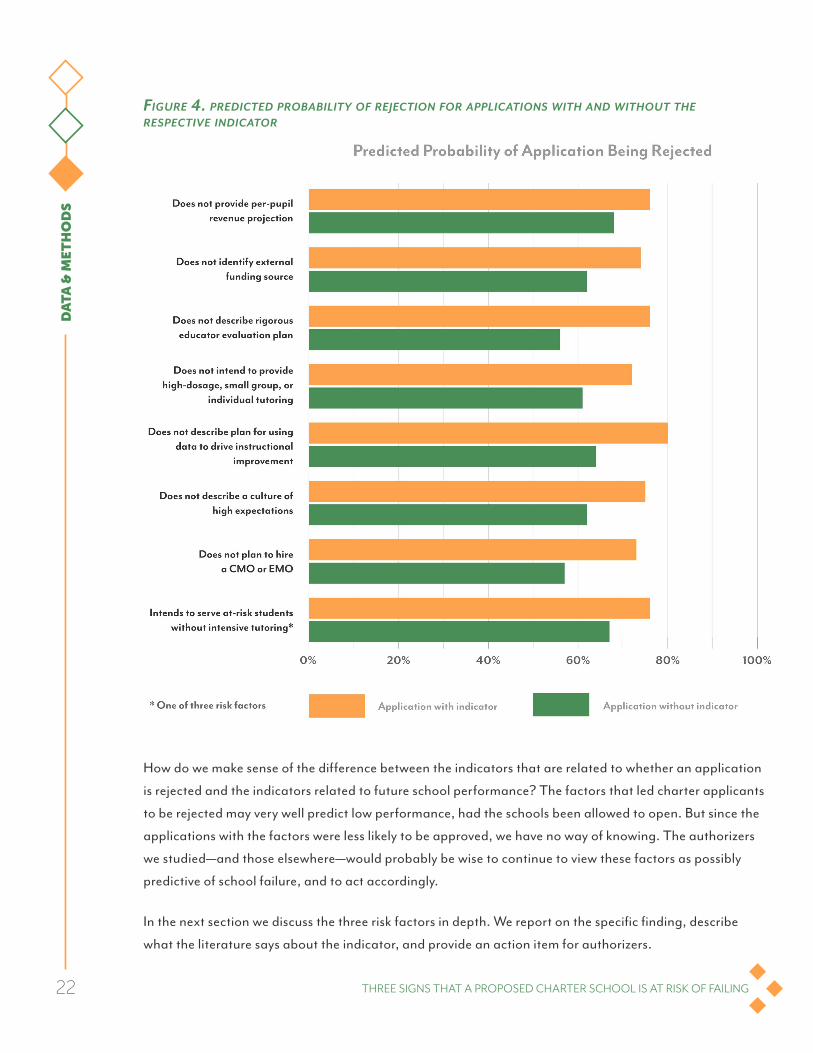
Figure 4 shows the eight significant indicators. It appears that authorizers in this sample were more likely
to reject applications that were unable to demonstrate that the charter school would open with a solid
financial foundation. Specifically, authorizers were more likely to reject applications that did not provide
per-pupil revenue projections (68 percent versus 73 percent) nor identify external funding sources (73
percent versus 62 percent). Authorizers were more likely to reject applications that described neither the
ways in which the charter school would use data to evaluate educators (76 percent versus 56 percent) nor
plans to use data to drive instruction (80 percent versus 64 percent). Applications that neither described
strategies to increase academic support, such as by tutoring (72 percent versus 61 percent), nor outlined a
plan to create a culture of high expectations for students (75 percent versus 62 percent) were more likely to
be rejected by authorizers. Authorizers were also more likely to reject applications that did not plan to hire
a management organization to run the school (73 percent versus 57 percent).
Finally, one of the three risk factors was a significant predictor of whether the authorizer would reject the
application. When applications indicated that they intended to serve high-risk students without additional
academic support, authorizers were more likely to reject them (76 percent versus 67 percent).
THREE SIGNS THAT A PROPOSED CHARTER SCHOOL IS AT RISK OF FAILING22
DA
TA
& M
ET
HO
DS
figure 4. predicTed probabiliTy of rejecTion for applicaTions wiTh and wiThouT The respecTive indicaTor
How do we make sense of the difference between the indicators that are related to whether an application
is rejected and the indicators related to future school performance? The factors that led charter applicants
to be rejected may very well predict low performance, had the schools been allowed to open. But since the
applications with the factors were less likely to be approved, we have no way of knowing. The authorizers
we studied—and those elsewhere—would probably be wise to continue to view these factors as possibly
predictive of school failure, and to act accordingly.
In the next section we discuss the three risk factors in depth. We report on the specific finding, describe
what the literature says about the indicator, and provide an action item for authorizers.

23THREE SIGNS THAT A PROPOSED CHARTER SCHOOL IS AT RISK OF FAILING
DA
TA
& M
ET
HO
DS
LIMITATIONS
This analysis has several limitations. The sample is gleaned from four states during a limited range of
academic years. The four states include thirty authorizers, but the sample is not large enough to parse
differences among types of authorizers. Because of the timing of when applications were submitted,
approved, and schools opened, we were unable to examine school performance beyond the first time that
performance data were reported for new schools, though we show that performance in the first years
correlates with performance in the third year of operation for a subset of schools with those data.
Moreover, the findings do not indicate a causal relationship between the risk factors and future school
performance. Rather, the significant indicators provide information about applications that have a high
probability of producing charter schools that will struggle academically in the first years of operation.
Our assessment of whether new schools will be low performers based on the presence of the risk factors in
their applications does not translate to the probability of academic success should the application exclude
those risk factors. Specifically, our findings provide average predicted probability of low performance
for prospective schools whose charter applications do not include the risk factors; these probabilities are
always much lower than the probabilities of low performance for applications with these risk factors.
Furthermore, we did not use the twelve final indicators to predict whether new charter schools would
be academically successful—measured as high academic growth and proficiency—in the first years of
operation. In our opinion, the indicators are not nuanced enough to determine that their presence in a
charter application demonstrates, without a doubt, that a charter school will succeed. The presence of any
of these indicators should not fast-track the approval of charter applications.
Given these limitations, the findings from this report should be used as a tool to enhance, not replace, the
procedures that authorizers use to evaluate charter applications. The statistically significant risk factors
we identified that predict school performance are simple, easy-to-spot, commonsensical risk factors that
authorizers can use to flag applications for a more thorough review.

THREE SIGNS THAT A PROPOSED CHARTER SCHOOL IS AT RISK OF FAILING
RIS
K F
AC
TO
RS
RISK FACTOR #1: LACK OF IDENTIFIED LEADERSHIPFinding: The first risk factor that an applicant is not ready to succeed in the first years of operation is
when the application for a self-managed charter school does not list the name of the individual who
will lead the school, or name potential candidates.
This risk factor was present in 289 of all 542 applications in the report (53 percent), but it was not related
to whether an authorizer was more likely to reject the application (71 percent versus 68 percent predicted
probability of rejection). However, it significantly increased the probability of low performance for
applicants that were approved and opened. The predicted probability that applicants that did not name a
school leader or provide at least one potential candidate for the position would fail during their first years
of operation was 51 percent.
Interestingly, this finding applies only to self-managed or standalone charter schools. Applications for
new charter schools from existing networks of charter schools, either charter management organizations
(CMOs) or education management organizations (EMOs), could omit the name of a school leader and
the indicator was not a predictor of future school performance.
An effective school leader is critical to the success of a new charter school.
To get a new school operational, the school leader will have to, at
a minimum, manage a budget and make financial decisions,
recruit and hire teachers and staff, engage with families and
communities, recruit students, report to a governing board,
negotiate with the authorizer, secure and manage a facility,
and raise money. These skills are essential to the basic task of
getting a new charter school up and running. However, they are
not necessarily the skills that principals acquire via traditional training
programs because in traditional districts many of these tasks are handled
by the central office rather than at the building level.37
Beyond the important operational tasks a leader of a new charter school is responsible for, the leader must
focus on components associated with student learning in order to create an educational environment that
supports strong academic growth. A meta-analysis conducted by Robinson, Lloyd, and Rowe38 found
that the following school leader practices had a positive impact on student academic outcomes:
establishing goals and expectations; allocating resources to align with instruction; planning,
coordinating, and evaluating teaching and the curriculum; promoting and participating in
teacher learning and development; and ensuring an orderly and supportive environment.
UNLIKE STANDALONE CHARTERS, APPLICATIONS FROM EXISTING CMOS OR
EMOS COULD OMIT THE NAME OF THE SCHOOL
LEADER AND THE INDICATOR WAS NOT A PREDICTOR
OF FUTURE SCHOOL PERFORMANCE.
24

25THREE SIGNS THAT A PROPOSED CHARTER SCHOOL IS AT RISK OF FAILING
RIS
K FA
CT
OR
S
The majority of respondents to a survey of charter school leaders indicated that they take on the sole
responsibility for the long list of operational and instructional responsibilities described above.39 Add
this to the expectation that charter schools will perform at high levels, and there is substantial pressure
to engage an excellent school leader. It is a real challenge to find one individual who possesses all of the
operational and instructional leadership skills to lead with clarity of purpose through the first years of
operation.
Moreover, compared to charter schools in EMO and CMO networks, self-managed schools tend to be
small, independent start-ups. Applications that do not name a school leader are typically developed by
groups of parents or nonprofit organizations that want to open a school with a particular focus. These
independent charter schools may not have access to strong networks through which to recruit school
leaders, and may be limited further in their attempts to find an individual who can fully embrace and
execute the vision of the proposed charter school in the short amount of time between an application
being approved and the opening of the school. EMOs and CMOs, on the other hand, have the ability to
recruit promising deans, assistant principals, and educators from their network of existing schools to lead
new charter schools.
If the charter application does not name a school leader, the school will be at a disadvantage from the
start. The school leadership pipeline is an ongoing challenge for the charter sector, as the proliferation of
new schools continues and existing schools struggle with high rates of turnover in the principal’s office. A
survey of charter leaders found that 71 percent of respondents planned to leave their schools within five
years.40 Many charter networks have taken it upon themselves to grow their own talent to ensure that they
have a pool of competent school leaders for new charter schools.41
ACTION ITEM
An applicant who proposes a self-managed school and has not already identified a school leader
will likely not have extensive resources to find candidates. What can an authorizer do if it finds
this risk factor in a submitted charter application? The most practical guidance is to interview
the board of the proposed school to determine whether there is a realistic and viable plan to hire
an appropriate school leader in a timely fashion to set the school up for success. The Colorado
Department of Education’s charter application and review rubric guide recommends that applicants
include a detailed job description for the school leader position and a narrative that “includes
a detailed and rigorous process to locate, interview and hire the school leader six months to a
year before school opens, and includes a timeline and financial considerations.”42 It would not
be unreasonable for any authorizer to request that an applicant provide similar details so as
to avoid a rocky start to the charter school—or delay approval until a leader is identified.
THREE SIGNS THAT A PROPOSED CHARTER SCHOOL IS AT RISK OF FAILING26
RIS
K F
AC
TO
RS
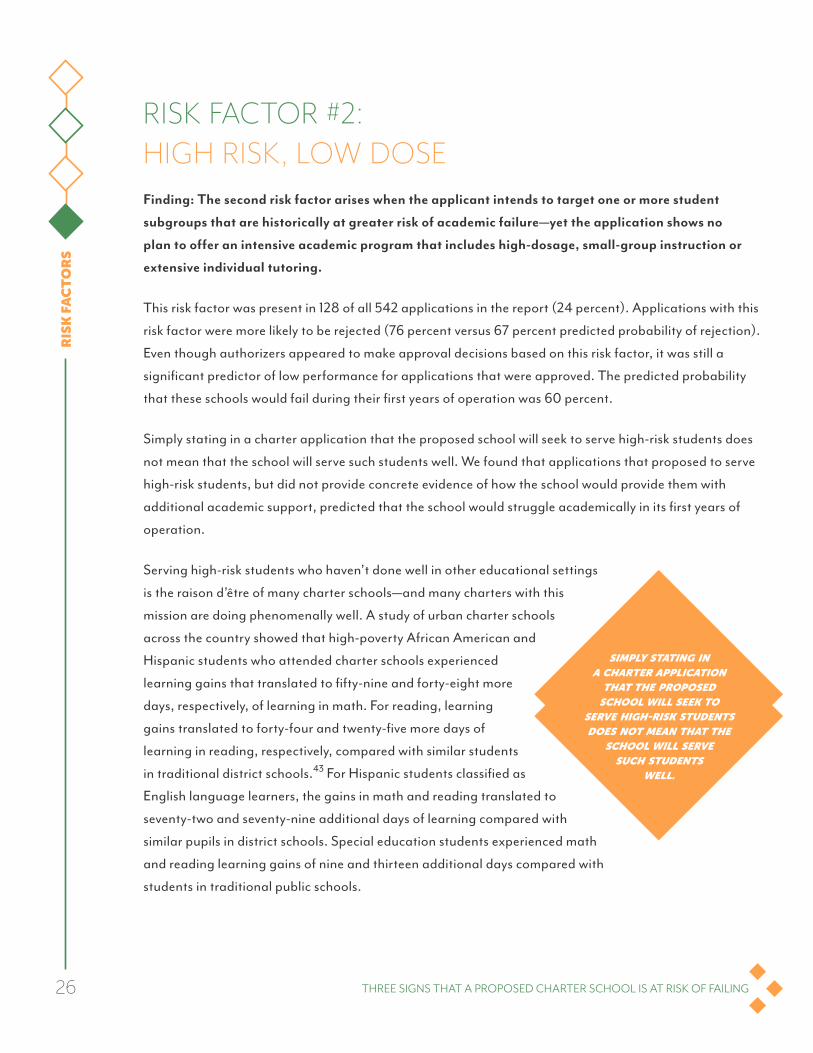
RISK FACTOR #2: HIGH RISK, LOW DOSEFinding: The second risk factor arises when the applicant intends to target one or more student
subgroups that are historically at greater risk of academic failure—yet the application shows no
plan to offer an intensive academic program that includes high-dosage, small-group instruction or
extensive individual tutoring.
This risk factor was present in 128 of all 542 applications in the report (24 percent). Applications with this
risk factor were more likely to be rejected (76 percent versus 67 percent predicted probability of rejection).
Even though authorizers appeared to make approval decisions based on this risk factor, it was still a
significant predictor of low performance for applications that were approved. The predicted probability
that these schools would fail during their first years of operation was 60 percent.
Simply stating in a charter application that the proposed school will seek to serve high-risk students does
not mean that the school will serve such students well. We found that applications that proposed to serve
high-risk students, but did not provide concrete evidence of how the school would provide them with
additional academic support, predicted that the school would struggle academically in its first years of
operation.
Serving high-risk students who haven’t done well in other educational settings
is the raison d’être of many charter schools—and many charters with this
mission are doing phenomenally well. A study of urban charter schools
across the country showed that high-poverty African American and
Hispanic students who attended charter schools experienced
learning gains that translated to fifty-nine and forty-eight more
days, respectively, of learning in math. For reading, learning
gains translated to forty-four and twenty-five more days of
learning in reading, respectively, compared with similar students
in traditional district schools.43 For Hispanic students classified as
English language learners, the gains in math and reading translated to
seventy-two and seventy-nine additional days of learning compared with
similar pupils in district schools. Special education students experienced math
and reading learning gains of nine and thirteen additional days compared with
students in traditional public schools.
SIMPLY STATING IN A CHARTER APPLICATION
THAT THE PROPOSED SCHOOL WILL SEEK TO
SERVE HIGH-RISK STUDENTS DOES NOT MEAN THAT THE
SCHOOL WILL SERVE SUCH STUDENTS
WELL.

27THREE SIGNS THAT A PROPOSED CHARTER SCHOOL IS AT RISK OF FAILING
RIS
K FA
CT
OR
S
A common thread among charter schools that serve high-risk students well is that they offer significant
levels of academic support. For example, charter schools in New York City have demonstrated exceptional
academic results.44 In a study of thirty-nine New York City charter schools, Dobbie and Fryer find that
effective charter schools were more likely to offer high-dosage tutoring, defined as instruction in groups
with six or fewer students that meet four or more times per week.45 Students who attended charter schools
that provided this type of high-dosage, small-group instruction saw significant increases in their reading
performance.
Using information about the instructional practices associated with highly effective charter schools,
Fryer implemented an intervention in Houston public schools that included high-dosage tutoring and
found that tutoring was independently related to increases in students’ mathematics performance.46 In
the Houston high-dosage, small-group tutoring model, the practice was used to remediate students who
were performing below grade level or to provide accelerated instruction for students performing at or
above grade level. By providing differentiated high-dosage tutoring to all students, educators reduced the
negative stigma of “pull-out” tutoring for remediation.47
In Boston, the Match Charter Public Schools have developed a rigorous, high-dosage tutoring program
that is fully integrated into the school day. The tutoring program, called Match Corps, hires full-time tutors
for year-long service opportunity assignments at their schools. The tutors work with two to three students
in small groups every day to address learning gaps and accelerate growth. The tutors receive training
prior to the start of the academic year and professional development throughout the year from teachers at
the schools.48 Research on the Match Corps program suggests that the high-dosage tutoring strategy is
related to increases in high school English language arts results.49
It’s not cheap, however. There can be significant costs associated with increasing academic supports,
like offering intensive, small-group tutoring. The cost can include additional human capital expenses to
hire and train more people to provide additional instructional support, or to provide additional salary or
stipends for staff who commit to longer hours or extra days. And of course there’s a risk of staff burnout.
ACTION ITEM
Authorizers should carefully review applications for charter schools that intend to enroll high-risk
students for evidence that the proposed school will provide students with substantive academic
support if it is in fact to create a learning environment that produces significant learning gains.
The absence of details about how the school will make good use of increased instructional time
or one-on-one support for high-risk students should serve as a warning sign to authorizers that
the proposed school is likely to struggle to achieve its goals during the first years of operation.
THREE SIGNS THAT A PROPOSED CHARTER SCHOOL IS AT RISK OF FAILING28
RIS
K F
AC
TO
RS
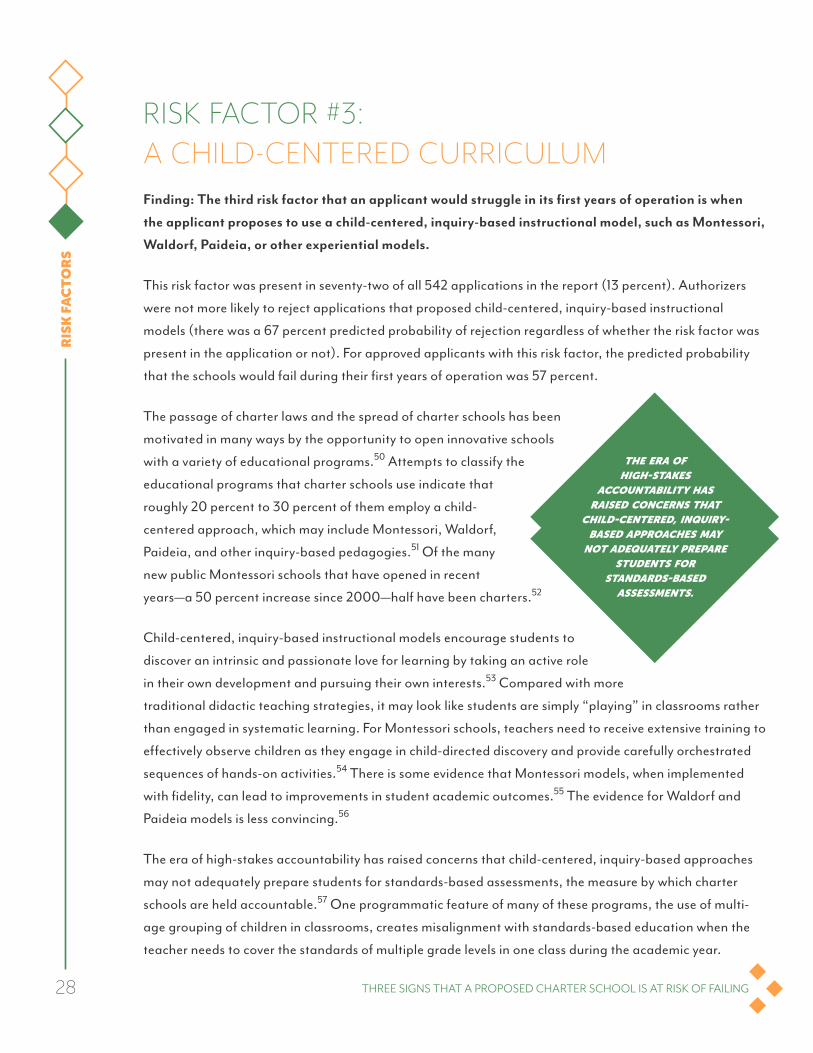
RISK FACTOR #3: A CHILD-CENTERED CURRICULUMFinding: The third risk factor that an applicant would struggle in its first years of operation is when
the applicant proposes to use a child-centered, inquiry-based instructional model, such as Montessori,
Waldorf, Paideia, or other experiential models.
This risk factor was present in seventy-two of all 542 applications in the report (13 percent). Authorizers
were not more likely to reject applications that proposed child-centered, inquiry-based instructional
models (there was a 67 percent predicted probability of rejection regardless of whether the risk factor was
present in the application or not). For approved applicants with this risk factor, the predicted probability
that the schools would fail during their first years of operation was 57 percent.
The passage of charter laws and the spread of charter schools has been
motivated in many ways by the opportunity to open innovative schools
with a variety of educational programs.50 Attempts to classify the
educational programs that charter schools use indicate that
roughly 20 percent to 30 percent of them employ a child-
centered approach, which may include Montessori, Waldorf,
Paideia, and other inquiry-based pedagogies.51 Of the many
new public Montessori schools that have opened in recent
years—a 50 percent increase since 2000—half have been charters.52
Child-centered, inquiry-based instructional models encourage students to
discover an intrinsic and passionate love for learning by taking an active role
in their own development and pursuing their own interests.53 Compared with more
traditional didactic teaching strategies, it may look like students are simply “playing” in classrooms rather
than engaged in systematic learning. For Montessori schools, teachers need to receive extensive training to
effectively observe children as they engage in child-directed discovery and provide carefully orchestrated
sequences of hands-on activities.54 There is some evidence that Montessori models, when implemented
with fidelity, can lead to improvements in student academic outcomes.55 The evidence for Waldorf and
Paideia models is less convincing.56
The era of high-stakes accountability has raised concerns that child-centered, inquiry-based approaches
may not adequately prepare students for standards-based assessments, the measure by which charter
schools are held accountable.57 One programmatic feature of many of these programs, the use of multi-
age grouping of children in classrooms, creates misalignment with standards-based education when the
teacher needs to cover the standards of multiple grade levels in one class during the academic year.
THE ERA OF HIGH-STAKES
ACCOUNTABILITY HAS RAISED CONCERNS THAT
CHILD-CENTERED, INQUIRY-BASED APPROACHES MAY
NOT ADEQUATELY PREPARE STUDENTS FOR
STANDARDS-BASED ASSESSMENTS.

29THREE SIGNS THAT A PROPOSED CHARTER SCHOOL IS AT RISK OF FAILING
RIS
K FA
CT
OR
S
In Waldorf schools, students may not be exposed to early literacy skills until second grade. Standards-
based accountability also makes it challenging for schools to encourage personalized and self-directed
student learning when schools need to cover the content that will be assessed each year. For charter
schools that use child-centered, inquiry-based educational approaches, there is an understanding that
the model has to be adapted to provide curriculum and instruction aligned with the requirements of
state standards and assessments,58 even if these changes to the model limit innovation in educational
approaches.59
ACTION ITEM
When faced with applications for non-traditional educational approaches, authorizers must balance
the risk that such schools will struggle academically with a potential benefit: the autonomy that charter
schools possess to innovate and provide families and students with educational programs that they desire
and may not otherwise be available.60 To mitigate the risk of failure, authorizers should carefully review
applications for child-centered, inquiry-based models to determine if there is evidence that teachers will
be highly trained and that the proposed school has a detailed plan to ensure that grade-level standards
are covered. Additionally, authorizers may want to consider developing rigorous, mission-specific
performance measures in addition to the standards-based measures that demonstrate whether the school
has been successful in fulfilling its pedagogical approach.

THREE SIGNS THAT A PROPOSED CHARTER SCHOOL IS AT RISK OF FAILING
DIS
CU
SS
ION Why does it matter if authorizers approve weak charter school applications? Isn’t the results-based
accountability system designed to weed out low-performing charter schools? In theory, yes—but it can be
extremely difficult to close such schools once they have opened. Careful vetting in the application review
process can help to decrease the number of weak applications that are approved, improving our efforts to
prevent low-performing schools from opening.
Low-performing schools are often the result of a combination of factors, including a culture of low
expectations, an absence of strong leadership, ineffective teaching strategies, uncoordinated curriculum
and standards, inconsistent discipline policies, frequent teacher and school leader turnover, under-
utilization of data to inform instructional practices, and limited parental involvement—just to name a
few. Many of these characteristics have been found to have a direct and negative impact on student
performance.61 Given that there is rarely a single reason why a school struggles, it is difficult to implement
changes that will lead to significant improvements—which is why there have not been many successful
turnarounds of struggling schools.
If low-performing charter schools are unable to make major improvements, they should be closed.
Research from Ohio suggests that students displaced from low-performing schools (both district and
charter) that were closed experienced significant academic gains in their new schools.62 However, the
lengthy political and legal battles—and the moral dilemmas accompanying them—required to close
schools costs time and resources, and authorizers have not shown a proclivity toward closing significant
numbers of struggling charter schools.
In this report, we used an empirical approach to support a third option for ridding the charter sector of
academically struggling schools: prevent failing charter schools from ever opening their doors by rejecting
applications of schools that are unlikely to succeed. Authorizers are already weeding out a significant
number of applicants that are unlikely to produce high-performing charter schools. Of the 542 eligible
applications used in the analyses for this report, authorizers rejected 415, or 77 percent. We found that a
number of our candidate risk indicators were significantly related to authorizers rejecting the application.
Authorizers, at least in this study, appeared to have homed in on a common set of indicators that when
present (or omitted) from applications make it more likely that they will reject the application. These
indicators include a lack of evidence that the school will start with a sound financial foundation, no
description of how the school plans to use data to evaluate educators or differentiate instruction, and no
discussion of how the school will create and sustain a culture of high expectations.
Despite the application screening processes that authorizers employed, we found three risk factors that
were easy to spot in the content of charter school applications and significantly predicted future school
performance among approved applications. The results suggest that authorizers were not paying
sufficient attention to these three risk factors when making approval decisions: applications
30

31THREE SIGNS THAT A PROPOSED CHARTER SCHOOL IS AT RISK OF FAILING
DIS
CU
SS
ION
that proposed a standalone charter school without naming a school leader, planned to serve at-risk
students without providing additional academic supports, or intended to use a child-centered, inquiry-
based pedagogy. When approved applications included two or more of these risk factors, the predicted
probability of the school failing during its first years rose to 80 percent.
Of course, not every charter applicant that fails to name a leader, or that tries to serve
at-risk students without suitable academic supports, or that adopts a child-centered
pedagogy will result in a failing school. Our intent is not to stifle innovation in
the charter sector by suggesting that authorizers deny every application with
one or more of these risk factors. If we want more charter schools like
Venture Academy, Ingenuity Prep, or Summit Public Schools—charters
that are achieving academic success by testing innovative ways to
use time, instructional roles, and technology63—we need to encourage
experimentation, which will lead to some failure. Unfortunately, we do not
know what constitutes the optimal amount of failure. But it is probably safe to say
that the current number of low-performing charter schools is above that amount, and
steps to reduce failing schools are warranted.
Very little research has used charter school applications as a source of data. We were able to obtain
applications from four states where they were publicly available (Indiana, North Carolina, and Texas) or
from a source willing to share them (the Colorado League of Charter Schools). Our findings are limited
by the context of charter school laws and authorizing practices in these states. Analyzing charter school
applications from more states would greatly enhance our understanding of whether there are additional
risk factors in applications that predict school performance.
Still, the risk factors identified in this report are easy to spot ahead of time, but hard to game. Moreover,
they are strong predictors of future school performance. For authorizers overwhelmed by extensive
applications that can run to one hundred pages of content,64 or more, these risk factors provide a good
starting point for flagging applications that need an especially thorough review. For authorizers who
already screen out a large number of applications because of concerns about future school quality, our
data provide empirical insight into the additional risk factors that they should look for.
If an application includes these risk factors, but the authorizer believes that the school meets the needs of
the students it intends to serve, the authorizer should be prepared to provide additional support to ensure
that the school can succeed.
THE RISK FACTORS IDENTIFIED IN THIS
REPORT ARE EASY TO SPOT AHEAD OF TIME, BUT HARD TO GAME.

THREE SIGNS THAT A PROPOSED CHARTER SCHOOL IS AT RISK OF FAILING
AP
PE
ND
IX A EXCLUDED APPLICATIONS
Table a-1. applicaTions ThaT were excluded from The analysis, by reason
State
Total
applications
coded
Applications
used in
analysis
Applications Excluded from Analysis
Alternative
high school
applicants
Approved
applicants
that did not
open schools
Approved
applicants
with missing
test score data
Total
excluded
Pct.
excluded
Colorado
Approved 55 39 2 0 14 16 29%
Rejected 67 63 4 n.a. n.a. 4 6%
Total 122 102 6 0 14 20 16%
Indiana
Approved 41 19 2 14 6 22 54%
Rejected 67 56 11 n.a. n.a. 11 16%
Total 108 75 13 14 6 33 31%
North Carolina
Approved 80 58 1 2 19 22 28%
Rejected 190 182 8 n.a. n.a. 8 4%
Total 270 240 9 2 19 30 11%
Texas
Approved 14 11 0 1 2 3 21%
Rejected 125 114 11 n.a. n.a. 11 9%
Total 139 125 11 1 2 14 10%
Total
Approved 190 127 5 17 41 63 33%
Rejected 449 415 34 n.a. n.a. 34 8%
Total 639 542 39 17 41 97 15%
32

THREE SIGNS THAT A PROPOSED CHARTER SCHOOL IS AT RISK OF FAILING
AP
PE
ND
IX B
Academic Support
Extended school day
Extended school year
Description of high-dosage, small-group tutoring (<10 students)
Culture of high expectations
Plan for Use of Data
Specific vendor assessments
Formative assessment
Plan to use student growth or value-added data
Describes data-driven instruction
Rigorous plan to evaluate teachers and leaders and/or rigorous hiring process
Governance
One or more former K–12 educator(s) on board
One or more financial expert(s) on board
One or more attorney(s) on board
One or more board member(s) with executive experience
School Leadership
School leader named in proposal
First-time school leader
Budget & Finance
Projected number of sections per grade level
Projected number of students per teacher < 15
Projected number of students per teacher > 25
Percent of projected revenue spent on facility > 50%
Planned grade-level expansion after opening
Independent audit by a CPA referenced
Expected per-pupil revenue
External funding source identified
School Characteristics
Intends to serve over 85% FRL
Intends to serve over 35% ELL
Intends to serve over 20% Special Education
Intends to serve at-risk students (e.g., migrants, homeless, foster, drop-out, credit recovery, pregnant or parenting teens, adult students)
Primary School (e.g., K–3, K–4, K–5)
K–8 School
K–12 School
High School
CANDIDATE INDICATORSTable b-1. lisT of candidaTe indicaTors
33

THREE SIGNS THAT A PROPOSED CHARTER SCHOOL IS AT RISK OF FAILING34
AP
PE
ND
IX B
Facilities & Transportaion
Facility or building site identified in proposal
Intend to lease facility
Intend to purchase existing facility
Intend to construct new facility
Intend to co-locate with an existing charter school
Intend to co-locate with an existing traditional public school
Location in non-traditional school facility (e.g., church, strip mall)
Plan for multi-campus charter
Intend to provide busing
Proposed start date less than twelve months from charter approval date
Student Discipline, Expulsion, or Suspension
Parent contract
School uniforms
Zero tolerance behavioral policy in place
School Management
Board intends to contract with management company
Managed by EMO
Managed by CMO
CMO/EMO operates other schools in state
First-time operator
Vision & Mission Statements
Positivity sentiment
Moral imperative sentiment
Strong vs. weak modal sentiment
Table b-1. lisT of candidaTe indicaTors, conTinued

THREE SIGNS THAT A PROPOSED CHARTER SCHOOL IS AT RISK OF FAILING
AP
PE
ND
IX C
ANALYTIC STRATEGY FOR IDENTIFYING SIGNIFICANT PREDICTORS OF LOW PERFORMANCEWe used the following steps to test the predictive value of the twelve final indicators (and identify the
subset) that were robust predictors of low academic performance.
sTep 1: prioriTizing indicaTors
The first step was to assess the predictive power of each of the twelve final indicators when used separately
from the others in the candidate set. These tests are conducted with the univariate logit model, generically
specified as:
Where is the probability the charter school applicant will demonstrate low academic performance
in its first two years of operation (reading and math proficiency in bottom quartile statewide and growth
results below the state average). is the coefficient of interest in this step, as it indicates the effect of the
indicator on the odds of low academic performance. is the constant term, indicating the odds (in
logits) for those applicants that did not have the candidate risk indicator present.
The standard errors of are bootstrapped by drawing 200 random samples, each with ninety-six
applicants (75 percent of the dataset). This approach is designed to estimate of the amount of variance in
the coefficients one could expect if the indicators were applied to other application datasets, such as those
used in the future by authorizers who apply the indicators highlighted in this study. Indicators that vary
significantly in their ability to predict low performance across the 200 random samples will have larger
standard errors and thus higher p-values, which gives them less chance to make it into the optimal subset
of indicators that is built in Step 2.
The results of the univariate logit models are shown in Table C-1. These results are used to inform the
model fitting procedure in Step 2, whereby indicators are entered into the model according to their
p-values (lowest to highest).
35

THREE SIGNS THAT A PROPOSED CHARTER SCHOOL IS AT RISK OF FAILING36
AP
PE
ND
IX C
Table c-1: probabiliTy of low performance, by Twelve final indicaTors
Indicator
Predicted
probability
of low
performance
Difference in predicted probability of low
performance between applications with and
without indicator
Difference Std. err. P>|z|
1. Does not describe community demographics 0.267 -0.047 0.082 0.568
2. Intends to serve at-risk students 0.400 0.169 0.081 0.037
3. Does not name school leader 0.326 0.114 0.068 0.095
4. Does not provide per-pupil revenue projection 0.412 0.132 0.144 0.359
5. Does not identify external funding source 0.233 -0.149 0.086 0.085
6. Intends to use a child-centered instructional model 0.474 0.208 0.140 0.138
7. Does not intend to offer extended school day/year 0.293 -0.009 0.105 0.935
8. Does not describe rigorous educator evaluation plan 0.348 0.111 0.083 0.182
9.Does not intend to provide high-dosage, small group, or individual tutoring
0.286 -0.032 0.075 0.667
10.Does not describe plan for using data to drive instructional improvement
0.280 -0.021 0.109 0.847
11. Does not describe a culture of high expectations 0.333 0.066 0.079 0.406
12. Does not plan to hire a CMO or EMO 0.322 0.085 0.086 0.322
Note: The univariate logit models controlled for the following variables: year, state, number of schools authorizer operated, type of authorizer, number of applicants submitted in the year, flag that application was approved on the first attempt, flag that application plans to open in less than a year, and flag that application was for a replication school.

37THREE SIGNS THAT A PROPOSED CHARTER SCHOOL IS AT RISK OF FAILING
AP
PE
ND
IX C
sTep 2: idenTifying The besT subseT of indicaTors
The second step is to identify the subset of indicators that best predicts low school performance when
used together. A primary objective of this study is to identify a set of risk factors that authorizers can use to
assess whether applicants will struggle in their first two years of operation if awarded a charter. To achieve
this objective, each indicator that is included in the risk assessment must provide new and complementary
information on the likelihood of low performance. Including redundant or uninformative indicators will
reduce the accuracy of the risk predictions and increase the likelihood that authorizers reach the wrong
conclusions about how ready the applicants are to open a successful school.
A hierarchical forward selection procedure is used to identify the optimal subset of indicators.65
This procedure begins by entering the indicator with the lowest p-value from the univariate logit model in
Step 1 into the following multivariate logit model:
Where is a vector of control variables that are expected to confound the relationship between the
candidate indicators and school performance, including binary indicators for first time authorizers,
applicants submitting proposals for the first time (versus having received feedback from the authorizer and
re-submitted), and fixed effects for state and year of application. The same bootstrapping method used
for the univariate models is applied.
In order for the first indicator to be retained it must significantly improve the fit of the model above and
beyond the control variables and any previously entered indicator, as determined by the results of an
incremental likelihood ratio test (p<0.15). If the first indicator significantly improves the model fit, it is
retained in the model and the indicator with next lowest p-value is entered and tested. This procedure
continues until none of the remaining indicators significantly improves the model fit.
After identifying the best subset of indicators, we proceeded to test whether the model fit was improved
by adding interaction terms between select pairs of the retained indicators. The decision to retain an
interaction term was based on the likelihood ratio test (p<-0.10) and a reduction in the Akaike Information
Criterion (AIC) statistic. The best fit model is shown in Table C-2.

THREE SIGNS THAT A PROPOSED CHARTER SCHOOL IS AT RISK OF FAILING38
AP
PE
ND
IX C
Table c-2: besT fiT logiT model
Indicator
Predicted
probability
of low
performance
Difference in predicted probability of low
performance between applications with and
without indicator
Difference Std. err. P>|z|
Intends to serve at-risk students 0.343 0.076 0.106 0.473
Does not intend to provide high-dosage, small group, or individual tutoring
0.303 0.016 0.077 0.834
Intends to serve at-risk students without high-dosage, small group, or individual tutoring
0.599 0.297 0.136 0.029
Does not name school leader 0.264 -0.195 0.162 0.228
Does not plan to hire a CMO/EMO 0.250 -0.252 0.146 0.084
Does not name school leader and does not plan to hire a CMO/EMO
0.506 0.439 0.105 0.000
Intends to use a child-centered instructional model
0.566 0.313 0.112 0.005
Note: Model controls for state, year, first-time application submitted, and first-time authorizer.
No. obs 127
LR chi 34.03
Prob > chi2 0.003
Pseudo R2 0.2186
Log likelihood -60.8314

39THREE SIGNS THAT A PROPOSED CHARTER SCHOOL IS AT RISK OF FAILING
AP
PE
ND
IX C
Table c-3: accuracy sTaTisTics of risk facTors (no conTrols)
Indicator
True Positive
Rate
False Positive
Rate
Pct. Correctly
Classified
Positive
Predictive Value
Intends to use a child-centered instructional model
24% 11% 70% 47%
Does not name a school leader or plan to hire a CMO/EMO
76% 47% 60% 41%
Intends to serve at-risk students and does not plan to provide high-dosage, small group, or individual tutoring
34% 12% 72% 54%
Any two or more of the risk factors 40% 8% 77% 68%
True Positive Rate The percent of low-performing schools flagged by the risk factor
False Positive Rate The percent of non-low-performing schools flagged by the risk factor (false alarms)
Pct. Correctly Classified The percent of all schools that are correctly classified by the risk factor
Positive Predictive Value The probability a school will be low performing if it is flagged by the risk factor

THREE SIGNS THAT A PROPOSED CHARTER SCHOOL IS AT RISK OF FAILING
AP
PE
ND
IX D INDICATORS RELATED TO REJECTION OF APPLICATIONS
Table d-1. probabiliTy of applicaTion being rejecTed, by Twelve final indicaTors and Three risk facTors
Predicted
probability
of rejection
Difference in predicted probability of
rejection between applications with and
without indicator
Difference Std. err. P>|z|
Indicator
1. Does not describe community demographics 0.726 0.054 0.041 0.192
2. Intends to serve at-risk students 0.662 -0.046 0.041 0.261
3. Does not name school leader 0.671 -0.065 0.041 0.109
4. Does not provide per-pupil revenue projection 0.763 0.085 0.047 0.073
5. Does not identify external funding source 0.737 0.118 0.045 0.009
6. Intends to use a child-centered instructional model 0.679 -0.014 0.051 0.785
7. Does not intend to offer extended school day/year 0.711 0.052 0.041 0.203
8. Does not describe rigorous educator evaluation plan 0.756 0.197 0.043 0.000
9.Does not intend to provide high-dosage, small group, or individual tutoring
0.716 0.105 0.045 0.018
10.Does not describe plan for using data to drive instructional improvement
0.802 0.160 0.036 0.000
11. Does not describe a culture of high expectations 0.753 0.137 0.040 0.001
12. Does not plan to hire a CMO or EMO 0.732 0.166 0.042 0.000
Risk Factors
1.Does not name school leader and does not plan to hire a CMO/EMO
0.709 0.034 0.037 0.368
2.Intends to serve at-risk students without high-dosage, small group, or individual tutoring
0.756 0.082 0.046 0.076
3. Intends to use a child-centered instructional model 0.679 -0.014 0.051 0.785
Note: The table presents results from univariate logit models that controlled for the following variables: year, state, number of schools authorizer operated, type of authorizer, number of applicants submitted in the year, flag that application was approved on the first attempt, flag that application plans to open in less than a year, and flag that application was for a replication school.
40

THREE SIGNS THAT A PROPOSED CHARTER SCHOOL IS AT RISK OF FAILING
EN
DN
OT
ES
1. Center for Research on Education Outcomes (CREDO), Urban Charter School Study Report on 41 Regions: 2015 (Stanford,
CA: CREDO, 2015), https://urbancharters.stanford.edu/download/Urban%20Charter%20School%20Study%20Report%20on%2041%20Regions.pdf.
2. J. Betts and Y. E. Tang, A Meta-analysis of the Literature on the Effect of Charter Schools on Student Achievement (Bothell, WA: Center on Reinventing Public Education (CRPE), University of Washington at Bothell, 2014), http://www.crpe.org/sites/default/files/CRPE_meta-analysis_charter-schools-effect-student-achievement_workingpaper.pdf.
3. CREDO, Urban Charter School Study Report.
4. Ibid.
5. Emerging research suggests that variations in authorizer types, and implicitly in authorizer practices, are related to different student outcomes. In a study of Minnesota authorizers, Carlson, Lavery, and Witte were unable to detect a direct link between authorizer type and charter school performance, but they found that there was significantly more variation in the quality of charter schools within an authorizer’s portfolio when the authorizer was a nonprofit entity. See D. Carlson et al., “Charter School Governance and Student Outcomes,” Economics of Education Review 31, no. 2 (2012): 254–267. Also, in a study of Ohio authorizers, Zimmer, Gill, Attridge, and Obenauf found a link between authorizer type and school quality—more specifically, that the performance of charter schools was likely to be lower if the authorizer was a nonprofit authorizer compared with a local school district. See R. Zimmer et al., “Charter School Authorizers and Student Achievement,” Education Finance and Policy 9, no. 1 (2014): 59–85.
6. National Association of Charter School Authorizers (NACSA), Principles & Standards for Quality Charter School Authorizing (Chicago, IL: NACSA, 2015), http://www.qualitycharters.org/wp-content/uploads/2015/08/Principles-and-Standards_2015-Edition.pdf; US Department of Education, Supporting Charter School Excellence through Quality Authorizing (Washington, D.C.: US Department of Education, Office of Innovation and Improvement, 2007), https://www2.ed.gov/nclb/choice/charter/authorizing/authorizing.pdf; Annenberg Institute for School Reform, Public Accountability for Charter Schools: Standards and Policy Recommendations for Effective Oversight (Providence, RI: Annenberg Institute for School Reform at Brown University, 2014), http://annenberginstitute.org/sites/default/files/CharterAccountabilityStds.pdf.
7. There is not one type of school improvement, or turnaround, approach. The No Child Left Behind Act of 2001 outlined five restructuring options: turnarounds (defined as replacing school staff and leadership), converting to a charter school (for traditional district schools), contracting with a management organization, state takeover, and other. In 2010, the US Department of Education funded School Improvement Grants for “persistently low-performing” schools and required that grantees employ one of three approaches: transformation, turnaround, or restart. In general, school improvement strategies target the following areas: school leadership, teacher recruitment and development, instruction, and culture. See Center on School Turnaround, Four Domains for Rapid School Improvement: A Systems Framework (San Francisco, CA: WestEd, 2017), http://centeronschoolturnaround.org/wp-content/uploads/2017/02/CST_Four-Domains-Framework-Final.pdf.
8. A. Smarick, “The Turnaround Fallacy,” Education Next 10, no. 1 (Winter 2010), http://educationnext.org/the-turnaround-fallacy/; C. Meyers and M. Smylie, “Five Myths of School Turnaround Policy and Practice,” Leadership and Policy in Schools (2016): 1–22.
9. D. Stuit, Are Bad Schools Immortal? The Scarcity of Turnarounds and Shutdowns in Both Charter and District Sectors (Washington, D.C.: Thomas B. Fordham Institute, 2010), https://edex.s3-us-west-2.amazonaws.com/publication/pdfs/Fordham_Immortal_10.pdf.
10. T. Dee, School Turnarounds: Evidence from the 2009 Stimulus, Working Paper 17990 (Cambridge, MA: National Bureau of Economic Research, 2012), http://www.nber.org/papers/w17990; and K. Strunk et al., “The Impact of Turnaround Reform on Student Outcomes: Evidence and Insights from the Los Angeles Unified School District,” Education Finance and Policy 11, no. 3 (2016): 251–282.
11. D. Player and V. Katz, “Assessing School Turnaround: Evidence from Ohio,” Elementary School Journal 116, no. 4 (2016): 675–698.
41

THREE SIGNS THAT A PROPOSED CHARTER SCHOOL IS AT RISK OF FAILING42
EN
DN
OT
ES
12. J. Heissel and H. Ladd, School Turnaround in North Carolina: A Regression Discontinuity Analysis, Working Paper No. 156 (Washington, D.C.: National Center for Analysis of Longitudinal Data in Education Research (CALDER), 2016), http://www.caldercenter.org/sites/default/files/WP%20156.pdf.
13. L. Dragoset et al., School Improvement Grants: Implementation and Effectiveness (NCEE 2017-4013) (Washington, D.C.: U.S. Department of Education, National Center for Education Evaluation and Regional Assistance (NCEE), Institute of Education Sciences, 2017), https://ies.ed.gov/ncee/pubs/20174013/pdf/20174013.pdf.
14. CREDO, Charter School Growth and Replication: Volume I (Stanford, CA: CREDO, 2013), http://credo.stanford.edu/pdfs/CGAR%20Growth%20Volume%20I.pdf.
15. There are a couple of studies that examine whether there is a difference in student performance in new charter schools compared with more mature schools. In contrast with the 2013 CREDO results, these studies find more positive performance results for average students who attended charter schools that have operated for three or more years. Sass examined students who attended charters in Florida between 2000 and 2003 and found that schools open for five or more years demonstrated higher student performance than traditional public schools. See T. Sass, “Charter Schools and Student Achievement in Florida,” Education Finance and Policy 1, no. 1 (2006): 91–122. Booker and his team examined charter schools in Texas between 1995 and 2002. The researchers reported charter effects in a matrix format by age of the charter and year of the student in the school. The trajectory of performance for average students shows that they experience a negative performance bump in the first year in a new charter, but their performance increases in the second and third years. See K. Booker et al., “The Impact of Charter School Attendance on Student Performance,” Journal of Public Economics 91, no. 5–6 (2007): 849–876. These studies differ from the CREDO study because they use a student-fixed effects methodology to examine average student performance by the age of the charter school. This type of study design allows them to compare the performance of students who move from traditional public schools to charter schools with students who stay in traditional public schools, controlling for selection bias. However, this means that the results are generalizable to students who move and do not provide the complete story about how the charter schools perform in an accountability framework. The CREDO study, on the other hand, examines the performance level of charter schools in their first years of operation and whether the schools break out of that level after several years, a closer proxy for assessing whether low-performing charter schools will meet the accountability requirements of their contracts with authorizers.
16. NACSA, A Call for Quality: National Charter School Authorizers Group Says More Failing Schools Must Close for Reform to Fully Succeed [press release] (Chicago, IL: NACSA, 2012), http://www.qualitycharters.org/wp-content/uploads/2015/08/2012.11.28-Final_OML_Press_Materials.pdf.
17. The total number of charter schools that closed each year has increased: 153 in 2008–09, 167 in 2009–10, 174 in 2010–11, 182 in 2011–12, 206 in 2012–13, and 223 in 2013–14. See National Alliance for Public Charter Schools, Charter School Data Dashboard, http://dashboard.publiccharters.org/.
18. NACSA, State of Charter Authorizing: 2015 Report (Chicago, IL: NACSA, 2016), http://www.qualitycharters.org/research-policies/archive/state-of-charter-authorizing-2015/.
19. L. Anderson and K. Finnigan, Charter School Authorizers and Charter School Accountability (Paper presented at the Annual Meeting of the American Education Research Association) (Seattle, WA: April 2001), http://files.eric.ed.gov/fulltext/ED455585.pdf; L. Bierlein Palmer and R. Gau, Charter School Authorizing: Are Schools Making the Grade? (Washington, D.C.: Thomas B. Fordham Institute, 2003), https://edex.s3-us-west-2.amazonaws.com/publication/pdfs/CharterAuthorizing_FullReport_10.pdf; K. Bulkley, “Educational Performance and Charter School Authorizers: The Accountability Bind,” Education Policy Analysis Archives 9, no. 37 (2001), http://epaa.asu.edu/ojs/article/view/366; F. Hess, “Whaddya Mean You Want to Close My School?: The Politics of Regulatory Accountability in Charter Schooling,” Education and Urban Society 33, no. 2 (2001): 141–156; M. Paino et al., “For Grades or Money? Charter School Failure in North Carolina,” Educational Administration Quarterly 50, no. 3 (2014): 500–536; S. Vegari, “Charter School Authorizers, Public Agents for Holding Charter Schools Accountable,” Education and Urban Society 33, no. 2 (2001): 129–140.
20. K. Rausch, Authorizer Survey on Diversity, Equity, and Inclusion (Chicago, IL: NACSA, 2016), http://www.qualitycharters.org/research-policies/archive/authorizer-diversity-survey-results/.
43THREE SIGNS THAT A PROPOSED CHARTER SCHOOL IS AT RISK OF FAILING
EN
DN
OT
ES
21. B. Hassel and M. Batdorff, High Stakes: Findings from a National Study of Life-or-Death Decisions by Charter School Authorizers (Chapel Hill, NC: Public Impact, 2004), http://publicimpact.com/high-stakes/the-high-stakes-study-design/; J. Kowal and B. Hassel, Closing Troubled Schools (Bothell, WA: CRPE, 2008), http://www.crpe.org/sites/default/files/wp_ncsrp8_closingtrouble_apr08_0.pdf; A. Rotherham, “The Pros and Cons of Charter Closures,” in R. Lake and P. T. Hill (Eds.), Hopes, Fears, & Reality: A Balanced Look at American Charter Schools in 2005 (Seattle, WA: National Charter School Research Project), http://www.crpe.org/sites/default/files/pub_ch4_hfr05_dec05_0.pdf, 43–52; L. Steiner, Tough Decision: Closing Persistently Low-Performing Schools (Lincoln, IL: Center on Innovation and Improvement, 2009), http://www.centerii.org/survey/downloads/Tough_Decisions.pdf.
22. T. Ziebarth, Automatic Closure of Low-Performing Public Charter Schools (Washington, D.C.: National Alliance for Public Charter Schools, 2015), http://www.publiccharters.org/publications/automatic-closure-low-performing-charter-schools/.
23. J. O’Leary, “Ohio’s Charter School Closure Law is Becoming Irrelevant, and That’s a Good Thing,” Ohio Gadfly Daily, December 7, 2015, https://edexcellence.net/articles/ohio%E2%80%99s-charter-school-closure-law-is-becoming-irrelevant-and-that%E2%80%99s-a-good-thing.
24. W. Bross and D. Harris, The Ultimate Choice: How Charter Authorizers Approve and Renew Schools in Post-Katrina New Orleans (New Orleans, LA: Education Research Alliance for New Orleans, Tulane University, 2016), http://educationresearchalliancenola.org/files/publications/The-Ultimate-Choice-How-Charter-Authorizers-Approve-and-Renew-Schools-in-Post-Katrina-New Orleans.pdf.
25. Ibid.
26. J. Greene, “You Can’t Regulate Quality If You Can’t Predict Quality,” Education Next, November 30, 2016, http://educationnext.org/you-cant-regulate-quality-if-you-cant-predict-quality/.
27. N. Smith, “Authorizing Matters,” Education Next, December 16, 2016, http://educationnext.org/authorizing-matters/.
28. NACSA, State of Charter Authorizing: 2015 Report.
29. Ibid.
30. N. Smith, “Whose School Buildings Are They, Anyway? Making Public School Facilities Available to Charters,” Education Next 12, no. 4 (Fall 2012), http://educationnext.org/whose-school-buildings-are-they-anyway/.
31. We used the first year that the new charter school had both growth and proficiency data. There were new schools that reported growth data in the first year of operation, likely because the state was able to calculate student growth for students who attended a previous school.
32. NACSA, Principles & Standards for Quality Charter School Authorizing.
33. J. Angrist et al., “Stand and Deliver: Effects of Boston’s Charter High Schools on College Preparation, Entry, and Choice,” Journal of Labor Economics 34, no. 2 (2016): 275–318, R. Fryer, Jr., Learning from the Successes and Failures of Charter Schools (Washington, D.C.: The Hamilton Project, 2012), http://scholar.harvard.edu/files/fryer/files/hamilton_project_paper_2012.pdf; R. Lake et al., The National Study of Charter Management Organization (CMO) Effectiveness: Report on Interim Findings (Bothell, WA: CRPE, 2010), http://www.crpe.org/sites/default/files/pub_ncsrp_cmo_jun10_2_0.pdf.
34. D. Levine and L. Lezotte, Unusually Effective Schools: A Review and Analysis of Research and Practice (Madison, WI: National Center for Effective Schools, 1990); M. Zigarelli, “An Empirical Test of Conclusions from Effective Schools Research,” Journal of Educational Research 90 no. 2 (1996): 103–110.
35. Inter-rater agreement rate >= 75 percent
THREE SIGNS THAT A PROPOSED CHARTER SCHOOL IS AT RISK OF FAILING44
EN
DN
OT
ES
36. Low performance, or failure, is measured as charter schools that fell below the 25th percentile in proficiency and below the 50th percentile in growth. We used the first year that the new school had both growth and proficiency data. For the subset of schools where we had data beyond the first two years of operation, we checked to see if performance in the first years predicted later performance and it did.
37. C. Campbell and B. Gross, Working Without a Safety Net: How Charter School Leaders Can Best Survive on the High Wire (Bothell, WA: CRPE, 2008), http://www.crpe.org/sites/default/files/ICS_Highwire_Inside_Sep08_0.pdf; C. Campbell and B. Grubb, Closing the Skill Gap: New Options for Charter School Leadership Development (Bothell, WA: CRPE, University of Washington at Bothell, 2008), http://www.crpe.org/sites/default/files/pub_ncsrp_icslead_aug14_0.pdf.
38. V. Robinson et al., “The Impact of Leadership on Student Outcomes: An Analysis of the Differential Effects of Leadership Types,” Educational Administration Quarterly 44, no. 5 (2008): 635–674.
39. B. Gross and K. Pochop, Leadership to Date, Leadership Tomorrow: A Review of Data on Charter School Directors (Bothell, WA: CRPE, June 2007), http://www.crpe.org/sites/default/files/wp_ncsrp2_ics_jun07_0.pdf.
40. C. Campbell, You’re Leaving? Succession and Sustainability in Charter Schools (Bothell, WA: CRPE, November 2010), http://www.crpe.org/sites/default/files/pub_ICS_Succession_Nov10_web_0.pdf.
41. In 2010, the US Department of Education granted the KIPP Foundation an Investing in Innovation (i3) scale-up grant with a goal of training one thousand leaders, each of whom would open a new KIPP school, assume the leadership of an existing school, or start on the path to school leadership in the KIPP network. C. Tuttle et al., Understanding the Effect of KIPP as it Scales, Volume I: Impacts on Achievement and Other Outcomes: Final Report of KIPP’s Investing in Innovation Grant Evaluation (Washington, D.C.: Mathematica Policy Research, September 27, 2015), http://www.kipp.org/wp-content/uploads/2016/09/kipp_scale-up_vol1-1.pdf.
42. Colorado Department of Education (CDE), Colorado Charter School Standard Application Guidebook and Review Rubric (Denver, CO: CDE, June 2015), http://www.cde.state.co.us/cdechart/standardapplicationguidebookrubric2015pdf.
43. CREDO, Urban Charter School Study Report on 41 Regions: 2015.
44. C. Hoxby and S. Murarka, Charter Schools in New York City: Who Enrolls and How They Affect Their Students’ Achievement, Working Paper 14852 (Cambridge, MA: National Bureau of Economic Research, April 2009), http://www.nber.org/papers/w14852.pdf.
45. W. Dobbie and R. Fryer, Jr., “Getting Beneath the Veil of Effective Schools: Evidence from New York City,” American Economic Journal: Applied Economics 5, no. 4 (2013): 28–60.
46. R. Fryer, Jr., “Injecting Charter School Best Practices into Traditional Public Schools: Evidence from Field Experiments,” Quarterly Journal of Economics 129, no. 3 (2014): 1355–1407.
47. Ibid.
48. C. Candal, “Match Corps Goes National: Successful High-Dosage Tutoring Model Spreads to Other Schools,” Education Next, February 6, 2015, http://educationnext.org/match-corps-goes-national/.
49. M. Kraft, How to Make Additional Time Matter: Integrating Individualized Tutorials into an Extended Day (Cambridge, MA: Harvard Graduate School of Education, April 2013), http://scholar.harvard.edu/files/mkraft/files/kraft_-_how_to_make_additional_time_matter.pdf.
50. C. Finn et al., Charter Schools in Action: Renewing Public Education (Princeton, NJ: Princeton University Press, 2010).
51. D. Carpenter, Playing to Type? Mapping the Charter School Landscape (Washington, D.C.: Thomas B. Fordham Institute, May 2006), https://edexcellence.net/publications/playingtotype.html; National Alliance for Public Charter Schools, Instructional Delivery and Focus of Public Charter Schools: Results from the NAPCS National Charter School Survey, School Year 2011–2012 (Washington, D.C.: NAPCS, June 2013), http://www.publiccharters.org/publications/instructional-delivery-focus-public-charter-schools-results-napcs-national-charter-school-survey-school-year-2011-2012/.

45THREE SIGNS THAT A PROPOSED CHARTER SCHOOL IS AT RISK OF FAILING
EN
DN
OT
ES
52. National Center for Montessori in the Public Sector, Growth of Montessori in the Public Sector: 1975–2014, (Washington, D.C.: National Center for Montessori in the Public Sector, 2014), http://www.public-montessori.org/growth-public-montessori-united-states-1975-2014; S. Sparks, “In Charter School Era, Montessori Model Flourishes,” Education Week, May 26, 2016, http://www.edweek.org/ew/articles/2016/05/26/in-charter-school-era-montessori-model-flourishes.html.
53. C. Edwards, “Three Approaches from Europe: Waldorf, Montessori, and Reggio Emilia,” Early Childhood Research & Practice 4, no. 1 (2002).
54. J. Cossentino, “Ritualizing Expertise: A Non-Montessorian View of the Montessori Method,” American Journal of Education 111, no. 2 (2007): 211–244.
55. K. Dohrmann et al., “High School Outcomes for Students in a Public Montessori Program,” Journal of Research in Childhood Education 22, no. 2 (2007): 205–217; A. Lillard and N. Else-Quest, “The Early Years: Evaluating Montessori Education,” Science 313, no. 5795 (2007): 1893–1894.
56. A. Larrison et al., “Twenty Years and Counting: a Look at Waldorf in the Public Sector Using Online Sources,” Current Issues in Education 15, no. 3 (2012).
57. L. Jacobson, “Taming Montessori,” Education Week, March 13, 2007, http://www.edweek.org/ew/articles/2007/03/14/27montessori.h26.html?qs=Taming+Montessori; J. Turner, “Charter Schools and Montessori: Double Bind—or Double Bonus?” Montessori Life 14, no. 3 (2002): 34–39.
58. C. Sullins and G. Miron, Challenges of Starting and Operating Charter Schools: A Multicase Study (Kalamazoo, MI: The Evaluation Center, Western Michigan University, March 2005), http://files.eric.ed.gov/fulltext/ED486071.pdf.
59. C. Lubienski, “Innovation in Education Markets: Theory and Evidence on the Impact of Competition and Choice in Charter Schools,” American Educational Research Journal 40, no. 2 (2003): 395–443.
60. R. Lake, “In the Eye of the Beholder: Charter Schools and Innovation,” Journal of School Choice 2, no. 2 (2008): 115–127.
61. M. Ronfeldt et al., “How Teacher Turnover Harms Student Achievement,” American Educational Research Journal 50, no. 1 (2013): 4–36.
62. D. Carlson and S. Lavertu, School Closures and Student Achievement: An Analysis of Ohio’s Urban District and Charter Schools (Washington, D.C.: Thomas B. Fordham Institute, April 2015), http://edex.s3-us-west-2.amazonaws.com/publication/pdfs/School%20Closures%20and%20Student%20Achievement%20Report%20website%20final.pdf.
63. S. Ellison and G. Locke, Breakthroughs in Time, Talent, and Technology: Next Generation Learning Models in Public Charter Schools (Washington, D.C.: NAPCS, 2014), http://www.publiccharters.org/wp-content/uploads/2014/09/NAPCS-NextGen-Report-DIGITAL.pdf.
64. M. McShane et al., Measuring the Burden of Charter School Applications (Washington, D.C.: American Enterprise Institute, May 2015), https://www.aei.org/wp-content/uploads/2015/05/Paperwork-Pileup-final.pdf.
65. Multicollinearity among indicators was checked prior to executing the forward selection procedure by calculating the Variance Inflation Factor (VIF) and Tolerance statistics for each indicator; all indicators had VIFs below 1.5 and Tolerances above 0.75, indicating multicollinearity is not expected to be a problem.